Which Fault Threatens Me Most? Bridging the Gap Between Geologic Data-Providers and Seismic Risk Practitioners
 Oona Scotti1*
  Francesco Visini2
  Joanna Faure Walker3
  Laura Peruzza4
  Bruno Pace5
  Lucilla Benedetti6
  Paolo Boncio5
  Gerald Roberts7
- 1Bureau d’Evaluation des Risques Sismiques pour la Sûreté des Installations, IRSN, Fontenay-aux-Roses, France
- 2INGV - Istituto Nazionale di Geofisica e Vulcanologia, Pisa, Italy
- 3UCL IRDR, University College London, London, United Kingdom
- 4National Institute of Oceanography and Applied Geophysics - OGS, Sgonico, Italy
- 5DiSPUTer Department, Università degli Studi G. d’Annunzio Chieti e Pescara, Chieti, Italy
- 6Aix-Marseille Université, Centre européen de recherche et d’enseignement de géosciences de l’environnement CEREGE) CNRS-IRD UMR 34, Aix en Provence, France
- 7Department of Earth and Planetary Sciences, Birkbeck College, London, United Kingdom
The aim of the Fault2SHA European Seismological Commission Working Group Central Apennines laboratory is to enhance the use of geological data in fault-based seismic hazard and risk assessment and to promote synergies between data providers (earthquake geologists), end-users and decision-makers. Here we use the Fault2SHA Central Apennines Database where geologic data are provided in the form of characterized fault traces, grouped into faults and main faults, with individual slip rate estimates. The proposed methodology first derives slip rate profiles for each main fault. Main faults are then divided into distinct sections of length comparable to the seismogenic depth to allow consideration of variable slip rates and the exploration of multi-fault ruptures in the computations. The methodology further allows exploration of epistemic uncertainties documented in the database (e.g., main fault definition, slip rates) as well as additional parameters required to characterize the seismogenic potential of fault sources (e.g., 3D fault geometries). To illustrate the power of the methodology, in this paper we consider only one branch of the uncertainties affecting each step of the computation procedure. The resulting hazard and typological risk maps allow both data providers and end-users 1) to visualize the faults that threaten specific localities the most, 2) to appreciate the density of observations used for the computation of slip rate profiles, and 3) interrogate the degree of confidence on the fault parameters documented in the database (activity and location certainty). Finally, closing the loop, the methodology highlights priorities for future geological investigations in terms of where improvements in the density of data within the database would lead to the greatest decreases in epistemic uncertainties in the hazard and risk calculations. Key to this new generation of fault-based seismic hazard and risk methodology are the user-friendly open source codes provided with this publication, documenting, step-by-step, the link between the geological database and the relative contribution of each section to seismic hazard and risk at specific localities.
Introduction
Computing and communicating seismic hazard and risk based on faults has remained a long-standing challenge. Ideally it requires: 1) recognition of which faults are active (or not) and characterizing their seismic potential; 2) developing models (physical or statistical) and algorithms for assessing seismic hazard that can consider all the available data; 3) representing and communicating the results to geologists, geophysicists, seismologists, risk management professionals and practitioners, governments, and the at-risk population.
In 2016, the Fault2SHA working group was established within the European Seismological Commission ESC (fault2sha.net; Scotti and Peruzza, 2016; Pace et al., 2018) in the attempt to develop the next generation of fault-based PSHA founded on three pillars: 1) novel methodologies that can lead to informative, community-participated fault databases 2) shared open-source codes that allow creating alternative fault models and multi-fault ruptures in collaboration with the data providers; 3) fault-based PSHA linking the database and the outcomes.
In regions with high levels of tectonic activity such as California (Haller et al., 2004), Turkey (Emre et al., 2018), Japan (Active fault database of Japan, https://gbank.gsj.jp/activefault/index_e_gmap.htm) and New Zealand (Lichfield et al., 2014) great advances in seismic hazard assessments have been made thanks to the building of “community-participated fault databases.” On the contrary, in Europe, where the tectonic environment and data collection procedures are not uniform, such “community” efforts to trace the available geological information for use in seismic hazard are slowly emerging. A first effort in Europe is that of the European Database of Seismogenic Faults (EDSF, Basili et al., 2013), a collation of regional information with the aim of providing a list of already interpreted seismogenic sources deemed to be capable of generating earthquakes of magnitude equal to or larger than Mw 5.5, including blind fault sources. The advantage of EDSF is that it provides a useful tracking of the literature supporting the definition of each seismic source, and it ensures a common reference input to assess ground-shaking hazard in the Euro-Mediterranean area. The disadvantages are that the criteria used to define seismic sources, the conceptual frame of what a “fault source” is and the level of information in EDSF are not uniform. Most of all, tracing data and uncertainties used to build the sources is not readily accessible to the end-users.
To fill in this knowledge gap in the community it is fundamental to first build geological databases that are easily accessible to end users. The Fault2SHA effort thus focused on building community databases at the scale of two test areas (laboratories), one representative of transpressive tectonics in the Betic of Spain (Gómez-Novell et al., 2020) and the other representative of normal faulting tectonics in the Central Apennines of Italy (see Fault2SHA Central Apennines Laboratory (CA-Lab) database, 1 Faure Walker et al., 2020). To ensure the coherence between the database content and PSHA modelling, the CA-Lab brought together researchers across multiple institutions comprising field geologists, seismic hazard modellers and practitioners.
The detailed geological data available in the database prompted us to develop a new methodology that can account for slip rate variability and the occurrence of multi fault ruptures. In this paper we present this new generation of fault-based models aimed at obtaining a high spatial resolution of hazard and risk assessment. We also propose novel schemes for the disaggregation of hazard and risk in fault-based approaches that we believe will improve the link between data providers and end-users.
Figure 1 shows a summary of the 4-step methodology that allows visualizing seismic hazard and risk assessment results at specific localities and at the same time visualize the data that was extracted from the Fault2SHA database and used to build the fault model. Each step involves user choices that are briefly summarized in the flowchart, to remind readers that results are conditioned on the choices made. In this methodological paper, only a few choices are discussed to illustrate their impact. A complete exploration of the uncertainties involved in computing seismic hazard and risk assessment is beyond the scope of this paper.
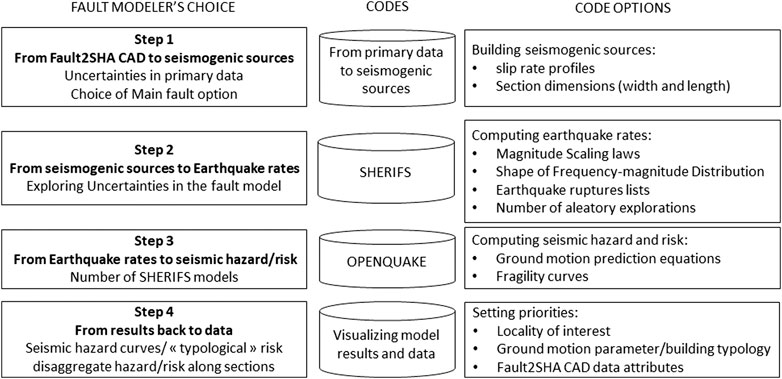
FIGURE 1. Step-by-step methodology proposed in this paper with a synthetic summary of the choices users can explore with the codes provided in the supplementary material.
Finally, we provide in a GitHub repository (https://github.com/fault2shaESCWG/CentralApenninesLabFAULT2RISK), the data from the Fault2SHA Central Apennines Database (Fault2SHA CAD) which are used in this paper, and the codes used to parametrize slip rate profiles, building multi-fault ruptures and visualizing hazard and risk results. In Supplementary Table S1 we provide a short summary for each Matlab code that needs to be run to use directly the Fault2SHA CAD contents for computing a seismic risk output.
Region of Study
Central Apennines: Seismotectonic Context and Earthquake Catalog
The region of study is located in the central Apennines, Italy, where 2–3 mm/year extension across the chain (D’Agostino et al., 2011) is accommodated by the NW-SE trending system of normal faults (Figure 2A). Estimates of earthquake rates based on the CPTI15 earthquake catalogue (Rovida et al., 2019; Rovida et al., 2020) and completeness periods (Meletti et al., 2019) indicate a mean recurrence time of M ≥ 6.0 events of 40–60 years (Figure 2B). Re-located earthquake catalogs of L'Aquila and Amatrice–Visso–Norcia sequences indicate a seismogenic depth between 8 and 12 km (Pizzi et al., 2017).
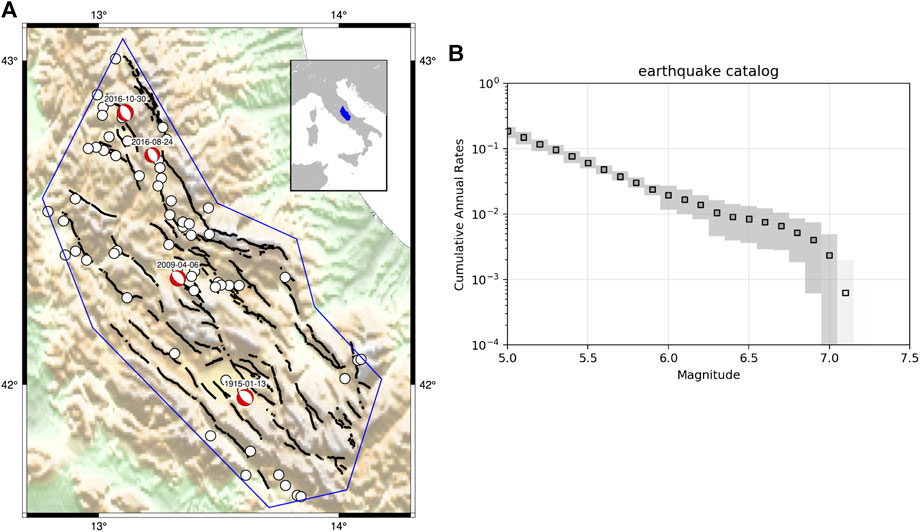
FIGURE 2. (A) The study region of the Fault2SHA Central Apennines laboratory. White circles are Mw five and above earthquakes extracted from the CPTI15 earthquake catalogue, solid black lines are the traces of active normal faults extracted from the Fault2SHA CAD, and focal mechanism are for the Mw six and above earthquakes occurred in the last century. (B) Earthquake rates based on the CPTI15 and the completeness periods of Meletti et al. (2019) reported in Table 1. The grey patches are the 16th and 84th percentiles of the distribution for the rates computed from individual Monte Carlo samples accounting for uncertainties in earthquake magnitude and completeness periods.
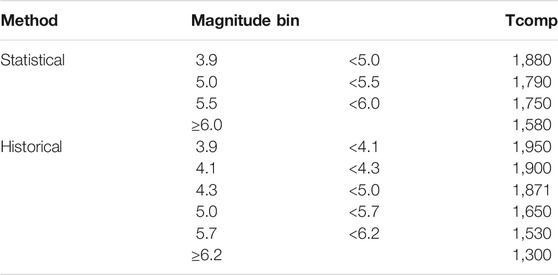
TABLE 1. Completeness periods from Meletti et al. (2019), based on historical and statistical methods, considered here with equal weights (Tcomp = starting date of the completeness period; end date 2015).
The Fault2SHA Central Apennines Database
The Central Apennines Lab has delivered the Fault2SHA Central Apennines Database (See https://doi.org/10.1594/PANGAEA.922582, Faure Walker et al., 2020). It was developed so as to provide a resource for hazard and risk modellers. The details in and design of the database facilitates seismic hazard uncertainty calculations in three ways. First, the Fault2SHA CAD provides four levels of fault activity and four levels of location certainty accompanied by the geological and geomorphic criteria that led to these designations, thus the levels and data that led to their assignment can be traced back to the observations made (Faure Walker et al., 2020). Second, the database provides three levels of fault mapping: 1) Traces (Figure 3A), along with the observations made that lead to determination of the trace location scale and trace activity scale, are presented at the scale that primary observations are made so there is transparency for the modeller and end-user regarding which observations have led to the location and activity scale designation. 2) Faults (Figure 3B) represent how the traces are connected at the surface and/or at depth. 3) Main Faults (Figure 3C), the inferred structures that guide the construction of seismogenic sources. The main faults map represents surface interpretations of fault connections at depth, based on continuation of surface geometry, total offsets profiles, surface slip vectors convergence, and consideration of rupturing during contemporary, historical and paleo earthquakes (the interpretation shown in Figure 3C is the one used in this paper, see Supplementary Figure S1 in Supplementary Material for additional options). Third, the Fault2SHA CAD includes primary slip-rate data, i.e. direct measurements from the field with the locations and methods used for inferring both the displacement and time periods over which the slip-rates are calculated together with uncertainties in these and reference to the papers where the data were originally published. The point locations for the slip-rates allow modellers to infer slip-rate profiles along a fault and uncertainties in these. The time periods and reference to methodologies allow the end-users to see what methods and assumptions have been made in inferring slip-rates and hence hazard and risk modellers can show the path between primary data and slip-rate inputs in the modelling. The offsets were calculated through construction of topographic scarp profiles (using direct in situ measurements of slope angles, LIDAR scanning or digital elevation models). The majority of offsets (72%) were measured directly across the scarps. Some sites (5%) have dates of the fault scarps constrained at the measurement sites using cosmogenic Cl exposure dating, while the remaining sites have dates inferred from regional constraints (see Roberts and Michetti, 2004, for a review of evidence for ages). Some main faults do not have slip-rates constrained in the database and hence further study is needed along these. Main faults that have no slip rate data were not considered in the hazard calculations in this paper.
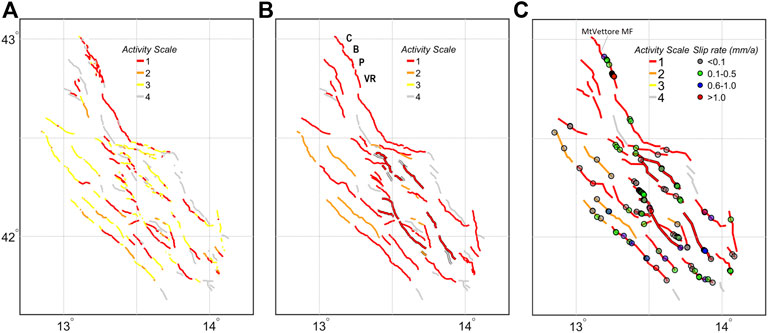
FIGURE 3. (A) Traces, (B) faults and (C) main faults (A1B1C1-MF option, see section 3.1) extracted from the Fault2SHA CAD (Faure Walker et al. 2020) color-coded following the activity scale class. Debated Main faults in (C) and corresponding faults involved in (B) are shown with black borders. Slip rate measurement points (C) are color-coded following slip rate classes. The five individual fault labelled in (B): Cupi-C. Ussita, MtBove-B. MtPorche-P and VettorettoRedentore-VR are an example of the original data used to construct the MtVettore-MF shown in (C).
From Fault2SHA CAD to Seismicity Rates Using Multi-Fault Ruptures
In the following, we illustrate the step-by-step methodology of how data from the Fault2SHA CAD is used to build slip rate profiles, define main fault sections, parametrize deformation models, compute multi-fault rupture scenarios and evaluate seismicity rates.
Fault2SHA CAD: Point Measurements and Main Faults
Points of measurement are represented by geologic and/or topographic offset and age at specific sites. The Fault2SHA CAD provides slip rate uncertainties based on the age of the offset, the error in the vertical offset and in the dip angle if converting vertical offset into the orientation of the plunge, i.e. the slip orientation. In this work, we recalculate slip rates based only on errors of slip value (preferred, minimum and maximum) and the preferred age provided in the database. Here we consider a time period of 15 kyrs (Last Glacial Maximum) to estimate the slip rates for all sections, with the exception of the Pizzalto slip rate data point for which 3 kyrs was considered (oldest age of the fault scarp, Tesson et al., 2016).
We assume that the geological slip rate of faults estimated at the surface can be used to estimate the overall deformation rate accommodated by earthquakes in the fault system. This is the more cautious end-member hypothesis: accounting for the aseismic component of the tectonic deformation process (e.g. Field et al., 2013) that could potentially affect individual faults will be the object of future work.
As regards the main faults, the database documents two options for each of the three main faults (see Supplementary Figure S1 in Supplementary Material for alternatives and Supplementary Table S2 for the full list of faults affected by alternative main fault definitions). For simplicity, the analysis presented herein is done on one of the main fault option configurations, namely the A1B1C1 scenario.
A full hazard and risk analysis should account for the uncertainty in the main fault option choices, which is beyond the scope of this methodological paper. We used main faults with at least one slip-rate measurement resulting in the use of 31 of the 43 main faults within the A1B1C1 Main Fault option configuration.
In some instances, a main fault trace can locally deviate from the individual fault traces that comprise it. Due to this, some slip rate measurements may not appear to lie exactly on the main fault trace. In the present paper we exclude slip rate data points located at more than 500 m from main fault traces.
Defining 3D Main Fault Sections
Building on previous work (Chartier et al., 2017; Chartier et al., 2019; Valentini et al., 2017; Valentini et al., 2020; Visini et al., 2020), we model seismicity rates using multi-fault ruptures, based on the SHERIFS method by Chartier et al. (2017). To implement SHERIFS, we need to build a deformation model, defining the space of plausible parameters for dip, slip rates, main fault traces and various lists of earthquake rupture scenarios. For the purpose of this paper, we limit the exploration of epistemic uncertainties to the thickness of the seismogenic layer that controls the maximum magnitude allowed in the region of study. The Fault2SHA CAD does not provide seismogenic thickness therefore we consider two hypotheses for a 10 and 15 km thick seismogenic layer, consistent with relocated seismicity (Pizzi et al., 2017) distribution and thermo-mechanical analyses (Boncio et al., 2009), thus exploring two different deformation models. For the other parameters, we consider simplifying assumptions: we assign to each main fault the average of the dip measurements contained in the database, with a constraint that dips do not exceed 55° to account for the fault plane geometries imaged by recent seismic sequences (e.g., Chiaraluce et al., 2011; Improta et al., 2019). Again, we note that a full uncertainty analysis should account for the range of surface dip values presented in the database and consider different hypotheses for how the surface dip propagates at depth. In order to define rupture scenarios that preserve the slip rate variability as much as possible, main faults were subdivided into sections (hereafter named MF-sections), here considered to be 10 km long. It should be noted that a section represents a modeller’s concept, originally introduced in the UCERF3 approach (Field et al., 2014), that allows consideration of variable slip rates along main faults and the exploration of multi-fault ruptures in the computations.
Slip-Rate Profiles Along Main Faults and MF-Sections
In order to attribute a slip rate value to each MF-section, due to the sparsity of the measurement points, we first need to compute a slip rate profile along each main fault. Drawing the slip rate profile involved two steps. In the first step we assume that slip rates tend to zero at tips of the main fault by adding points of zero slip rate at both tips. In the second step, we obtain a slip rate profile by linear interpolation of the slip rate data points similarly to Faure Walker et al. (2010). We then calculate slip rate profiles for the minimum, preferred and maximum values of slip rates along the main fault. Finally, we attributed a slip rate to each MF-section by computing the minimum, preferred and maximum slip rate profiles, then integrating over each MF-section to obtain a single slip-rate value for each. In this paper we only consider the mean slip rate profile for hazard and risk analysis.
An example of slip rates calculated for the MF-sections of the MtVettore main fault is given in Figure 4A. The MtVettore main fault results from the connection of the CupiUssita, MtBove, MtPorche, and VettorettoRedentore fault (Figure 3B). The slip rate data points used to build the profiles are located in the range 14–22 km and 27–31 km along the fault from the NW tip (Figure 4B). In Figure 4A, the slip rates for the 4 MF-sections are compared with the average slip rates of the main fault, to show how the slip rates variability observed from the data is maintained at the level of the MF-sections.
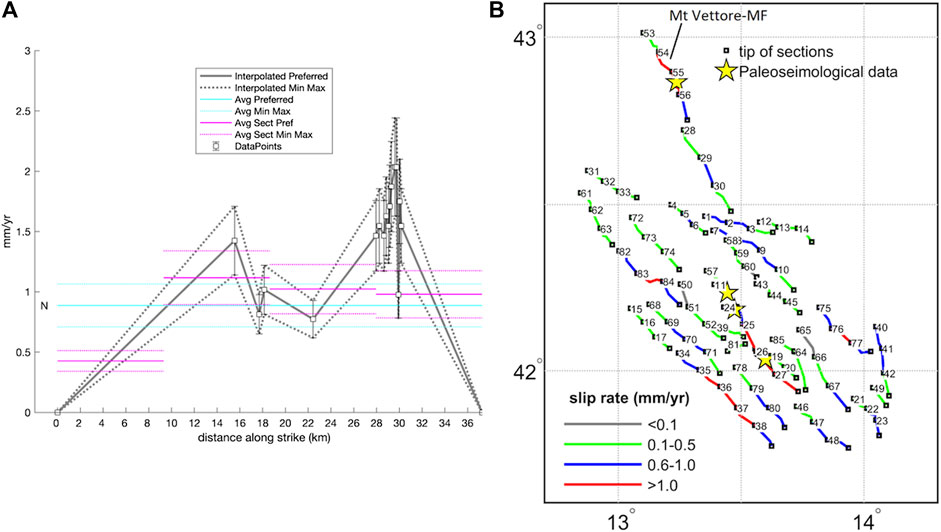
FIGURE 4. (A) Slip rate profile for the MtVettore-MF: data points with error bars are the values used to interpolate the slip rate profiles: solid (mean) and dotted (minimum and maximum) lines. The corresponding integral average of the slip rate profiles are shown with the horizontal cyan lines (for the entire MtVettore-MF) and as magenta horizontal lines for each MF-section. (B) MF-sections defined in this work represent the seismogenic sources used in the computation of earthquake rates and for the definition of rupture scenarios. Yellow stars (MF-sections #55, #11, #24 and #26) represent sites where published paleoearthquake rates will be used to compare to computed ones (see Supplementary Table S3 for names and properties of all sections).
Building the Deformation Model
Next, to build a deformation model we need to define a list of earthquake ruptures comprising either single MF-sections or possible combinations of MF-sections. Following the analysis of fault steps, gaps, and bends along fault ruptures of Biasi and Wesnousky (2016), Biasi and Wesnousky (2017), we assume that to be part of a potential earthquake rupture, MF-sections have to be located at a distance less than or equal to 5 km from each other (measured at the surface). Thus, the number of MF-sections that can be activated in a single event, within the A1B1C1 Main Fault option configuration, range from single MF-section ruptures up to a maximum of 7 MF-section ruptures. This implies maximum aspect ratios (surface length divided by down-dip length) for the ruptures of ∼4 and ∼6 for a 15 or 10 km thick seismogenic layer respectively, which is in agreement with aspect ratios deduced using finite-fault rupture models of past normal faulting earthquakes (Mai and Thingbaijam, 2014). The two deformation models, assuming either 10 or 15 km seismogenic thicknesses, fed to SHERIFS are thus composed of geometries, kinematics and slip rates for each individual MF-section and a list of possible earthquake ruptures.
Computing Seismicity Rates Considering Multi-Fault Rupture Scenarios
Finally, to compute seismicity rates, we use SHERIFS (Chartier et al., 2017), a code that converts slip-rates along faults into earthquake rates following a forward incremental approach. It requires user choices concerning 1) the list of ruptures allowed in the fault system, 2) magnitude scaling relationships (here we use the scaling law of Leonard, 2010), 3) a shape for the frequency-magnitude distribution (FMD) of the modelled regional seismicity that closely resembles that of the catalog (here we use the CPTI15 catalog FMD shape shown in Figure 2) and 4) the amount of seismicity to be considered as occurring in the background (here we assume that all modelled seismicity occurs on the faults).
Conditional on these user choices, the slip rate budget attributed to each fault section is iteratively converted into earthquake rates at each random selection of the rupture scenario until all the slip rate budget of each section is consumed. In some cases, a fraction of the slip-rate budget cannot be converted into earthquake rates. It is then considered to be spent in non-mainshock (NMS) events such as creep or post-seismic slip.
For the purpose of this methodological paper we here consider only one realization of the SHERFIS aleatory exploration of rupture scenarios based on the mean slip rates assigned to each MF-section and mean magnitude scaling values. The purpose of this work is to illustrate the potential of our approach to communicate earthquake hazards/risk. Future work will address the full exploration of the epistemic and aleatory uncertainties of our step-by-step methodology.
Figure 5 shows the seismicity rates computed by SHERIFS compared to the rates deduced from the earthquake catalogue at the regional scale. In order to reproduce the FMD shape of the historical and instrumental earthquake catalogue (Figure 2), a double truncated exponential FMD model with a left-tail for the higher magnitude model starting at M = 6.7 and a b-value equal to 0.95 was imposed. The fault model thus parametrized converts 92% of the slip rate into earthquake rates (see Supplementary Table S3 for the NMS of each section).
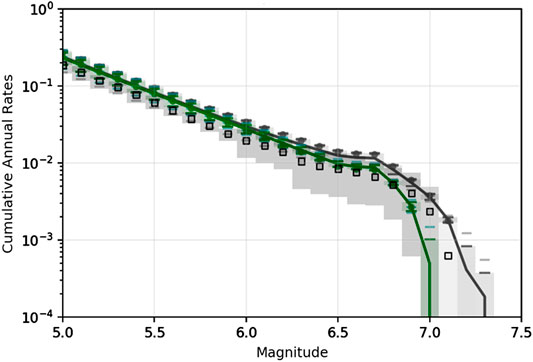
FIGURE 5. SHERIFS’s synthetic earthquake rates resulting from the model considering 10 or 15 km for the seismogenic depth (black and green lines respectively) compared to the regional earthquake catalog rates (empty squares and gray pacthes) shown in Figure 2.
Figure 6 compares SHERIFS results to the paleoseismological earthquake rates documented at the scale of the corresponding MF-sections. It should be noted that the comparison with paleoseismic data is done only for a few MF-sections, for illustrative purposes. To estimate paleoseismic rates we used the Monte Carlo approach proposed by FiSH (Pace et al. (2016), which simulates possible earthquake occurrences for given paleoseismic trench age ranges. We then estimate mean and standard deviations of the recurrence times from the simulated occurrences (Table 2). In Figure 6 paleoseismic rates are plotted considering the same magnitude uncertainty interval for the four sites between 6.6 ≤ Mw ≤ 7.0, although individual publications usually refer to M greater than ∼6.5/7.0. The seismicity rates implied by both deformation models (either with 10 km or 15 km thick seismogenic layer) are in general agreement with the data. Not surprisingly, assuming a 15 km thick seismogenic layer leads to a higher overall moment rate budget and higher possible maximum magnitudes along each MF-section. All the data and codes used for this step of the computation are available in the A_SHERIFS_CAD folder of the Github repository.
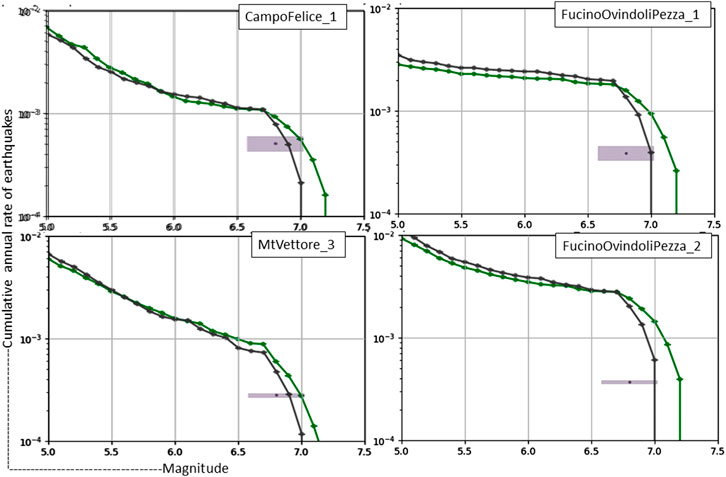
FIGURE 6. Comparison of SHERIFS’s synthetic earthquake rates resulting from the model considering 10 or 15 km thick seismogenic layer (black and green lines respectively) and MF-section- specific paleoseismological rates (violet boxes). The violet boxes are centered at M = 6.8 and have ±0.2 uncertainty width (see text for method).
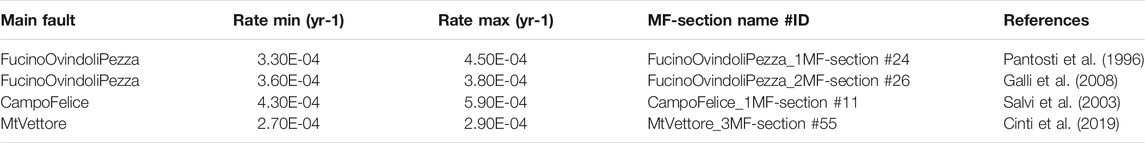
TABLE 2. Rates of paleoseismic events deduced from published literature, used for comparison to synthetic earthquake rates (Figure 6) estimated for corresponding MF-section (cf. Supplementary Table S3 for section properties and Figure 4 for location).
From Earthquake Rates to Seismic Hazard and Risk at Nearby Localities
To compute seismic hazard, we use the synthetic seismicity rates resulting from the SHERIFS’ realization based on the 10 km deep seismogenic hypothesis, considering earthquake rates for M ≥ 5.0, the Bindi et al. (2011) ground motion prediction equation (GMPE) for the peak ground acceleration (PGA) and a soil coefficients of Vs30 = 800 m/s (hard rock). Again, we note that for a full hazard analysis a range of GMPEs should be used. For the purpose of this study, we use the Bindi GMPE, which received the highest score in the Lanzano et al. (2020) study, where a large number of GMPEs applicable in active shallow crustal regions were tested and ranked in the framework of the new Italian hazard model (Meletti et al., 2017).
Seismic risk, as typically defined in engineering, is obtained by the convolution of hazard, vulnerability and exposure. Here we consider only the convolution of vulnerability and hazard for typological classes, thus referred to in the literature as “typological seismic risk” (Rosti et al. 2020). In particular, we show at each locality only computations for the annual probability of collapse for a single "historic” small edifice given its seismic hazard. Thus, unlike a full risk analysis, in the “typological seismic risk” calculations there is a systematic relationship between hazard and risk. We adopted a fragility model for residential masonry buildings (Rosti et al. 2020) developed within the framework of the Italian national platform for large-scale seismic risk assessment. The fragility model is empirically derived by statistically processing a database including damage data from the Irpinia (1980) and L’Aquila (2009) earthquakes (Michelini et al., 2008). Rosti et al. (2020) defined 12 macro-categories by considering two classes of building heights (i.e. L: 1–2 stores and MH: >2 stores) and six classes of construction age (i.e. <1919, 1919–45, 1946–61, 1962–71, 1972–81, >1981), accounting for the building code evolution.
Our computations are based on the convolution of the hazard curve at each locality with the fragility curves for an L type building built before 1919. The seismic hazard and typological risk calculations are performed using OpenQuake, an open source hazard and risk package (Pagani et al., 2014).
In Figure 7A,B we simplified the distribution of seismic hazard and risk by grouping values in four classes, to highlight the internal ranking of hazard and risk amongst the different localities. Localities with highest hazard and risk are in close proximity to main fault traces that are in highest slip rate classes (FucinoOvindoliPezza and Liri in Figure 7A,B). There are however exceptions in the centre of the study region where localities close to faults categorized in the lower slip rate class show high seismic hazard and risk values. This is due to the presence of closely spaced faults. Hence, the importance of mapping hazard based on faults compared to seismotectonic zoning approaches that smooth out hazard and risk, ignoring geological information and providing lower resolution results.
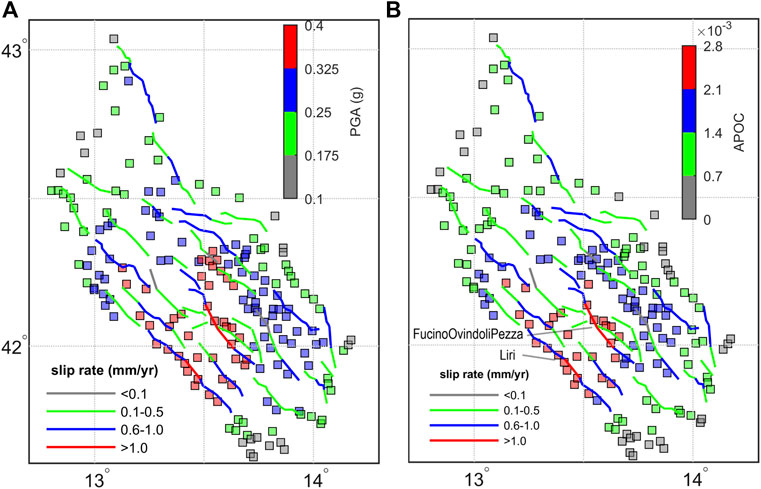
FIGURE 7. Fault-based seismic hazard and typological risk at some localities (indicated by filled squares) color coded according to PGA hazard levels (A) and risk classes (B). Results based on the A1B1C1 Main Fault option configuration of the Fault2SHA CAD and considering only mean parameters for the slip rate, the b-value and the magnitude scaling relationship. (A) PGA with an annual probability of exceedance of 0.0021 (corresponding to a return period of 475 years) based on the Bindi et al. 2011 GMPE using hard rock soil coefficients. (B) Annual Probability Of Collapse (APOC) for a L-type-pre1919 building, based on the Rosti et al. (2020) taxonomy. MF-section are color-coded according to their slip rate class.
All the data and codes used for this step of the computation are available in the B_OQ_JOB_GMPE_FRAGILTY_EXPOSURE folder of the GitHub repository.
Data-Providers and End Users: The Communication Loop
Communicating hazard and risk results to a wide spectrum of interested readers is challenging. The basic output of seismic hazard studies are maps, hazard curves, hazard spectrums and spatial disaggregation results for specific hazard intensity measures in terms of magnitude-distance-epsilon values. In such outputs results are binned and it is not straightforward for geologists to trace back to which fault is contributing the most to hazard. Here we propose a new approach that aims at communicating fault specific results to the two different communities: the data-providers and the end-users. To address both communities, the participation of each MF-section to hazard and risk at a given locality is computed. Firstly, the PGA hazard curve is computed at a given locality for each rupture scenario explored. The sum of each of these hazard curves represents then the total hazard for that locality. Secondly, in order to obtain the participation of each MF-section to the hazard of that locality, we first sum the hazard curves of each MF-section for each rupture scenario in which the MF-section is involved. Then, this summed hazard curve is normalized to the total hazard curve. Thirdly, the same procedure is repeated to compute the participation of MF-sections to the typological risk of collapse of a single building at that locality.
In Figure 8A we show the participation of all the MF-sections to the hazard at L’Aquila. For each PGA level, we compute MF-sections contributions to the probability of exceedance (POE) of that PGA level. In Figures 8B,C, we mapped the contribution of each MF-section to hazard at L’Aquila, for two example PGA levels: at the low level of acceleration (PGA = 0.053 g), faults up to 30 km away from the city contribute to hazard, whereas at the high level (PGA = 0.866 g), it is mainly MF-sections to the NE and close to the city (Assergi and Barisciano MF-sections) that contribute the most to hazard, with nevertheless a significant contribution from the Campo Felice and FucinoOvindoliPezza MF-sections.
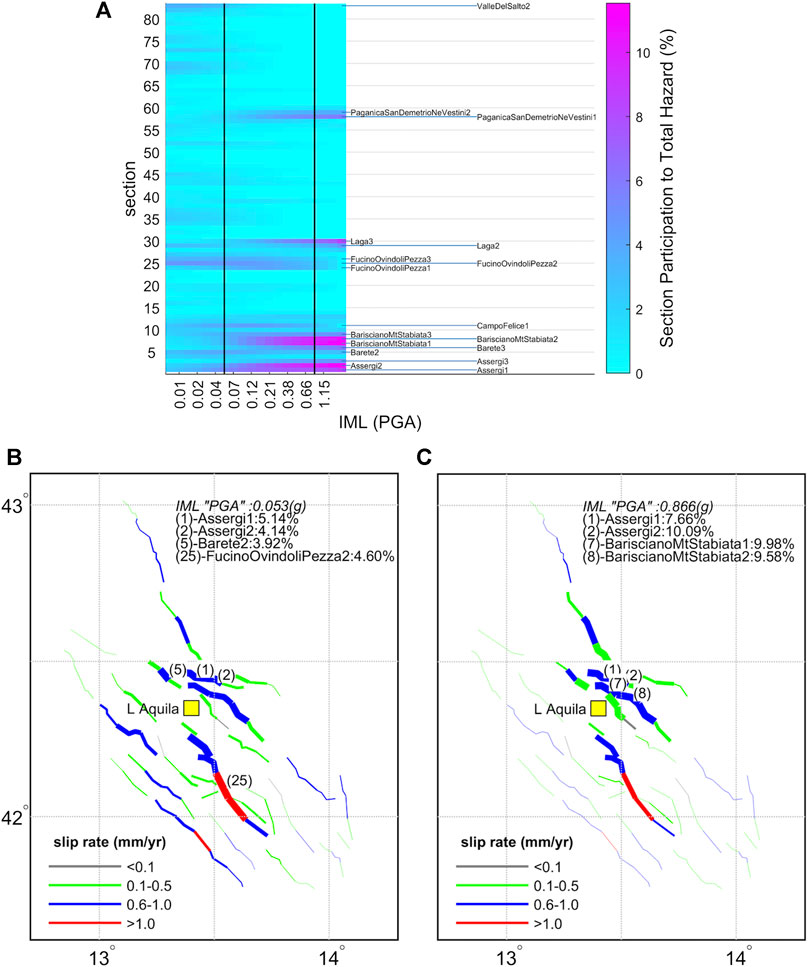
FIGURE 8. Participation of MF-sections to the seismic hazard at L’Aquila (Yellow Square): (A) MF-section participation diagrams (% of total hazard) as a function of the PGA. Vertical lines correspond to the PGA example values used in (B) and (C) frames, respectively. Maps of MF-sections contributing to the exceedance of a PGA value of (B) 0.053 g and (C) 0.866 g. MF-sections are color-coded according to the slip rate class and their width corresponds to their percentage participation to exceeding given PGA value at L’Aquila. Only MF-sections participating the most to the total hazard (the upper 10% of the distribution) are labelled.
In Figure 9 we show an example of the percentage participation of each MF-section to the typological risk at L’Aquila. This kind of representation allows to immediately appreciate that high slipping faults although located further away from L’Aquila they need to be considered as well. In this specific case, the FucinoOvindoliPezza_2 MF-section (highest slip rate class) contributes as much as the close by Barete_3 MF-section (the second slip rate class). Furthermore, this representation shows that both MF-sections rely only on one observation point and thus require further field investigation. In Table 2 we show that the majority of the MF-sections participating the most to the typological risk at L’Aquila are parametrized on the basis of few data points and should therefore become priority data collection targets before future seismic hazard/assessments.
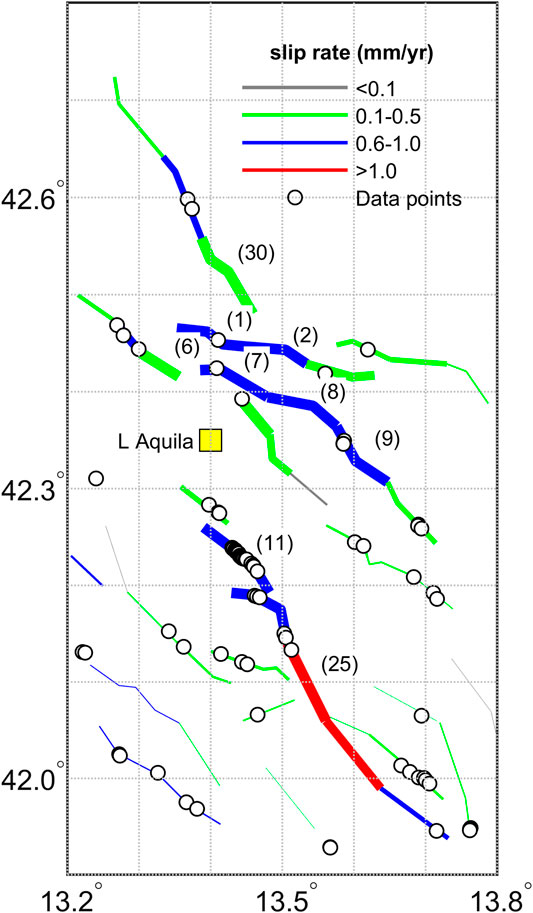
FIGURE 9. Participation of MF-sections to typological seismic risk in L’Aquila (Yellow Square) for collapse condition of an L type – building constructed before 1919. Slip rate measurement points available in the Fault2sha CAD (empty black circles) are superposed on the MF-section traces (color coded according to their slip rate category). Only the MF-sections that participate the most (the upper 10% of the distribution) are identified (corresponding MF-section name is provided in Table 3).
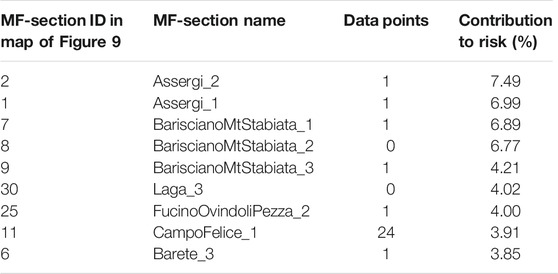
TABLE 3. Number of slip rate data points available in the Fault2SHA CAD for each MF-section participating to the upper 10% of the distribution of the typological risk at L'Aquila ordered by % of contribution.
Although codes presented here are written to read the Fault2SHA CAD structure, they can be easily adapted to read other database structures as long as geo-localized main fault traces and geo-localized fault slip rate information is provided.
Discussion
The purpose of this paper is to illustrate the potential of the new generation of fault-based PSHA to link detailed databases of active faults, with fault modellers, seismic hazard practitioners and end-users. The assumptions made at each step of the methodology are traced and can be easily re-questioned in future modelling approaches.
The applicability of this new generation of fault-based PSHA, however, requires the availability of detailed data. Building such database is challenging. In Europe such endeavors can only be made at a regional scale, for the time being. The existing EDSF database has the advantage of proposing source models at the Euro-Mediterranean area scale but the disadvantage that the information provided is not traceable. For example, in France, the EDSF fault sources are represented as simplified trace of the information provided in the BDFA (Base de Données des Failles potentiellement Actives, http://bdfa.irsn.fr/), a compilation of published fault data (Jomard et al., 2017). In Italy, the EDSF is based on an already parametrized Database of seismogenic sources proposed by an about 20-years long activity of the DISS (Database of Individual Seismogenic Sources) Working Group (2018, Basili et al. 2008). The formalization of each seismogenic source takes into account a variety of ingredients such as historical seismicity, geological and geophysical data. The DISS database is thus formed by Individual Seismogenic Sources (ISS), which are simplified representations of mapped or hypothesized fault planes with given rupture length/width and expected magnitude, and Composite Seismogenic Sources (CSS) which are 3D envelopes of undetermined seismogenic sources, with soft constraints on expected rupture location, size and magnitude.
Unfortunately, simplifications of the representation of faults, especially in regions where detailed geologic data are available, can actually mislead decision makers. Enlightening examples of the discrepancies between modelled seismic sources and faults emerged, for example, during the two most recent seismic sequences in Central Italy in 2009 and 2016, whose causative faults were known (Peruzza and Pace, 2002; Boncio et al., 2004; Roberts and Michetti, 2004; Pace et al., 2006; Akinci et al., 2009), but not considered seismogenic sources in the DISS releases published at the time of those earthquakes. Thus the challenge today to improve assessment of seismic hazard and risk is to incorporate in the pan-European effort such detailed traceable geological information where available. The Faultt2SHA-CAD is a first effort in such a direction.
Thanks to the availability of Fault2SHA-CAD, we can propose a new generation of fault-based PSHA with codes that are capable of analyzing complex database structures, linking the variability in the available geological data to the variability in hazard and risk assessment. Accounting for slip rate variability along faults is paramount in fault-based PSHA in order to avoid underestimating (or overestimating) hazard as already pointed out by Faure Walker et al. (2019) and Sgambato et al. (2020) on single faults. Here, we went a step beyond by incorporating multi fault ruptures. In Figure 10, we show the difference between estimated typological risk based on the new generation of fault-based models (i.e., considering multi fault ruptures), and that based on confining ruptures only to main faults. The impact of considering multi fault ruptures can be significant, either increasing or reducing it by up to 30% the estimated typological risk in this case (only one Montecarlo realization of possible multi fault rupture). In the fault network considered here, confining ruptures only to main faults largely reduces the set of possible rupture scenarios and this, in turn, implies assuming rupture scenarios with maximum magnitudes of up to 6.8 instead of 7.0. On the other hand, the 2016 Mw 6.0–6.5 Central Italy earthquake sequence (e.g. Scognamiglio et al., 2018) have shown that complex multi fault ruptures can occur in this region. Other events have already highlighted the possibility of complex multi fault ruptures in other regions as well (2019 Mw 7.0 Ridgecrest, 2010 Mw 7.1 El Mayor-Cucapah, 2010 Mw 7.1 Darfield, 1997 Mw 7.2 Zirkuh, 1992 Mw 7.2 Landers, 1980 Mw 6.9 Irpinia earthquakes, see also Quigley et al., 2017). The question thus no longer is whether complex rupture can occur in a region but rather how complex can such multi-fault ruptures be.
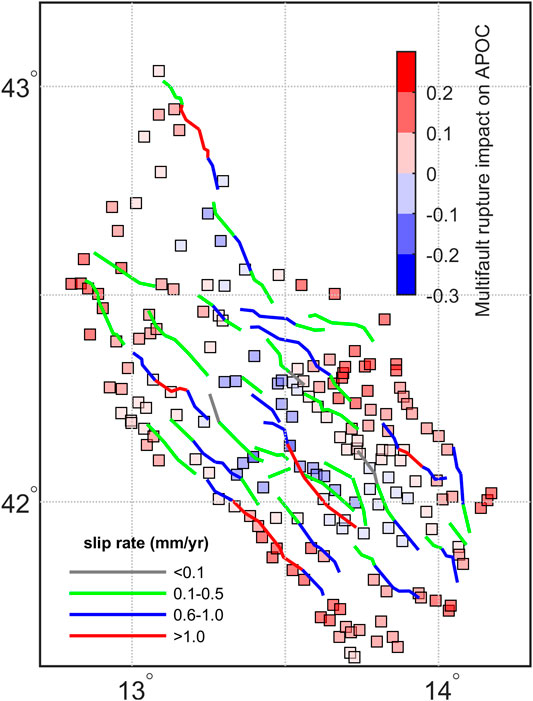
FIGURE 10. Difference in the annual probability of collapse (APOC) at the localities (filled squares) between considering in the list of rupture scenarios the possibility of complex multi-fault ruptures (CMFRAPOC) or only ruptures confined within the main faults (OMFRAPOC): (CMFRAPOC - OMFRAPOC)/OMFRAPOC. Red implies higher values for the CMFR case.
In the present work, we considered at each step only one of the numerous epistemic uncertainties. The codes, however, do allow exploration of epistemic uncertainties affecting fault-based seismic hazard and risk models. Indeed, alternative seismogenic depths can be considered. Future studies will rely on the best available information (i.e. relocated seismicity) to fine tune the value of the seismogenic depth of each section whenever possible. Also alternative scaling laws should be considered as well as alternative considerations of how much of the slip rate budget should be attributed to the background seismicity. Both hypotheses have a direct impact on the assessments of seismic hazard and risk at all localities.
Depending on the locality, sensitivity to the choice of main fault trace should be explored as it may have an impact on the slip rate profiles and hence on the assessment of seismic hazard and risk. Similarly, the building of slip rate profiles, based here on linear interpolation of data along the main fault constrained to be zero at the ends, can have an overall impact on the regional activity rates as well as a local impact. This notwithstanding, the results presented here provide a good first order measure of key issues that require urgent action. For geologists, we recommend the pursuit of the acquisition of well-constrained data to improve the parametrization of faults that contribute the most to hazard and risk at specific localities (for some faults there is actually no slip data available in the database). For end-users: we note that fault-based hazard and risk estimates are extremely variable in this region. Thus, depending on the specific needs of the end-users, a much wider range of epistemic uncertainties will need to be explored (combinations of main fault hypotheses presented in the Fault2SHA CAD, different GMPE and fragility curves, to mention just a few) to quantify a fault’s contribution to hazard/risk and set priorities accordingly. Hazard and risk have been estimated here only on the basis of faults. Note that not all faults in the region are equally well informed and it will always be difficult to assume completeness of knowledge in any given area. Thus, future studies will need to discuss the potential contribution of off-fault seismicity which is another source of uncertainty in seismic hazard assessment (Field et al., 2013) as well as the contribution of possible blind faults.
Clearly, informing the model with the best data available for a given area will be vital in future studies. In the short-term, we therefore encourage geologist to trace their data in structured databases including locations and certainties in the activity of fault traces, slip-rate paleoseismic measurements and main fault options. In the longer term, reliable methods for determining how the surface structures propagate to depth should be sought for, including their geometry and seismic depth. Complementary information that may come in the future from physics-based approaches will also allow revisiting the multi-fault ruptures that are physically possible and possibly reject extreme cases. Quantifying the aseismic deformation that is potentially accommodated along some of the faults will also need to be considered. In addition, we encourage full exploration of the epistemic uncertainties associated with the necessary simplifications made within hazard and risk modelling.
Conclusion
The new generation of fault-based PSHA proposed here provides a transparent methodology to account for the best geological information available in a given region for seismic hazard and risk studies. In the framework of the ESC FAULT2SHA working group (fault2sha.net), the Central Apennines laboratory (CA-lab) developed a database, which provides geologic data in the form of characterized fault traces, grouped into faults and main faults, with individual slip rate estimates. Using this database, we were able to build detailed fault deformation models, including variable slip rate profiles and multi fault ruptures, and develop novel visualization schemes of the results. The approach developed empowers end-users and decision-makers with the capacity to identify main fault sections that participate the most to the seismic risk of a site as well as understanding and tracing differences of interpretation documented in the database. Furthermore, data-providers can easily visualize the impact of their data on seismic hazard and risk at specific localities and identify priority locations that require further data collection. It is hoped that this work will motivate other fault-communities to adopt the Fault2SHA CAD structure and the methodology for their own region. The Open Source codes provided in the electronic supplement represent an important deliverable that will facilitate this link, paramount to ensure that model assumptions reflect as much as possible the geological interpretations.
Data Availability Statement
Publicly available datasets were analyzed in this study. This data can be found here: https://doi.org/10.1594/PANGAEA.922582
Author Contributions
OS and FV: Conceptualization, Methodology, Software, Visualization Writing- Original draft preparation. JW: Data curation, Writing- Reviewing and Editing. LP: Writing- Reviewing and Editing. BP: Code verification. LB, BP, PB, JW, and GR: slip rate profile and main fault option discussions.
Funding
This work was initiated in the framework of the ESC Fault2SHA Central Apennines Working group (fault2sha.net) that does not provide any funding. The work was essentially supported by each institute involved. A specific funding was provided by the Institute of Radioprotection and Nuclear Safety (IRSN LS 21173 – CA 32003737) to support Francesco Visini’s visit to Paris from September 2019 until May 2020 in the framework of the Research Agreement in the field of probabilistic seismic hazard methodologies between IRSN and the National Institute of Geophysics and Volcanology (INGV). This study has also benefited from partial funding provided by the Italian Presidenza del Consiglio dei Ministri – Dipartimento della Protezione Civile (DPC). This paper does not represent DPC, INGV or IRSN official opinion and policies.
Conflict of Interest
The authors declare that the research was conducted in the absence of any commercial or financial relationships that could be construed as a potential conflict of interest.
Acknowledgments
We would like to thank the reviewers and the editor for their constructive comments that have improved our text. We also thank Thomas Chartier for providing the 2.1 version of the SHERIFS code, that greatly enhanced the computation time, Paolo Bazzurro for exchanging on the appropriate fragility function to use for central Italy and finally, Silvia Pondrelli for helping with GMT plotting of Figure 2A. Figures were created using GMT (Wessel and Smith, 1991), SHERIFS (V1.2) and Matlab (2018b) codes. Codes and data used in this paper are available online in a dedicated GitHub repository (https://github.com/fault2shaESCWG/CentralApenninesLabFAULT2RISK).
Supplementary Material
The Supplementary Material for this article can be found online at: https://www.frontiersin.org/articles/10.3389/feart.2020.626401/full#supplementary-material.
1Faure Walker, J. P., Boncio, P., Pace, B., Roberts, G., Benedetti, L., Scotti, O., et al. (2021). Fault2SHA Central Apennines database and structuring active fault data for seismic hazard assessment, Scientific Data (under review).
References
Akinci, A., Galadini, F., Pantosti, D., Petersen, M., Malagnini, L., and Perkins, D. (2009). Effect of time dependence on probabilistic seismic-hazard maps and deaggregation for the central Apennines, Italy, B. Seismol. Soc. Am. 99, 585–610. doi:10.1785/0120080053
Basili, R., Kastelic, V., Demircioglu, M. B., Garcia Moreno, D., Nemser, E. S., Petricca, P., et al. (2013). The European database of seismogenic faults (EDSF) compiled in the framework of the project SHARE http://diss.rm.ingv.it/share-edsf/.
Basili, R., Valensise, G., Vannoli, P., Burrato, P., Fracassi, U., Mariano, S., et al. (2008). The Database of Individual Seismogenic Sources (DISS), version 3: summarizing 20 years of research on Italy’s earthquake geology. Tectonophysics 453, 20–43. doi:10.1016/j.tecto.2007.04.014
Biasi, G. P., and Wesnousky, S. G. (2017). Bends and ends of surface RupturesBends and ends of surface ruptures. Bull. Seismol. Soc. Am. 107 (6), 2543–2560. doi:10.1785/0120160292
Biasi, G. P., and Wesnousky, S. G. (2016). Steps and gaps in ground ruptures: empirical bounds on rupture propagation. Bull. Seismol. Soc. Am. 106 (3), 1110–1124. doi:10.1785/0120150175
Bindi, D., Pacor, F., Luzi, L., Puglia, R., Massa, M., Ameri, G., et al. (2011). Ground motion prediction equations derived from the Italian strong motion database. Bull. Earthq. Eng. 9 (6), 1899–1920. doi:10.1007/s10518-011-9313-z
Boncio, P., Lavecchia, G., and Pace, B. (2004). Defining a modelof 3D seismogenic sources for seismic hazard assessmentapplications: the case of central Apennines (Italy). J. Seismol. 8, 407–425. doi:10.1023/B:JOSE.0000038449.78801.05
Boncio, P., Tinari, D. P., Lavecchia, G., Visini, F., and Milana, G. (2009). The instrumental seismicity of the abruzzo region in Central Italy (1981–2003): seismotectonic implications. Ital. J. Geosci. (Boll. Soc. Geol. Italy) 128.(2), 367–380. doi:10.3301/IJG.2009.128.2.367
Chartier, T., Scotti, O., and Lyon‐Caen, H. (2019). SHERIFS: open‐source code for computing earthquake rates in fault systems and constructing hazard models. Seismol Res. Lett. 90 (4), 1678–1688. doi:10.1785/0220180332
Chartier, T., Scotti, O., Lyon-Caen, H., and Boiselet, A. (2017). Methodology for earthquake rupture rate estimates of fault networks: example for the western Corinth rift, Greece. Natural Hazards Earth Syst. Sci. Eur. Geosci. Union 17 (10), 1857–1869. doi:10.5194/nhess-2017-124
Chiaraluce, L., Chiarabba, C., De Gori, P., Di Stefano, R., Improta, L., Piccinini, D., et al. (2011). The 2009 L’Aquila (central Italy) seismic sequence. Boll. di Geofis. Teor. ed Appl. 52, 367–387, doi:10.4430/bgta0019
Cinti, F. R., De Martini, P. M., Pantosti, D., Baize, S., Smedile, A., Villani, F., et al. (2019). 22-kyr-long record of surface faulting along the source of the 30 October 2016 earthquake (central Apennines, Italy), from integrated paleoseismic data sets. J. Geophys. Res. 124, 9021–9048. doi:10.1029/2019JB017757
D’Agostino, N., Mantenuto, S., D’Anastasio, E., Giuliani, R., Mattone, M., Calcaterra, S., et al. (2011). Evidence for localized active extension in the central Apennines (Italy) from global positioning system observations. Geology 39 (4), 291–294. doi:10.1130/G31796.1
DISS Working Group (2018). “Database of individual seismogenic sources (DISS)”. in Version 3.2.1: A compilation of potential sources for earthquakes larger than M 5.5 in Italy and surrounding.
Emre, Ö., Duman, T. Y., Özalp, S., Messina, P., Michetti, A. M., Masana, E., et al. (2018). Active fault database of Turkey. Bull. Earthq. Eng. 16, 3229–3275. doi:10.1007/s10518-016-0041-2
Faure Walker, J. P., Boncio, P., Pace, B., Roberts, G., Benedetti, L., Scotti, O., et al. (2020). Fault2SHA central apennines database. London, United Kingdom: Institute for Risk and Disaster Reduction, University College London, PANGAEA, https://doi.org/10.1594/PANGAEA.922582.
Faure Walker, J. P., Roberts, G., Sammonds, P., and Cowie, P. (2010). Comparison of earthquake strains over 100 and 10,000year timescales: insights into variability in the seismic cycle in the central Apennines, Italy. J. Geophys. Res. 115, B10418. doi:10.1029/2009JB006462
Faure Walker, J. P., Visini, F., Roberts, G., Galasso, C., McCaffrey, K., and Mildon, Z. (2019). Variable fault geometry suggests detailed fault-Slip-Rate profiles and geometries are needed for fault-based probabilistic seismic hazard assessment (PSHA). BSSA 109 (1), 110–123. doi:10.1785/0120180137
Field, E. H., Arrowsmith, R. J., Biasi, G. P., Bird, P., Dawson, T. E., Felzer, K. R., et al. (2014). Uniform California earthquake rupture forecast, version 3 (UCERF3): the time-independent model. Bull. Seismol. Soc. Am. 104, 1122–1180. doi:10.1785/0120130164
Field, E. H., Messina, P., Michetti, A. M., Galasso, C., McCaffrey, K., Masana, E., et al. (2013). USGS open-file report 2013–1165, CGS special report 228, and southern California earthquake. Southern California: Center Publication, 1792.
Galli, P., Galadini, F., and Pantosti, D. (2008). Twenty years of paleoseismology in Italy. Earth Sci. Rev. 88 (1–2), 89–117. doi:10.1016/j.earscirev.2008.01.001
Gómez-Novell, O., Chartier, T., García-Mayordomo, J., Ortuño, M., Masana, E., Insua-Arévalo, J. M., et al. (2020). Modelling earthquake rupture rates in fault systems for seismic hazard assessment: the Eastern Betics Shear Zone, Eng. Geol. 265, 105452. doi:10.1016/j.enggeo.2019.105452
Haller, K. M., Machette, M. N., Dart, R. L., and Rhea, B. S. (2004). U.S. Quaternary fault and fold database released. Eos Trans. Am. Geophys. Union 85 (22), 218. doi:10.1029/2004EO220004
Improta, L., Latorre, D., Margheriti, L., Nardi, A., Marchetti, A., Lombardi, A. M., et al. (2019). Multi-segment rupture of the 2016 Amatrice-Visso-Norcia seismic sequence (central Italy) constrained by the first high-quality catalog of Early Aftershocks. Sci. Rep. 9, 6921–7013. doi:10.1038/s41598-019-43393-2 |
Jomard, H., Cushing, E. M., Palumbo, L., Baize, S., David, C., and Chartier, T. (2017). Transposing an active fault database into a seismic hazard fault model for nuclear facilities–Part 1: building a database of potentially active faults (BDFA) for metropolitan France. Nat. Hazards Earth Syst. Sci. 17 (9), 1573–1584. doi:10.5194/nhess-17-1573-2017
Lanzano, G., Luzi, L., D'Amico, V., Pacor, F., Meletti, C., Marzocchi, W., et al. (2020). Ground motion models for the new seismic hazard model of Italy (MPS19): selection for active shallow crustal regions and subduction. Zones Earthq. Eng. 18, 3487–3516. doi:10.1007/s10518-020-00850-y
Leonard, M. (2010). Earthquake fault scaling: self‐consistent relating of rupture length, width, average displacement, and moment release. Bull. Seismol. Soc. Am. 100 (5A), 1971–1988. doi:10.1785/0120090189
Litchfield, N. J., Dissen, R. V., Sutherland, R., Barnes, P. M., Cox, S. C., Norris, R., et al. (2014). A model of active faulting in New Zealand. N. Z. J. Geol. Geophys. 57 (1), 32–56. doi:10.1080/00288306.2013.854256
Mai, P. M., and Thingbaijam, K. K. S. (2014). SRCMOD: an online database of finite‐fault rupture models. Seismol Res. Lett. 85 (6), 1348–1357. doi:10.1785/0220140077
Meletti, C., D’Amico, V., Martinelli, F., and Rovida, A. (2019). “Prodotto 2.15: stima delle completezze di CPTI15 e suo declustering,” in Il modello di pericolosità sismica MPS19. Final Report. Editors C. Meletti, and W. Marzocchi (Roma: CPS-INGV), 168.
Meletti, C., Marzocchi, W., Albarello, D., D'Amico, V., Luzi, L., Martinelli, F., et al. (2017). “The MPS16 Working Group, The 2016 Italian seismic hazard model,” in 16th world conference on earthquake engineering (WCEE), Santiago, Chile, January 9–13, 2017.
Michelini, A., Faenza, L., Lauciani, V., and Malagnini, L. (2008). ShakeMap implementation in Italy. Seismol. Res. Lett. 79 (5), 688–697.
Pace, B., Peruzza, L., Lavecchia, G., and Boncio, P. (2006). Layered seismogenic source model and probabilistic seismic-hazard analyses in Central Italy. Bull. Seismol. Soc. Am. 96 (1), 107–132. doi:10.1785/0120040231
Pace, B., Visini, F., and Peruzza, L. (2016). FiSH: MATLAB tools to turn fault data into seismic-hazard models. Seismol Res. Lett. 87 (2A), 374–386. doi:10.1785/0220150189
Pace, B., Visini, F., Scotti, O., and Peruzza, L. (2018). Preface: linking faults to seismic hazard assessment in Europe. Nat. Hazards Earth Syst. Sci. 18, 1349–1350. doi:10.5194/nhess-18-1349-2018
Pagani, M., Monelli, D., Weatherill, G., Danciu, L., Crowley, H., Silva, V., et al. (2014). OpenQuake engine: an open hazard (and risk) software for the global earthquake model. Seismol Res. Lett. 85 (3), 692–702. doi:10.1785/0220130087
Pantosti, D., D’Addezio, G., and Cinti, F. R. (1996). Paleoseismicity of the Ovindoli‐Pezza fault, central Apennines, Italy: a history including a large, previously unrecorded earthquake in the Middle Ages (860–1300 A.D.). J. Geophys. Res. 101 (B3), 5937–5959. doi:10.1029/95JB03213
Peruzza, L., and Pace, B. (2002). Sensitivity analysis for seismic source characteristics to probabilistic seismic hazard assessment in central Apennines (Abruzzo area). B. Geofis. Teor. Appl. 43, 79–100.
Pizzi, A., Di Domenica, A., Gallovič, F., Luzi, L., and Puglia, R. (2017). Fault segmentation as constraint to the occurrence of the main shocks of the 2016 Central Italy seismic sequence. Tectonics 36, 2370–2387. doi:10.1002/2017TC004652
Quigley, M. C., Mohammadi, H., and Duffy, B. G. (2017). “Multi-fault earthquakes with kinematic and geometric rupture complexity: how common,” in 8th International INQUA Meeting on Paleoseismology, Active Tectonics and Archeoseismology, Newzealand, November 2017.
Roberts, G., and Michetti, A. M. (2004). Spatial and temporal variations in growth rates along active normal fault systems: an example from the Lazio-Abruzzo Apennines, central Italy. J. Struct. Geol. 26 (2). 339–376, doi:10.1016/S0191-8141(03)00103-2
Rosti, A., Rota, M., and Penna, A. (2020). Empirical fragility curves for Italian URM buildings. Bull. Earthq. Eng. doi:10.1007/s10518-020-00845-9
Rovida, A., Locati, M., Camassi, R., Lolli, B., and Gasperini, P. (2019). Catalogo Parametrico dei Terremoti Italiani (CPTI15), versione 2.0. Italy: Istituto Nazionale di Geofisica e Vulcanologia (INGV).
Rovida, A., Locati, M., Camassi, R., Lolli, B., and Gasperini, P. (2020). The Italian earthquake catalogue CPTI15. Bull. Earthq. Eng. 18 (7), 2953–2984. doi:10.1007/s10518-020-00818-y
Salvi, S., Cinti, F. R., Colini, L., D’Addezio, G., Doumaz, F., and Pettinelli, E. (2003). Investigation of the active Celano–L’Aquila fault system, Abruzzi (central Apennines, Italy) with combined ground-penetrating radar and palaeoseismic trenching. Geophys. J. Int. 155 (3), 805–818. doi:10.1111/j.1365-246X.2003.02078.x
Scognamiglio, L., Tinti, E., Casarotti, E., Pucci, S., Villani, F., Cocco, M., et al. (2018). Complex fault geometry and rupture dynamics of the MW6.5, 30 October 2016, central Italy earthquake. J. Geophys. Res. Solid Earth 123. 2943–2964. doi:10.1002/2018JB015603
Scotti, O., and Peruzza, L. (2016). Fault2SHA—a European working group to link faults and probabilistic seismic hazard assessment communities in Europe. Vienna, Austria: EGU General Assembly.
Sgambato, C., Faure Walker, J. P., and Roberts, G. (2020). Uncertainty in strain-rate from field measurements of the geometry, rates and kinematics of active normal faults: implications for seismic hazard assessment. J. Struct. Geol. 131, 103934. doi:10.1016/j.jsg.2019.103934
Tesson, J., Pace, B., Benedetti, L., Visini, F., Delli Rocioli, M., Arnold, M., et al. (2016). Seismic slip history of the Pizzalto fault (central Apennines, Italy) using in situ-produced 36Cl cosmic ray exposure dating and rare earth element concentrations. J. Geophys. Res. Solid Earth 121, 1983–2003. doi:10.1002/2015JB012565
Valentini, A., Duross, C. B., Field, E. H., Gold, R. D., Briggs, R. W., Visini, F., et al. (2020). Relaxing segmentation on the Wasatch fault zone: impact on seismic hazard. Bull. Seismol. Soc. Am. 110, 83–109. doi:10.1785/0120190088
Valentini, A., Visini, F., and Pace, B. (2017). Integrating faults and past earthquakes into a probabilistic seismic hazard model for peninsular Italy. Nat. Hazards Earth Syst. Sci. 17 (11), 2017–2039. doi:10.5194/nhess-17-2017-2017
Visini, F., Valentini, A., Chartier, T., Scotti, O., and Pace, B. (2020). Computational tools for relaxing the fault segmentation in probabilistic seismic hazard modelling in complex fault systems.Pure Appl. Geophys. 177 (5), 1855–1877. doi:10.1007/s00024-019-02114-6
Keywords: active faults, slip rate data, multi fault ruptures, seismic hazard and risk, visualization
Citation: Scotti O, Visini F, Faure Walker J, Peruzza L, Pace B, Benedetti L, Boncio P and Roberts G (2021) Which Fault Threatens Me Most? Bridging the Gap Between Geologic Data-Providers and Seismic Risk Practitioners. Front. Earth Sci. 8:626401. doi: 10.3389/feart.2020.626401
Received: 05 November 2020; Accepted: 28 December 2020;
Published: 22 February 2021.
Edited by:
Chong Xu, Ministry of Emergency Management, ChinaReviewed by:
Qi Yao, China Earthquake Networks Center, ChinaXibin Tan, China Earthquake Administration, China
Jia Cheng, China Earthquake Administration, China
Copyright © 2021 Scotti, Visini, Faure Walker, Peruzza, Pace, Benedetti, Boncio and Roberts. This is an open-access article distributed under the terms of the Creative Commons Attribution License (CC BY). The use, distribution or reproduction in other forums is permitted, provided the original author(s) and the copyright owner(s) are credited and that the original publication in this journal is cited, in accordance with accepted academic practice. No use, distribution or reproduction is permitted which does not comply with these terms.
*Correspondence: Oona Scotti, oona.scotti@irsn.fr