1. Introduction
In many countries, round wood is sold in stacks. The most important factor for the purchaser when buying in this way is to know precisely the acquired amount. There are two relevant parameters here: stack volume and solid wood content. The stack volume is normally measured by multiplying the length, width and height of a stack to obtain the cubic area occupied by the stack of wood [
1]. Although the sectional volumetric measurement method is frequently used, there are differences between countries in terms of some points such as the section length [
2]. In Europe there is no standardized stack volume measurement method. European standards recognize only the national round timber measurement and volume calculation rules of several European countries [
3].
Two common units to express the stacked wood measurements are the stere and the cord [
1]. However, when expressing the volume of a stack in this way, not only the wood volume but also the bark portion and the air space are included [
1].
The solid wood content corresponds to the real roundwood volume which is the basis of the sales process. To determine the latter, it is necessary to measure the volume of every log. However, due to the huge volumes of round wood purchases in many countries, this procedure is unfeasible. Therefore, this value is normally estimated. Calculation of the solid wood content in a stack has been an issue in forest research for the last two centuries [
4]. The first publications related to this topic date back to the end of the 19th century, such as the research conducted by Bauer in Germany in 1879 and von Senkendorf in Austria in 1881 [
5]. The basis for those studies was the increasing demand for wood and the diminishing supply of desirable wood species [
6]. Recent publications have been dated from 2016 onwards. Some of these are related to the implementation and development of photo-optical systems for measuring stack volume and the accuracy and efficiency of these methods when compared with each other and with the traditional methods. The implementation of these methods led to a higher accuracy and they are faster than the traditional measurement methods [
2,
7]. Other studies included the determination of solid wood content as well as the influence of some parameters on the conversion factors [
8,
9]. Nowadays, the main reason for the recent research studies has been the need to manage financial resources more efficiently when purchasing raw material. A calculation error at this stage of the sales process can cause significant economic losses, which in the current context of a global market can mean a considerable loss of competitiveness. The most recent document was published by The Food and Agriculture organization, the International Tropical Timber Organization and the United Nations Economic Commission for Europe [
10]. It takes as reference the Swedish model [
11] to estimate the solid wood content in a stack by taking into consideration several influencing parameters on the conversion factors, and, in turn, on the stack volume.
The influencing parameters have been the basis of research on an equally important and related topic with the first publications dating back to the beginning of the 20th century [
12]. Although these parameters are already considered in the roundwood measurement guidelines in some countries such as Sweden [
11], their influence has not yet been analyzed individually with reference to a broad statistical basis.
The collection of data for such research requires the measurement of the stack volume and the solid wood content of a considerable number of log piles in order to obtain a sufficiently broad statistical basis. Additionally, the quantification of the solid wood content must be accurate. The most precise method for measuring the real volume of a log is the water displacement method [
6]. Considering that the application for such an enormous number of logs would require a long period of time and significant financial resources, it can be stated that the whole process is very costly in practice.
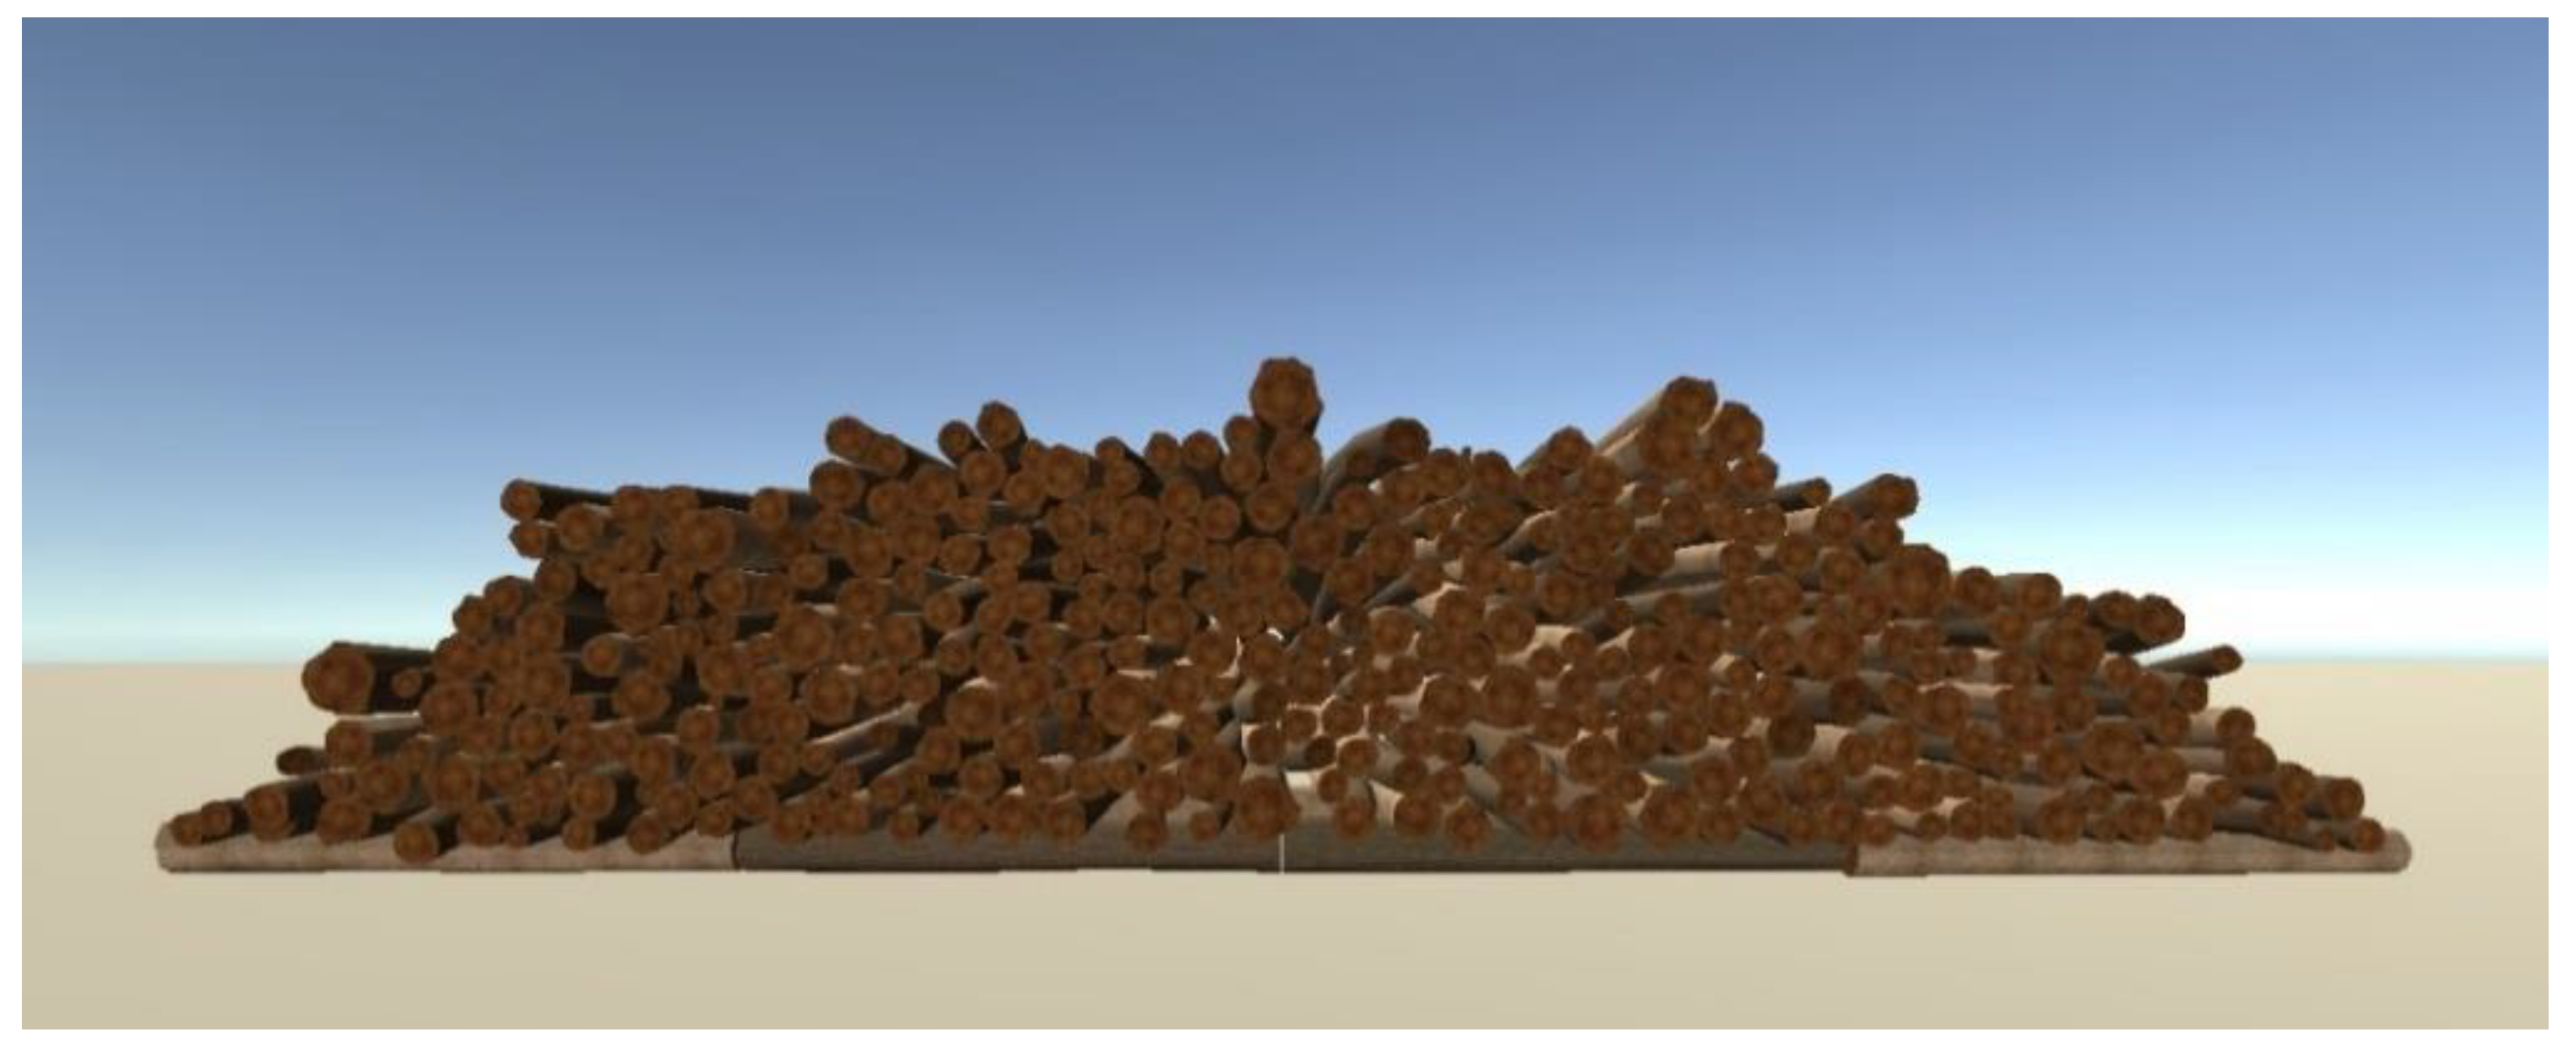
It can hence be assumed that another means for making these calculations is necessary given that the collection of data is, at that scale, practically unfeasible. Using the latest IT technologies and simulation approaches could be a more time and cost-effective solution. Consequently, the approach based on the implementation of a 3D simulation model to carry out these analyses was tested. The simulation model was programmed by “Dr. Philippe Guigue Software Artisan” as an important part of the project “Optimization of the wood supply chain-through analysis, evaluation and further development of log measuring methods and logistics processes in the round wood trade”. The programming of the simulation model as software was performed in the “.Net Framework” in C# programming language. It is based on a cross-platform game engine known as Unity software (version 2019.4.9f1), developed by Unity Technologies (San Francisco, CA, US). It makes it possible to reproduce virtually innumerable stacked piles (see
Figure 1) and consequently it is not necessary to measure so many stacks in the field.
The objective of this study was to test the simulation model for analyzing the effect of two influencing parameters on the stack volume and implicitly, on the conversion factors as well. In this exemplary case, the effect on the stack volume of the parameters taper and crookedness is analyzed, as well as the proportions of crooked and tapered logs in the stack by using the simulation model.
2. Materials and Methods
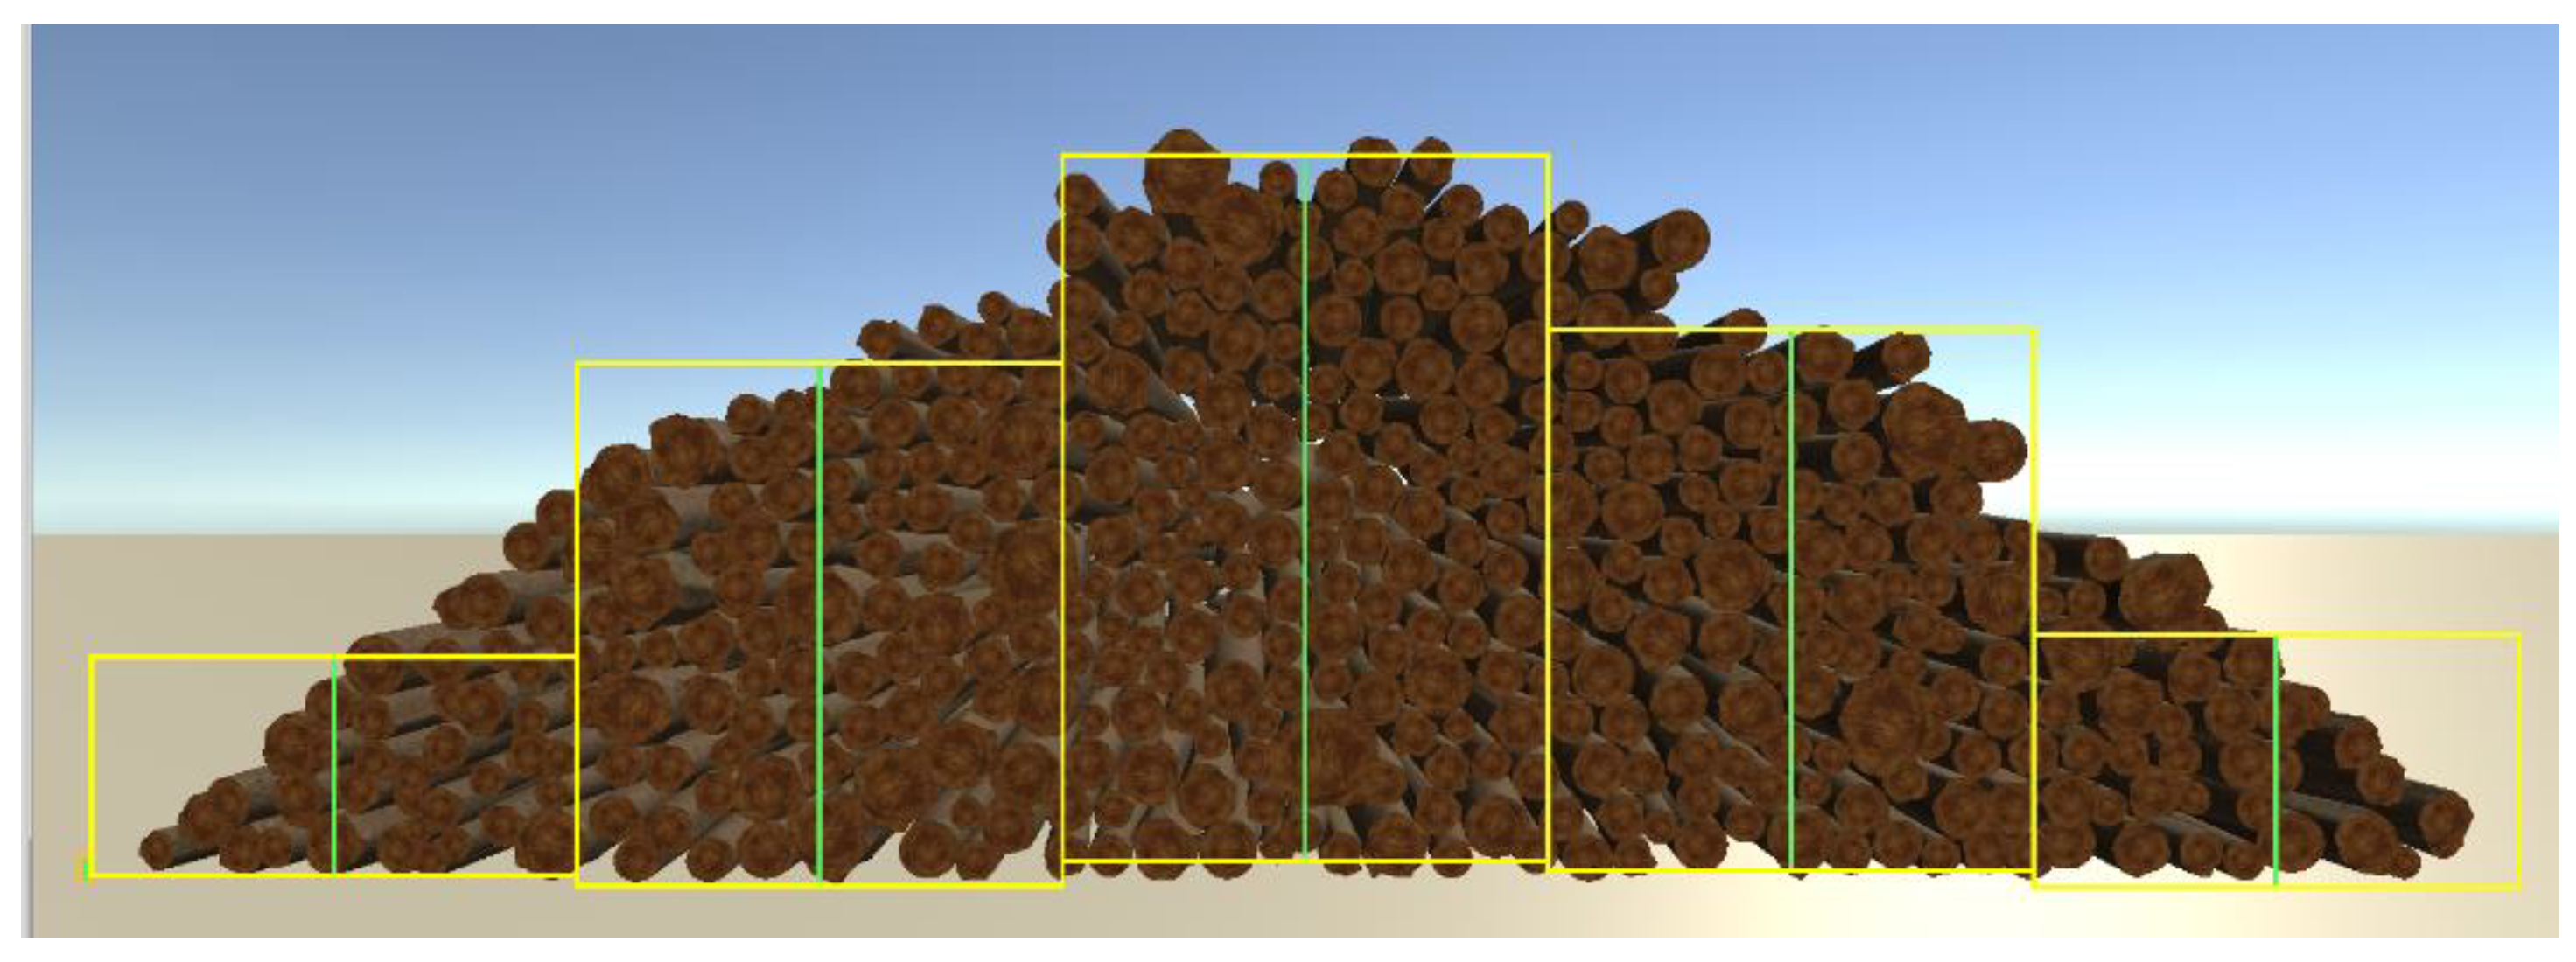
The model can simulate an enormous number of stacks in 3D and measure them in accordance with one of the manual measurement methods which is described in the German framework agreement for the roundwood trade (RVR) [
13]. It means that the simulation model reproduces virtually the execution of this measurement method to calculate the stacked cubic volume. The virtual reproduction of the measurement according to the manual method included in the RVR is represented in
Figure 2.
In addition, the model calculates the solid wood cubic volume of stack by adding up the volume of each one of the logs which constitutes the stack and provides the conversion factors according to those methods.
The program consists of several interfaces: the first ones are designed to introduce the data related to the log and the pile to be simulated such as the minimum length, the angles of the stack sides and the proportion of logs stacked in a certain direction. The data may be actual or selected arbitrarily by the user. Another interface corresponds to the simulation parameters, specifically, the number of stacks to be simulated. The last interface shows the results which can be exported as, e.g., a.csv table.
A preliminary model validation was conducted using measurements of real stacks. To do so, 405 logs of Norway spruce (
Picea abies L.) were measured according to the methodology described below. After that, the logs were randomly stacked 10 times by a forwarder and the stacks were measured according to one of the manual methods outlined in the RVR [
13]. These data were introduced into the simulation model. After that, 10 simulations with 10 simulated stacks respectively were carried out. The simulation results were compared with the measurements of the real stacks by assessing the error through calculating RMSE [
14] and Mean Bias Error (MBE) [
15].
The results demonstrate a small deviation. The average RMSE is 1.2 m3 (st) and ranges from 0.9 m3 (st) to 1.6 m3 (st). It implies an average deviation of 2.6% which ranges from 2.0% to 3.4%. The average MBE is −0.02 m3 (st) and ranges from −0.4 m3 (st) to 0.5 m3 (st). It implies an average deviation of −0.06% which ranges from −0.9% to 1.1%. The average MBE indicates that the simulation results are underestimated. In the near future, it is intended to carry out more analysis in order to establish a more reliable validation of the model.
To analyze the influence of crookedness and taper, a database of real logs of Scots pine (Pinus sylvestris L.) was created with the following parameters, which were measured on 1000 logs:
The log length, measured by means of a forest tape. These data are expressed in meters, rounded to two decimal places.
The diameters at both ends and at the midpoint, measured by means of a caliper. For each point two measurements were taken perpendicularly. These data are expressed in millimeters.
The logs’ crookedness, measured by setting a levelling rule on the curved log side and measuring the distance between the levelling rule and the log at the deepest point in millimeters. After that, this distance was divided by the log length. The parameter is then expressed in millimeters per meter.
The bark thickness, measured by means of a Swedish bark gauge. For some logs, where the bark was too thin, a ruler was used for the measurement at both ends of the log and the mean value of both measurements was computed. It is expressed in millimeters.
The taper of the logs, calculated by subtracting the average small end diameter from the average large end diameter and dividing it by the log length. This parameter is expressed in millimeters per meter.
Finally, log ovality was computed by dividing the smaller diameter by the bigger diameter of each measurement point and calculating the average of the three resulting values (large end, small end and midpoint of the log). The measurement of this parameter results in a factor between 0 and 1, where 1 represents a round log.
The logs measured belonged to an assortment of “industry wood”. Their average midpoint diameter was 23.1 cm, ranging from 10.6 to 43.3 cm, while their length was 3.01 m.
The stack parameters remained unmodified for all simulation sets. The sides’ angle for each stack was set to 45°. The minimum stack length was 10 m for the taper analysis and 12 m for the crookedness analysis. This difference in length is due to the different number of logs in the data sets. The proportion of the stacking direction of the logs on each side was set to 50%. This means 50% of the logs were stacked forwards and the others were stacked backwards.
From the original database, 750 logs were selected at random by taking into consideration their crookedness. This means those logs whose values, taking into consideration this parameter, were more than zero (i.e., the logs were crooked) were chosen. The selection of this particular number was chosen in order to form three different data sets with the same number of logs, 250, and a similar crookedness degree. As a result, 250 logs from the original database were discarded. In doing so, the first group corresponded to logs with a crookedness degree less than 10 mm/m. The second group corresponded to logs with a crookedness degree from 10 to 20 mm/m. The third group corresponded to logs with a crookedness degree of more than 20 mm/m. This classification is based on real measured data and was used to analyze the influence of those three crookedness degrees on the stack volume. The average values of the main parameters of those three data sets are represented in
Table 1. In combination with these three groups of different crookedness levels, five data sets were created in order to analyze the influence of the proportion of crooked logs in a stack: the first data set contains the original data from real logs, where 100% of the logs are crooked. In the second data set, the crookedness for 20% of the logs was modified to zero and 80% remained unaltered (i.e., crooked). The selection of these logs was performed randomly. According to this method, three additional data sets were created with (i) 50% of the logs being crooked, (ii) 20% of the logs being crooked and the last one with (iii) only straight logs. This was performed for each of the three crookedness degrees selected (see
Table 2).
To analyze the influence of taper, 700 logs were selected at random from the original data base by taking into consideration their taper values. The selection of that number aimed to form two different data sets with the same number of logs, 350, and similar taper degree. Consequently, 300 logs from the original database were discarded. The first class corresponded to those logs with a taper degree less than 10 mm/m. The logs from the second class presented a taper degree of more than 10 mm/m. This classification was done based on the measured logs. Still, the differentiation of taper in two classes corresponds to the division of the Swedish model [
11] or to the classification done by Richter [
16]. The analysis was performed in the same way as described before for the crookedness parameter. The average values of the main parameters of each data set to analyze the influence of those two taper degrees on stack volume are represented in
Table 1 and the influence of the proportion of tapered wood in pile on the stack volume in
Table 2.
In total, 150 stacks were simulated for each data set. After that, the average stack volumes, which were measured according to the RVR method, were analyzed using the programme RStudio (version 1.4.1103) developed by RStudio, Inc. (Boston, MA, US) [
17]. For the visualization of the simulation results the package
ggplot 2 was used [
18]. The calculation of the RMSE and MBE was conducted using the packages
hydroGOF [
19] and
tdr [
20].
4. Discussion
The simulation results show that crookedness exerts a direct influence on the stack volume: The higher the proportion of crooked logs in the stack, the larger the stack volume. The results confirm the hypothesis that curved logs occupy a larger space in the stack than do the straight ones, producing voids. This same hypothesis can be found in the conclusions of several previous research results [
6,
9,
12,
21,
22] as well as in the roundwood measurement guidelines for some countries such as Ireland [
23], The United Kingdom [
24,
25] or Sweden [
11]. Moreover, from the simulation outcomes, the grade of variation from the influence exerted by the different crookedness degrees and the proportion of crooked logs on the stack volume was accurately predicted.
In regard to precise stack volume variation ratios according to the different crookedness degrees, only a few references could be found. Heinzmann concluded that a moderately negative correlation coefficient exists for this parameter based on data from 33 stacks [
9]. He did not define variation ratios nor crookedness degrees. In addition, his conclusion was also affected by other parameters, e.g., the mean diameter, the ovality and the taper degree. Due to this fact, the results are not comparable, even though they could be interpreted as having a moderate influence on the stack volume, which would correspond to the simulation results.
The Swedish model determines different crookedness degrees based on visual assessment and provides variation ratios for each crookedness degree [
11]. Those ratios indicate a linear relation between the variations of the conversion factors and crookedness degrees. This linear relation can also be deduced from the English method. It determines a reduction in the conversion factors by 2% for every 5% of average curvature [
25]. The variations from the conversion factors can be interpreted as variation of the stack volume assuming there is a constant solid wood content. Thus, those relations which appear in the references can be compared with the simulation results which consider the stack volume variation. The simulation results support the Swedish and English statements only concerning the linear relation for a crookedness degree between 10 and 20 mm/m. Concerning the other two crookedness degrees, the results showed that the lines do not demonstrate a linear relation but rather a decreasing slope as the proportion of crooked logs increases which can be seen in
Figure 3. Furthermore, the increment of the stack volume when increasing the proportion of crooked logs for a low crookedness degree was insignificant.
In addition, the results indicated that whereas the stack volume variation is barely noticeable for the smallest crookedness degree, the variation increases considerably for larger degrees. No reference to previous analysis of the stack volume variation according to different proportions of crooked logs in the stack was found.
According to the simulation results, taper exerts an indirect influence on the stack volume. The simulation results revealed a reduction in the stack volume as the proportion of tapered logs was increased. This fact is due to a reduction of the solid wood content in the stack to a similar degree as well. However, the outcomes indicate different relations for each variation. The increasing variation of proportion of tapered logs in the stack with a taper degree less than 10 mm/m showed that such a decrease in the stack volume follows a linear relation. In contrast, in the case of a higher taper degree, the stack volume decreases at a more rapid rate than a low taper degree when the proportion of tapered logs in the stack is increased as depicted in
Figure 3.
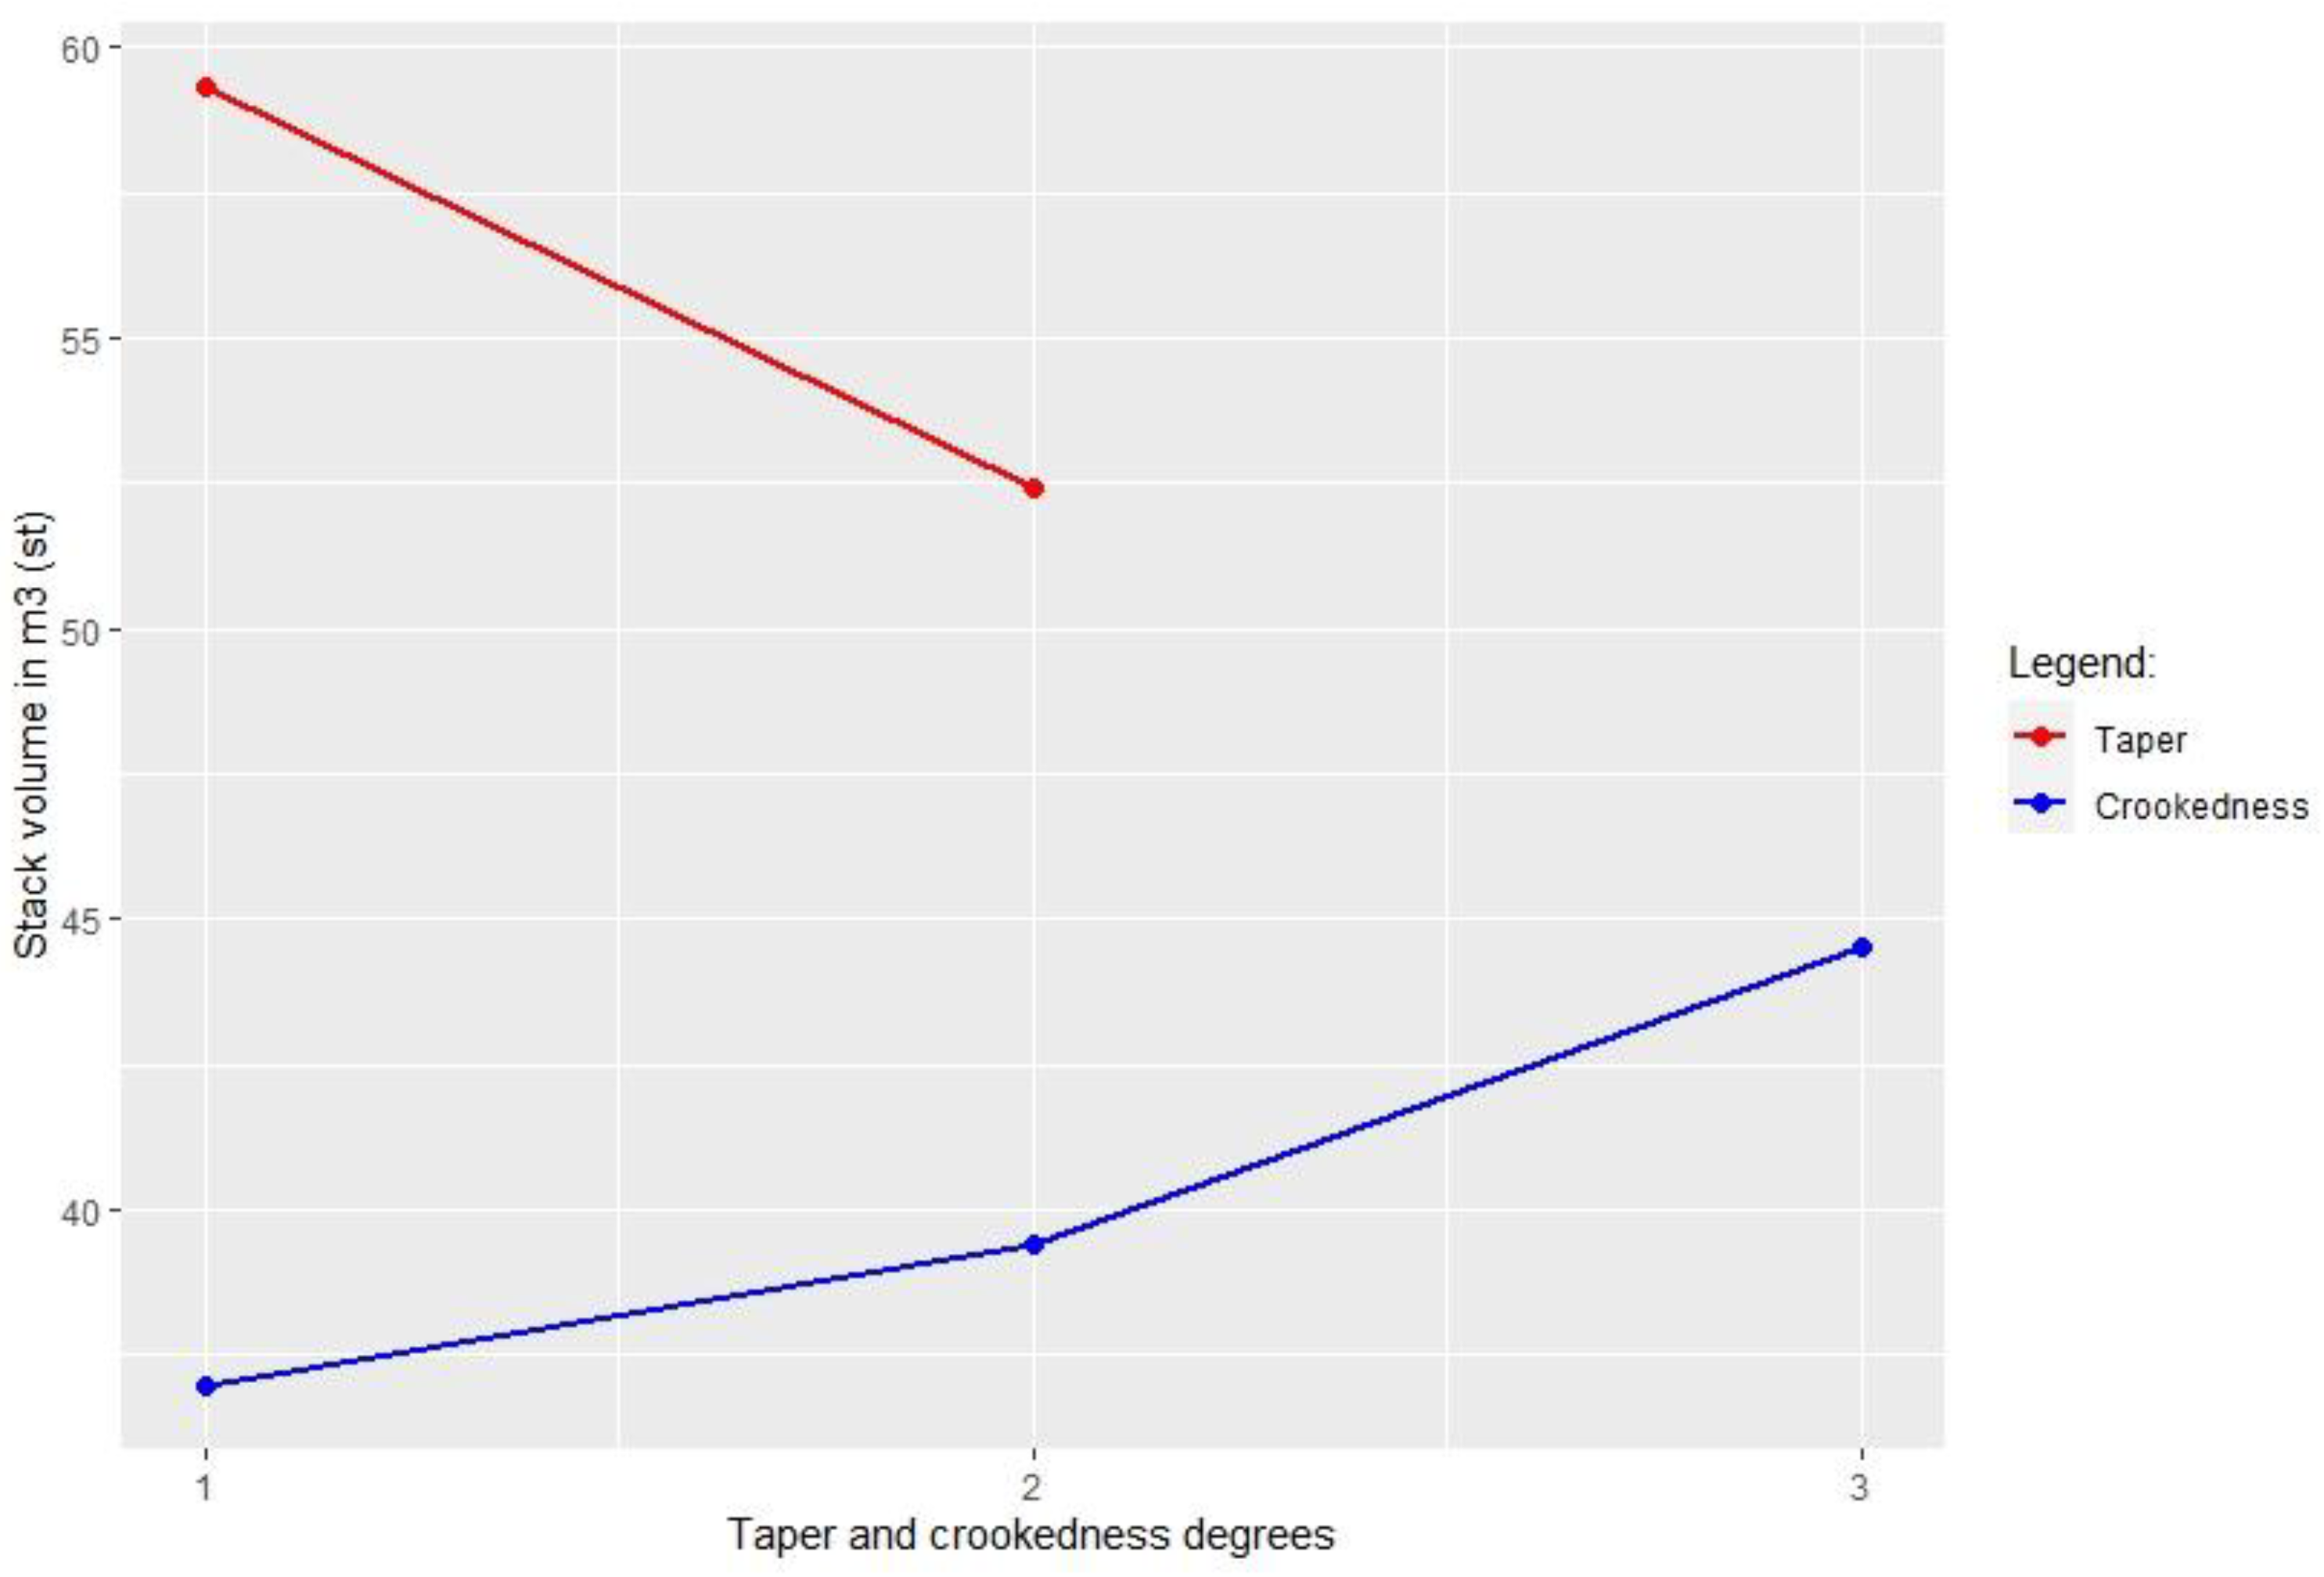
A similar decreasing trend was obtained as the taper degree was increased, and the proportion of tapered logs and other parameters remained unaltered as depicted in
Figure 4. Considering that the stack volume and the solid wood content are reduced to a similar degree, this parameter has a modest effect on the conversion factors according to the simulation outcomes. This slight influence from the taper on the conversion factors is reflected in the English and Swedish method as well [
11,
25].
In regard to the stack volume variation for different tapering degrees, the results from Heinzmann’s study showed a negative correlation [
9]. That statement could be understood as a small decreasing variation. Thus, it is in line with the simulation results for a high taper degree. However, the estimation of that correlation was also affected by other parameters. Thus, a comparison between both results is only partially possible.
According to the simulation results the parameter which most influences stack volume for values less than 20 mm/m is the taper. A comparison which considers taper and crookedness values over 20 mm/m cannot be achieved based on the obtained results.
Finally, it must be pointed out that the simulation model cannot reproduce burls or infrequent crookedness forms which can be found in the natural environment. Neither can it take into consideration the singularities of the terrain, such as an uneven or rough ground under the stack. In such specific cases, the model is unable to accurately provide the stack volume.
Based on the simulation results, purchasers of round wood can estimate the degree of influence a parameter will have on the stack volume and, in turn, on the solid wood content. In theory, this will allow them to estimate the solid wood content more efficiently by means of a quick visual assessment of the logs that constitute the stack. In addition, these simulation results might serve to further develop new guidelines for measuring stack volumes.
5. Conclusions
As shown, the crookedness exerts a considerable influence on the stack volume. Therefore, provenance regions, where roundwood is more crooked because of genetics patterns or site conditions, should be considered when purchasing roundwood, since the solid wood content of a stack will be much lower in comparison to regions where the trees present lower crookedness degrees. In a similar fashion, the tapering exerts a considerable influence on the stack volume as well. However, its effect is irrelevant in the conversion factors.
The results of this work demonstrate furthermore the capacity of the simulation model to obtain large databases for statistical analyses, further reinforcing the solidity of the results. The simulation model provides credible and accurate results which can serve as a basis for future investigations and the creation of a measurement method which unites the different stack volume measurement methods, e.g., in the European countries. However, it is necessary to perform more simulations with further data sets to determine the influence other parameters might have on the stack volume such as length of the logs or midpoint diameters and the resulting influence a combination of the aforementioned parameters could provoke.


