
Detection of Scots Pine Single Seed in Optoelectronic System of Mobile Grader: Mathematical Modeling


1
Mechanical Department, Voronezh State University of Forestry and Technologies named after G.F. Morozov, 8, Timiryazeva, 394087 Voronezh, Russia
2
Southern Swedish Forest Research Centre, Swedish University of Agricultural Sciences, P.O. Box 49, SE-230 53 Alnarp, Sweden
3
Faculty of Forestry, University of Agriculture in Krakow, Al. 29 Listopada 46, 31-425 Kraków, Poland
4
Prokhorov General Physics Institute of the Russian Academy of Sciences, GPI RAS, Vavilov Street 38, 119991 Moscow, Russia
*
Author to whom correspondence should be addressed.
Forests 2021, 12(2), 240; https://doi.org/10.3390/f12020240
Submission received: 5 December 2020
/
Revised: 11 February 2021
/
Accepted: 17 February 2021
/
Published: 20 February 2021
(This article belongs to the Special Issue Forestry Production Process Automation and Robotization)
Abstract
:The development of mobile optoelectronic graders for separating viable seeds by spectrometric properties with high detection accuracy represents a very relevant direction of development for seed handling operations. Here, the main parameters of the radiation source and receiver for detecting a single seed in the diagnostic system of a mobile grader were modeled based on the principles of technical optics using Scots pine (Pinus sylvestris L.) seeds as a case study. Among the pine seeds in the seed batch, there are fossilized and empty seeds that are exactly the same in geometric and gravitational parameters as live seeds. For their separation from the seed batch, data from spectrometric studies in the near-infrared (980 nm) region can be used. To substantiate the parameters of the light source, a geometric optical model of optical beam formation was considered, while the energy model of optical beam formation was considered to substantiate the parameters of the light detector. The results of this study show that the signal value depended on the orientation of a single seed relative to the recording window. The beam angle from the radiation source should be within 45 degrees. The difference between the optical streams should be 50 microns, which made it possible to clearly detect the signal at a standard noise level of 15 microns and signal-to-noise detection accuracy ratio of 56.3 dB. This study expands theoretical knowledge in the field of the spectrometric properties of a single seed, considering the cases of its orientation relative to the optical beam, which affected the effective area of detection of the seed. The obtained data on the location of the main elements of the diagnostic system will speed up the design of mobile optoelectronic graders, and the development of a contemporary protocol for improving Scots pine seed quality.
1. Introduction
High quality tree seeds are a prerequisite for successful afforestation and reforestation programs [1]. High quality seeds are those that germinate and produce a normal seedling in a reasonable time [2]. These seeds should be sorted out from the seed bulk to ensure production of the desired number of seedlings in the nursery. A seed lot of Scots pine is usually composed of viable seeds, empty, and dead-filled seeds, with the latter two being non-viable and unable to produce seedlings when sown. In Scots Pine seed lots, it is not uncommon to find 10%–30% non-viable seeds [3,4,5]. Our observations also showed that in some cases, sowing Pinus sylvestris L. seeds of standard first-class with a laboratory germination of 90% reduces container germination by up to 70%. This is mainly because many conifers produce non-viable seeds, such as empty seeds and dead-filled seeds, due to pollination failure and post-zygotic degeneration [6]. That is, in a standard container of 40 cells, only 28 cells are occupied. For 1000 containers, we will obtain only 2800 seedlings instead of 4000 seedlings. Thus, 1200 container cells are idle and cannot be used for anything, with each of them receiving its share of irrigation and heat in an automatized nursery, thus, making nursery operations inefficient. The selection of forest tree seeds for nursery use should be focused on obtaining seed material with the expected biological characteristics. This is done using the correlation of seed germination capacity with their physical properties [7,8]. These properties, called distribution characteristics, mainly include mass, density, size, shape, aerodynamic characteristics, coefficient of friction, surface texture, etc. [9,10], and different sorting methods based on these characteristics have been developed.
Due to the low efficiency of these methods, an optical grading technique has been continuously developed. Notably, the use of optical radiation for spectroscopic diagnostics and analysis of woody biological objects (seeds, plants, fruits, wood composites, natural biopolymers) was studied [11,12]. The basic link that unites the technological processes for improving the physiological quality of forest seeds—and the seedlings obtained from them—is the spectrometric feature [13,14]. An optical beam of a certain wavelength, passing through or diffusely reflected from a single seed, causes a certain response in its structure, allowing, depending on the exposure and wavelength, non-destructive detection and subsequent grading. The seed spectrometric feature, both in the visible (VIS) and near-infrared (NIR) regions has a low identification error [15], and is best suited for automating seed grading processes [16]. The color and gloss of seeds are already used today to separate the seeds of forest trees. In forestry, with phenological observations, the color of seeds is still determined by the organoleptic method. However, the human eye is subjective and cannot make a clear quantitative gradation along the wavelength in the visible range, let alone in the infrared range. Therefore, there is a need for a detailed analysis of the spectrometric properties of seeds, including features not yet used in forestry, but which should be taken into account when designing future universal graders. The coat color features are used for the separation of Scots pine seeds [17], but their significance remains to be studied in the future [18].
The development of mobile optoelectronic devices for separating seeds by spectrometric properties, which have high speeds [19] and detection accuracies, is a very relevant direction for the development of seed handling operations in the forestry sector. Consequently we developed an optoelectronic grader [20,21,22] for upgrading seed lot quality by sorting viable and non-viable seeds. Evaluation of the stochastic model of the single seed detection process in the optoelectronic system of the mobile graders shows that the algorithm is extremely sensitive to the error value of the detection criterion in the near-infrared region [23]. Electromagnetic radiation in the near-infrared region of the spectrum is traditionally defined by a wavenumber in the range ν = 12,821–4000 cm−1 or wavelength in the range λ = 780–2500 nm [24], but the range is conditional since the properties of radiation gradually change with changes in the wavelength [25]. When near-infrared radiation interacts with biological samples, it causes overtone and combination bands of the fundamental molecular bond due to deformation and valence vibrations in the sample, especially stretching and bending [24]. According to the classification of normal vibrations [25], valence vibrations generally occur when the lengths of molecular bonds change, and the angles between these bonds remain unchanged. For instance, valence vibrations of a water molecule are detected at the wavenumber ν = 3652 cm−1, for С–Н bonds at ν = 3373.7 cm−1 [25]. In turn, deformational vibrations, which occur at lower energy costs, are detected at a longer wavelength ν < 1400 cm−1.
Near-infrared radiation is widely used for the non-destructive detection of forest seeds [26]. It provides the molecule with energy sufficient only for transitions between vibrational and rotational levels of the ground state [24]. For example, electronic O-vibrational transitions in molecules occur at a wavelength range of 870–980 nm [25]. The efficacy of the optical detection system depends on a number of factors, including the shape and size of the sample, the intensity of the radiation source, and the sensitivity of the detector system [24]. Thus, the aim of this study was to evaluate the geometric and energy models for detecting Scots pine single seeds by NIR diffuse reflectance spectrometric features in the mobile grader diagnostic system. We believe that the theoretical justification is an integral part of the production process for the automatization of a seed grading system for improving forest seed quality, thereby increasing the number of seedlings per unit area of containerized nursery.
2. Materials and Methods
2.1. Seed Samples
Scots pine (Pinus sylvestris L.) seeds were used to evaluate the effect of seed positioning (geometric shape of the seeds) and the energy needed to detect single seeds using an optoelectronic grader. Seeds were obtained from cones collected in a natural forest stand of the Voronezh region, Russia [18]. The dimensions of seeds are affected by geographical location, the habitat and soil type, the genetic traits of tree stands, weather conditions, and even cone location in the tree crown. It should be noted that the age of the Scots pine parent stands affects the dimensions of seeds [27]. The seeds were slightly larger than those previously harvested, for example in the north-eastern regions of Poland. However, the extent of dimensional changes of seeds does not require a variation of the operating screens [28]. The analyzed seeds were also more similar compared to the sowing material originating from southern Europe [29,30]. The sample had a variety of shapes and were therefore characterized by three sizes: length (largest size), width, and thickness (smallest size). This can be modelled approximately by analogues of bodies that have a mathematical description or by their combination. The shape of the seed is modeled as an elongated ellipsoid with semi axes a, b and c (Figure 1) as follows:
- , where ls is the seed length, equal to values from 4.82 to 5.7 mm;
- , where bs is the seed width, calculated using the empirical formula bs = 1.175 + 0.265ls, which is equal to values from 2.45 to 2.69 mm;
- , where ss is the seed thickness, calculated using the empirical formula ss = 0.342 + 0.448bs.
Note that these sizes are common for all seed lots of Scots pine, and the empirical formula for determining b and c was developed by us.
2.2. Optical Detection System
Figure 2 shows the scheme for the optical detection of a single seed in the diagnostic system of the optoelectronic grader. The diagnostic system includes a block of light source, a block of reflected radiation detector, a block of transmission and reflected radiation detector and closely interacts at the level of analog signals with an electronic control unit. An electronic control unit (usually including a multiplexer, analog-to-digital converter (ADC), and microprocessor) receives optical measurement signals; i.e., diffuse reflectance, from the detector, summarizes them in a multiplexer, and transmits them via an ADC to a microprocessor which processes them using fuzzy logic methods and transmits the received control signal to the actuators of the mechatronic unit of the calibration system. Note that we focused on diffuse reflectance measurements in this system. Depending on the selected separation algorithm, the actuators change the trajectory of a single seed, directing it to the appropriate seed receiver 7 or 8.
In addition to counting the number of seeds, the microprocessor through the ADC processes the signals received from the photodetectors summed in the multiplexer, and issues a control signal to the mechatronic unit to move the seed receiver 8. Seed separation is performed according to the viability index determined by the absorbance values A. Photodetector 4, fixing the light stream reflected from the seed, transmits information to the microprocessor. The signal is detected by the microprocessor for a specific type of seed based on the known ratios of the absorbance values A.
Before modeling the mobile grader diagnostic system, it is important to consider the following parameters:
- (I).
- The efficiency of all separator systems is based on the time of passage through the vertical seed pipe of a single seed, which must be greater than [21].
- (II).
- Based on numerical simulation of the movement conditions of a single seed in the mechanical system of the separating apparatus, the height Hsp (seed pipe) of the vertical seed pipe varies from 0.01 to 0.02 m with a diameter dsp from 8 to 10 mm [21].
- (III).
- Taking into account that the maximum seed length in the study was 5.7 mm (for convenience of calculation it was assumed to be equal to 6 mm), the probability of orientation of the seed relative to the side beam thickness, width or length was determined stochastically. For further calculations, the internal diameter of the seed pipe dsp is equal to 1.5 of the length of the seed, i.e., dsp = 1.5ls.
- (IV).
- To reduce the “noise” effect of the seed pipe material, it is necessary to provide recording windows 3, 3′ and 3″ (on Figure 2) made of a transparent material with a low refractive index (for example, quartz glass), made along the course of the reflected and transmission rays.
- (V).
- To ensure that the beam hits the seed, each window must have a slit shape with a length of at least 0.8 dsp and a thickness equal to the thickness of the light beam, or a circle shape with a diameter of at least 0.8 dsp.
- (VI).
- The shape of the optical beam must be sufficient to detect the seed of any size fraction and correspond to the shape and size of the recording window 3 (on Figure 2).
The justifications for assumption III are that there should be no repeated collisions of the seed with the wall of the seed pipe; that assumption IV is associated with an increase in the accuracy of seed detection due to a possible reduction in ray deviation, and assumptions V and VI are due to the shape and size of the beam of the near-infrared region.
As a separation criterion, it is necessary to use the seed absorbance value, A (Table 1), determined by the diffuse reflectance R (the ratio of the radiation flux reflected from the seed surface to the light source flux) or transmittance T (the ratio of the flow passed through the seed to the light source flux) and obtained on the basis of our own experiments, as well as from studies that assessed the reflectance spectra of seeds with different degrees of viability [6,12,15,24,31,32,33,34,35,36,37]. In Table 1, the first column provides information about the peak wavelengths that correspond to the fluctuations of functional groups contained in organic molecules belonging to the seed. If the monochromatic radiation, the wavelength of which coincides with one of the wavelengths of Table 1, falls on the seed, then the value of the diffuse reflectance R can be used to judge the degree of viability of the seed.
From the Beer–Lambert law [38], the absorbance value A of various organic substances in the layers (or on the surface of the seed coat) of a single seed can be determined by measuring the relative amount of radiant energy absorbed at each wavelength λ (in nm), in connection with which they (substances) exhibit different absorption intensity. Thus, measurements of the transmittance (T) and diffuse reflectance (R) can be converted to the absorbance value A as follows:
where R—diffuse reflectance, T—transmittance.
A = log(R−1) or A = log(T−1),
When measuring spectral transmission or reflection signals on a percentage scale, the absorbance value A is defined by the equation
where %R = 100R, %T = 100T.
A = 2 − log (%R) or A = 2 − log (%T),
The main provisions of technical optics are used to describe the trajectory and parameters of the beam movement created by a monochromatic radiation source (laser) reflected from a single seed, or passed through the seed, to the sensitive elements of radiation receivers (photodetectors) [39,40]. It was assumed that the seeds move in a strict sequence, without mixing, one after the other along the seed pipeline. During the passage of the gate between the registration windows, a single seed will be exposed to radiation, the intensity of the reflected and passing rays of which will be separated into fractions according to the criterion set by the algorithm.
3. Results and Discussion
3.1. Geometric Model of the Seed Detection Process
A fairly large variety of lasers have been developed that produce a beam of optical radiation in the NIR range. The KLM-H980-200-5 [41] laser module is recommended as the radiation source (see point 2 in Figure 2), as it produces continuous radiation with a wavelength of λout = 980 nm, close to the peak wavelength of the functional group O–H (see Table 1). The laser module at the output generates a beam of radiation with a diameter of Dout = 5 mm and power Pout = 200 mW. The power per 1 mm2 of the radiation beam is equal to
where Sout is the output beam square, , mm2.
P = Pout/Sout,
Then, for the specific power we have
The angular divergence of the radiation beam is 1 milliradian, or 0.0573 degrees. With this angular divergence, the radiation beam propagates almost parallel: at a distance of 100 mm, the beam diameter increases by 0.1 mm, which, of course, does not affect the size of the spot falling on the input of the first lens (see point 51 in Figure 2). Therefore, the location of the radiation exit point from the source must be no further than 100 mm from the 51-lens. Theoretically and practically, this value can be reduced to several tens of millimeters, leaving a certain distance (about 50 mm) for adjusting the optical part. Before entering the seed pipeline, the diameter of the parallel beam must be at least 2.5 ls, where ls is the length of the seed sample used in this particular study (ls 6 mm). Thus, the diameter of the dp beam must be at least 15 mm. To do this, it is necessary to provide a system of two lenses 51 and 52 before the input recording window 3 (Figure 3). If the lenses are placed at a distance of 100 mm from each other, then in order for a diverging beam to fall on window 3 (see Figure 3) and its diameter in place of the 52 lens is 15 mm, one must select lenses with the following foci F1 = 25 mm and F2 = 75 mm for 51 and 52 lenses, respectively. When the lenses are positioned at the minimum distance required for subsequent adjustment of 50 mm, F1 and F2 would be 12.5 mm and 37.5 mm. A symmetrical biconvex lens is selected everywhere, in which the ratio d/D << 1. If we consider the ratio D/d = k, where D is the diameter of the lens, and d is the thickness of the lens, then for n = 1.5, , .
For a lens with F1 = 25 mm and k = 10, we have d ≈ 1 mm and D = 10 mm.
When replacing the radiation source, as well as increasing the length of the detected seed, it is necessary to change the lens system to create a parallel beam falling on the window 3 (see Figure 3); replacing the source may be necessary when switching to another molecular band with its characteristic peak wavelength.
Since the beam in Figure 3 can be considered to be close to paraxial (infinitely close to the axis), only spherical aberration is possible. We do not seek to obtain a high-quality image of an object in a photodetector—in this case, a single seed, so the calculation of wave aberrations associated with the phenomenon of light diffraction is unnecessary. As mentioned above, there are no spherical aberrations of the paraxial laser beam.
It is very important to consider the process of reflectance from the seed of an incident parallel beam of radiation. A reflected beam of radiation is a diverging beam. This discrepancy is due to both the complex geometric shape of the seed and the matte of its surface, with three possible orientations relative to the window 3 (see Figure 2), as shown in Figure 4:
- Case 1: a single seed is oriented by LT projection (ab), that is, the length (L)–thickness (T) projection of a seed, forming the incidence of a beam when detecting, which is determined by the equation of an ellipse with semi axes a and b as . Here, x and y are axes of the coordinate system associated with the seed x,y-plane projection of the x,y,z coordinate system (see Figure 1).
- Case 2: a single seed is oriented by LW projection (aс), that is, the length (L)–width (W) maximum projection of the seed, which forms the incidence of a beam when detecting, which is determined by the equation of an ellipse with semi-axes a and c.
- Case 3: a single seed is oriented by TL projection (сb), that is, the thickness (T)–length (L) minimum projection of the seed, which forms the incidence of a beam when detecting, which is determined by the equation of an ellipse with semi-axes c and b.
All geometric dimensions are given in millimeters. This simulation seems quite reasonable if we compare this model with the average parametric model of the common pine seed [42]. For the maximum length of the seed ls = 6 mm, we have for bs = 2.765 mm, and for ss = 1.587 mm.
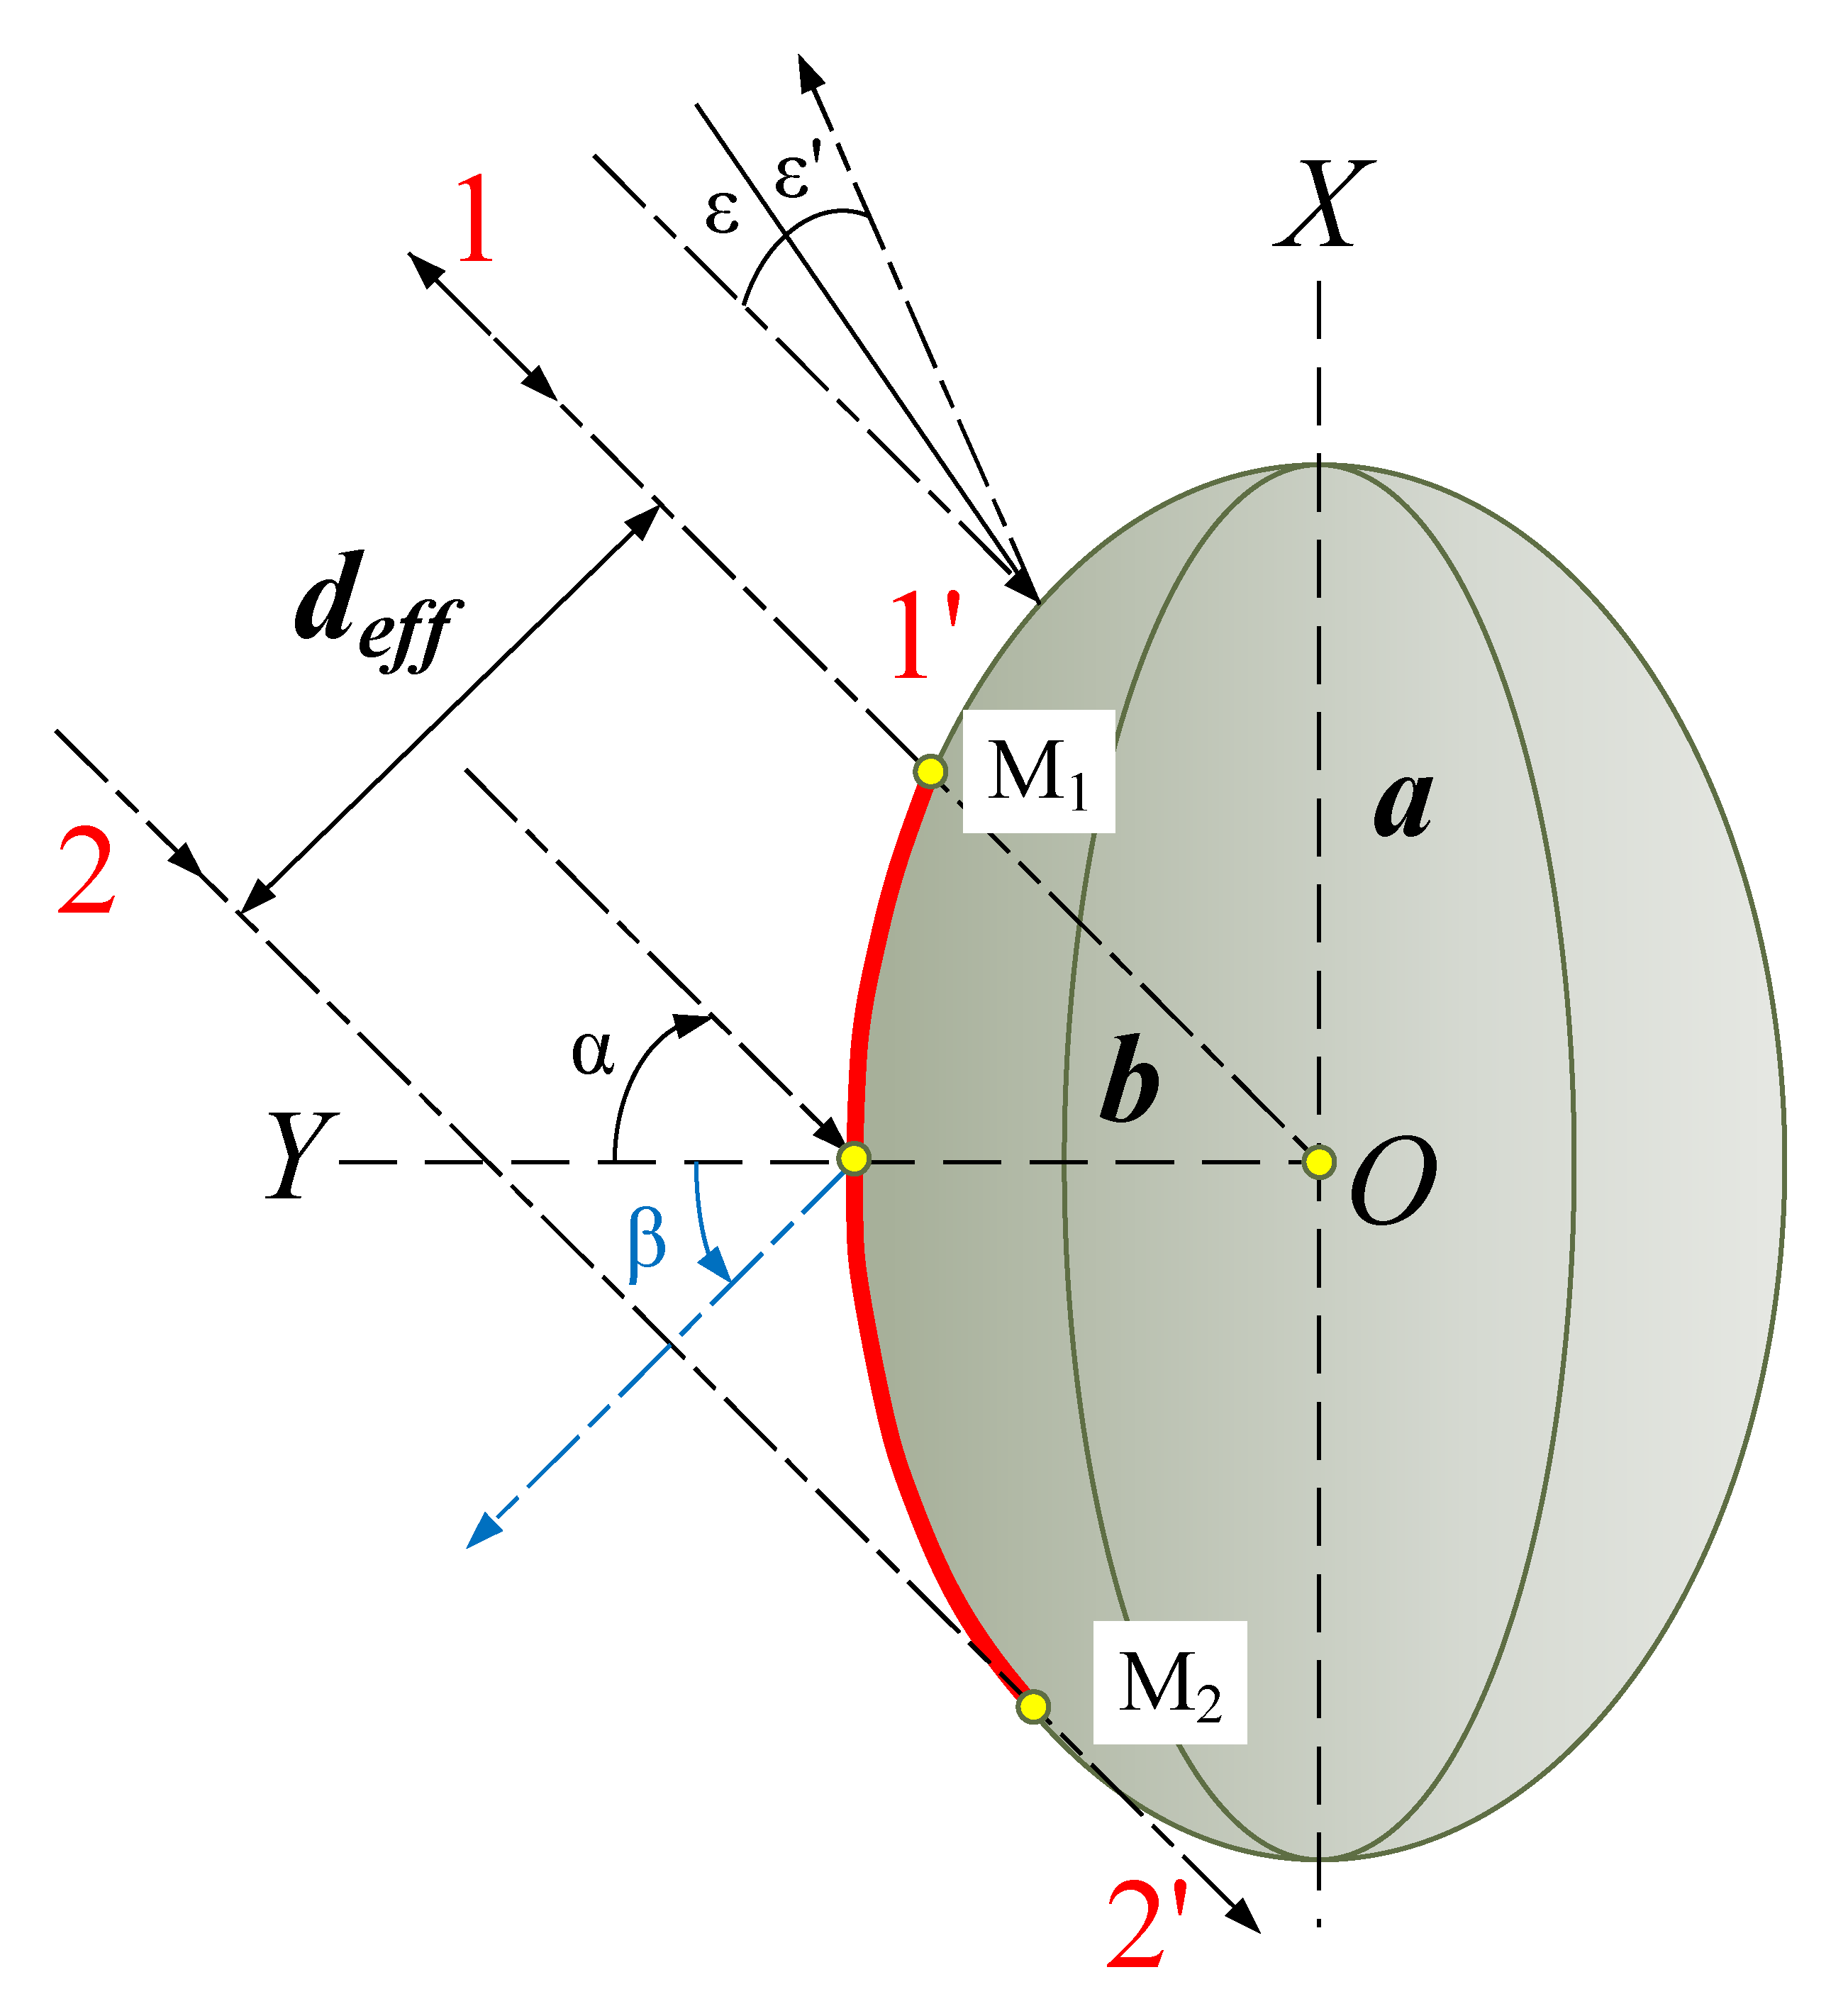
In the first case in the plane of incidence of the beam, the ellipsoid is an ellipse with the following semi axes , . In this case, the reflecting surface will be bounded by the two extreme incident beams (1-1′ and 2-2′) that are reflected from the surface of the ellipsoid (Figure 5).
Radiation that falls on an ellipsoid outside the critical point M1 is reflected at an angle that cannot be focused onto a photodetector (No. 4 in Figure 2). Radiation is reflected in the opposite direction from the photodetector, while at the critical point M1, itis reflected back. At the critical point M2, the incident ray slides along the surface of the ellipsoid. These two extreme rays determine the effective beam width deff. It seems obvious that a reflected beam of radiation with an angular width equal to 180° (the angle between rays 1′ and 2′) cannot be focused onto a photodetector. In this case, the main light flux will be reflected at an angle β = α according to the law of light reflection. It is very important to choose the angle of incidence α, and therefore, the angle of reflectance β. At small angles of incidence, it is difficult to separate the incident and reflected radiation streams. At large angles of incidence, the reflected flow will slide along the surface of the ellipsoid, while the entire flow will propagate in a large solid angle. Therefore, for consideration, we chose the angle of incidence α = 45° as a certain average value between the two-extreme means. We determined the position of the extreme points M1(x0,y0) and M2(−x0,y0) on the generated (ellipse) plane of incidence of the radiation that determines the effective angular width of the reflected beam (Figure 6).
The tangent equation at the point M1 (x0,y0) is
The derivative of the function y is equal to
where is the derivative of a function that is defined as an ellipse equation that has the coordinates of the center at the origin . The equation of the normal to the point M1 (x0,y0)
Angular coefficient of the normal to the Y-axis
where it is determined from Since the point M1 (x0, y0) belongs to an ellipse, then.
from where x0 and y0 are
The coordinates of the M2 point are defined similarly and are equal to
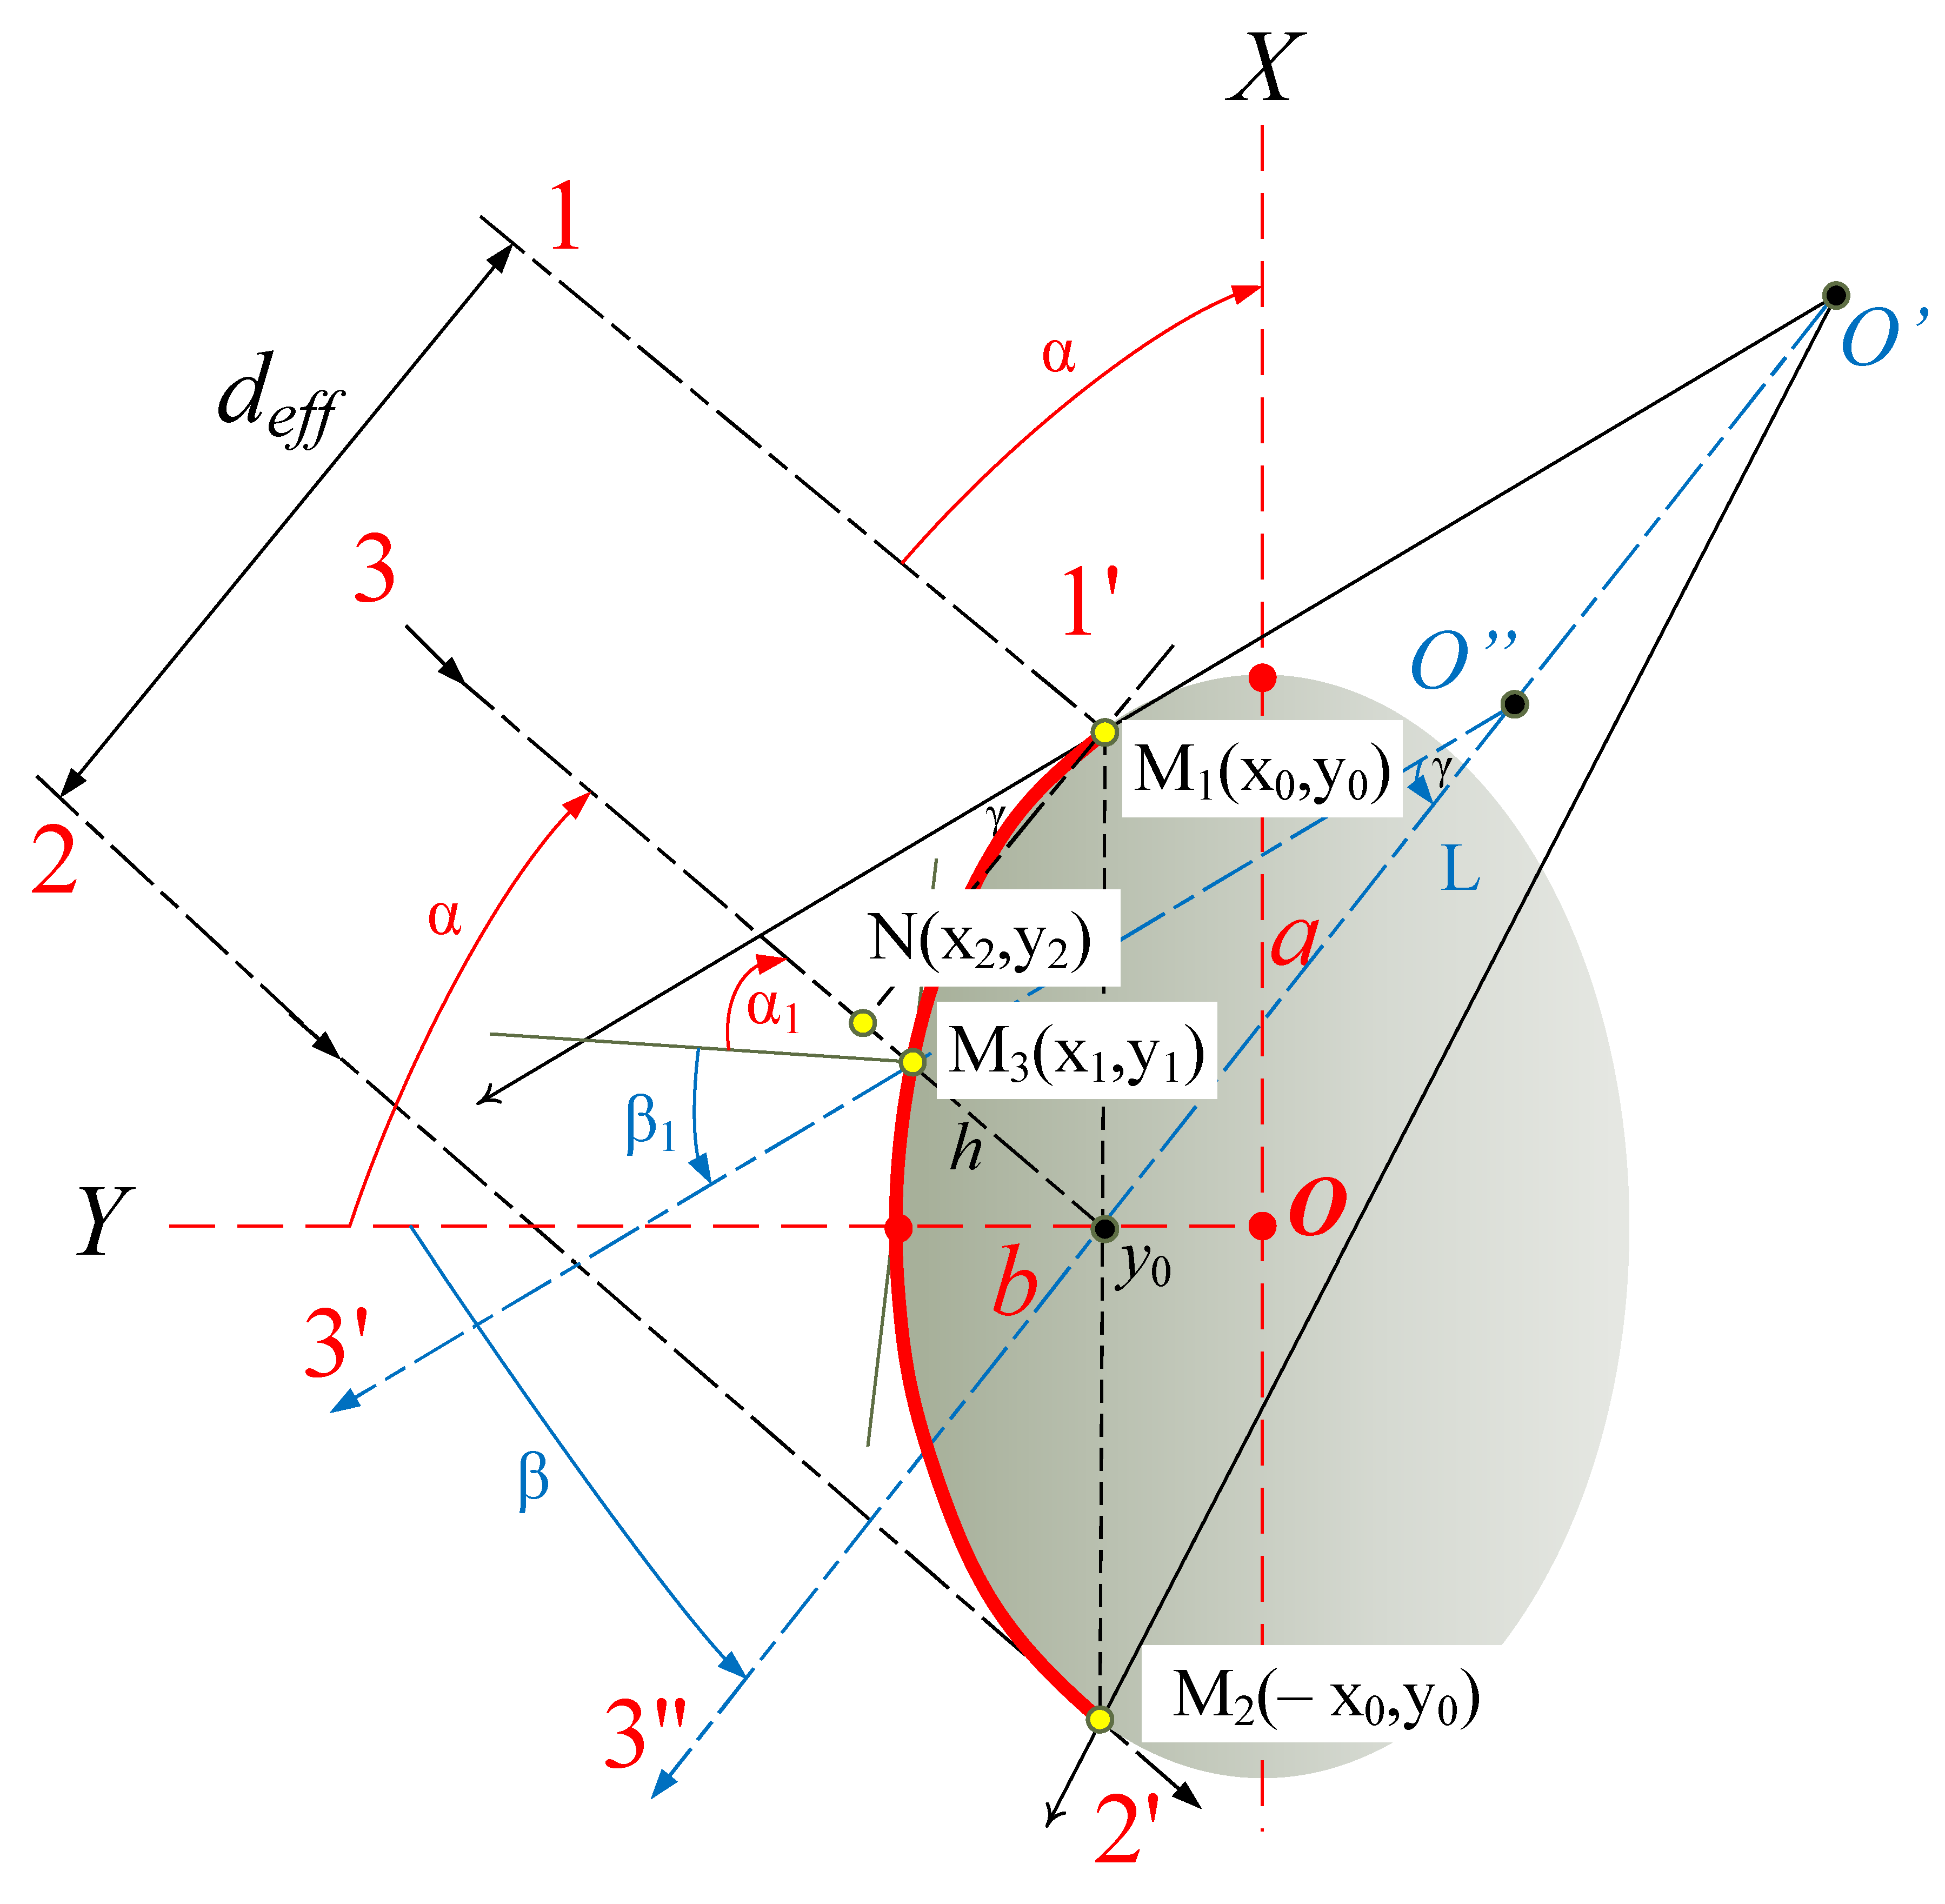
Next, we determined the effective width of the reflected beam of light that is to be focused on the photodetector (No. 4′ in Figure 2). The middle ray of light 3 (see Figure 6) of an optical radiation beam when falling on a plane passing through a straight line M1M2, perpendicular to the plane of incidence of the beam, will be reflected in the direction 3′, which will be the center of the reflected diffusion beam.
We found the direction of the 3′ beam of reflected light by the law of reflectance at the point M3 (x1,y1). After making calculations similar to finding the coordinates of points M1 and M2, we obtained the following equation for the tangent and normal to the point M3.
The equation of the tangent
The equation of the normal
To find the coordinates of the point M3 (x1, y1), we continued the tangent to the point M1 (x0,y0) until the intersection with the middle ray of the effective beam at point N (x2, y2). The distance between points M1 and N is equal to
Using the fact that the point N lies on the tangent, we obtained the following relations for the coordinates x2 and y2
For straight M1N and middle ray 3 (see Figure 6) we obtained the equation of the line in segments
These lines are perpendicular to each other, so their coefficients are related as follows:
where, for the y1 coordinate, we obtained
On the other hand, the point M3 (x1,y1) belongs to an ellipse, that obeys the following equation
The half axes of the ellipse are equal to a = 3.0 mm and b = 0.8 mm. For coordinates of points M1, M3, and N, we obtained x0 = 2.8988 mm, x1 = 0.579 mm, x2 = 1.4494 mm, y0 = 2.8988 mm, y1 = 0.579 mm, y2 = 1.4494 mm. Using these values, we determined the angle α1 = β1 of the beam incidence, which denotes the middle of the effective beam on the ellipse, which is equal to α1 = β1 = 41.998 ≈ 42°.
From the geometric relations and corresponding calculations in MathCad, we found the angle γ, which was numerically equal to γ = 6°. Next, we considered the direction of reflectance of the central ray from the plane y = y0.
Drawing a straight line through the point M1 parallel to the ray 3′ reflected at the point M3 (x1,y1), we obtained the first border of the beam reflected from the matte surface of the seed. The intersection of the continuation of this boundary with the beam 3″ reflected from the plane y = y0 represented the focal point for the collecting lens 5′ (see Figure 2). The calculation gave a focal distance of f5′ = 46.5 mm and a lens diameter of d5′ = 15 mm.
If the seed is rotated at the time of passing window 3 (on Figure 2) by 90° relative to the first position (the “width” will face the window or be oriented by the semi-axes , ), the ellipse will have the following semi-axes a = 3.0 mm and b = 1.3825 mm.
Making the calculation according to the scheme proposed for the first case, we obtained x0 = 2.7250 mm, x1 = 0.7585 mm, x2 = 1.362 mm, y0 = 0.579 mm, y1 = 1.337 mm, y2 = 1.941 mm, and the angle α1 = 38.131°, the angle γ = 13.738°, and the focal length value f5′ = 34.807 mm with the lens diameter d5′ = 20 mm.
For the third possible case (the seed is oriented by the semi-axes , ), we have a = 1.3825 mm and b = 0.8 mm, x0 = 1.197 mm, x1 = 0.370 mm, x2 = 0.598 mm, y0 = 0.579 mm, y1 = 0.771 mm, y2 = 0.999 mm, α1 = 35.867°, γ = 18.265°, and focal length f5′ = 28.41 mm with a lens diameter d5′ = 25 mm.
Since the orientation of a single seed in accordance with the third case (Figure 4c) is unlikely, due to the fact that the center of inertia of the seeds is located in the “lower” part of the seed, it would be most likely that the orientation of the seeds is in accordance with the second case (Figure 4b) if it is considered along the length. Therefore, for the lens 5′, it is advisable to choose the parameters based on the calculation for the second case of orientation of the seed LW (ac) relative to window 3 (on Figure 2). It is important to bear in mind that both the first and third position of the seed makes it possible to focus the reflected radiation on the photodetector. Only in the first case, the largest possible reflected radiation will be focused, and in the third, the smallest will be focused. Thus, the calculations show that the radiation reflected from the seed will be focused into the photodetector in a fairly reliable way.
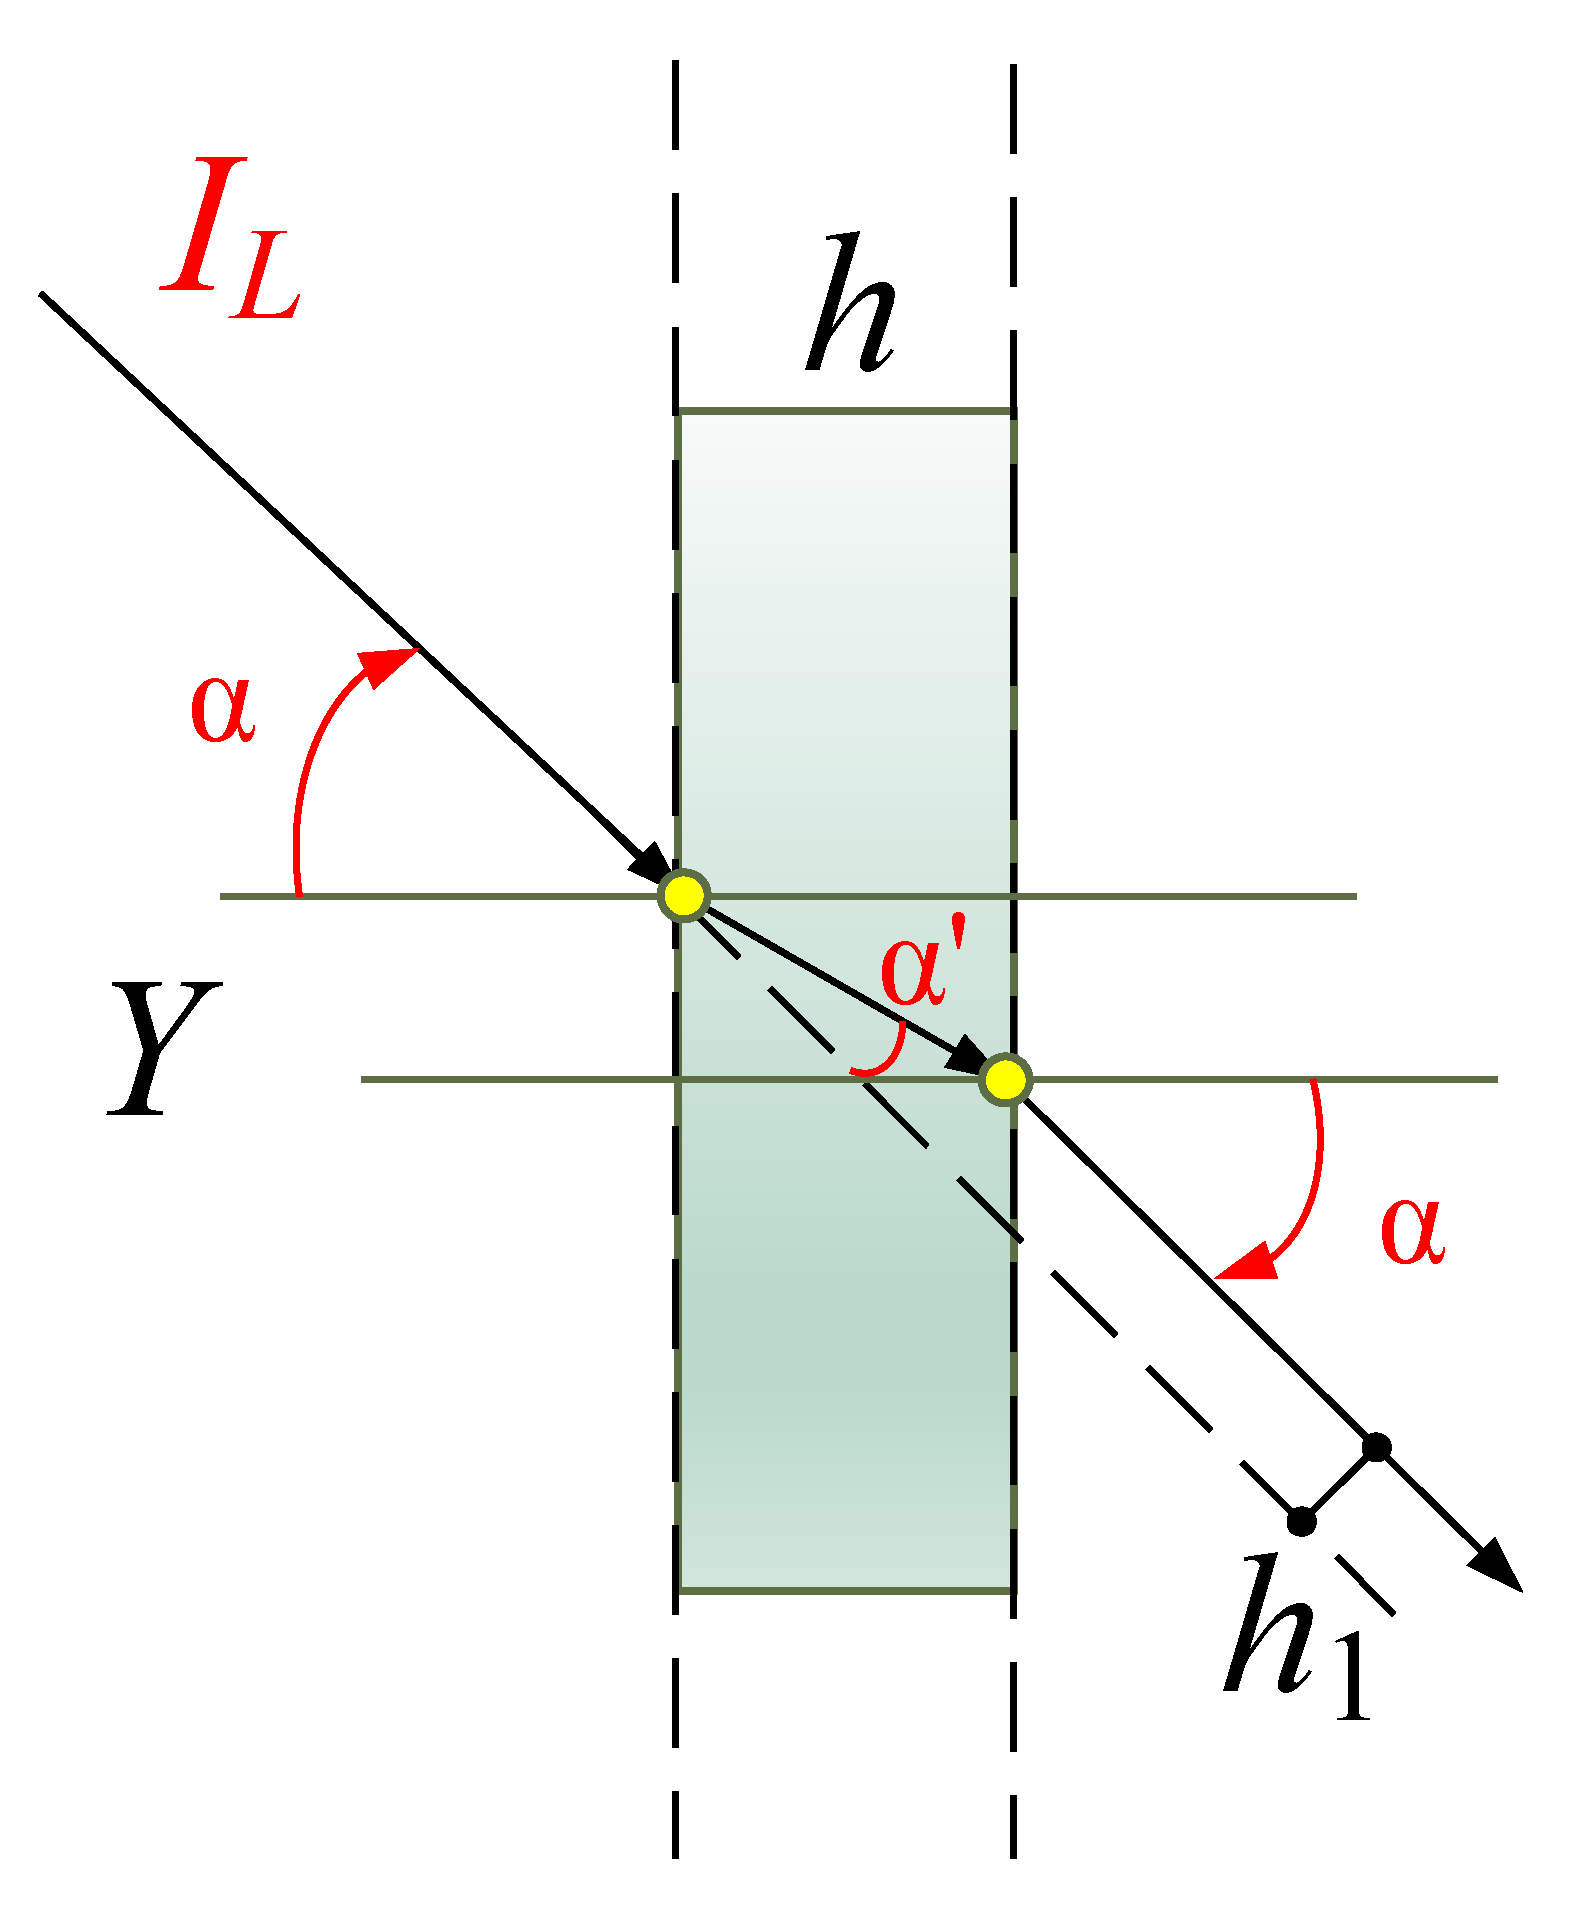
Next, we considered the passage of the beam (Figure 7) through recording window 3 (on Figure 2). Since the plane-parallel plate does not change the angle of propagation of the beam, but only shifts it by a small amount, as shown, for example, by Schröder and Treiber [40]:
where h1 is the transverse displacement of the beam, mm; α is the angle of incidence of the beam (the angle between the beam falling on the surface and the normal to the surface); α′ is the angle of refraction of the beam (the angle between the ray passing through the surface and the normal to the surface).
It follows from Snellius’ law that , where n is the refractive index equal to the quartz plate n = 1.52 for the wavelength λ = 2 mkm [39]. For the seed detection range (see Table 1), the wavelengths do not exceed 2 mkm, so the refractive index does not exceed the specified value.
The calculation using Equation (20) shows that for quartz with a plate thickness of up to 3 mm, the beam offset does not exceed 1 mm (the same value will be for the recording window 3 in Figure 2). The deviation of the beam does not have a strong effect on the change in the overall dimensions of the diagnostic system of the separation device, but should be taken into account when adjusting.
In the block of transmission radiation detector, a 5″ lens system is used to focus the beam that passed through the single seed. This lens system is similar to the lens system 51 and 52 of the block of light source (see Figure 2). Then, the focused beam enters the photodetector.
3.2. Energy Model for Optical Detection System
We considered the energy relations in the diagnostic system of a mobile optoelectronic grader. We assumed that the light flux falling on recording window 3 (on Figure 2) has an intensity of I0. Then, if the loss of reflectance and absorbance of light when passing through a thin transparent plate is not taken into account, a part of the light flux will pass through recording window 3 (on Figure 2), equal to
where is surface square of recording window 3 (on Figure 2) perpendicular to the optical axis, mm2 (); is the square of the parallel radiation beam formed by the 51 and 52 lens system of the block of light source (see Figure 2), mm2.
From here . Then, if the light flux IL falls on the seed, the effective detection area of which is equal to , where a and b are semi-axes of an ellipse (see Figure 6). The values of the semi-axes depend on which side the seed is oriented relative to recording window 3 (in Figure 2). Above, we considered three options for orientation, for them we have
The flow reflected from the seed surface cannot exceed the following intensities: , , .
We assumed that the entire flow, delayed by the seed in any of the three possible variants, does not pass further, and consequently, the flow that reaches the photodetector 4″ will be equal (without taking into account reflectance and absorbance in the lens system)
From the last relations it follows that the reduction in the luminous flux by a minimum of 4 % means that the seed has crossed the optical axis registered in the window in the seed pipe. At the same time, if the decrease is in the range of 4% to 8%, the seed was oriented towards recording window 3 (on Figure 2) with the lowest possible projection TL (cb) (see Figure 4c), if the decrease is in the range of 8 to 14%—by projection LT (ab) (see Figure 4а), over 14%—the maximum possible projection LW (ac) (see Figure 4b).
The values of the light flux for various categories of seed viability, dead-filled (NVP), Viable (V) and empty (NVE) seeds can be written as follows:
Depending on the value of the signal, the microprocessor sends a control command to the input of the mechatronic unit, in which an action of the executive mechanism corresponding to the selected separation algorithm is performed, leading to the redirection of the seed to the appropriate compartment of the seed receiver unit.
Before operating the mobile optoelectronic grader, it must undergo adjustment of the optical part and debugging of the separation process, which consists of the following:
- from the seed lots to be separated, three groups of seeds corresponding to the viability class are selected (see Table 1);
- when designing the grader, a stationary mode is provided, in which the seed is fixed motionless in one of three possible positions in relation to recording window 3 (see Figure 2);
- for each position of the seed, the value of the reflected and passing signal that has entered the photodetectors 4′ and 4″ is fixed, which allows the operator to select the intervals of the actual values of the reflected and passing light streams to separate the seeds according to various qualitative characteristics.
This process empirically establishes the exposure time and the frequency of seed feeding and does not coincide in time with the grading process. A fairly small number of seeds during the adjustment (no more than 10 in each batch) will reduce the separation time of subsequent batches, and the values recorded in the database will reduce the time spent on detecting the corresponding seeds with each new study. In this case, you can select the interval using the Student’s distribution.
3.3. Preliminary Assessment of Some Engineering Parameters of the Optoelectronic Grader
To determine the accuracy of detection of a single seed by radiation receivers, we estimated the noise that affects the quality of the signal in the photodetector. Further calculations were made on the basis of classical assumptions [42]. Noises that occur in the photodetectors of the diagnostic system have the following causes:
- shot (amplitude) noise;
- background current noise caused by background radiation;
- dark current noise;
- thermal noise.
According to Udd and Spillman [43], the signal-to-noise ratio (SNR) for a photodiode is determined by the formula
, or, expanded
where is current induced by an optical signal;
- is the equivalent current noise;
- is dark current of the receiver (photodetector);
- is any background current of the receiver;
- is the probability that an electron is formed in the receiver due to the action of a photon with energy hν, for most modern photodetectors ;
- e is the electron charge, 1.6 1019 A s;
- is the width of the signal;
- is the power of the optical signal detected at the receiver input;
- is the power of the background optical radiation incident on the photodetector simultaneously with the main signal;
- is the term of the equation due to thermal noise;
- is the ratio of the amplitude of the noise.
The diagnostic system of the mobile grader is mounted in a house that is closed from external radiation, thus, PB = 0, and for the value of SNR, we obtain the following equation
Dark current of the photodetector , where V s−1 for FPU-1N; = 103 Оm; is exposure time . For a wavelength of λ = 980 nm with a spectrum width of Δλ = 5 nm, we have ν = 0.3061×10¹⁵ s−1, Δν = 0.312×10¹³ s−1. Radiation power for the selected source is 0.2 W, up to the photodetector in the channel of the passing beam of radiation, the power does not exceed 70 % of the original power. For the values included in the denominator in Equation (23), we sequentially have:
The amplitude noise coefficient is assumed to be equal to =10−6. Then or 10logSNR = 56.3 dB. This level of noise is quite small and consistent with the permissible level [42].
The size of the installation can be obtained based on the optical scheme and the size of the elements:
- (1)
- the size of the radiation source (laser) is 65 mm;
- (2)
- the distance to the lens system is 20 mm;
- (3)
- the size of the system of two lenses is 100 mm;
- (4)
- Distance to window 3 (on Figure 2) 20 mm;
- (5)
- the inner diameter of the seed pipeline is 10 mm plus two wall thicknesses of 2.5 mm (depends on the length of the seed).
For size L1 = (65 + 20 + 100 + 20) + 5 + 10 = 141 mm.
For the size L2, we have the same considerations without taking into account the diameter of the seedpod L2 = 131 mm.
The height of the separation device in the part of the diagnostic system will be equal to:
- -
- optical part 261 mm;
- -
- the recording part is 200 mm.
Hence, H = 461 mm.
These dimensions are quite optimal, but the mechatronic parts concerning the feed mechanism and the seed separation mechanism are not considered here.
3.4. Grading Efficiency
The efficiency of the proposed optoelectronic grader as a function of the ratio of the reflected signal, taken into account by our optical scheme of the real reflected signal, is a constant value for the considered range of sizes and shapes of specific average samples of common pine seeds.
The geometric model takes into account the main optical flow of the reflected signal in cases of three positions of the seeds relative to recording window 3 (on Figure 2). As shown by preliminary studies of Scots pine seeds in various intermediate positions, the parameters of the selected optical scheme change by no more than 3–5%. The necessary adjustment can minimize their impact since the scheme parameters are selected with a significant margin for focusing the reflected signal.
In the selected energy model, the separation efficiency within the specified values of the reflectance coefficient may be affected by the presence of diffuse reflectance and those reflected radiations that did not enter the lens for subsequent focusing. However, the share of these light streams is, according to our estimates, about 30% percent, and it is approximately the same for seeds from any category. It is important that the absolute values of these flows do not exceed the interval values of the reflected signals.
This study is the first attempt to mathematically model an optoelectronic grader for the automatic sorting of Scots pine seeds according to their viability. As a whole, the results show that the efficacy of the optoelectronic grader depends on seed positioning and the radiation reaching the seed. For each seed positioning, adjustments in the light source, seed pipe diameter and refractive index of the window mirror are required. The intensity of the radiation reaching the seed and the signal to noise ratio are important parameters for the energy model. It has been shown that the low spectral signal compared to the average absorbance value of a seed resulted in the misclassification of seeds according to their viability [34]. However, with these parametric adjustments, the optoelectronic grader can separate viable and non-viable seeds of Scots pine with high through-put. The grader can easily be used in other species with adjustments in seed positioning system and angle of radiation reaching the seed. The development of such a grader will revolutionize tree seed handling operations globally by enhancing the sorting efficiency.
4. Conclusions
The results of this study show that the signal value depends on the orientation of a single seed relative to the recording window; the beam angle from the radiation source must be within 45 degrees; the difference between the optical streams is 50 microns, which makes it possible to clearly detect the signal at a standard noise level of 15 microns, and the signal-to-noise detection accuracy ratio is 56.3 dB. As a whole, with the developed geometric and energy models, it is possible to separate viable seeds from non-viable Scots pine seeds. The optical grader can be easily expanded to a range of other species by adjusting the seed positioning system and the radiation angle.
Author Contributions
Conceptualization, A.N. and V.L.; methodology A.N., V.L., M.T., and S.C.; validation, A.N., V.L., M.T., and S.C.; formal analysis, V.L., P.T. and M.T.; investigation P.T. and A.N.; data curation, V.L., A.N., P.T. and S.C.; writing—original draft preparation A.N., V.L., M.T., P.T. and S.C.; writing—review and editing, A.N., V.L., M.T., P.T. and S.C.; visualization, A.N. and V.L. All authors have read and agreed to the published version of the manuscript.
Funding
This research received no external funding.
Informed Consent Statement
Not applicable
Data Availability Statement
Data can be made available by the authors upon reasonable request.
Conflicts of Interest
The authors declare no conflict of interest.
References
- Stanturf, J.A.; Mansourian, S. Forest landscape restoration: State of play. R. Soc. Open Sci. 2020, 7, 201218. [Google Scholar] [CrossRef]
- Ivetić, V.; Novikov, A.I. The role of forest reproductive material quality in forest restoration. For. Eng. J. 2019, 9, 56–65. [Google Scholar]
- Kowalski, S.; Walczyk, J.; Tylek, P. Single-seed sowing in the treatment of controlled mycorrhization of Scots pine (Pinus sylvestris L.) grown on the peat substratum in channels. Electron. J. Pol. Agric. Univ. Ser. For. 2005, 8, 28. [Google Scholar]
- Aniszewska, M.; Petrenko, Y. Evaluation of quantity and quality of common pine seeds (Pinus sylvestris L.) obtained in two-stage seed extraction process under laboratory conditions. Ann. Wars. Univ. Life Sci. SGGW Agric. 2012, 60, 129–136. [Google Scholar]
- Kaliniewicz, Z.; Tylek, P.; Markowski, P.; Anders, A.; Rawa, T.; Jóźwiak, K.; Fura, S. Correlations between the germination capacity and selected physical properties of Scots pine (Pinus sylvestris L.) seeds. Balt. For. 2013, 19, 201–211. [Google Scholar]
- Tigabu, M.; Daneshvar, A.; Jingjing, R.; Wu, P.; Ma, X.; Odén, P.C. Multivariate Discriminant Analysis of Single Seed Near Infrared Spectra for Sorting Dead-Filled and Viable Seeds of Three Pine Species: Does One Model Fit All Species? Forests 2019, 10, 469. [Google Scholar] [CrossRef] [Green Version]
- Kaliniewicz, Z.; Tylek, P. Aspects of the Process of Sorting European Black Pine Seeds. Forests 2019, 10, 966. [Google Scholar] [CrossRef] [Green Version]
- Kaliniewicz, Z.; Tylek, P.; Anders, A.; Markowski, P.; Rawa, T.; Ołdakowski, M.; Wąsowski, Ł. An analysis of the physical properties of seeds of selected deciduous tree species. Balt. For. 2016, 22, 169–174. [Google Scholar]
- Kaliniewicz, Z.; Tylek, P.; Markowski, P.; Anders, A.; Rawa, T.; Glazewska, E. Analysis of correlations between selected physical properties and color of Scots pine (Pinus sylvestris L.) seeds. Tech. Sci. 2014, 17, 259–274. [Google Scholar]
- Gierz, Ł.; Włodarczyk, K.; Selech, J. Evaluation of the shape and dimensions of cereal seeds and other crops for modeling sowing and seed separation. J. Res. Appl. Agric. Eng. 2017, 62, 37–40. [Google Scholar]
- Lestander, T.A.; Odén, P.C. Separation of viable and non-viable filled Scots pine seeds by differentiating between drying rates using single seed near infrared transmittance spectroscopy. Seed Sci. Technol. 2002, 30, 383–392. [Google Scholar]
- Tigabu, M.; Odén, P.C. Simultaneous detection of filled, empty and insect-infested seeds of three Larix species with single seed near-infrared transmittance spectroscopy. New For. 2004, 27, 39–53. [Google Scholar] [CrossRef]
- Novikov, A.I.; Ivetić, V.; Novikova, T.P.; Petrishchev, E. One-year-old Scots pine seedlings from seeds sorted by size and coat color (empirical data) [Dataset]. Mendeley Data 2019, 4, 106. [Google Scholar] [CrossRef] [Green Version]
- Novikov, A.I.; Ivetić, V.; Novikova, T.P.; Petrishchev, E.P. Scots Pine Seedlings Growth Dynamics Data Reveals Properties for the Future Proof of Seed Coat Color Grading Conjecture. Data 2019, 4, 106. [Google Scholar] [CrossRef] [Green Version]
- Novikov, A.I. Rapid Analysis of Forest Seeds: Biophysical Methods; VSUFT: Voronezh, Russian, 2018; ISBN 978-5-7994-0869-5. [Google Scholar]
- Novikov, A.I. Visible wave spectrometric features of scots pine seeds: The basis for designing a rapid analyzer. Iop Conf. Ser. Earth Environ. Sci. 2019, 226, 012064. [Google Scholar] [CrossRef]
- Novikov, A.I.; Ersson, B.T.; Malyshev, V.V.; Petrishchev, E.P.; Ilunina, A.A. Mechanization of coniferous seeds grading in Russia: A selected literature analysis. Iop Conf. Ser. Earth Environ. Sci. 2020, 595, 012060. [Google Scholar] [CrossRef]
- Novikov, A.I.; Sokolov, S.; Drapalyuk, M.; Zelikov, V.; Ivetić, V. Performance of Scots Pine Seedlings from Seeds Graded by Colour. Forests 2019, 10, 1064. [Google Scholar] [CrossRef] [Green Version]
- Sokolov, S.V.; Kamenskij, V.V.; Novikov, A.I.; Ivetić, V. How to increase the analog-to-digital converter speed in optoelectronic systems of the seed quality rapid analyzer. Inventions 2019, 4, 61. [Google Scholar] [CrossRef] [Green Version]
- Albekov, A.U.; Drapalyuk, M.V.; Morkovina, S.S.; Vovchenko, N.G.; Novikov, A.I.; Sokolov, S.V.; Novikova, T.P. Device for Seeds Sorting. RU Patent 2 682 854, 21 March 2019. [Google Scholar]
- Novikov, A.I.; Drapalyuk, M.; Dornyak, O.; Zelikov, V.; Ivetić, V. The Effect of Motion Time of a Scots Pine Single Seed on Mobile Optoelectronic Grader Efficiency: A Mathematical Patterning. Inventions 2019, 4, 55. [Google Scholar] [CrossRef] [Green Version]
- Sokolov, S.V.; Novikov, A.I. New optoelectronic systems for express analysis of seeds in forestry production. For. Eng. J. 2019, 9, 5–13. [Google Scholar]
- Zhang, J.; Li, M.; Pan, T.; Yao, L.; Chen, J. Purity analysis of multi-grain rice seeds with non-destructive visible and near-infrared spectroscopy. Comput. Electron. Agric. 2019, 164, 104882. [Google Scholar] [CrossRef]
- Workman, J.; Weyer, L. Practical Guide and Spectral Atlas for Interpretive Near-Infrared Spectroscopy, 2nd ed.; CRC Press: Taylor & Francis: Boca Raton, FL, USA, 2012. [Google Scholar]
- Elyashevich, M.A. Atomic and Molecular Spectroscopy; Fizmatgiz: Moscow, Russia, 1962. [Google Scholar]
- França-Silva, F.; Rego, C.H.Q.; Gomes-Junior, F.G.; Moraes, M.H.D.D.; Medeiros, A.D.D.; Silva, C.B.D. Detection of Drechslera avenae (Eidam) Sharif [Helminthosporium avenae (Eidam)] in Black Oat Seeds (Avena strigosa Schreb) Using Multispectral Imaging. Sensors 2020, 20, 3343. [Google Scholar] [CrossRef] [PubMed]
- Hauke-Kowalska, M.; Borowiak, E.; Barzdajn, W.; Kowalkowski, W.; Korzeniewicz, R.; Wawro, T. Cone and seeds variability in seed orchards and seed stands of Pinus sylvestris. Balt. For. 2019, 25, 187–192. [Google Scholar] [CrossRef]
- Kaliniewicz, Z.; Rawa, T.; Tylek, P.; Markowski, P.; Anders, A.; Fura, S. The effect of the age of Scots pine (Pinus sylvestris L.) stands on the physical properties of seeds and the operating parameters of cleaning machines. Tech. Sci. 2013, 16, 64–72. [Google Scholar]
- Sevik, H.; Ayan, S.; Turna, I.; Yahyaoglu, Z. Genetic diversity among populations in scotch pine (Pinus silvestris L.) seed stands of western black sea region in turkey. Afr. J. Biotechnol. 2010, 9, 7266–7272. [Google Scholar]
- Sivacioǧlu, A. Genetic variation in seed and cone characteristics in a clonal seed orchard of scots pine (Pinus sylvestis L.) grown in Kastamonu-Turkey. Rom. Biotechnol. Lett. 2010, 15, 5695–5701. [Google Scholar]
- Tigabu, M.; Odén, P.C.; Shen, T.Y. Application of near-infrared spectroscopy for the detection of internal insect infestation in Picea abies seed lots. Can. J. For. Res. 2004, 34, 76–84. [Google Scholar] [CrossRef]
- Tigabu, M.; Odén, P.C. Rapid and non-destructive analysis of vigour of Pinus patula seeds using single seed near infrared transmittance spectra and multivariate analysis. Seed Sci. Technol. 2004, 32, 593–606. [Google Scholar] [CrossRef]
- Tigabu, M. Characterization of Forest Tree Seed Quality with Near Infrared Spectroscopy and Multivariate Analysis. Ph.D. Thesis, Swedish University of Agricultural Sciences, Umeå, Sweden, 2003. [Google Scholar]
- Tigabu, M.; Daneshvar, A.; Wu, P.; Ma, X.; Christer Odén, P. Rapid and non-destructive evaluation of seed quality of Chinese fir by near infrared spectroscopy and multivariate discriminant analysis. New For. 2020, 51, 395–408. [Google Scholar] [CrossRef]
- Farhadi, M.; Tigabu, M.; Pietrzykowski, M.; Danusevičius, D.; Odén, P.C. Application of near infrared spectroscopy for authentication of Picea abies seed provenance. New For. 2017, 48, 629–642. [Google Scholar] [CrossRef]
- Tigabu, M.; Fjellström, J.; Odén, P.C.; Teketay, D. Germination of Juniperus procera seeds in response to stratification and smoke treatments, and detection of insect-damaged seeds with VIS + NIR spectroscopy. New For. 2007, 33, 155–169. [Google Scholar] [CrossRef]
- Soltani, A.; Lestander, T.A.; Tigabu, M.; Odén, P.C. Prediction of Viability of Oriental Beechnuts, Fagus Orientalis, Using near Infrared Spectroscopy and Partial Least Squares Regression. J. Near Infrared Spectrosc. 2003, 11, 357–364. [Google Scholar] [CrossRef]
- Gooch, J.W. Beer-Bouguer Law (Beer-Lambert Law). In Encyclopedic Dictionary of Polymers; Springer: New York, NY, USA, 2011; p. 72. [Google Scholar]
- Lisitsyn, V.I.; Kamalova, N.S.; Evsikova, N.Y.; Saushkin, V.V. Basics of Optics and Lighting Engineering; VSUFT Publishing: Voronezh, Russia, 2017. [Google Scholar]
- Schröder, G.; Treiber, H. Technical Optics [Technische Optik]; Vogel Buchverlag Munchen: Munchen, Germany, 2006. [Google Scholar]
- FTI-Optronic NIR Laser Module KLM-H808-x-5. Available online: http://www.fti-optronic.com/IK-lazernye-moduli/KLM-H980-x-5.html (accessed on 20 April 2020).
- Tylek, P.; Demidov, D.N.; Lysych, M.N.; Petrishchev, E.P.; Maklakova, E.A. The features designed of mechatronic system of adaptive hopper’s feeder: Case study for Scots pine seeds morphometry. Iop Conf. Ser. Earth Environ. Sci. 2020, 595, 012054. [Google Scholar] [CrossRef]
- Udd, E.; Spillman, W.B. (Eds.) Fiber Optic Sensors, 2nd ed.; John Wiley & Sons, Inc.: Hoboken, NJ, USA, 2011; ISBN 9781118014103. [Google Scholar]
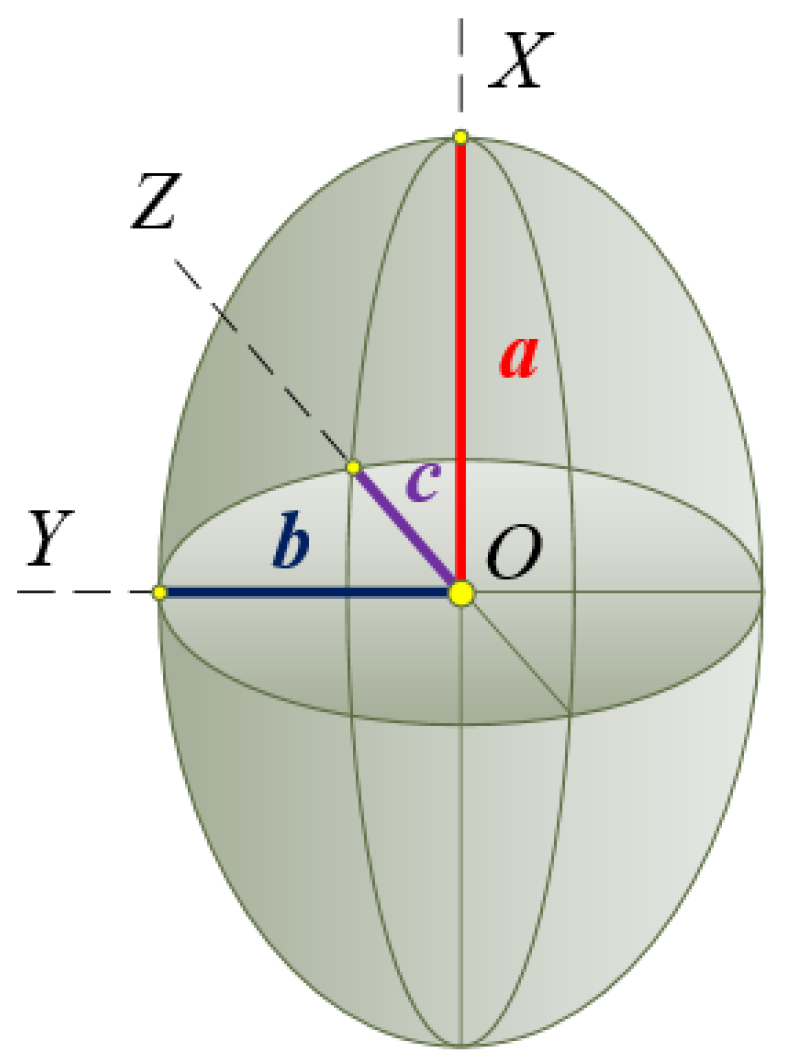
Figure 1.
The Scots pine seed shape used in the study. a, b, and c are semi-axes of the ellipsoid, located along the X-, Y-, and Z-axes from three-dimensional coordinate system, respectively.
Figure 1.
The Scots pine seed shape used in the study. a, b, and c are semi-axes of the ellipsoid, located along the X-, Y-, and Z-axes from three-dimensional coordinate system, respectively.

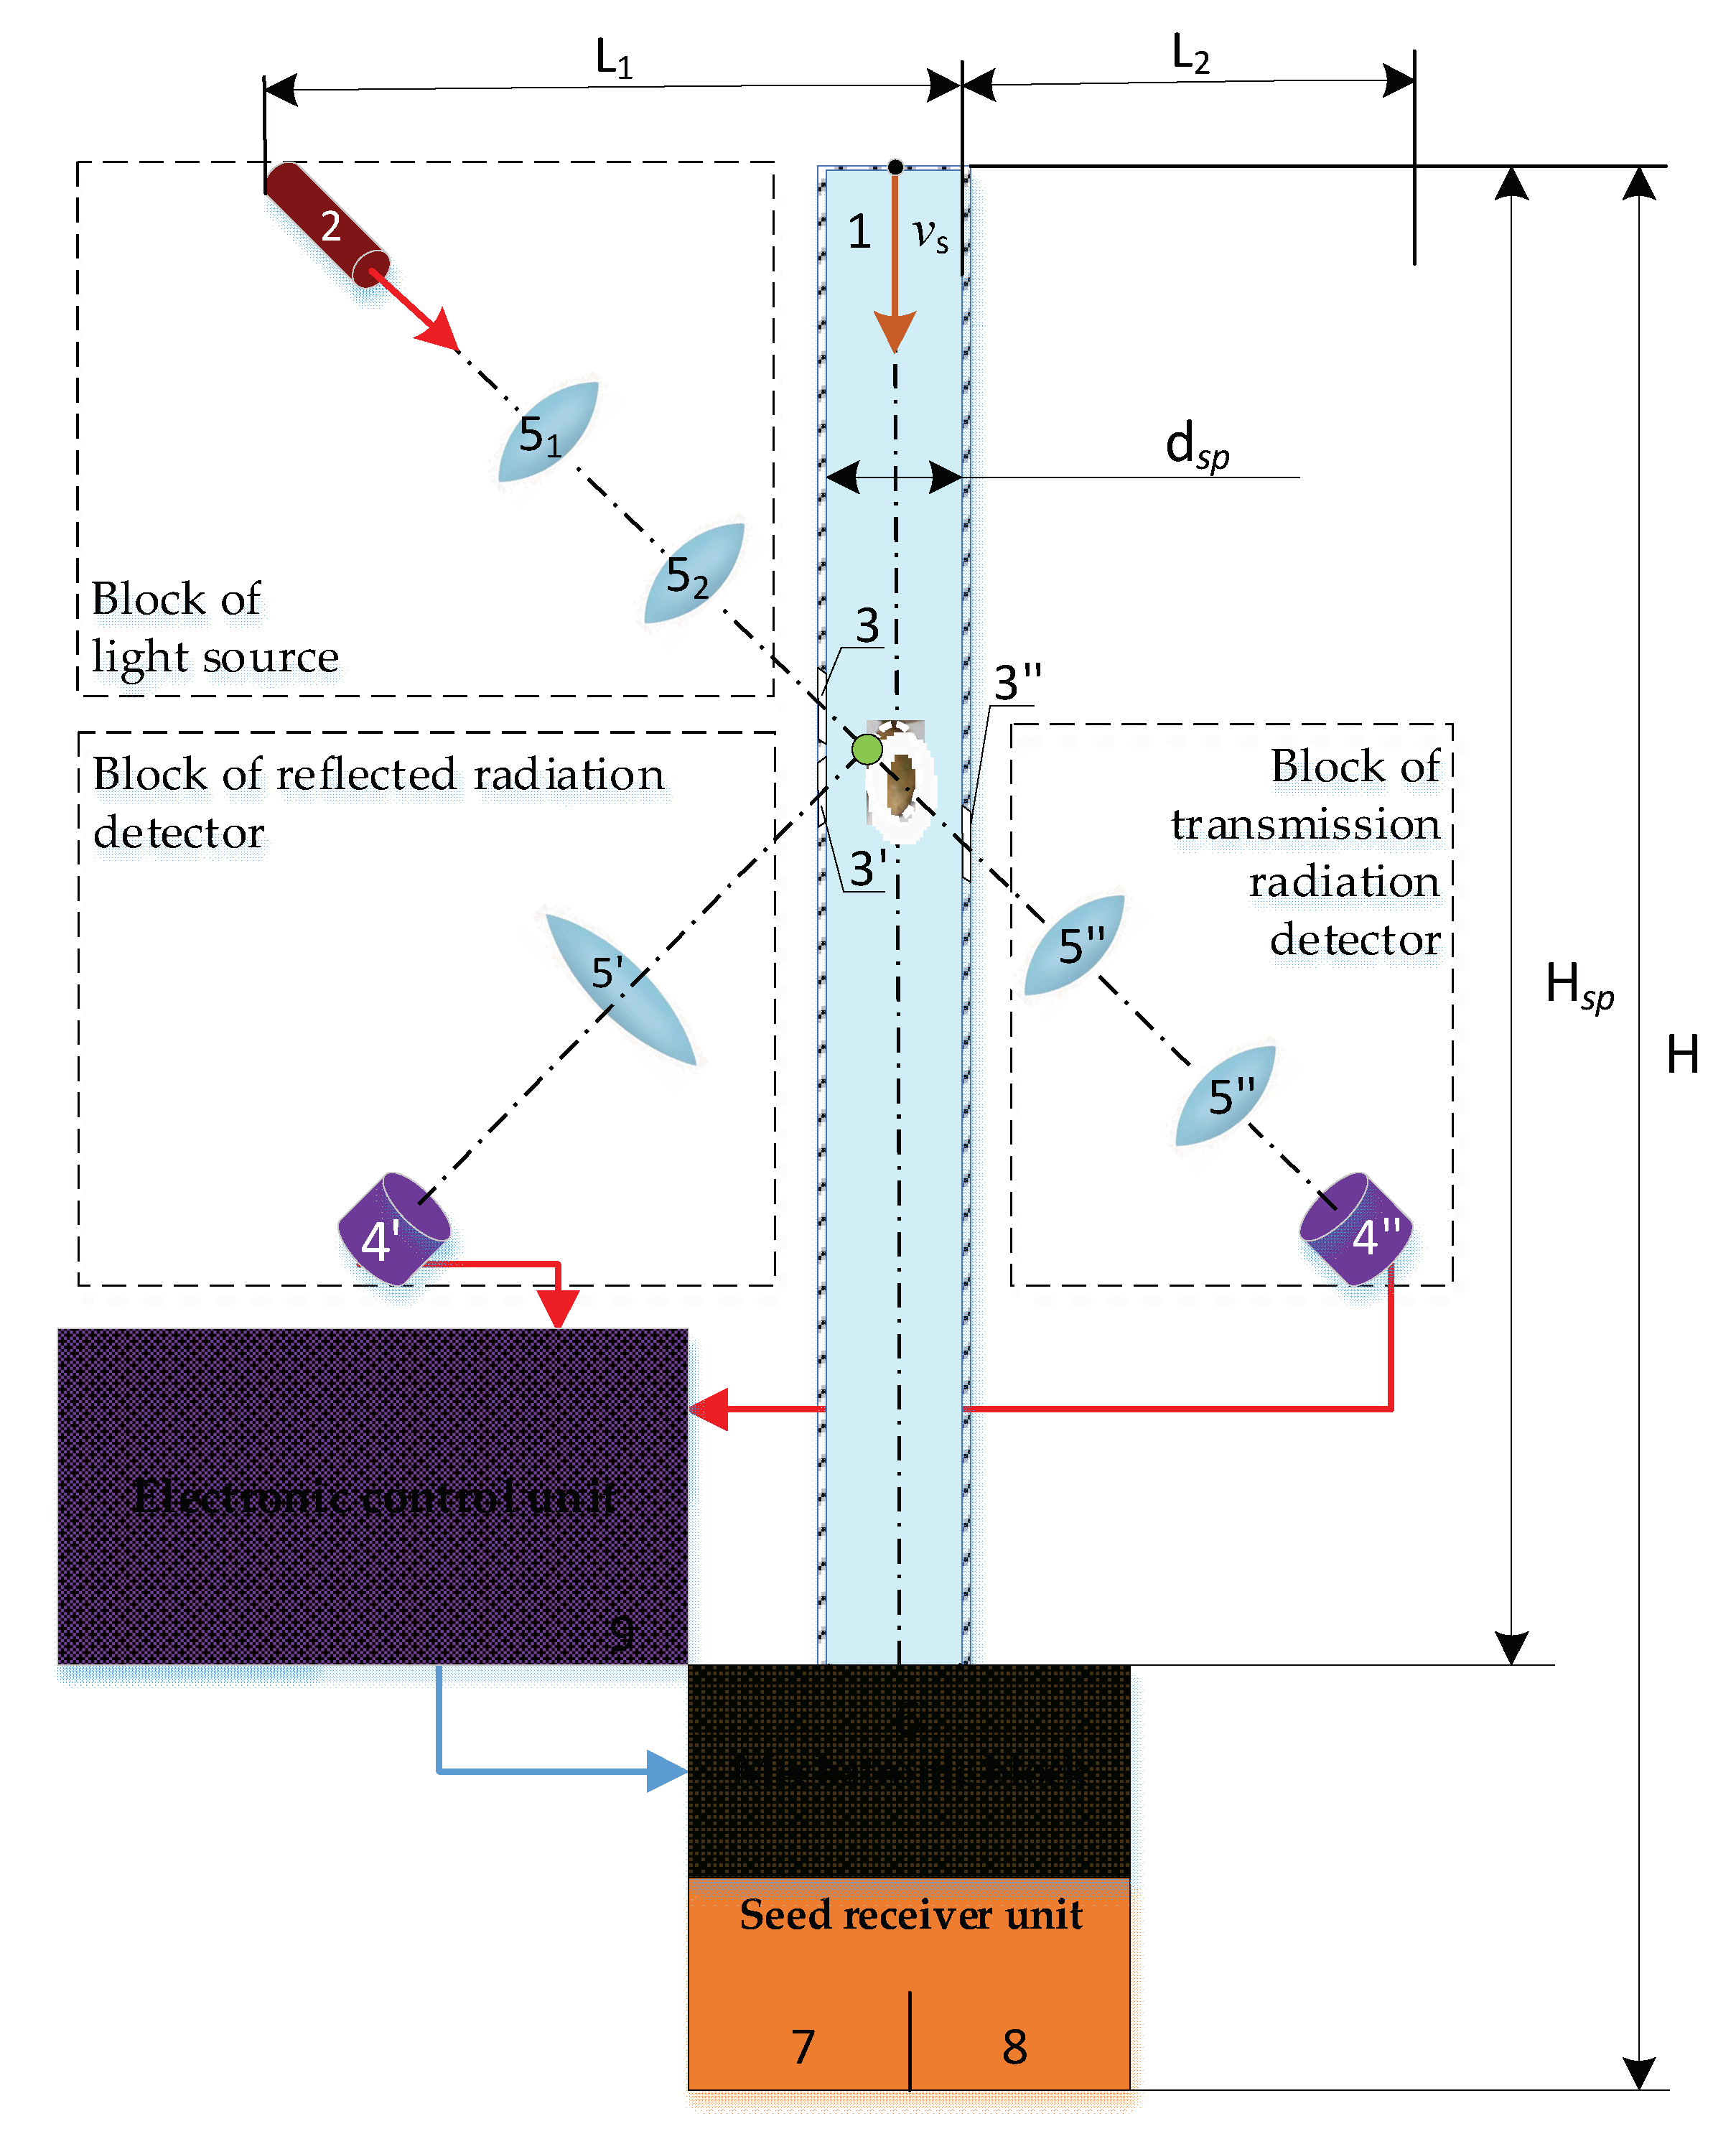
Figure 2.
Structural and functional diagram of the diagnostic system for modeling the process of detecting a single seed. 1—seed pipe; 2—light source; 3, 3′ and 3″—input recording window and windows for registering radiation, respectively; 4′ and 4″—receivers for detecting reflected and transmission radiation, accordingly; 51, 52, 5′, and 5″—focusing lenses; 6—flap; 7—viable seeds receiver; 8—non-viable seeds receiver; 9—electronic control unit.

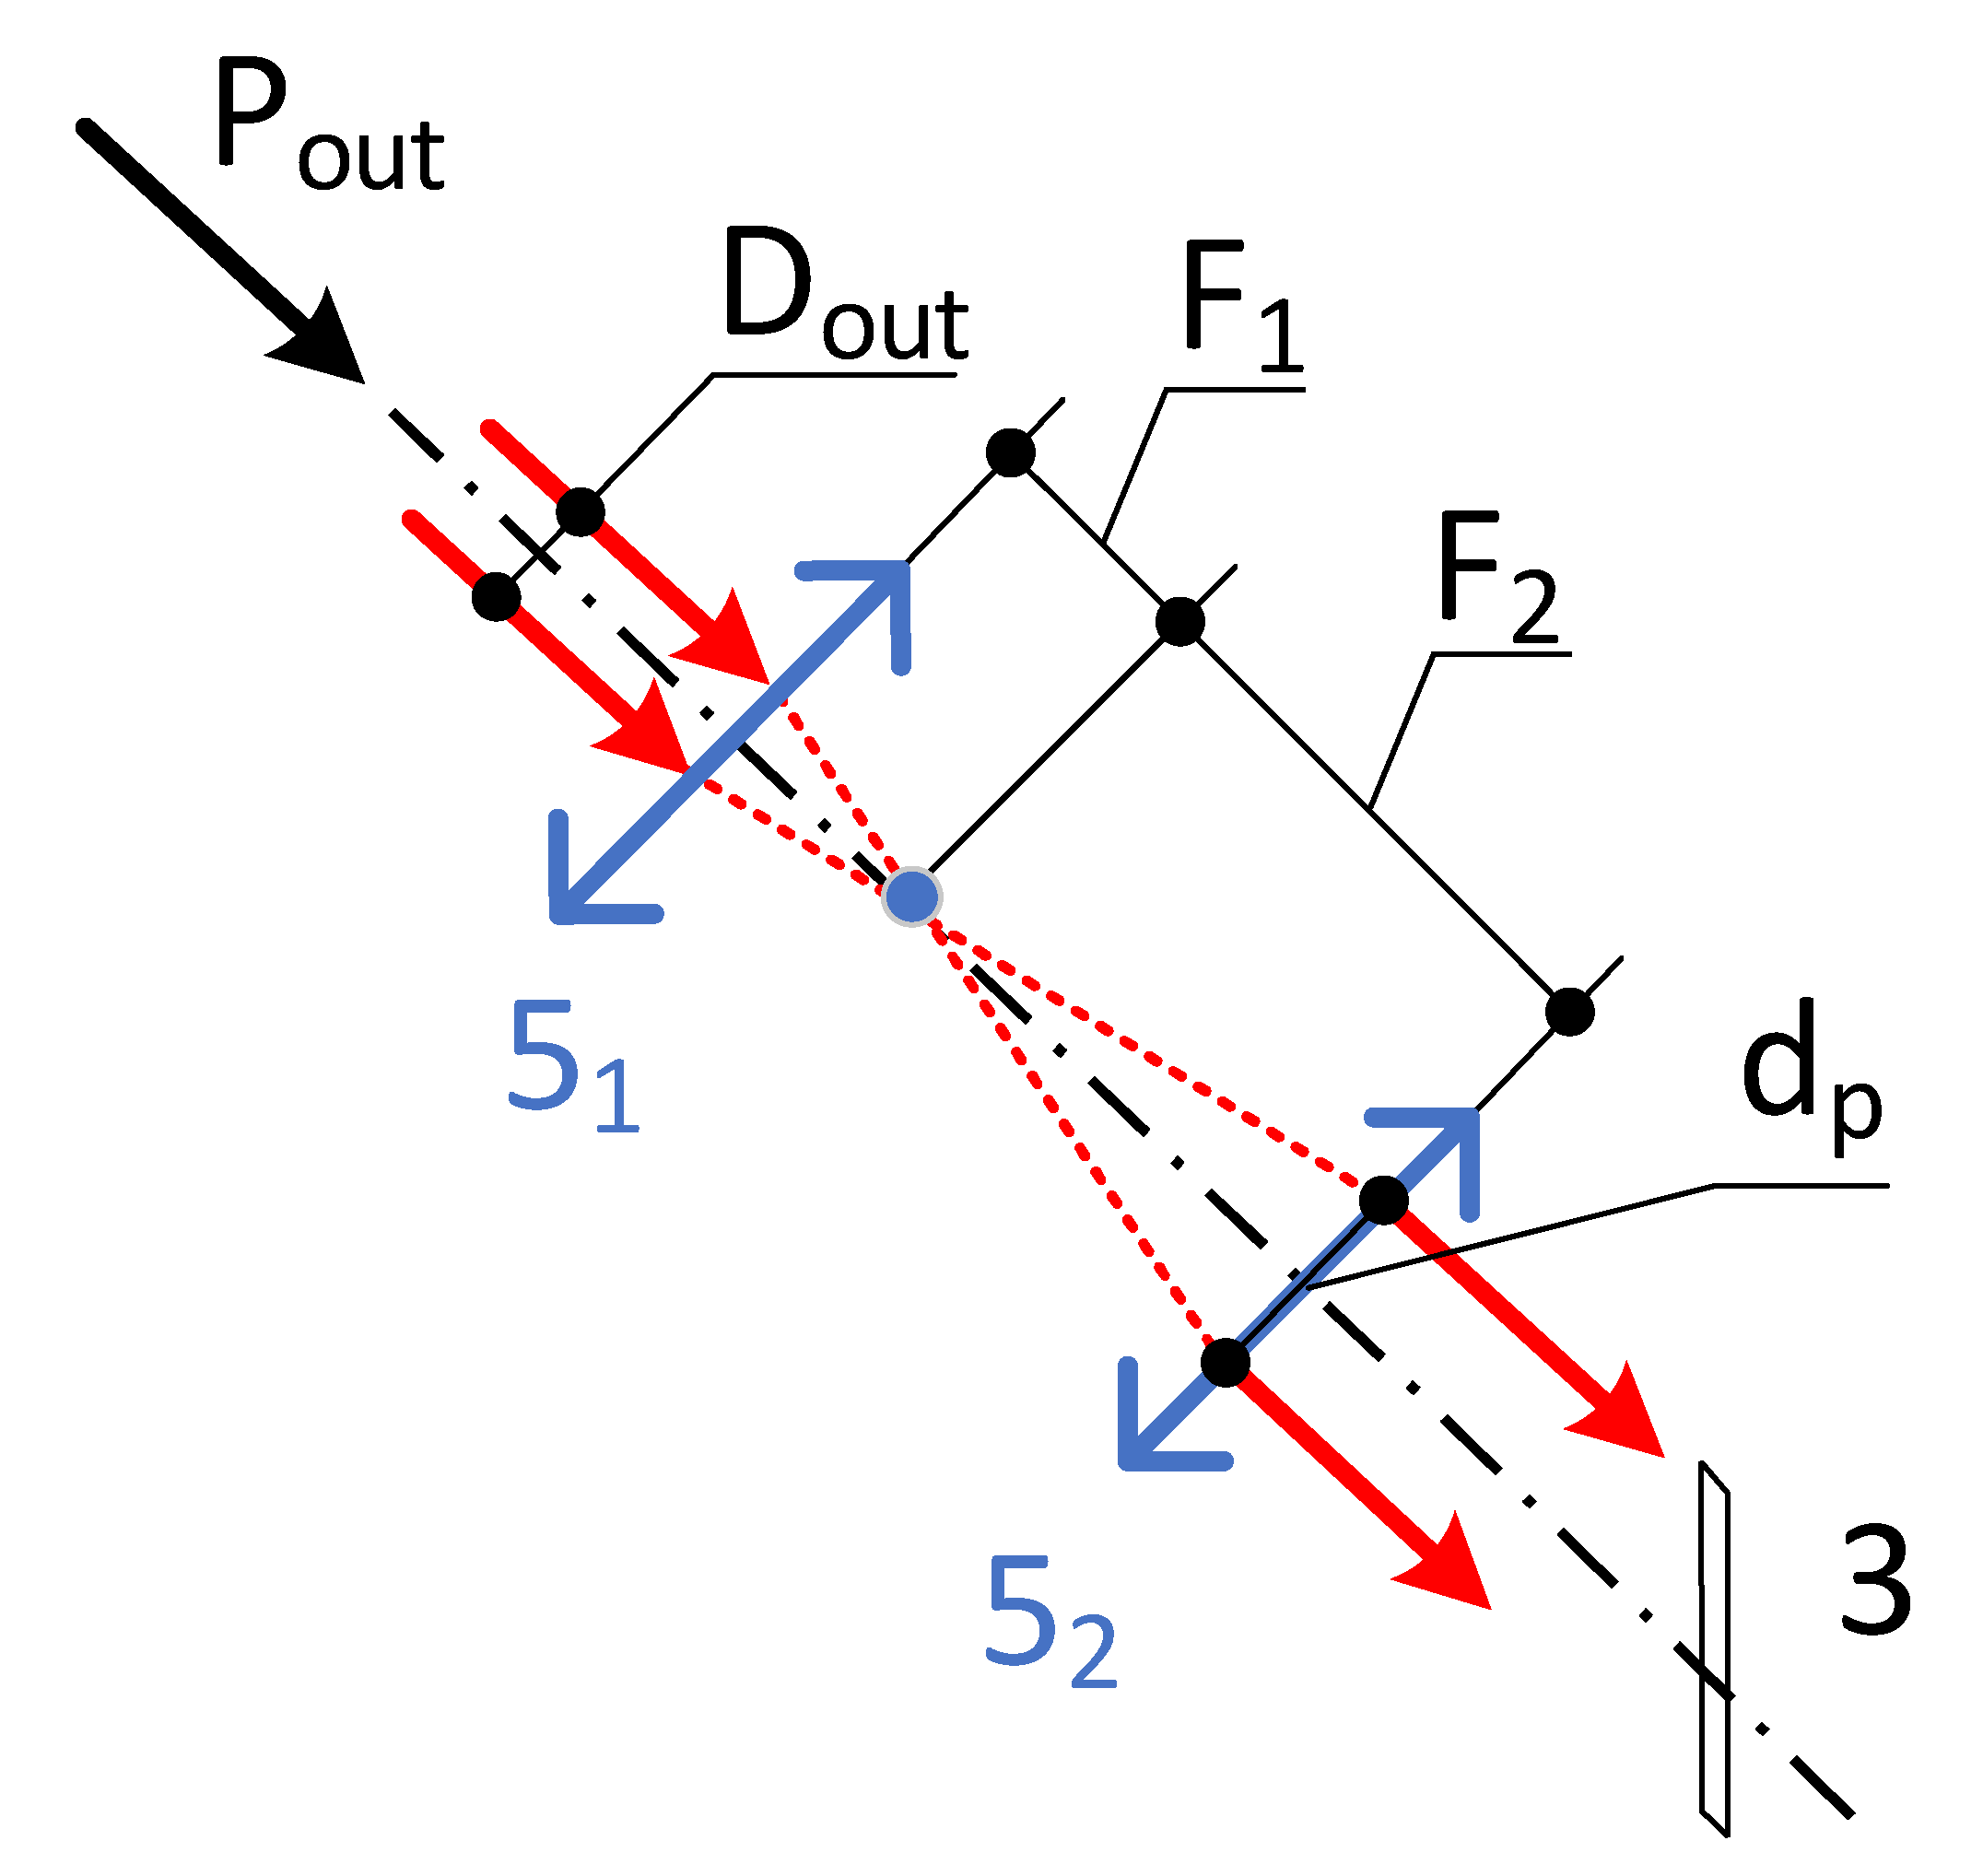
Figure 3.
Beam expansion in the block of light source. Here, 3 is the window through which the beam enters the seed pipe. F1 is the focal length of the lens 51, F2 is the focal length of the lens 52 in Figure 2, Pout, Dout and dp are output power of the light source, diameter of the radiation beam at the output of the light source, and diameter of the beam before entering the seed pipe, respectively.

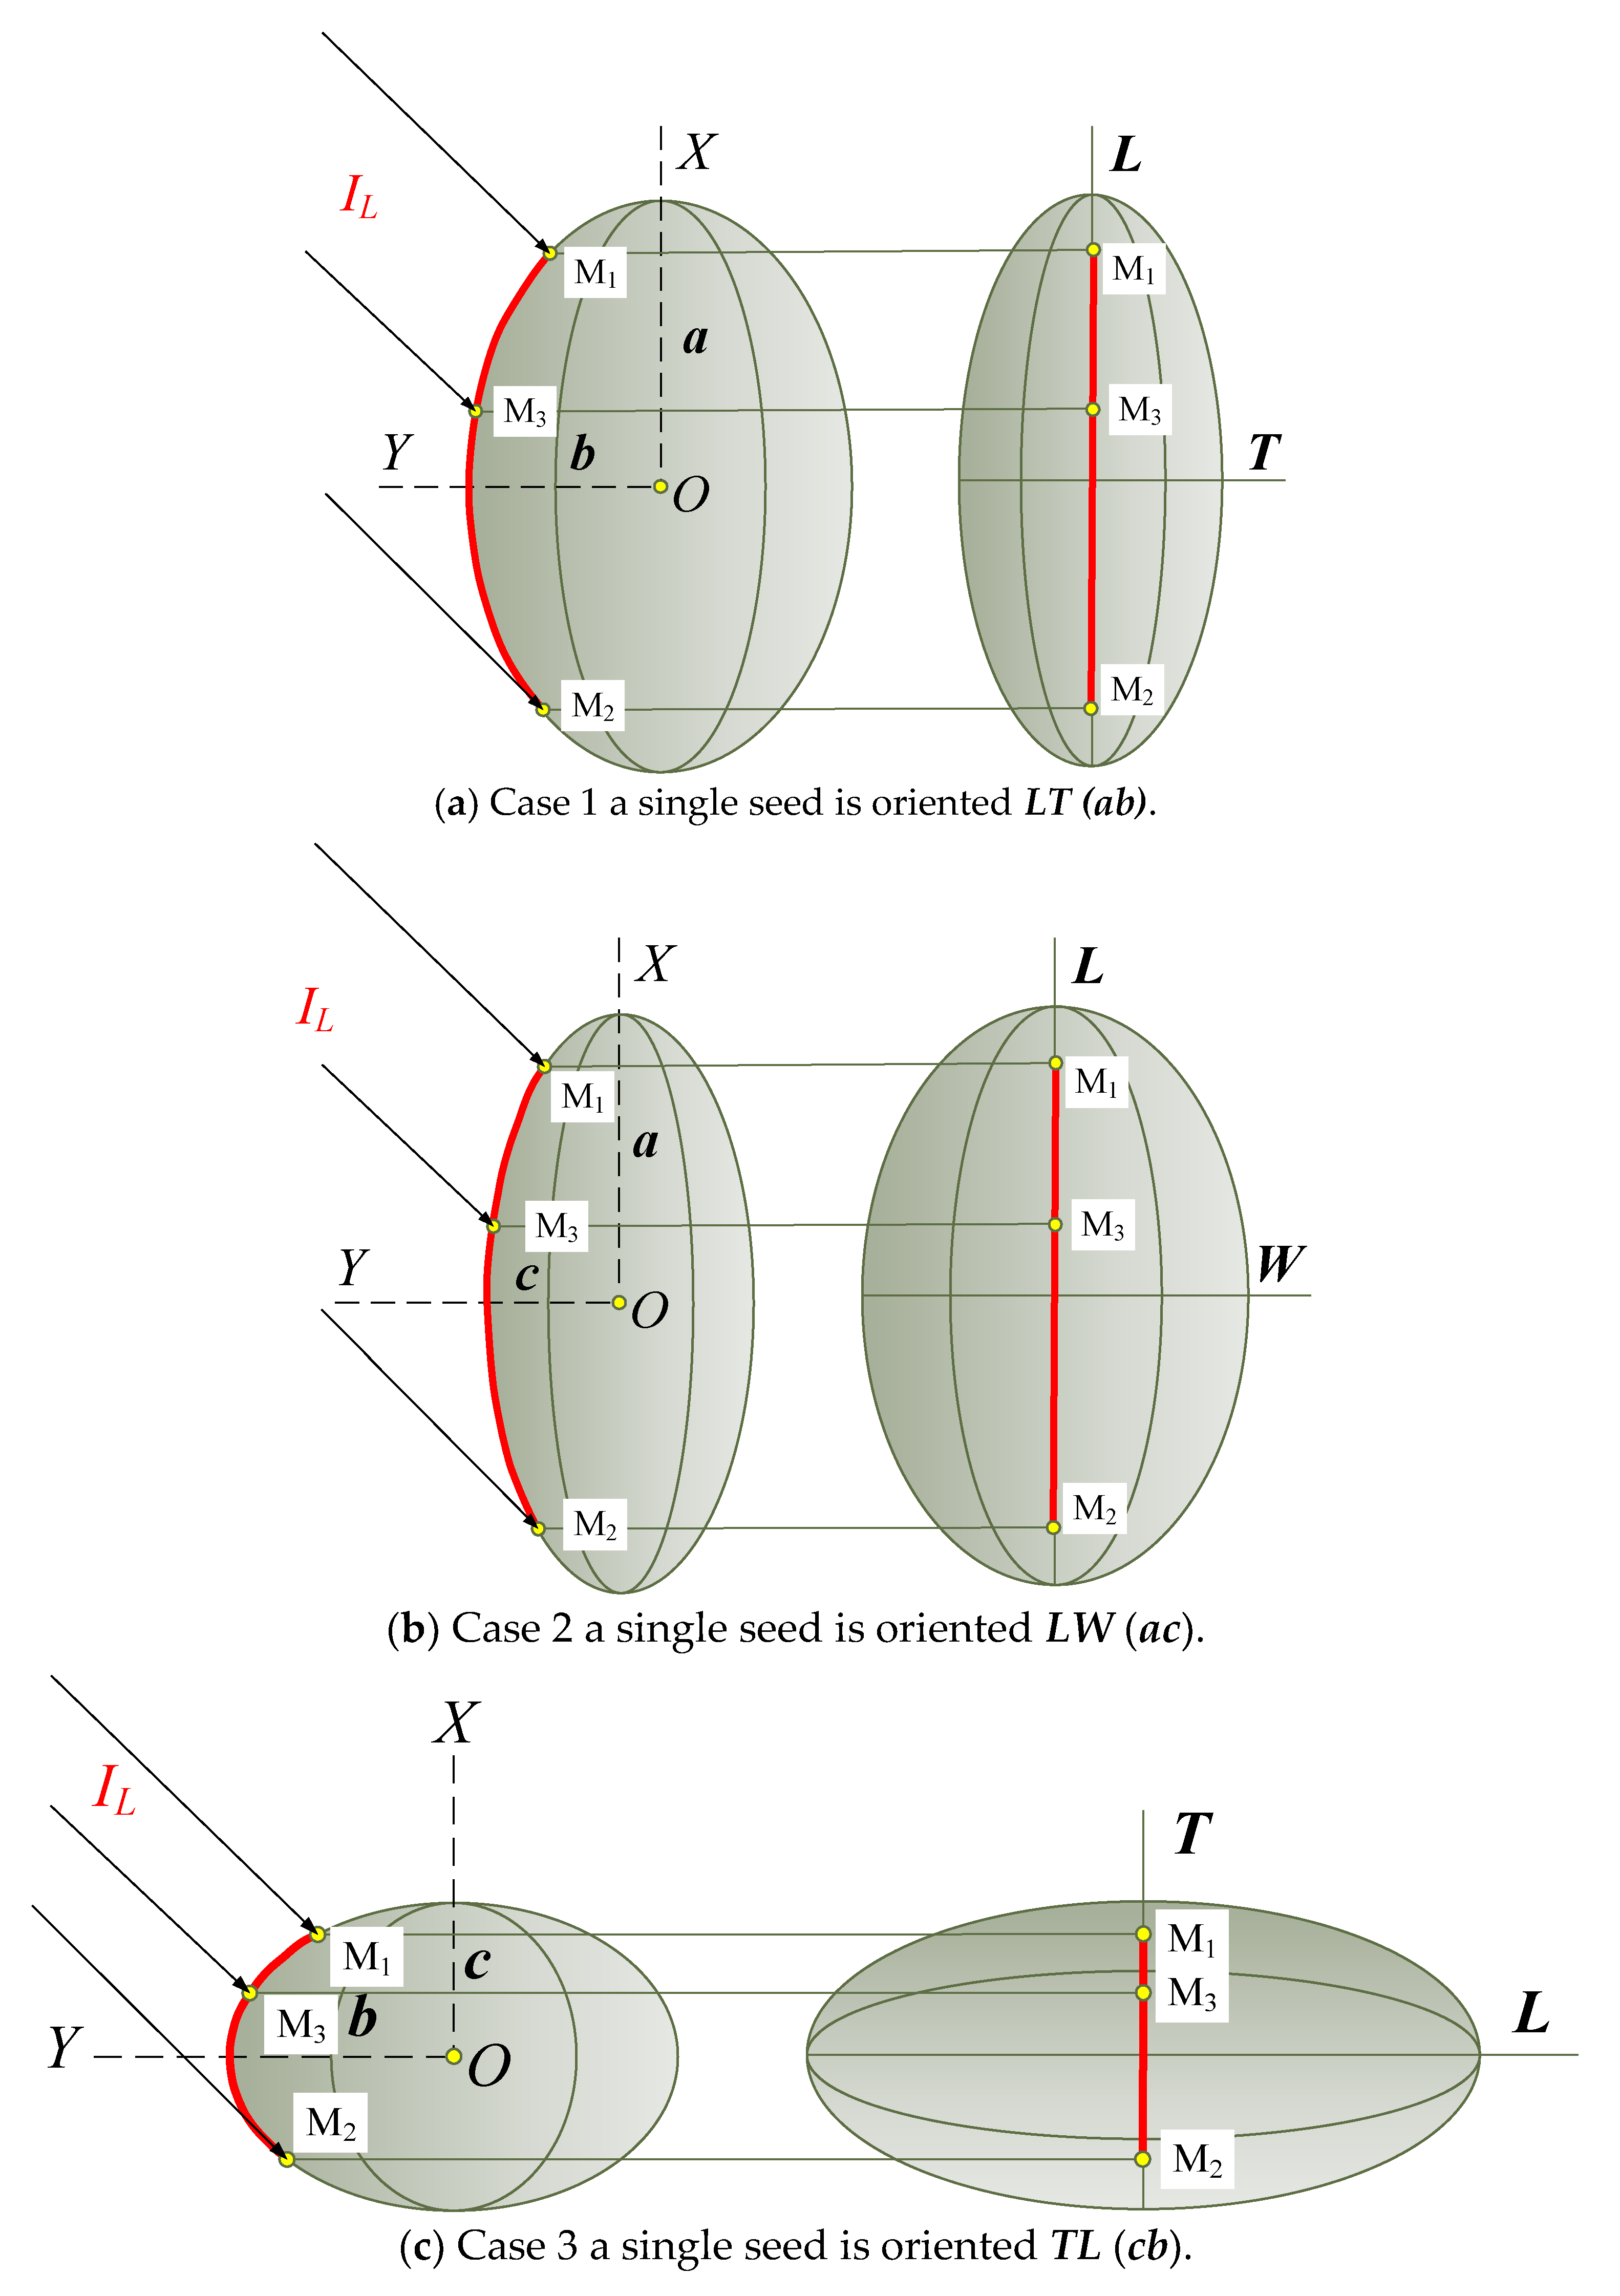
Figure 4.
Schemes of orientation of the seed relative to the axis of the optical beam of the incident radiation (recording window 3 on Figure 2). LT (ab)—first letter sets the side of the seed, parallel to the M1M2 forming a drop beam, defined by the equation of the ellipse with the axes indicated in parentheses, the second letter sets the direction of the seed perpendicular to the first direction in the plane of incidence, in this case, the thickness T; IL is the intensity of the light stream that passes through window 3, illustrated in Figure 2. Here, we are talking about the effective detection surface—the maximum surface of the seed, bounded by the formation of M1M2, from which the beam emitted by the laser can be reflected continuously. Therefore, we neglect the edge effects (if any).

Figure 5.
Determination of critical detection points M1 and M2 for the case of semi axis orientation , of the seed.
Figure 5.
Determination of critical detection points M1 and M2 for the case of semi axis orientation , of the seed.

Figure 6.
Construction of the effective angular width of the reflected beam for the first case of orientation of the seed relative to the recording window 3 on Figure 2. The ellipse M1M2 is defined by semi-axes , .
Figure 6.
Construction of the effective angular width of the reflected beam for the first case of orientation of the seed relative to the recording window 3 on Figure 2. The ellipse M1M2 is defined by semi-axes , .

Figure 7.
The thickness of recording window 3 (on Figure 2) based on the refraction of the beam.
Figure 7.
The thickness of recording window 3 (on Figure 2) based on the refraction of the beam.


Table 1.
Options for selecting a single seed detection criterion based on spectrometric parameters (adapted from [6,15,24,33,34]). Here, V—full viable; NVP—non-viable petrified; NVE—non-viable empty; O–H—hydroxyl group; C=O—carbonyl group; N–H—amine group; HOH—water; C–H—hydrocarbon group.
| Absorption Peak/Bands λ, nm | Functional Groups | Organic Compound That Absorbs Light | Absorbance Value A = lg (1/R) | The Criterion of Separation R |
|---|---|---|---|---|
| 970 | O–H | aliphatic and aromatic hydroxyl groups, starch, water | 1.045–1.055 NVE 1.055–1.13 V 1.13–1.25 NVP | 0.3517–0.3418 0.3417–0.3230 0.3229–0.2865 |
| 1196 | C–H | fatty acid | 1.01–1.03 NVE 1.03–1.07 V 1.07–1.25 NVP | 0.3642–0.3570 0.3569–0.3430 0.3429–0.2865 |
| 1390 | C–H N–H | protein | 1.11–1.12 NVE 1.12–1.17 V 1.17–1.25 NVP | 0.3296–0.3263 0.3262–0.3104 0.3103–0.2865 |
| 1878 | C–H | methyl and methylene (linoleic and oleic acids, triolein, trilinolein, trilinolenin) | 1.17–1.18 NVE 1.18–1.22 V 1.22–1.25 NVP | 0.3104–0.3073 0.3072–0.2952 0.2951–0.2865 |
| 1986 | C=O O–H HOH | protein, starch, water | 1.09–1.10 NVE 1.10–1.13 V 1.13–1.25 NVP | 0.3362–0.3329 0.3328–0.3230 0.3229–0.2865 |
Publisher’s Note: MDPI stays neutral with regard to jurisdictional claims in published maps and institutional affiliations. |
© 2021 by the authors. Licensee MDPI, Basel, Switzerland. This article is an open access article distributed under the terms and conditions of the Creative Commons Attribution (CC BY) license (http://creativecommons.org/licenses/by/4.0/).
Share and Cite
MDPI and ACS Style
Novikov, A.; Lisitsyn, V.; Tigabu, M.; Tylek, P.; Chuchupal, S. Detection of Scots Pine Single Seed in Optoelectronic System of Mobile Grader: Mathematical Modeling. Forests 2021, 12, 240. https://doi.org/10.3390/f12020240
AMA Style
Novikov A, Lisitsyn V, Tigabu M, Tylek P, Chuchupal S. Detection of Scots Pine Single Seed in Optoelectronic System of Mobile Grader: Mathematical Modeling. Forests. 2021; 12(2):240. https://doi.org/10.3390/f12020240
Chicago/Turabian StyleNovikov, Arthur, Viсtor Lisitsyn, Mulualem Tigabu, Paweł Tylek, and Sergey Chuchupal. 2021. "Detection of Scots Pine Single Seed in Optoelectronic System of Mobile Grader: Mathematical Modeling" Forests 12, no. 2: 240. https://doi.org/10.3390/f12020240
Note that from the first issue of 2016, this journal uses article numbers instead of page numbers. See further details here.