
Will There Be Enough Water? A System Dynamics Model to Investigate the Effective Use of Limited Resources for Emergency Water Supply


Research Center RISK, Bundeswehr University Munich, Werner-Heisenberg-Weg 39, 85577 Neubiberg, Germany
*
Author to whom correspondence should be addressed.
Systems 2021, 9(1), 2; https://doi.org/10.3390/systems9010002
Submission received: 8 December 2020
/
Revised: 29 December 2020
/
Accepted: 1 January 2021
/
Published: 8 January 2021
(This article belongs to the Special Issue Engineering Resilient Systems)
Abstract
:The increased probability of occurrence of various hazards to water supply systems due to climate change requires the strengthening of their resilience through effective emergency preparedness planning. This paper introduces a method for the assessment of the resilience of water supply systems, including emergency supply measures. With 20 uniquely defined emergency situations, the technical constellations for possible impairments of the water supply are documented. The system analysis developed for each emergency situation is then used to determine and prioritise all suitable supply measures to reduce the supply deficit. Based on the data of a water utility close to Frankfurt, Germany, the developed system dynamics model was used to examine the resource utilisation for the respective emergency situations and to estimate the amount of water provided. The model allows us to scrutinize and compare emergency water supply measures as well as to identify required resources. Furthermore, the method helps us to prioritize measures as well as to make decisions when planning and providing emergency water supply (EWS).
Keywords:
crisis; critical infrastructure; disaster; drinking water; SD; resilience; risk management; risk reduction; Vensim1. Introduction
A reliable drinking water supply is one of the basic requirements for a stable social and economic system. However, even in industrialised countries, impairments cannot be completely avoided, meaning that water supply companies have to deviate from normal operation; e.g., in the case of pipe breaks [1,2,3,4]. Such minor disturbances occur comparatively frequently and have only minor effects [5]. They can usually be quickly identified and remedied. Consequently, they usually go unnoticed by consumers [6]. On the other hand, failures or major disruptions of water supply systems can have negative impacts on the affected population and the economy [5,7,8,9]. Causes can be serious natural events, man-made accidents or intentional attacks [10,11,12], the probability of occurrence of which is constantly increasing [13].
Critical infrastructures such as water or energy supply are by definition essential for society [14,15]. The disruption, damage or destruction of critical infrastructure can have significant negative impacts on public health and security [16,17,18]. Society expects critical infrastructures to function continuously during emergency situations [19]. In March 2015, the United Nations emphasised the relevance of critical infrastructure resilience in the Sendai Framework for Disaster Risk Reduction 2015–2030. One of the seven global core goals is to significantly reduce the vulnerability of critical infrastructures and increase their resilience [20].
In this paper, the resilience of a water supply system is defined as the ability of a system to maintain its performance at an acceptable level. This is accomplished by being able to recover disturbances with the fundamental abilities and existing resources in a timely and efficient manner after a system failure. The resilience of water supply systems thus results from the resistances that are present before the occurrence of the damage event and the availability of resources, which are not only finite but in municipalities and water supply companies are also differently distributed.
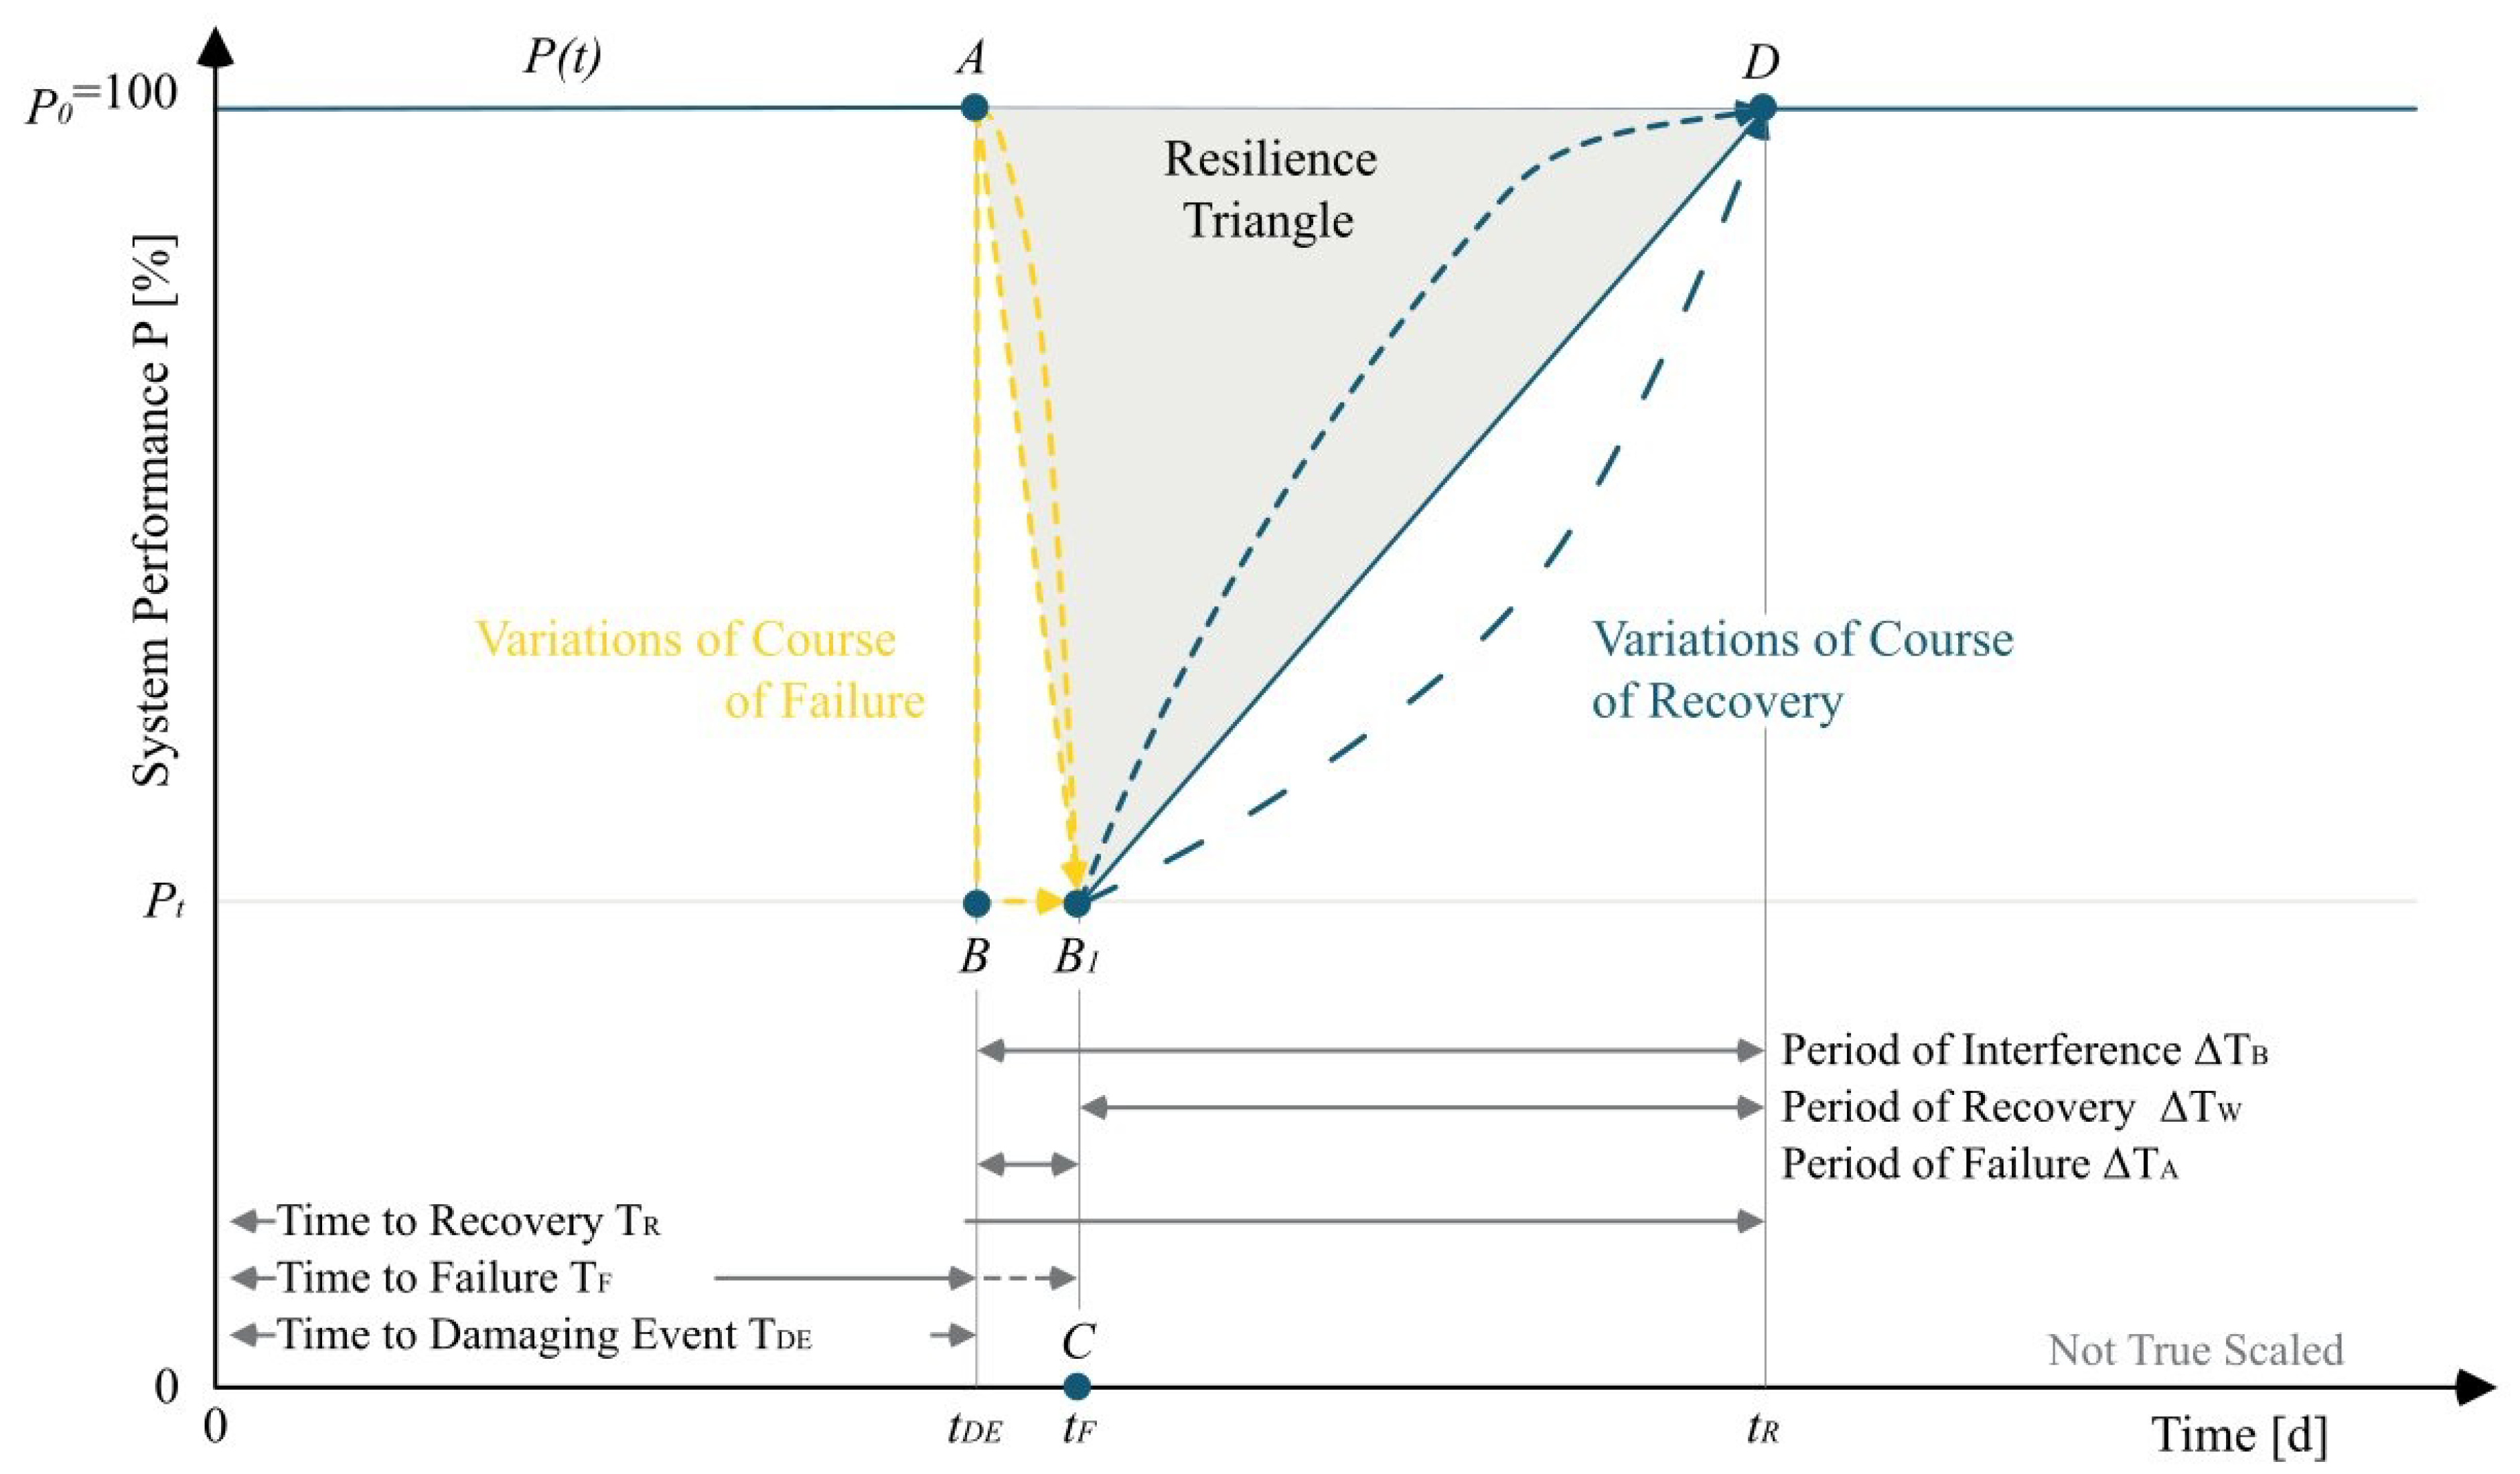
The resilience of critical infrastructures is often described using a performance-based resilience curve or “resilience triangle” (Figure 1) [21,22,23,24,25,26]. Applied to a water supply system, the performance during normal operation is the the average daily water demand () which is thus delivered to the consumers. At time a damaging event occurs (point A). If the effects of the disturbance on the water supply system occur immediately, the points A and B are vertically superimposed and both occur at time = . If the effects of the disturbance on the water supply system are delayed, the point is not directly vertically below A, meaning that occurs after .
Figure 1 shows different curves for the recovery process (from B1 to D). It is assumed that the system performance after recovery returns to the level before the interruption and is constant afterwards. In simplified representations, the recovery process is shown as a linear function (solid line). Other courses are obtained with fast or initially slower recovery processes [27,28].
The loss of resilience R can be determined by the area between the performance curve without a disruptive event and the course of the expected performance degradation over time (i.e., time to recovery), as shown in Equation (1) [21]. Resilience is determined according to Ayyub [25] using Equation (2) according to performance per unit of time.
with
| R | Loss of resilience |
| Time of damaging event | |
| Time of recovery | |
| Performance under normal conditions | |
| Performance at time t |
Resilience can be increased if the probability of occurrence of harmful events is reduced, the impact of these events is mitigated by system hardening or the recovery time is shortened by effective crisis management [21]. In addition, the loss of performance in the area of water supply can be compensated by emergency water supply measures [2]. Due to economic constraints, water supply companies have only limited financial means to stock or provide resources for replacement or emergency water supply [29]. This paper contributes to the development of strategic and operational approaches for the assessment of the resilience of water supply systems by presenting an approach that incorporates system dynamics modelling with emergency water supply measures.
The aim of this system dynamics model is the mapping of processes and sub-processes of a water supply system in various emergency situations under consideration of the measures of emergency water supply. The model for the management and evaluation of the handling of limited resources should serve the decision-making process and be applicable even in case of low data availability. The target group for the application of the model and the exploitation of results includes responsible persons in water supply companies, health authorities, disaster control authorities and other national or international institutions.
2. Background
In case of the impairment or failure of the normal supply, alternative possibilities for the extraction, treatment, storage and distribution of water are required to compensate the loss of performance [1,30]. Depending on the extent of the impairment or failure, as well as other general conditions, certain supply measures are used for emergency water supply [31]. The necessity of a water treatment depends on the respective quality of the water used. The possibility of water storage depends on the structure of the supply system and the available water quantities. In this paper, the supply measures are classified based on Bross et al. [2].
Table 1 shows the types of extraction and distribution used for emergency water supply and the form of delivery. Based on the possibilities of water extraction, distribution and delivery, 19 supply measures can be derived. The measures of supply are differentiated according to the type of extraction, distribution and delivery and are each provided with a number (1 to 4) and a letter (a to e) for clear identification. The numbers correspond to the type and origin of the water. The letters are used to differentiate the measures of supply according to how the water reaches the consumers.
The determination of the amount of water required can be carried out using a bottom-up approach as well as a top-down approach (Figure 2). A bottom-up approach is used to formulate the amount of water necessary for vitality. Here, it is assumed that a minimum amount of water is required by the consumers, which is set as a lower limit. When determining acceptable losses in terms of the quantity or quality of the water, a top-down approach is applied. This approach considers the technical minimum water quantities for maintaining a system or for avoiding the “point of no return” [3]. The bottom-up approach is thus oriented towards the requirements of the consumer. In contrast to this point, the top-down approach is based on the requirements of the technical system, especially the water distribution network.
In Germany, the average daily demand in normal operation () is 120 l/(P·d) according to the German Association for Gas and Water (DVGW) worksheet W410 [32]. In both [33,34], it is shown that the security of supply is the top priority for the central water supply.
If the water volume in the system is too small, contamination can be introduced due to negative pressure. Therefore, a system-dependent minimum water volume is necessary for the operation of the grid-bound supply to avoid hygienic and technical problems [3]. This volume is dependent on various factors such as the structure of the supply network, the supply pressure and the possibility of the temporary separation of sub-areas and must be estimated by the water supply utility on the basis of hydraulic pipe network calculations. Independent of the system-dependent minimum water quantity, according to the Civil Defense Concept (KZV) at least 50 l/(P·d) of water should be provided by the operator of the drinking water supply system for an unlimited period of time, both in regular operation and in the case of restricted supply [35].
A grid-independent water supply offers the possibility to supply the population with water if this is not possible on fixed distribution grids [3]. In [36] as well as in [35], the quantitative requirements for grid-bound water supply, which are valid in Germany in the case of defence, are presented. Since there are no further requirements for grid-bound water supply in Germany, the requirements of 15 l/(P·d) according to [35,36] are also considered for the water supply in emergency situations.
3. Materials and Methods
System dynamics (SD) is a method for the mapping and simulation of technical and socio-economic, quantitative and qualitative systems on the basis of a systems-theoretical and cybernetic model approach [37]. The theoretical foundations of SD thus form the approaches and basic ideas of systems theory. The SD method enables the mapping of the state changes of discrete systems in the form of a continuous flow and thus the transformation of discontinuous systems into continuous models [38]. Furthermore, the method offers the possibility to model complex, non-linear, dynamic and feedback systems [39]. Consequently, complex interrelations can be described in a structured way, thus providing a deeper understanding of prevailing problems.
SD models focus on the understanding of circular relationships (feedback loops) driving the outcomes of a system [39]. The structure of a model can be represented and analyzed by graphs. According to SD philosophy, the system behaviour is largely determined by its structure. Therefore, SD models put more emphasis on the relationships between the system elements than on the accuracy of the input and output data [40].
The model developed here depicts a water supply system in which sub-processes are substituted by measures of emergency water supply due to an impairment of the normal supply. However, these measures are linked to a limited availability of the required resources.
The effectiveness of the use of existing resources is evaluated by the water quantity provided as well as the amount of unsupplied population and number of patients. Therefore, the aim of this model is to determine and minimize the amount of water that is missing in an emergency due to the use of limited resources for replacement and emergency water supply.
Based on the considered emergency situations, all suitable emergency water supply measures according to the developed system analysis are compared and evaluated. For this purpose, different alternatives combining emergency water supply measures are compared on the basis of different emergency situations. Subsequently, the provided water quantity as well as the number of supplied inhabitants and patients are compared.
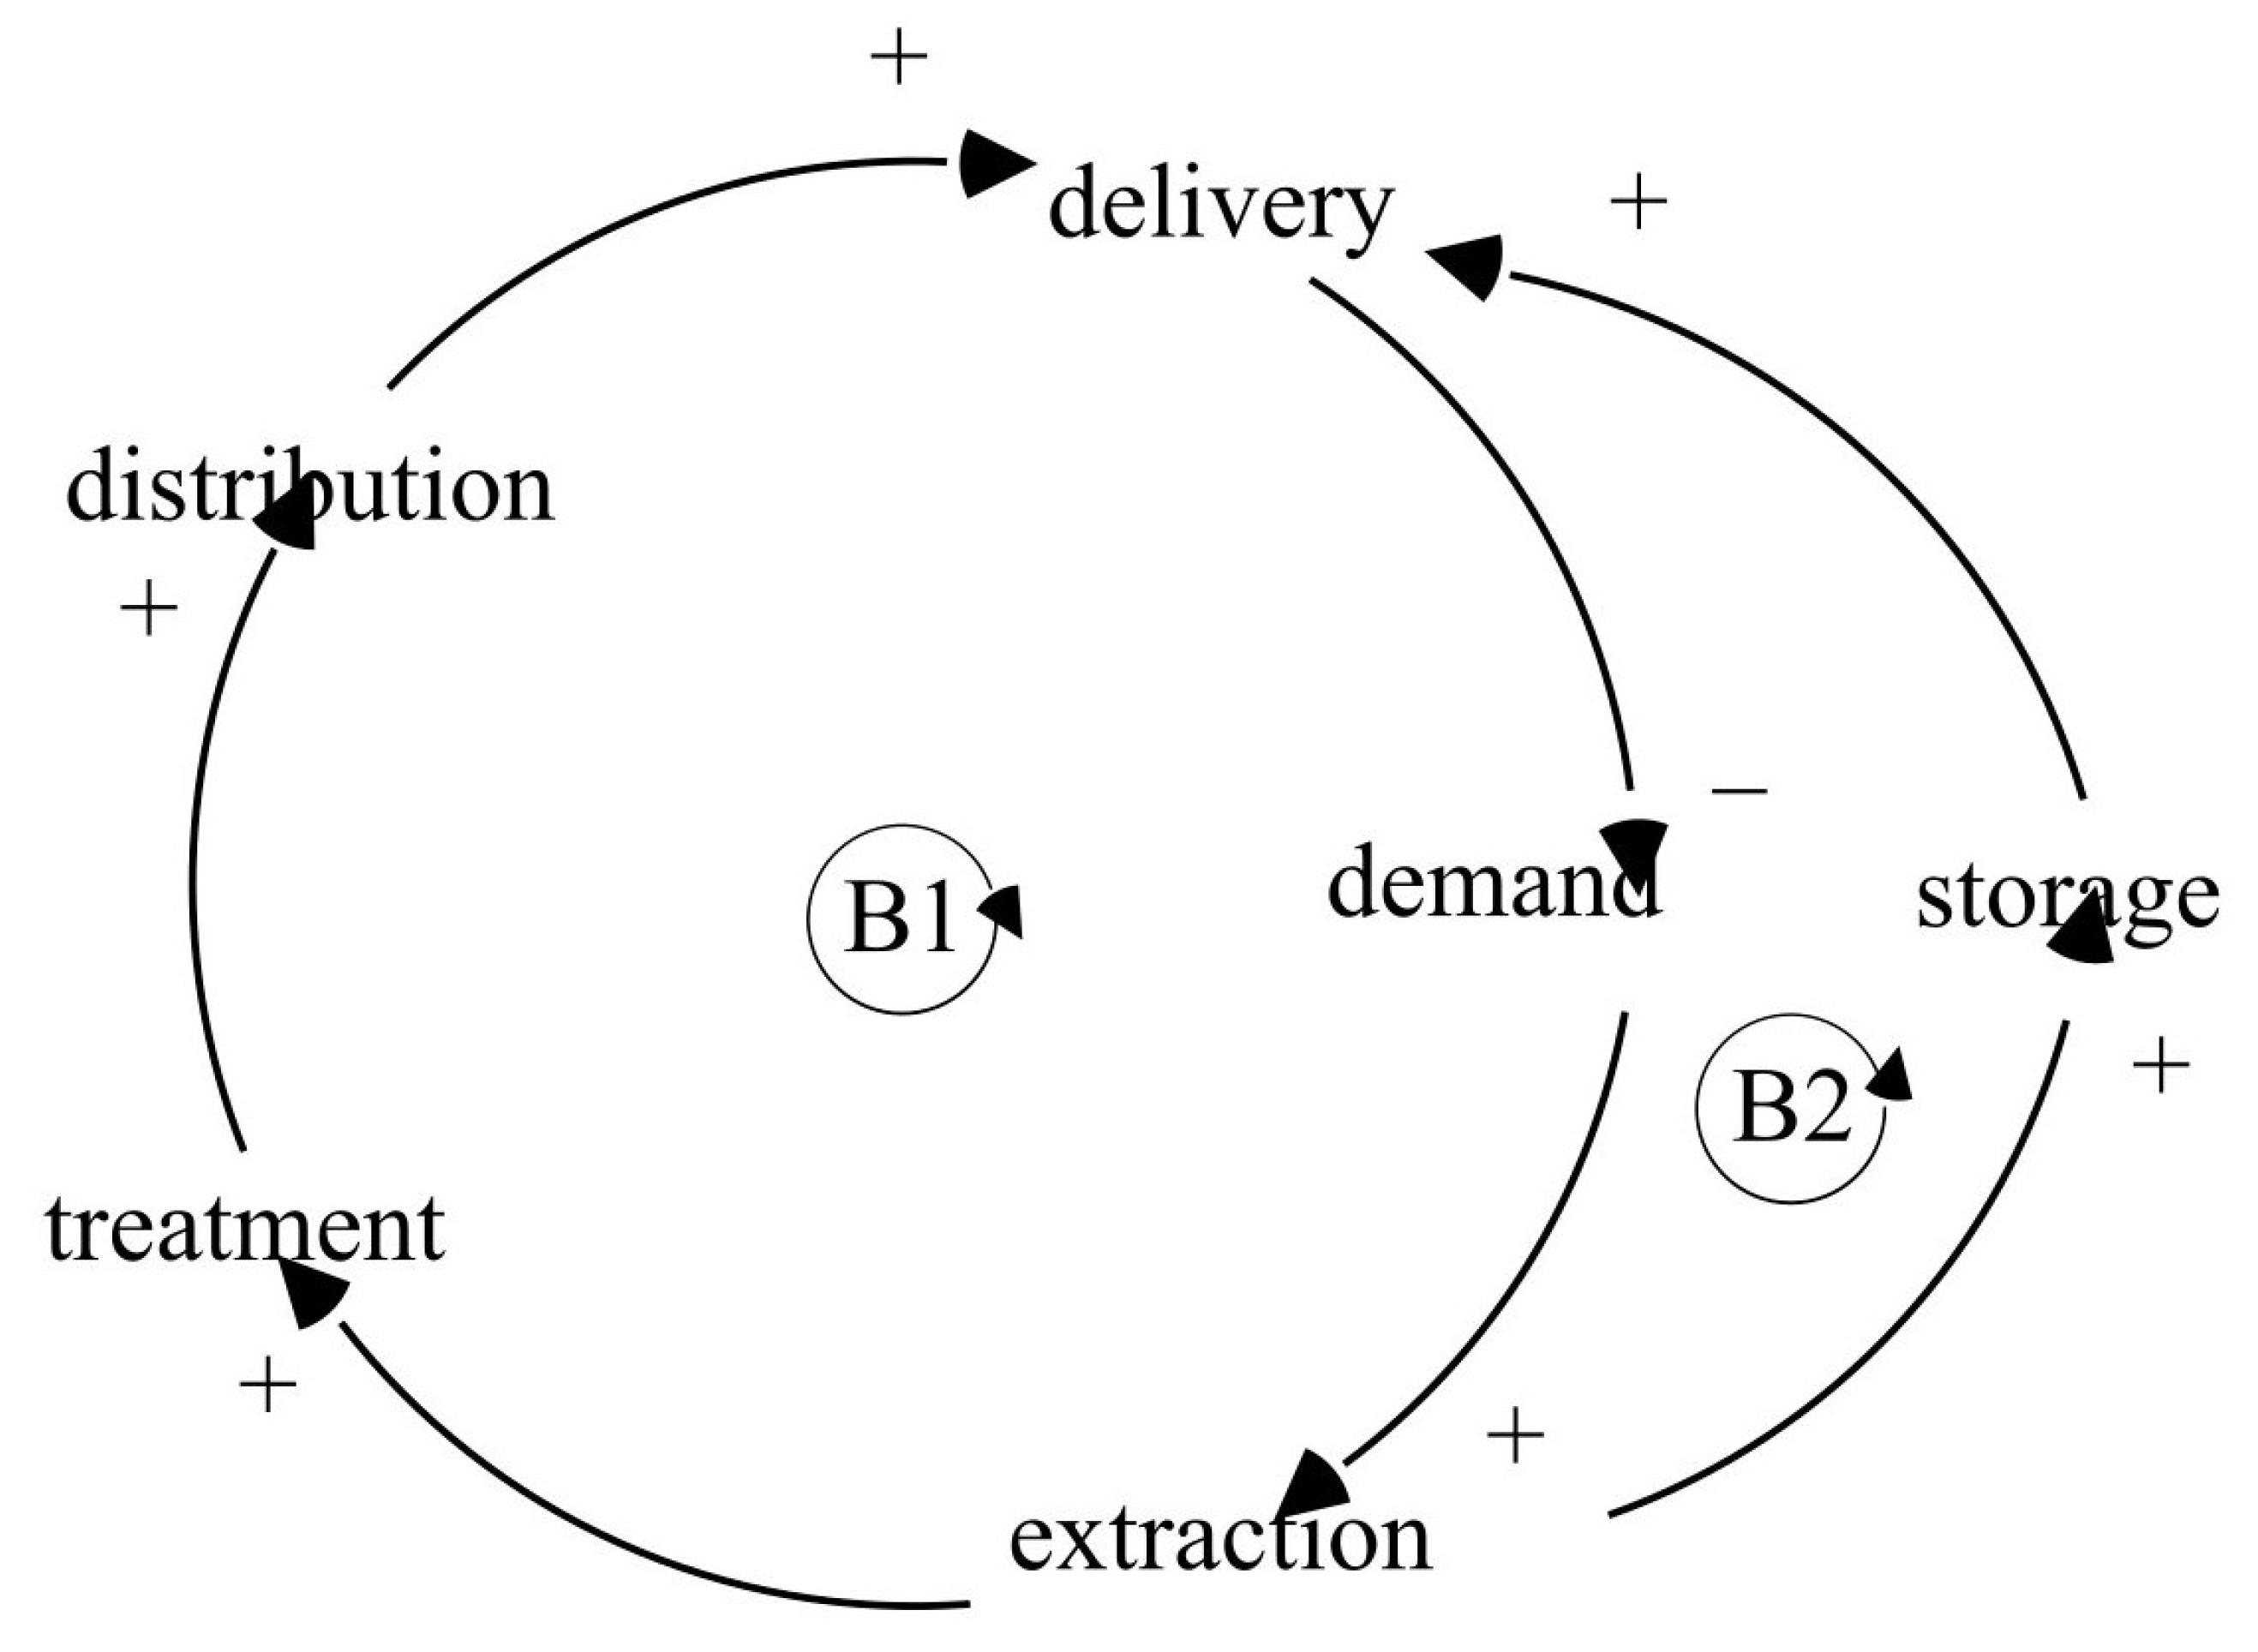
The structure of the model is based on the causal relationships between demand and supply as well as the capacity of extraction, treatment, storage and distribution. Figure 3 shows the causal loop diagram and system boundaries of the model. The quality aspects of the water (raw water quality and type of treatment), the consumer behaviour (especially diurnal fluctuations of the water demand) and the network structure are not considered, as they are not relevant for the fulfillment of the objectives of this model.
The model serves the evaluation of the efficiency of the emergency water supply system on the basis of the quantity of water that is missing for the complete satisfaction of demand. Figure 4 shows the structure of the SD model and the correlations for the determination of the target value. The water demand of the emergency supply depends on the amount of water missing compared to the normal supply. The quantity of water delivered also depends on the capacities of the supply types of the replacement and emergency water supply. Nineteen emergency supply measures, which differ in terms of the types of extraction, distribution and delivery, as explained in Section 2, are considered in the model.
The model is validated with a case study and examined for practical suitability. The case study is a water utility close to Frankfurt, Germany, which supplies approximately 20,000 inhabitants. In total, the water supply company delivers about 2400 m3/d.
The water supply utility has limited resources for emergency water supply. There are two emergency wells on the premises of the waterworks. The maximum withdrawal quantity from the emergency wells is 24 m3/d. In addition, a UF-15 mobile treatment plant can be obtained from the regional Technisches Hilfswerk (German Federal Relief Agency) Group. The UF-15 is a mobile and modular ultrafiltration treatment plant, which has a treatment capacity of 15 m3/h. Furthermore, the water supply company has three mobile storage tanks, each with 1 m3 capacity. The containers can be used for transport and can be used for centralised or decentralised storage. These containers can be used according to 20 different possibilities of resource utilisation, as shown in Equation (A1). The results are shown for 18 possibilities for resource utilisation (see Table A1 in Appendix) because in two of the combinations the model did not show any differentiation to other combinations.
with
| Number of combinations | ||
| Number of containers | here 3 | |
| Number of uses | here 4: Centralised raw water storage, | |
| Centralised treated water storage, | ||
| Decentralised treated water storage, | ||
| Water transport |
4. Results
4.1. System Analysis to Identify Emergency Situation and Determine Appropriate Measures of Emergency Water Supply
In order to be able to determine the appropriate measures of supply, emergency preparedness planning is based on the systematic analysis of impaired sub-processes by deriving specific emergency situations. Depending on the extent of the damage event or the local conditions, a combination of several measures of supply should be considered. In individual cases, suitable and prioritised measures of care may differ from the recommendation depending on local conditions.
In the system analysis, the remaining functionality of the sub-processes of the water supply is considered (Figure 5). In principle, this makes it possible to determine which emergency water supply measures can be considered for this emergency situation, since the effects on the functional efficiency have already been considered.
First, it has to be determined whether the water quantity extracted daily by the water utility () meets the grid-independent water demand according to [36] (). If this is the case, it must be clarified whether the water quantity from the own extraction plants, which meets the applicable quality requirements (), at least corresponds to the average daily water demand of the normal supply (). Depending on the functionality of the grid network and the storage tanks, the conditions are similar to the emergency situations E1 to E3.
E1 represents, e.g., an event with a network section to be bridged, whereas in E3, the network is no longer functional. The quality of grid-based supply must be ensured. The resulting emergency water supply measures to be prioritised are shown in Table A2. In these emergency situations, the water from the company’s own extraction should primarily be used. The types of distribution and delivery vary between emergency situations.
If the treated water quantity cannot cover the demand in the amount of , it has to be determined whether sufficient mobile treatment capacities () are available to cover the . If this condition is fulfilled, the emergency situationsE4 to E6 are assumed, depending on the functionality of the pipe network and the storage tanks. In these emergency situations, water provided by another water supply utility is the preferred water type (Table A2). Due to the existing capacities of mobile treatment, water from grid-independent wells or springs as well as surface water can also be used for a grid-bound supply. Since the water from the company’s own extraction is not sufficient for the grid-bound supply in these emergency situations, or only parts of the supply area can be supplied with it, the grid-independent supply measures with this type of water have the lowest priority.
In the emergency situations E7 to E9, the mobile treatment capacities () are not sufficient for the complete coverage of . As a result, only water from another utility company can be used for grid-bound supply (Table A3 and Table A4). Water from the utility’s own extractions plants, from grid-independent wells and surface water can only be used for grid-independent supply if it meets the applicable quality requirements.
If no mobile treatment plant is available, the system analysis results in the emergency situations E10 to E12, depending on the functionality of the grid and the storage tanks. Priority must be given to a grid-bound supply of water from another utility. In addition, the water from the utility’s own extraction plants can be used for grid-independent supply.
If the grid-independent demand, which results from the water quantities according to the German First Water Security Ordinance [36] (), cannot be covered by the respective extraction plants, the next step is to check whether treatment capacities () are available to cover . If sufficient water can be treated, the emergency situations E13 to E15 are considered, depending on the functionality of the grid network and the storage tanks. In these emergency situations, the water of another utility company has to be prioritised before water from grid-independent wells and surface water (Table A4).
If the mobile treatment capacity () is not sufficient to cover the demand in the amount of but is sufficient to cover the demand according to [36], this results in emergency situations E16 to E17. In these emergency situations, a grid-bound supply of water from another utility company has to be prioritised (Table A5). Water from grid-independent wells as well as surface water can only be used for a grid-independent supply due to the available treatment capacities.
4.2. Effective Use of Resources of Case Study for Emergency Water Supply
The assessment of the effective use of resources with the SD model is based on the supply deficit; the smaller the deficit, the more effective the use of resources.
The simulation of the model is performed with the parameters of the water supply company in the case study. The available resources of the water supply company form the basis for the comparison of the supply types. The model is used to determine how additional resources should be used effectively to meet the respective protection goals.
The consideration of the use of resources is based on the emergency situationsE1, E2, E7, E8, E12, E16 and E17 (see Table 2). These emergency situations were selected to consider different appropriate emergency water supply measures in order to obtain generally benign results. In the selected emergency situations, at least one type of raw water present in the case study is suitable for supply.
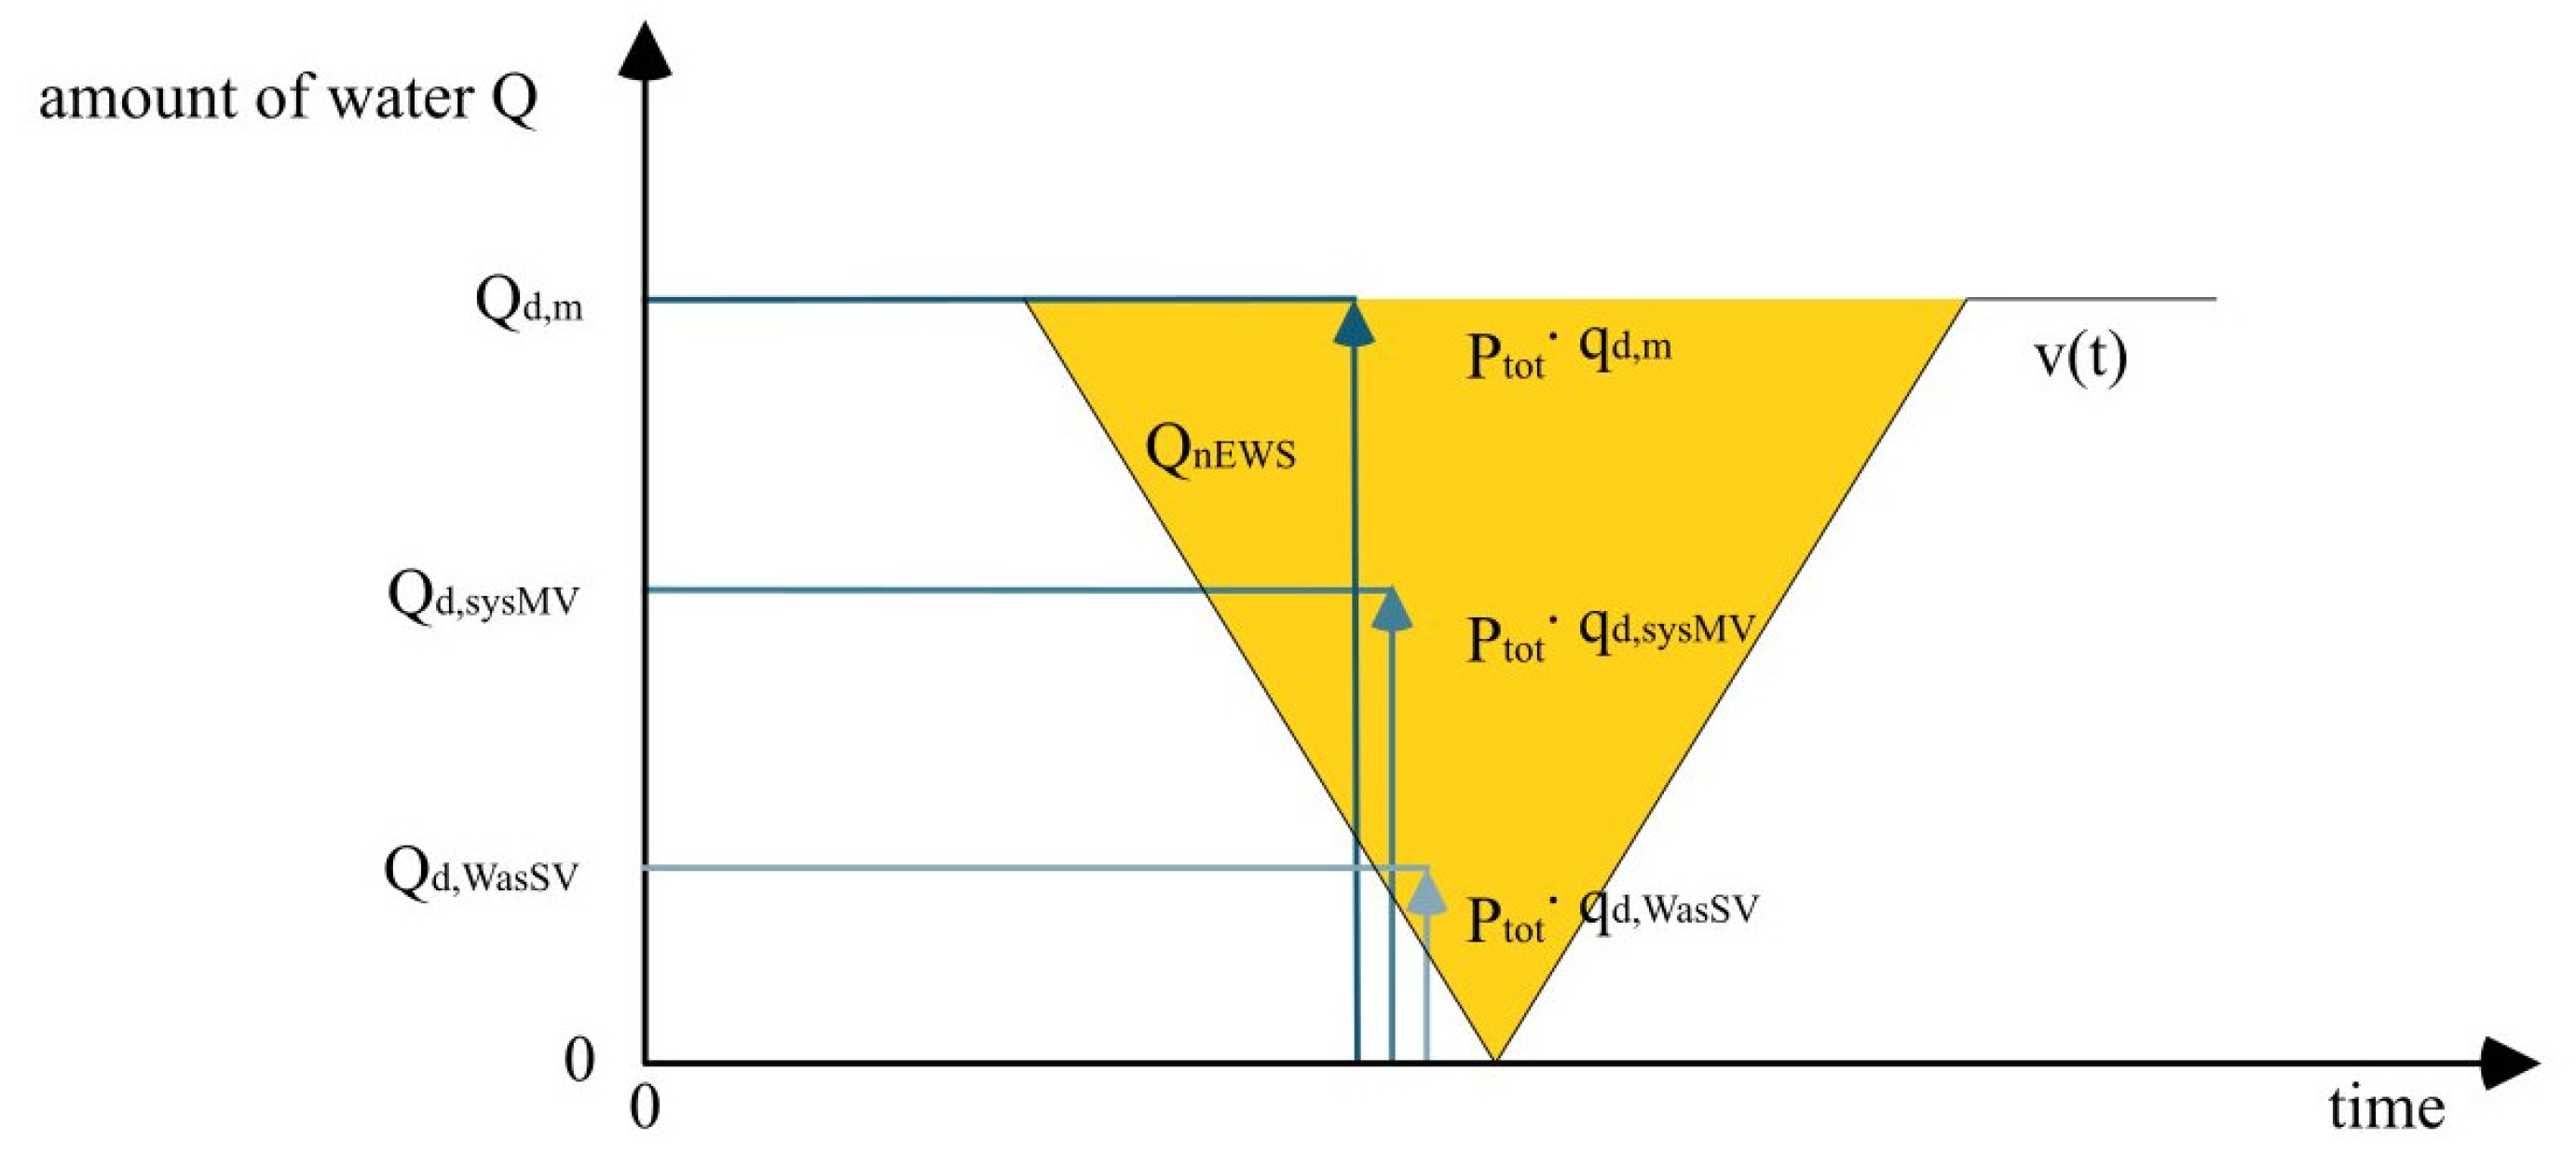
The results of the modelling are visualised by percentage representations of the amount of water delivered or persons supplied depending on the use of resources in heat maps and bar charts. The effectiveness of the application is assessed on the basis of this observation. In addition, selected emergency situations (E1, E2, E7, E8, E12, E16 and E17) are used to show the amount of water dispensed specifically according to the measure of emergency supply being used. All figures have the common feature that the quantity of water delivered () or the persons supplied () refer to the quantity of water required for normal supply () or the entire population (). The amount of water required for normal supply corresponds to the area between the performance curve during the emergency and the average daily water demand () (Figure 6). In the case study, the of 20,000inhabitants requires , amounting to 17,505 m3 with a linear course of failure and recovery.
with
| Average daily water demand per inhabitant | 120 l/(i · d) [32] | |
| Minimum system dependent water demand per inhabitant | 50 l/(i · d) [35] | |
| Grid-independent water demand per inhabitant | 15 l/(i · d) [36] |
If all existing containers in the case study are used for distribution, a maximum of 45 m3 per day can be delivered to the consumers. Compared to the normal supply, the proportion of the water quantity dispensed is in the single-digit percentage range (Figure 7).
In the emergency situations E1 and E2, up to 3% of the required water quantity can be delivered (Figure 7c). This also applies to the emergency situations E7 and E8 (Figure 7d) and E12 (Figure 7e).
In the emergency situations E16 and E17, the supply of water from the system’s own extraction plants is not suitable. Due to the limited mobile treatment capacities, only about 0.3% of the amount of water required for normal supply can be delivered by a combination of the emergency water supply measures 3c and 3d using the resources, if possible, from C14 (Figure 7f). For this purpose, one third of the containers are used for transport and two thirds for the central water storage.
The available resources therefore only allow for a minimal supply. Only a fraction of the population can be supplied via the grid. A grid-bound supply is not possible with the available resources.
4.3. Resources Required to Meet the Quantitative Protection Goals of the Case Study
To meet the protection goals, the required resources are determined based on the missing water quantity at the time of the complete failure (Figure 6). Thus, the required capacities are based on the number of inhabitants that need to be supplied at the time of the maximum failure multiplied by the specific grid-bound or grid-independent demand per person according to Section 2. The capacities shown in Table 3 are required as the sum of the respective supply types with regard to water production, treatment and distribution in each emergency situation.
4.4. Fulfillment of the Quantitative Protection Goals of the Case Study of Grid-Independent Supply by Using Additional Resources
In order to provide the quantity of water needed to meet the quantitative protection goal of grid-independent supply, extraction, treatment and distribution capacities of 310 m3/d are required (Table 3). The existing extraction capacities already meet this requirement; however, in the area of treatment and distribution capacities, additional resources can be generated for this purpose. The considered capacities are shown in Table 3.
The amount of water that can be provided and the proportion of people supplied when the treatment capacities are increased are shown in Figure 8. In some emergency situations, the amount of water dispensed corresponds to approximately 10% of the amount of water required for normal supply (Figure 8a). Nevertheless, in these emergency situations, all inhabitants can be supplied by the grid-independent supply (Figure 8b). In the emergency situations E13 to E20, no supply is possible, because the required extraction capacities of another utility company are not available.
In the emergency situationsE1 and E2, more than 10% of the water quantity required for normal supply can be provided by the supply measures 1b and 1c when all containers are used for transport (C9) (Figure 8c). This is also possible in the emergency situationsE7 and E8 (Figure 8d. In this case, the supply measure 1c is most suitable. This also applies in emergency situationsE12 (Figure 8e).
In the emergency situationsE16 and E17, the amount of water delivered is reduced to about2% of the amount of water needed for normal supply (Figure 8f). In these emergency situations, the water from the utility’s own extraction plants cannot be used. Due to the limited capacities of the mobile treatment plants, only grid-independent supply measures are suitable.
When water is supplied from tap-independent wells, central treated water storage tanks are required to decouple the extraction and treatment process from the distribution. This is considered in the model. Thus, for these supply measures, a part of the tanks is needed for storage, and the possibility of resource use C9 is consequently not suitable. If only a part of the containers is used for transport, the available distribution capacity decreases. The effects can be seen by comparing the results shown in Figure 8f with those in Figure 8c–e. When using one third of the tanks for transport and two thirds of the tanks for central raw water storage (C14), the combination of supply measures3c and 3d can deliver about 2% of the water quantity required for normal supply in the case study.
The increase of the existing resources to seven times the capacity of the already available tanks enables the grid-independent supply of the entire population in the emergency situations E1 to E12 in the case study. However, the use of mobile pipes with the corresponding capacities does not lead to this result. Mobile pipes are used for grid-bound supply measures and in the case study only allow a partial supply of the population.
4.5. Meeting the Quantitative Protection Goals of the System-Dependent Minimum Water Quantity by Using Additional Resources
The capacities shown in Table 3 are needed to provide the water quantity to fulfill the quantitative protection goals of the system-dependent minimum water quantity. The results are given in Figure 9.
The additional resources lead to a delivered water quantity of almost 70% of the water quantity required for normal supply (Figure 9a). The entire population can be supplied (Figure 9b). Depending on the emergency situation, the supply is provided by a grid-bound or grid-independent delivery.
In the emergency situations E1 and E2, the supply can be provided by the emergency water supply measures 1a or 1b (Figure 9c). In the emergency situationsE7, E8, E12, E16 and E17, the quantity of water delivered is reduced to about 10% of the quantity required for normal supply (Figure 9d–f). In these emergency situations, the emergency water supply measures under consideration cannot be used for grid-bound supply. This requires the extraction capacities of another utility company.
4.6. Fulfillment of the Quantitative Protection Goals of Normal Supply by Using Additional Resources
In order to provide water to meet the quantitative protection goals of normal supply, extraction, treatment and distribution capacities of 2497 m3 are required (Table 3). The available capacities from the company’s own extraction plants meet this requirement. The extraction capacities of the existing emergency wells are not sufficient, but no additional wells can be exploited. Additional resources are also needed in the area of processing and distribution capacities (Table 3).
In some emergency situations (e.g., E1 and E2), the complete delivery of the water quantity required for normal supply is possible with these resources (Figure 10). However, this does not apply in all emergency situations. In these situations, either no grid-bound supply is possible and thus only a small amount of water can be delivered, or only those measures of supply are suitable that can fulfill the protection goal under the consideration of water from another supplier.
Compared to the previous considerations, these additional resources can be used to supply the entire population at least grid-independently in emergency situationsE13 and E14 (Figure 10f).
4.7. Comprehensive Findings on the Effective Use of Existing and Additional Resources
The possible uses of the resources depend primarily on the respective emergency situation and the sub-processes that can be replaced. Nevertheless, some findings can be derived and generalised from the considered resource stocks.
In general, grid-bound measures of supply are suitable if the resource stock allows at least the provision of the system-dependent minimum water quantity. If these capacities are available, supply measures that feed into the supply network or high-level tank through mobile pipes as well as through transport vehicles can be suitable. The use of mobile pipelines requires a certain amount of additional storage capacity to compensate for differences between water production and delivery. When using transportable containers, this is not necessary when feeding water into the supply network by means of transport vehicles. Grid-bound supply measures need to be prioritised from a hygienic and technical point of view.
Grid-independent supply measures are particularly suitable when resources are limited, since the required amount of water is less than with grid-bound delivery. In the case of grid-independent supply, the supply measures with decentralised delivery by transport vehicles are particularly suitable, if these are available. In this case, the largest amount of water can be provided with minimum resource capacities if all transportable containers are used for distribution. Further container capacities increase the flexibility by balancing extraction and delivery.
Sufficient extraction capacities are essential to ensure supply in all emergency situations. A limitation of these capacities as well as of the available types of water can be sufficient for full supply in some emergency situations and still lead to undersupply in other situations. The results of the case study illustrate that supply interrelationships with other water supply companies are essential to increase the resilience of the water supply system.
5. Discussion
The system dynamics model was developed to identify which combination of resources for emergency water supply is most effective. The model was used to determine the amount of water that can be provided with different resource capacities.
Simulation models always represent a great simplification of reality. They represent only a part of the real situation and can only be approximated to real systems [41]. The goal of modelling dynamic systems is to understand and explain their system behaviour and the reasons for this behaviour by recognizing the connections between numerous cause-effect relationships [42]. System dynamics models are particularly suitable for the treatment of complex problems [43], since the system under investigation is structured in a simplified way and the existing relationships and dependencies are presented transparently [44]. Thus, system dynamics models are characterised by clarity and comprehensibility [45].
The model enables the representation of direct and indirect relationships between the parameters of water demand, extraction capacity, distribution capacity and water delivery capacity by means of various feedback loops. The dynamic developments caused by impairments of the normal supply can be simulated and analyzed with the help of these processes. Taking into account the existing uncertainties, the purpose of the model is not the exact prognosis of water demand or consumption or the reproduction of historical or future courses, but the comparison of several possibilities as a transparent basis for decision-making. Rather, qualitative behavioural characteristics can be recognised by the output in order to identify possible influencing factors and trends [46].
In practice, in emergency situations, water is often supplied in two quality categories. On the one hand, drinking water is supplied for drinking and food preparation. On the other hand, water which does not fulfill the drinking water quality requirements is provided for economic purposes. This model considers only quantities. For the implementation planning of the emergency water supply, a differentiated consideration must be added.
The available resources of the case study allow the provision of up to 45 m3 depending on the resource usage. The currently available resources are therefore not sufficient to provide the quantitative minimum water quantities for a grid-bound water supply.
However, the effectiveness of the resource use can be differentiated in the model by the amount of water lacking. The amount of water delivered is highest when the three existing containers are used for transport. Nevertheless, they only provide a small supply, as only a small part of the population can be supplied. Despite the maximum effectiveness of the resources used, additional resources are necessary in the case study.
The amount of water that can be provided is highest for the case study if the distribution is carried out by transportable containers. Since these containers can cover greater distances than mobile pipes, they can be used for both grid-bound and grid-independent supply. In addition, distribution with mobile pipelines requires supplementary storage tanks to compensate for the difference between extraction and delivery.
Nevertheless, extensive capacities are required across resources to meet even the lowest protection target. This emphasizes the considerable logistical effort of emergency water supply. Since the provision of the required resources is still associated with a considerable financial outlay, the relevance of maintaining the grid-bound supply and the cooperation of neighboring water utilities is emphasised. This logistical and financial effort is not easily affordable for water supply utilities.
6. Conclusions
A reliable water supply—even in emergency situations—is a basic requirement for a stable social system. Failures of the drinking water supply quickly lead to supply bottlenecks due to the high dependence of the population on the central water supply, especially in industrialised countries such as Germany. Since the functionality of water supply systems can be impaired by natural or man-made hazards, increasing the resilience of critical infrastructure has been defined as one of the seven global core objectives of the Sendai Framework for Disaster Reduction 2015–2030. This requires the understanding, analysis and quantification of resilience by water utilities, government agencies, decision makers and other relevant institutions.
By applying the developed system dynamics model to the case study, the effective use of resources and the derivation of the respective ideal supply types could be shown as an example. The results of the analysis of the case study make it clear that resources that can be used for both grid-bound and grid-independent supply must be prioritised. Transportable containers in particular are to be preferred due to their potential for flexible use. This must be taken into account during the planning and procurement of resources.
Author Contributions
Conceptualization, L.B. and S.K.; Data curation, L.B.; Formal analysis, L.B.; Investigation, L.B.; Methodology, L.B.; Software, L.B.; Supervision, S.K.; Validation, L.B.; Visualization, L.B.; Writing–original draft, L.B.; Writing–review & editing, L.B. and S.K. All authors have read and agreed to the published version of the manuscript.
Funding
This research received no external funding.
Acknowledgments
This research was supported by the Research Center RISK of the Bundeswehr University Munich. The authors thank the staff of the water utility of the case study especially Ronald Roepke and Martin Launer for their support.
Conflicts of Interest
The author declares no conflict of interest.
Abbreviations
The following abbreviations are used in this manuscript:
| Daily filling machine capacities | m3/d | |
| Daily mobile treatment capacities | m3/d | |
| Daily transport capacities | m3/d | |
| Capacity of one filling machine | m3/(fm·d) | |
| Ci | Combination i of use of containers | |
| Daily mobile treatment capacity of one treatment plant | m3/(mt·d) | |
| Daily transport capacity of one transport vehicle | m3/(t·d) | |
| Ei | Emergency situation i | |
| EWS | Emergency water supply | |
| Number of filling machines | ||
| Number of mobile pipes | ||
| Number of mobile treatment plants | ||
| Number of transport vehicles | ||
| Number of inhabitants supplied | ||
| Total number of inhabitants | ||
| Available amount of water delivered via emergency water supply | m3/d | |
| Daily water quantity from own extraction plant | m3/d | |
| Water from own extraction plants, which meets the applicable quality requirements | m3/d | |
| Average daily water demand | m3/d | |
| Daily distribution capacity of mobile pipes | m3/d | |
| Grid-independent water demand according to 1. WassV [36] | m3/d | |
| Necessary amount of water delivered via emergency water supply | m3/d | |
| Daily distribution capacity of one mobile pipe | m3/(mp·d) |
Appendix A

Table A1.
Proportional possibilities of using the existing containers.
| Proportion of Containers Used as | ||||
|---|---|---|---|---|
| Combination of Use | Transport | Centralised | Centralised | Decentralised |
| of Containers | Vehicle | Raw Water Storage | Treated Water Storage | Treated Water Storage |
| C1 | 0% | 100% | 0% | 0% |
| C2 | 0% | 0% | 100% | 0% |
| C3 | 0% | 0% | 0% | 100% |
| C4 | 0% | 66.6% | 33.3% | 0% |
| C5 | 0% | 66.6% | 0% | 33.3% |
| C6 | 0% | 33.3% | 33.3% | 33.3% |
| C7 | 0% | 0% | 66.6% | 33.3% |
| C8 | 0% | 0% | 33.3% | 66.6% |
| C9 | 100%* | 0% | 0% | 0% |
| C10 | 66.6%* | 33.3% | 0% | 0% |
| C11 | 66.6%* | 0% | 33.3% | 0% |
| C12 | 66.6%* | 0% | 0% | 33.3% |
| C13 | 33.3%* | 66.6% | 0% | 0% |
| C14 | 33.3%* | 0% | 66.6% | 0% |
| C15 | 33.3%* | 0% | 0% | 66.6% |
| C16 | 33.3%* | 33.3% | 33.3% | 0% |
| C17 | 33.3%* | 0% | 33.3% | 33.3% |
| C18 | 33.3%* | 33.3% | 0% | 33.3% |
* The transportable storage container is loaded onto a transport vehicle and driven from the extraction or storage site to the feed-in or delivery point.
Table A2.
First part of the emergency situations, the measures of supply identified as suitable and the resources required.
Table A2.
First part of the emergency situations, the measures of supply identified as suitable and the resources required.
| emergency situation | E1 | E2 | E3 | E4 | E5 | |
|---|---|---|---|---|---|---|
| own extraction plant | A1 | A1 | A1 | D1 | D1 | |
| other utility | A1 | A1 | ||||
| grid-independent well | B1 | B1 | ||||
| surface water | C1 | C1 | ||||
| connecting pipe | A2 | A2 | ||||
| mobile pipes | A2 | A2 | A2 | D2A2*B2C2 | D2A2*B2C2 | |
| transport vehicle | A2* | A2* | A2* | D2*A2**B2*C2* | D2*A2**B2*C2* | |
| filling machine | A2** | A2** | A2** | D2**A2***B2**C2** | D2**A2***B2**C2** | |
| feeding into high-level tank | A3 | A3B3C3 | ||||
| feeding into grid | A3* | A3 | A3*B3*C3* | A3B3C3 | ||
| direct delivery | A3** | A3* | A3 | D3A3**B3**C3** | D3A3*B3*C3* | |
| A, B, C, D | different types of water that can be used alternatively; A has priority over B | |||||
| B has priority over C, C has priority over D | ||||||
| 1, 2, 3 | successive components of the respective supply measures; 1 extraction, | |||||
| 2 distribution, 3 delivery | ||||||
| *, **, *** | Alternatives of water distribution and delivery | |||||
Table A3.
Second part of the emergency situations, the measures of supply identified as suitable and the resources required.
Table A3.
Second part of the emergency situations, the measures of supply identified as suitable and the resources required.
| emergency situation | E6 | E7 | E8 | E9 | |
|---|---|---|---|---|---|
| own extraction plant | D1 | B1 | B1 | A1 | |
| other utility | A1 | A1 | B1 | A1 | |
| grid-independent well | B1 | C1 | C1 | C1 | |
| surface water | C1 | D1 | D1 | D1 | |
| connecting pipe | A2 | A2 | |||
| mobile pipes | D2A2B2C2 | B2A2*C2D2 | B2A2*C2D2 | A2B2C2D2 | |
| transport vehicle | D2*A2*B2*C2* | B2*A2**C2*D2* | B2*A2**C2*D2* | A2*B2*C2*D2* | |
| filling machine | D2**A2**B2**C2** | B2**A2***C2**D2** | B2**A2***C2**D2** | A2**B2**C2**D2** | |
| feeding into high-level tank | A3 | ||||
| feeding into grid | A3* | A3 | |||
| direct delivery | D3A3B3C3 | B3A3**C3D3 | B3A3*C3D3 | A3B3C3D3 | |
| A, B, C, D | different types of water that can be used alternatively; A has priority over B | ||||
| B has priority over C, C has priority over D | |||||
| 1, 2, 3 | successive components of the respective supply measures; 1 extraction, | ||||
| 2 distribution, 3 delivery | |||||
| *, **, *** | Alternatives of water distribution and delivery | ||||
Table A4.
Third part of the emergency situations, the measures of supply identified as suitable and the resources required.
Table A4.
Third part of the emergency situations, the measures of supply identified as suitable and the resources required.
| emergency situation | E10 | E11 | E12 | E13 | E14 | |
|---|---|---|---|---|---|---|
| own extraction plant | B1 | B1 | A1 | |||
| other utility | A1 | A1 | B1 | A1 | A1 | |
| grid-independent well | B1 | B1 | ||||
| surface water | C1 | C1 | ||||
| connecting pipe | A2 | A2 | A2 | A2 | ||
| mobile pipes | B2A2* | B2A2* | A2B2 | A2*B2C2 | A2*B2C2 | |
| transport vehicle | B2*A2** | B2*A2** | A2*B2* | A2**B2*C2* | A2**B2*C2* | |
| filling machine | B2**A2*** | B2**A2*** | A2**B2** | A2***B2**C2** | A2***B2**C2** | |
| feeding into high-level tank A3 | A3B3C3 | |||||
| feeding into grid A3* | A3 | A3*B3C3 | A3B3C3 | |||
| direct delivery | B3A3** | B3A3* | A3B3 | A3**B3*C3* | A3*B3*C3* | |
| A, B, C, D | different types of water that can be used alternatively; A has priority over B | |||||
| B has priority over C, C has priority over D | ||||||
| 1, 2, 3 | successive components of the respective supply measures; 1 extraction, | |||||
| 2 distribution, 3 delivery | ||||||
| *, **, *** | Alternatives of water distribution and delivery | |||||
Table A5.
Fourth part of the emergency situations, the measures of supply identified as suitable and the resources required.
Table A5.
Fourth part of the emergency situations, the measures of supply identified as suitable and the resources required.
| emergency situation | E15 | E16 | E17 | E18 | E19 | E20 | |
|---|---|---|---|---|---|---|---|
| own extraction plant | |||||||
| other utility | A1 | A1 | A1 | A1 | A1 | A1 | |
| grid-independent well | B1 | B1 | B1 | ||||
| surface water | C1 | C1 | C1 | ||||
| connecting pipe | A2 | A2 | A2 | A2 | |||
| mobile pipes | A2B2C2 | A2*B2C2 | A2*B2C2 | A2* | A2* | A2 | |
| transport vehicle | A2*B2*C2* | A2**B2*C2* | A2**B2*C2* | A2** | A2** | A2* | |
| filling machine | A2**B2**C2** | A2***B2**C2** | A2***B2**C2** | A2*** | A2*** | A2** | |
| feeding into high-level tank | A3 | A3 | |||||
| feeding into grid | A3* | A3 | A3* | A3 | |||
| direct delivery | A3B3C3 | A3**B3C3 | A3*B3C3 | A3** | A3* | A3 | |
| A, B, C, D | different types of water that can be used alternatively; A has priority over B | ||||||
| B has priority over C, C has priority over D | |||||||
| 1, 2, 3 | successive components of the respective supply measures; 1 extraction, | ||||||
| 2 distribution, 3 delivery | |||||||
| 1*, 1**, 1*** | Alternatives of water distribution and delivery | ||||||
References
- DIN 2001-3. Trinkwasserversorgung aus Kleinanlagen und Nicht Ortsfesten Anlagen—Teil 3: Nicht Ortsfeste Anlagen zur Ersatz- und Notwasserversorgung —Leitsätze für Anforderungen an das Abgegebene Wasser, Planung, Bau, Betrieb und Instandhaltung der Anlagen (Drinking Water Supply from Small Systems and Mobile Systems—Part 3: Non-fixed Systems for Emergency Water Supply—Guiding Principles for Delivered Water Requirements, System Design, Construction, Operation and Maintenance); Deutsches Institut für Normung e. V.: Berlin, Germany, 2015. [Google Scholar]
- Bross, L.; Wienand, I.; Krause, S. Sicherheit der Trinkwasserversorgung: Teil 2: Notfallvorsorgeplanung (Security of Drinking Water Supply: Part 2: Emergency Preparedness Planning); Praxis im Bevölkerungsschutz, Federal Office of Civil Protection and Disaster Assistance: Bonn, Germany, 2019; Volume 15. [Google Scholar]
- Bross, L.; Krause, S.; Wannewitz, M.; Stock, E.; Sandholz, S.; Wienand, I. Insecure Security: Emergency Water Supply and Minimum Standards in Countries with a High Supply Reliability. Water 2019, 11, 732. [Google Scholar] [CrossRef] [Green Version]
- ÖVGW W 74. Trinkwassernotversorgung, Krisenvorsorgeplanung in der Trinkwasserversorgung (Emergency Drinking Water Supply, Crisis Preparedness Planning in Drinking Water Supply); Österreichische Vereinigung Für das Gas- und Wasserfach: Vienna, Austria, 2017. [Google Scholar]
- Mays, L.W. Water Supply Systems Security; McGraw-Hill Professional Engineering Civil Engineering; McGraw-Hill: New York, NY, USA, 2004. [Google Scholar]
- States, S. Security and Emergency Planning for Water and Wastewater Utilities; American Water Works Association: Denver, CO, USA, 2010. [Google Scholar]
- Gopalakrishnan, K.; Peeta, S. Sustainable and Resilient Critical Infrastructure Systems: Simulation, Modeling, and Intelligent Engineering; Springer: Berlin/Heidelberg, Germany, 2010. [Google Scholar] [CrossRef]
- Grigg, N.S. Water Utility Security: Multiple Hazards and Multiple Barriers. J. Infrastruct. Syst. 2003, 9, 81–88. [Google Scholar] [CrossRef]
- Spellman, F.R. Water Infrastructure Protection and Homeland Security; Government Institutes: Lanham, MD, USA, 2007. [Google Scholar]
- Mendonça, D.; Wallace, W.A. Impacts of the 2001 World Trade Center Attack on New York City Critical Infrastructures. J. Infrastruct. Syst. 2006, 12, 260–270. [Google Scholar] [CrossRef] [Green Version]
- Mendonça, D.; Wallace, W.A. Adaptive Capacity: Electric Power Restoration in New York City following the 11 September 2001 Attacks. In Proceedings of the 2nd Symposium on Resilience Engineering, Sophia Antipolis, France, 8–10 November 2006. [Google Scholar]
- Bundesministerium des Innern, für Bau und Heimat. Schutz Kritischer Infrastrukturen—Risiko- und Krisenmanagement · Leitfaden für Unternehmen und Behörden; Federal Ministry of the Interior: Berlin, Germany, 2011. [Google Scholar]
- Nelson, D.R.; Adger, W.N.; Brown, K. Adaptation to Environmental Change: Contributions of a Resilience Framework. Annu. Rev. Environ. Resour. 2007, 32, 395–419. [Google Scholar] [CrossRef] [Green Version]
- Bundesministerium des Innern, für Bau und Heimat. Nationale Strategie zum Schutz Kritischer Infrastruktur (KRITIS-Strategie) (National Strategy for Critical Infrastructure Protection); Selbstverlag: Berlin, Germany, 2009. [Google Scholar]
- Department of Homeland Security. Homeland Security Presidential Directive 7: Critical Infrastructure Identification, Prioritization, and Protection; Department of Homeland Security: Washington, DC, USA.
- Organisation for Economic Co-operation and Development. Good Governance for Critical Infrastructure Resilience; OECD Reviews of Risk Management Policies; OECD Publishing: Paris, France, 2019. [Google Scholar]
- United Nations Office for Disaster Risk Reduction. Terminology on Disaster Risk Reduction; United Nations: Geneva, Switzerland, 2009. [Google Scholar]
- United Nations Office for Disaster Risk Reduction. Terminology on Disaster Risk Reduction; United Nations: Geneva, Switzerland, 2017. [Google Scholar]
- Curnin, S. Collaboration in disasters: A cultural challenge for the utilities sector. Util. Policy 2018, 54, 78–85. [Google Scholar] [CrossRef]
- United Nations Office for Disaster Risk Reduction. Sendai Framework for Disaster Risk Reduction 2015–2030; United Nations Office for Disaster Risk Reduction (UNDDR): Geneve, Switzerland, 2015. [Google Scholar]
- Bruneau, M.; Chang, S.E.; Eguchi, R.T.; Lee, G.C.; O’Rourke, T.D.; Reinhorn, A.M.; Shinozuka, M.; Tierney, K.; Wallace, W.A.; von Winterfeldt, D. A Framework to Quantitatively Assess and Enhance the Seismic Resilience of Communities. Earthq. Spectra 2003, 19, 733–752. [Google Scholar] [CrossRef] [Green Version]
- Cimellaro, G.P.; Reinhorn, A.M.; Bruneau, M. MCEER’s Vision on the Seismic Resilience of Health Care Facilities. Available online: https://www.researchgate.net/profile/G_Cimellaro/publication/252342422_MCEER%27s_vision_on_the_seismic_resilience_of_health_care_facilities/links/541620590cf2fa878ad3fd3e/MCEERs-vision-on-the-seismic-resilience-of-health-care-facilities.pdf (accessed on 4 January 2021).
- McDaniels, T.; Chang, S.; Cole, D.; Mikawoz, J.; Longstaff, H. Fostering resilience to extreme events within infrastructure systems: Characterizing decision contexts for mitigation and adaptation. Glob. Environ. Chang. 2008, 18, 310–318. [Google Scholar] [CrossRef]
- Zobel, C.W. Comparative Visualization of Predicted Disaster Resilience. In Proceedings of the 7th International ISCRAM Conference, Seattle, WA, USA, 2–5 May 2010. [Google Scholar]
- Ayyub, B.M. Systems resilience for multihazard environments: Definition, metrics, and valuation for decision making. Risk Anal. Off. Publ. Soc. Risk Anal. 2014, 34, 340–355. [Google Scholar] [CrossRef] [PubMed]
- Tierney, K.; Bruneau, M. Conceputalizing and measuring resilience. TR News 2007, 250, 14–17. [Google Scholar]
- Attoh-Okine, N.O.; Cooper, A.T.; Mensah, S.A. Formulation of Resilience Index of Urban Infrastructure Using Belief Functions. IEEE Syst. J. 2009, 3, 147–153. [Google Scholar] [CrossRef]
- Abokifa, A.A.; Haddad, K.; Lo, C.S.; Biswas, P. Detection of Cyber Physical Attacks on Water Distribution Systems via Principal Component Analysis and Artificial Neural Networks. In World Environmental and Water Resources Congress 2017; Ewri, Ed.; American Society of Civil Engineers: Reston, VA, USA, 2017; pp. 676–691. [Google Scholar] [CrossRef]
- Bross, L.; Wienand, I.; Krause, S. Batten Down the Hatches—Assessing the Status of Emergency Preparedness Planning in the German Water Supply Sector with Statistical and Expert-Based Weighting. Sustainability 2020, 12, 7177. [Google Scholar] [CrossRef]
- American Water Works Association. M19 Emergency Planning for Water and Wastewater Utilities, 5th ed.; American Water Works Association: Denver, CO, USA, 2018. [Google Scholar]
- American Water Works Association. Planning for an Emergency Drinking Water Supply; U.S. Environmental Protection Agency’s National Homeland Security Research Center: Denver, CO, USA, 2011. [Google Scholar]
- Deutscher Verein des Gas- und Wasserfaches. DVGW W 410 Wasserbedarf—Kennwerte und Einflussgrößen (Technical Standard W 410—Water Demand—Parameters and Influencing Variables); Deutscher Verein des Gas- und Wasserfaches: Bonn, Germany, 2008. [Google Scholar]
- DIN 2000. Zentrale Trinkwasserversorgung—Leitsätze für Anforderungen an Trinkwasser, Planung, Bau, Betrieb und Instandhaltung der Versorgungsanlagen (Centralized Drinking Water Supply—Guiding Principles for Drinking Water Requirements, Design, Construction, Operation and Maintenance of Supply Facilities); DIN Deutsches Institut Für Normung e. V.: Berlin, Germany, 2017. [Google Scholar]
- Verordnung über Allgemeine Bedingungen für die Versorgung mit Wasser (Ordinance on General Conditions for the Supply of Water). 2014. Available online: https://www.gesetze-im-internet.de/avbwasserv/ (accessed on 6 January 2021).
- Bundesministerium des Innern, für Bau und Heimat. Konzeption Zivile Verteidigung (Concept Civil Defense); Federal Ministry of the Interior: Berlin, Germany, 2016. [Google Scholar]
- Erste Wassersicherstellungsverordnung (First Water Security Ordinance). 1970. Available online: https://www.gesetze-im-internet.de/wassv_1/BJNR003570970.htm (accessed on 6 January 2021).
- Niemeyer, G. Kybernetische System- und Modelltheorie: System Dynamics; Systemstudium Wirtschaftsinformatik, Vahlen: Munich, Germany, 1977. [Google Scholar]
- Forrester, J.W. Urban Dynamics, 4th ed.; MIT Press: Cambridge, MA, USA, 1973. [Google Scholar]
- Richardson, G.P. Reflections on the foundations of system dynamics. Syst. Dyn. Rev. 2011, 27, 219–243. [Google Scholar] [CrossRef]
- Forrester, J.W. Lessons from system dynamics modeling. Syst. Dyn. Rev. 1987, 3, 136–149. [Google Scholar] [CrossRef]
- Wolstenholme, E.F. Qualitative vs. quantitative modelling: The evolving balance. J. Oper. Res. Soc. 1999, 50, 422–428. [Google Scholar] [CrossRef]
- Bossel, H. Systeme, Dynamik, Simulation: Modellbildung, Analyse und Simulation Komplexer Systeme (Modeling and Simulation: Concepts, Methods, and Models for the Behavior of Dynamic Systems); Books on Demand: Norderstedt, Germany, 2004. [Google Scholar]
- Milling, P. Der Technische Fortschritt beim Produktionsprozeß: Ein Dynamisches Modell für Innovative Industrieunternehmen (The Technical Progress in the Production Process: A Dynamic Model for Innovative Industrial Enterprises); Gabler Verlag: Wiesbaden, Germany, 1974. [Google Scholar] [CrossRef]
- Hillenbrand, T. Analyse und Bewertung neuer Urbaner Wasserinfrastruktursysteme (Analysis and Evaluation of New Urban Water Infrastructure Systems); Schriftenreihe SWW Karlsruhe; Verl. Siedlungswasserwirtschaft: Karlsruhe, Germany, 2009; Volume 134. [Google Scholar]
- Meadows, D.H. The Unavoidable A Priori. In Elements of the System Dynamics Method; Randers, J., Ed.; MIT Press: Cambridge, MA, USA, 1980; pp. 23–56. [Google Scholar]
- Wolstenholme, E.F. System Enquiry: A System Dynamics Approach; Reprinted; Wiley: Chichester, UK, 1994. [Google Scholar]

Figure 2.
Top-down and bottom-up approaches to the definition of required water quantity.

Figure 3.
Causal-loop-diagram of the model.

Figure 4.
Structure of the system dynamics (SD) model.

Figure 5.
Flow chart of the system analysis to determine the characteristic emergency situation of the water supply utility (y: yes, p: partially, p/n: partially or no, n: no).
Figure 5.
Flow chart of the system analysis to determine the characteristic emergency situation of the water supply utility (y: yes, p: partially, p/n: partially or no, n: no).

Figure 6.
Amount of water required for normal supply and to meet the protection goals.

Figure 7.
Rate of supply with existing capacities for emergency water supply measures.

Figure 8.
Use of additional capacities to meet the quantitative protection goals of grid-independent supply.
Figure 8.
Use of additional capacities to meet the quantitative protection goals of grid-independent supply.

Figure 9.
Use of additional capacities to meet the system-dependent quantitative protection goals of grid-bound supply.
Figure 9.
Use of additional capacities to meet the system-dependent quantitative protection goals of grid-bound supply.

Figure 10.
Use of additional capacities to meet the quantitative protection goals of normal supply.

Table 1.
Classification of 19 emergency supply measures based on the type of extraction, distribution and delivery, adapted from [2].
Table 1.
Classification of 19 emergency supply measures based on the type of extraction, distribution and delivery, adapted from [2].
| Extraction | |||||||||||||||||||
|---|---|---|---|---|---|---|---|---|---|---|---|---|---|---|---|---|---|---|---|
| Water | Water | Water | Water | ||||||||||||||||
| from Own | from | from Grid | from | ||||||||||||||||
| Extraction | Other | Independent | Surface | ||||||||||||||||
| Plant | Utility | Wells | Waters | ||||||||||||||||
| 1 | 2 | 3 | 4 | ||||||||||||||||
| distribution | connecting pipe | 2a | |||||||||||||||||
| mobile pipes | 1a | 2b | 3a | 4a | |||||||||||||||
| transport vehicle | 1b | 1c | 2c | 2d | 3b | 3d | 4b | 4d | |||||||||||
| no distribution by utility | 1d | 2e | 3c | 3e | 4c | 4e | |||||||||||||
| delivery | Feeding into supply system | 1a | 1b | 2a | 2b | 2c | 3a | 3b | 4a | 4b | |||||||||
| direct delivery | 1c | 2d | 3c | 3d | 4c | 4d | |||||||||||||
| filling machine a | 1d | 2e | 3e | 4e | |||||||||||||||
a filling machines are employed to fill water into bottles or other packages.
Table 2.
Characterisation of the emergency situations considered in depth on the basis of the appropriate measures of supply.
Table 2.
Characterisation of the emergency situations considered in depth on the basis of the appropriate measures of supply.
| Emergency Situation | ||||
|---|---|---|---|---|
| E1 & E2 | E7 & E8 | E12 | E16 & E17 | |
| Raw water quantity | ≥ | ≥ | ≥ | < |
| Treated water quantity | ≥ | < | < | < |
| Treatment capacity | Stationary treatment | ≥ | < | ≥ |
| Grid | Functional | Functional | Not functional | Functional |
| Emergency supply measures a | ||||
| Possible extraction method b | 1 | 1, 2, 3, 4 | 1, 2 | 2, 3, 4 |
| Grid-bound measures a | 1a, 1b | 2a, 2b, 2c | none | 2a, 2b, 2c |
| Grid-independent | 1c, 1d | 1c, 1d, 2d, 2e, 3c, | 1c, 1d, 2d, 2e | 2d, 2e, 3c, 3d, |
| measures a | 3d, 3e, 4c, 4d, 4e | 3e, 4c, 4d, 4e | ||
Table 3.
Capacities available in the case study and those required to meet quantitative protection goals ( = 20,000 inhabitants).
Table 3.
Capacities available in the case study and those required to meet quantitative protection goals ( = 20,000 inhabitants).
| Quantitative protection goal | ||||||
|---|---|---|---|---|---|---|
| Protection goal | 15 l/(P·d) | 50 l/(P·d) | 120 l/(P·d) | |||
| per person | ||||||
| Capacities | 310 m3/d | 1032 m3/d | 2497 m3/d | |||
| needed | ||||||
| Available | Resources used to meet the | |||||
| capacities | quantitative protection goal | |||||
| Mobile | a | 225 m3/d | 450 m3/d | 1125 m3/d | 2700 m3/d | |
| treatment plants | 1 mt | 2 mt | 5 mt | 12 mt | ||
| Transport | b | 45 m3/d c | 315 m3/d c | 1035 m3/d c | 2520 m3/d c | |
| vehicles | 3 t | 21 t | 69 t | 168 t | ||
| Mobile | d | – | 315 m3/d e | 1035 m3/d e | 2520 m3/d e | |
| pipes | – | 6 mp | 20 mp | 48 mp | ||
| Filling | f | – | 315 m3/d e | 1050 m3/d e | 2520 m3/d e | |
| machines | – | 3 fm | 10 fm | 24 fm | ||
acd,mt = 225 m3/(mt
· d). bcd,t = 15 m3/(t
· d). c combination of use of containers C9.
d qd,mp = 52.5 m3/(mp · d). e Additional three already existing containers with each 1 m3 capacity, applicable as storage container or for transport 1 h per trip, 15 h/d daily operating time. fcd,fm = 105 m3/(fm · d).
Publisher’s Note: MDPI stays neutral with regard to jurisdictional claims in published maps and institutional affiliations. |
© 2021 by the authors. Licensee MDPI, Basel, Switzerland. This article is an open access article distributed under the terms and conditions of the Creative Commons Attribution (CC BY) license (http://creativecommons.org/licenses/by/4.0/).
Share and Cite
MDPI and ACS Style
Bross, L.; Krause, S. Will There Be Enough Water? A System Dynamics Model to Investigate the Effective Use of Limited Resources for Emergency Water Supply. Systems 2021, 9, 2. https://doi.org/10.3390/systems9010002
AMA Style
Bross L, Krause S. Will There Be Enough Water? A System Dynamics Model to Investigate the Effective Use of Limited Resources for Emergency Water Supply. Systems. 2021; 9(1):2. https://doi.org/10.3390/systems9010002
Chicago/Turabian StyleBross, Lisa, and Steffen Krause. 2021. "Will There Be Enough Water? A System Dynamics Model to Investigate the Effective Use of Limited Resources for Emergency Water Supply" Systems 9, no. 1: 2. https://doi.org/10.3390/systems9010002
Note that from the first issue of 2016, this journal uses article numbers instead of page numbers. See further details here.