Samsung vs. Apple: How Different Communication Strategies Affect Consumers in Portugal
by

Margarida Almeida
1,†, 
Eva Sousa
1,†,
Carolina Rodrigues
1,†,
Maria Beatriz Candeias
1,† and
Manuel Au-Yong-Oliveira
2,* 1
Department of Physics, University of Aveiro, 3810-193 Aveiro, Portugal
2
INESC TEC, GOVCOPP, Department of Economics, Management, Industrial Engineering and Tourism, University of Aveiro, 3810-193 Aveiro, Portugal
*
Author to whom correspondence should be addressed.
†
These authors contributed equally to this work.
Adm. Sci. 2021, 11(1), 19; https://doi.org/10.3390/admsci11010019
Submission received: 29 December 2020
/
Revised: 28 January 2021
/
Accepted: 8 February 2021
/
Published: 20 February 2021
(This article belongs to the Section Strategic Management)
Abstract
:It is indisputable that technology is present in everyday life. In this digital era, brands need to adapt to the changing pace of the needs and desires of society to distinguish themselves from their adversaries, especially in the electronic environment. Hence, they must have well-defined and successful marketing and advertising strategies to achieve a place on the podium of preference of consumers. This work intends to understand how the communication strategies of Apple and Samsung affect the decisions of consumers in Portugal to buy electronic devices. To this end, a survey was conducted, and the responses of 700 individuals who reside in Portugal were analysed through descriptive and inferential (chi-square test of independence) statistics. The survey results show that cost-benefit, price, technical specifications, and performance are the characteristics that weigh the most when purchasing electronic devices, as well as the perceived prestige of the brand. Additionally, an association was found between having only one device and having more products of the brand, with Apple users having more frequently more than one of the brand’s products than Samsung users. We thus concluded that Apple consumers are more loyal. It was also found that the store where the devices are brought is not independent, in Portugal, of the brand of the devices. Apple users buy more brand products from the brand store, both physical and online, than Samsung users. Finally, advertisements and word-of-mouth were found to be fundamental for consumers to acknowledge brand devices, and the degree in which this happens is also not independent of the brand, in Portugal, as a chi-square independence test showed.
1. Introduction
Technology is revolutionizing the world. Everyone is increasingly more dependent on technological devices such as smartphones, tablets, and personal computers (AgingInPlace 2020) to travel, communicate, learn, and work (Lajoso et al. 2020). Both Apple and Samsung are reference brands for these devices, having been market leaders for several years in the telephone market, and also in what concerns shares and advertisement investment (Fondevila-Gascón et al. 2020). According to (Interbrand 2020), Apple is considered, in 2020, the best global brand with 38% growth and $322.999 m brand value under the technology sector. Samsung is number 5 in the same rating, with only 2% growth and $62.289 m brand value. Both these brands are also between the five most innovative companies, according to Boston Consulting Group’s (BCG) 2020’s annual report (Columbus 2020).
Innovation is essential for companies that develop leading-edge products, such as Apple and Samsung. However, they need to master product life cycle management and have world-class consumer-insight skills so they can focus on consumers’ needs and on the unique capabilities that enable them to better execute whatever strategy they choose (Adıgüzel 2020).
Despite this, worldwide Samsung has received more interest during recent years than Apple. According to the world’s region, European customers are more inclined to Samsung and North Americans to Apple (Google Trends 2020b). In what accounts for Portugal, the tendency is not different from Europe’s (Google Trends 2020a). Leading companies, such as Apple and Samsung, not only know what they are good at, but they also know how their capabilities can create value, and which are the markets where those capabilities can be more profitable (Adıgüzel 2020). However, it is still essential to understand how consumers operate. Usually, the product is acknowledged through advertisements and word-of-mouth and then compared with similar products to reach a decisive purchasing decision (Nurwalia and Shofa 2017). Thus, this work aims to assess what differentiates the Apple brand from the Samsung brand, regarding the purchase of electronic devices in Portugal. Moreover, we also study, herein, customer loyalty, and the interest in both of these brands, and the recognition by customers. Adding to this, we expect this work to also give some knowledge about how these different brands are following the turning point in the smartphone market (an especially important device which we all generally carry around with us), taking into account that Apple focuses more on incremental innovation while Samsung focuses on more radical and far-reaching product innovation (in the smartphone market in particular).
In the present study, Apple’s and Samsung’s different communication strategies are compared, including how these strategies are perceived by customers in Portugal. To do so, we analyse where consumers acknowledge products and the motives behind their purchases, relating this data with consumer brands’ purchasing history. Section 2 presents the literature review for the present study, focusing on the general concept of communication strategies and giving a brief look into Apple’s and Samsung’s values and approaches. Section 3 presents the methodology considered and summarizes the survey-which was created for this study and then administered. Section 4 analyses and discusses the results obtained through the shared survey, besides analysing Apple and Samsung marketing strategies.
2. Literature Review
2.1. Marketing and Advertisements
A brand is a visual, emotional, rational, and cultural image associated with a company or a product (Adıgüzel 2020). The act of remembering a specific brand not only eases product selection but also enhances the value and satisfaction associated with eventual purchases from that brand (Bhasin 2019). With this, the personality of a brand is fundamental for consumers to identify with such a brand since consumers think that a specific brand can help them express their personality and values and communicate their ambitions and self-status. The brand identity, established by marketing positioning, distinguishes a company from its rivals. Brand identity is essential in times of fast and intense consumption and in competitive markets since it is no mystery that distinctiveness and prestige attract consumers more quickly (Adıgüzel 2020; Coelho et al. 2018; Im et al. 2019).
Marketing strategies can be both attack and defense strategies, being used according to the situation in the market. A brand uses an attack strategy such as the wing or frontal attack to get new customers or against the market leader or rival. The wing attack targets the weak points of the rival brand, while the frontal attack directly targets the rival brand. On the other hand, a brand implements defense strategies to maintain a specific position in the market, being used by brands well-positioned in the market (Adıgüzel 2020).
Nowadays, brands do not intend to reach the masses due to the high cost associated compared to the return of investment (Adıgüzel 2020). Instead, companies divide their markets into smaller segments with distinct characteristics (Kotler and Keller 2012). However, it is crucial for success to understand the uniqueness of each group. The marketing strategy first segments the market into smaller segments based on relevant shared characteristics (Solomon et al. 2011), such as geographic, demographic, psychographic and behavior (Nurwalia and Shofa 2017). Then the marketing strategy evaluates the attractiveness of each potential segment (targeting). Finally, marketing strategy positions the brand. Positioning is associated with how a company influences the way a group perceives a product in comparison to the competition (Solomon et al. 2011).
One way brands can target their potential customers and introduce and communicate their products is by the use of social media (Adıgüzel 2020). Through social media, a brand can get knowledge of their potential customers, their needs, desires, and consumer expectations. Social media can promote consumers’ engagement in brand communities, or the so-called “brand enthusiasts or brand lovers”. However, social media increases the competitiveness between brands focusing on the same market (Coelho et al. 2018; Im et al. 2019). Despite all this, currently, an honest opinion and recommendation weigh more than information revealed by the brand. Since communities spread their opinions by word-of-mouth, communication strategies that allow interactions among members and between members and the brand help to win customers’ trust and loyalty. A space that can build that environment is, once again, social media (Coelho et al. 2018; Im et al. 2019). However, a brand must not only focus on the target group. It is also fundamental for a company to acknowledge the competition (Adıgüzel 2020).
2.2. Apple: Values and Strategy
Apple Inc. is a North American multinational company operating in the area of technology, electronics, and computing, founded by Steve Wozniak, Steve Jobs, and Ronald Wayne in 1976. Apple Inc.’s values are related to the environment, the responsibility of suppliers, accessibility, privacy, inclusion, and diversity. Besides designing innovative products using recyclable materials, they intend to make their products carbon-free and, in 2030, have them be entirely manufactured with clean energy. They also guarantee a safe and respectful workplace for their employees as well as educational programs (Apple 2020).
Apple’s success is intrinsically related to its marketing strategy of creating an experience that drives the attention of their fan base. Besides the Apple Store concept and Apple Worldwide Developers Conference (WWDC), mentioned below, “price skimming” is one of Apple’s distinctive marketing strategies. The establishment of pricing is a critical part of strategic planning since price generates revenue. “Price skimming” charges a high-price for a short time at the launching of a new, innovative, or much-improved product (Besanko et al. 1990), due to their prospective customers willing to buy the product at this high price. The prices lower later when demand from the “early adopters” falls. The initial high price is considered a sign of high quality, status, and technological utility. Lowering the price would have only a minor effect on increasing sales volume and reducing unit costs (Shavandi and Zare 1986).
2.3. Samsung: Values and Strategy
Samsung Electronics was founded in 1969 by Lee Byung-Chul. It started by producing and exporting home appliances, quickly becoming a preeminent company in Korea. In 1979 it bought 50% of Korea Semiconductor’s actions. In the early 1980s, Samsung Electronics expanded worldwide and created two research and development institutes to increase coverage in electronics areas, semiconductors, and optical telecommunications. In the 1990s, Samsung Electronics focused on creating top world-class products, earning its place as a leader in digital technologies, remaining nowadays in the top 10 in global brand rankings. This company always managed to adapt to difficulties with constant innovation, competitive products, and advanced technology (Samsung 2020).
Samsung Electronics preserves a simple commercial philosophy that uses its expertise and technology to create better products and services for a better global society. For that, Samsung works with strong values, such as: offering wealth opportunities to their people, achieving excellence in developing products, and paying attention to the surroundings and change to respond to the markets’ needs. Samsung works ethically, valuing integrity, and co-prosperity. Samsung intends to be socially and environmentally responsible in all communities through the practice of a management strategy which is forward-looking, namely to be socially, economically, and environmentally sustainable (Samsung 2020).
3. Methodology
A survey was prepared (using Google Forms) and distributed through social media. The sample was gathered according to the snowball sampling technique, a type of the convenience sampling method, in which the respondents are asked to share the survey with their networks (Ghaljaie et al. 2017). The survey questionnaire was tested with several people from different age groups before being posted online. As the questionnaire was anonymous, bias was reduced. The survey had rating scale questions, questions with yes or no answers, multiple-choice questions, and “what suits you best” questions. Besides being asked about gender, age, residence district, and activity, the respondents also answered about: their electronic devices, the relevance of several characteristics associated with them, the brand of their devices, if they have always considered the same brand, and if they intended to change it in the future. In what accounts for brands, Samsung, Apple, Huawei, and Xiaomi were considered, since, according to (Statcounter GlobalStats 2020), they not only are the four mobile vendors with the highest market share in Portugal but also, jointly, they owned, in October 2020 89.31% of Portugal’s mobile vendors market share. Respondents were then asked about how they feel about the advertisements shown on social media and how they obtain information about products. The main goal was to understand what influences the consumer most when buying from the brands being analysed. Concerning both Apple and Samsung, all respondents were asked where they see the majority of each brand’s advertisements, and how they feel about the said advertisements. They were asked: if they care about Apple’s WWDC; what they think of the brands’ range of products; and, also, how they feel about Samsung’s advertisement made specifically comparing their products to those of Apple. The survey was analysed with descriptive and inferential statistics. Inferential statistics was done using chi-square tests of independence (Oakshott 2016; Saunders and Cooper 1993).
To complement the survey results, Apple’s and Samsung’s communication strategies were analysed and an in-depth search was conducted regarding statistical data related to the brands being studied.
4. Results and Discussion
The survey received a total of 706 answers from 20 different districts in Portugal and from residents outside Portugal. The answer from the 6 residents outside Portugal were not considered. According to (Gil 2017), the sample with a total of 700 participants is representative of the population in Portugal with a margin of error of 4%, considering and a trust coefficient of 95.5%. The majority of the responses came from Aveiro, 49.6%, Beja and Porto, both with 6.3%, and Lisbon, with 6.0% of the respondents (Table 1d). The age of the respondents ranged from 12 to above 76 years old. The highest contribution came from the age range 18 to 25 years old (63.9%) followed by the 26 to 35 years old range (9.9%), the 36 to 45 years old range (9.1%), the 46 to 55 years old range (8.1%), the 12 to 17 years old range (6.6%), and finally the 56 to 75 years old range (2.3%) and the plus 76 range (0.1%) (Table 1b). 38.7% of the respondents were male, 60.6% female, and 0.7% other (Table 1a). In what accounts for the activity of the respondents, 56.3% are students, 27.4% are employed, 6.7% are student-workers, 5.4% are self-employed, 3.4% are unemployed, and 0.7% are retired (Table 1c). With this, we believe that biased data is reduced, although the survey concerns a convenience sample (Bell et al. 2015; Etikan et al. 2016).
4.1. What is Beyond Purchasing Decisions?
According to the survey, when it comes to smartphones, 33.1% of the survey respondents own an Apple device, 26.1% a Samsung device, 20.1% a Huawei device, 12.7% a Xiaomi device and 7.1% have other brands. Only 0.7% do not own a smartphone. Furthermore, the majority do not own a tablet. Among the ones who do, 39.0% have an Apple, 31.6% have a Samsung, 4.6% have a Hauwei, and 24.2% have other brands. When it comes to personal computers, 13.9% own an Apple, and 3.7% own a Samsung, and most own computers from brands not focused on in this study. This information is resumed in Table 2. Despite these results, the mobile vendor market share, in Portugal, of Samsung (28.26%) is higher than that of Apple (26.47%) (Statcounter GlobalStats 2020). Still further, note that the majority of the respondents (443 in 700 respondents) range in age from 18 to 25 years old, which might explain this difference. 36.3% of the respondents who are 18 to 25 years old own a smartphone by Apple, while only 23.9% own a Samsung. For example, Samsung leads among 12 to 17 year olds, with a difference of 15.2% (Table 3). In fact, not considering the age range 18–25 years old, Samsung leads the smartphone market between the respondents, with 30.6% comparing with Apple’s 28.2%. Adding to this, more respondents admit to not possessing Apple devices (50.3%) than Samsung devices (40.0%). It may be due to the fact that Samsung has a wider product range which leads to a more comprehensive price list, compared to Apple, thus reaching more people. This explains, for example, the difference in the number of people aged between 12 and 17 who have Samsung devices compared to Apple.
Considering now smartphones, tablets, smartwatches, and wireless phones, an independence chi-square test was conducted to test the existence of an association between the brand of the owned devices and the age range of the owner. We considered all owners that own at least one device of the said brand. The null hypothesis being having no association. The same test was conducted considering also the gender of the owner and their activity. The three attributes, age range, gender, and activity, were found to have no association with the brands of the respondents at a significance level of 5%, with a total chi-square value 21.38 < 26.30 (16 degrees of freedom), 7.62 < 9.49 (4 degrees of freedom) and 12.33 < 21.03 (12 degrees of freedom), respectively. The age ranges 56 to 75, and plus 76 were not considered, as with the activities unemployed and retired, due to the low number of answers. This is interesting, since when only considering smartphones a clear predisposition was found for one of the brands, Apple or Samsung, for some age ranges of the respondents. Hence, the independence between the user attributes and the brand of at least one of their owned devices might be due to the significant number of different devices available, not all led by the same brands. Adding to this, the choice of the brand of the devices owned is not independent of the brand considered, as we shall see below.
An independence chi-square test was also conducted to test if the brand and having at least one device of the said brand are independent (Null hypothesis). We found the opposite, as expected, with the null hypothesis being rejected at a significance level of 0.1%, with a total chi-square value of 96.01 > 18.467 (4 degrees of freedom). Note that the brands under analysis not only are market leaders, but also have the advantage of selling products owned and perceived equally and independently (according to chi-square tests performed) by all age ranges below 55 years, genders, and the considered activities/occupations. With this, their market segmentation does not need to be as segmented as with other brands. Note, for example, fashion brands, whose target field is much smaller, and also the example of Samsung itself. Despite this consumer behavior in what accounts for personal electronic devices, it is not expected that this behavior will reflect on other Samsung devices, such as home appliances. Therefore, their marketing strategy in this field must be more segmented and well-targeted.
The topmost important matter the respondents look for when purchasing an electronic device is the cost/benefit relationship (with median value classification of 5/5). The median value (MED) of a data set is the middle value of the values written in numerical order (Carvalho et al. 2018). The performance, price, technical specifications, operating system, and personal experience were classified with a MED of 4/5 and mean values ranging from 3.7 to 4.1. Notice that Samsung has a bigger panoply of devices and options when compared with Apple. Even though 35.6% of the respondents felt indifferent towards Apple’s smaller array of devices, 34.1% relates this fact with Apple’s focus on superior qualities, and 14.3% said that a smaller scope of products helps with the choice when purchasing, while 32.6% feel that Apple only focuses on a high range of prices, unreachable for all consumers. Considering Samsung, 26.4% felt indifferent towards its diversity. However, 60.1% stated that Samsung can reach a larger price range while 36.9% states that they can have more diversity both in quality and characteristics, and 10.3% said that a bigger scope of products hinders the choice when purchasing.
Note that the diversity of the products developed by the two brands can represent a marketing strategy for both of them. Apple is definitively known for its election products, while Samsung represents the company that, not only has election products, but also has more affordable products, and so can reach more consumers. To our surprise, aesthetics does not seem to be a breakpoint (MED of 3/5). However, note that both brands have top products that better satisfy the most interested both in technical specifications and aesthetics. Thus, both brands know well the demands of their target clients in what accounts for technical specifications and so they are focused on developing leading-edge products and in advertising the technical specifications that differentiate them from their rivals.
4.2. Brand Advertisements, Prestige and Social Status
When it comes to advertisements used by the brand, these seem to have almost no effect on the purchasing decision (MED of 2/5). To the respondents, the opinion of device users, friends, and family means a lot more (MED of 3/5) than the effect of influencers they may follow online (MED of 1/5), this reinforces the power that word-of-mouth has on this type of devices. Additionally, brand perceived prestige appears to have a significant impact on the purchasing decision (MED of 4/5), while the perceived social status and society seem to have almost no impact (MED of 2/5).
53.4% of our respondents intend to maintain the brand of their device in their next purchase, while 32.0% admit the possibility of maybe changing. This fact leads us to perceive that a considerable part of the sample can be classified, to a certain extent, as being brand loyal. 14.7% of the respondents have always owned Apple products, while 17.3% have always owned Samsung products. Despite this, considering the ones that do not own these brands at the moment, 37.9% already owned a Samsung product in the past and 9.9% owned an Apple product in the past. This leads us to believe that Apple consumers are more loyal to the brand, while Samsung consumers are more willing to switch brands. As mentioned above, the operating system is crucial when looking for a device, and, while Apple devices use iOs, several other brands use Android. Therefore, it might be considered easier for a person adapted to Android to change from Samsung to another brand than for Apple iOs users.
To test if Apple users are more brand-loyal than users of the other brands considered in the survey, a chi-square test was used to test a possible association between having only one product of the brand and having more than one for each brand being studied. The null hypothesis was given by the independence between the variables. A total chi-square of 83.91 > 18.466 (4 degrees of freedom), for a significance level of 0.1%, was found, giving support to the association between having only one brand device and having more than one product from the said brand, relating to brand loyalty. Apple and Huawei are the brands most distinguished by this chi-square test. Apple was distinguished in the most positive way, as almost as many people had more than one device than the ones that had only one device (144 with more than one device Vs. 155 with only one device). On the other hand, Huawei consumers showed little brand loyalty as 152 participants had only one device, and only 18 participants in the survey had more than one device. Samsung had the largest share of participants with one device (184), but only 72 participants had more than one device. With Xiaomi, the situation was 112 participants with only one device, and 39 participants with more than one device. Hence, Apple users are the most brand-loyal, in Portugal, while Samsung users are the most likely to have fewer, if not only one, device of the brand. This might be explained by Apple users being used to the iOs operating system/ecosystem, leading to them having a set of some of the Apple devices studied (smartphone, personal computer, tablet, wireless phones and smartwatch), due to the compatibility between the several devices. On the other hand, Samsung users are most likely to own the same set of devices, with each device being from a different brand.
4.3. How Marketing Strategies are Crucial for Market Leader Brands?
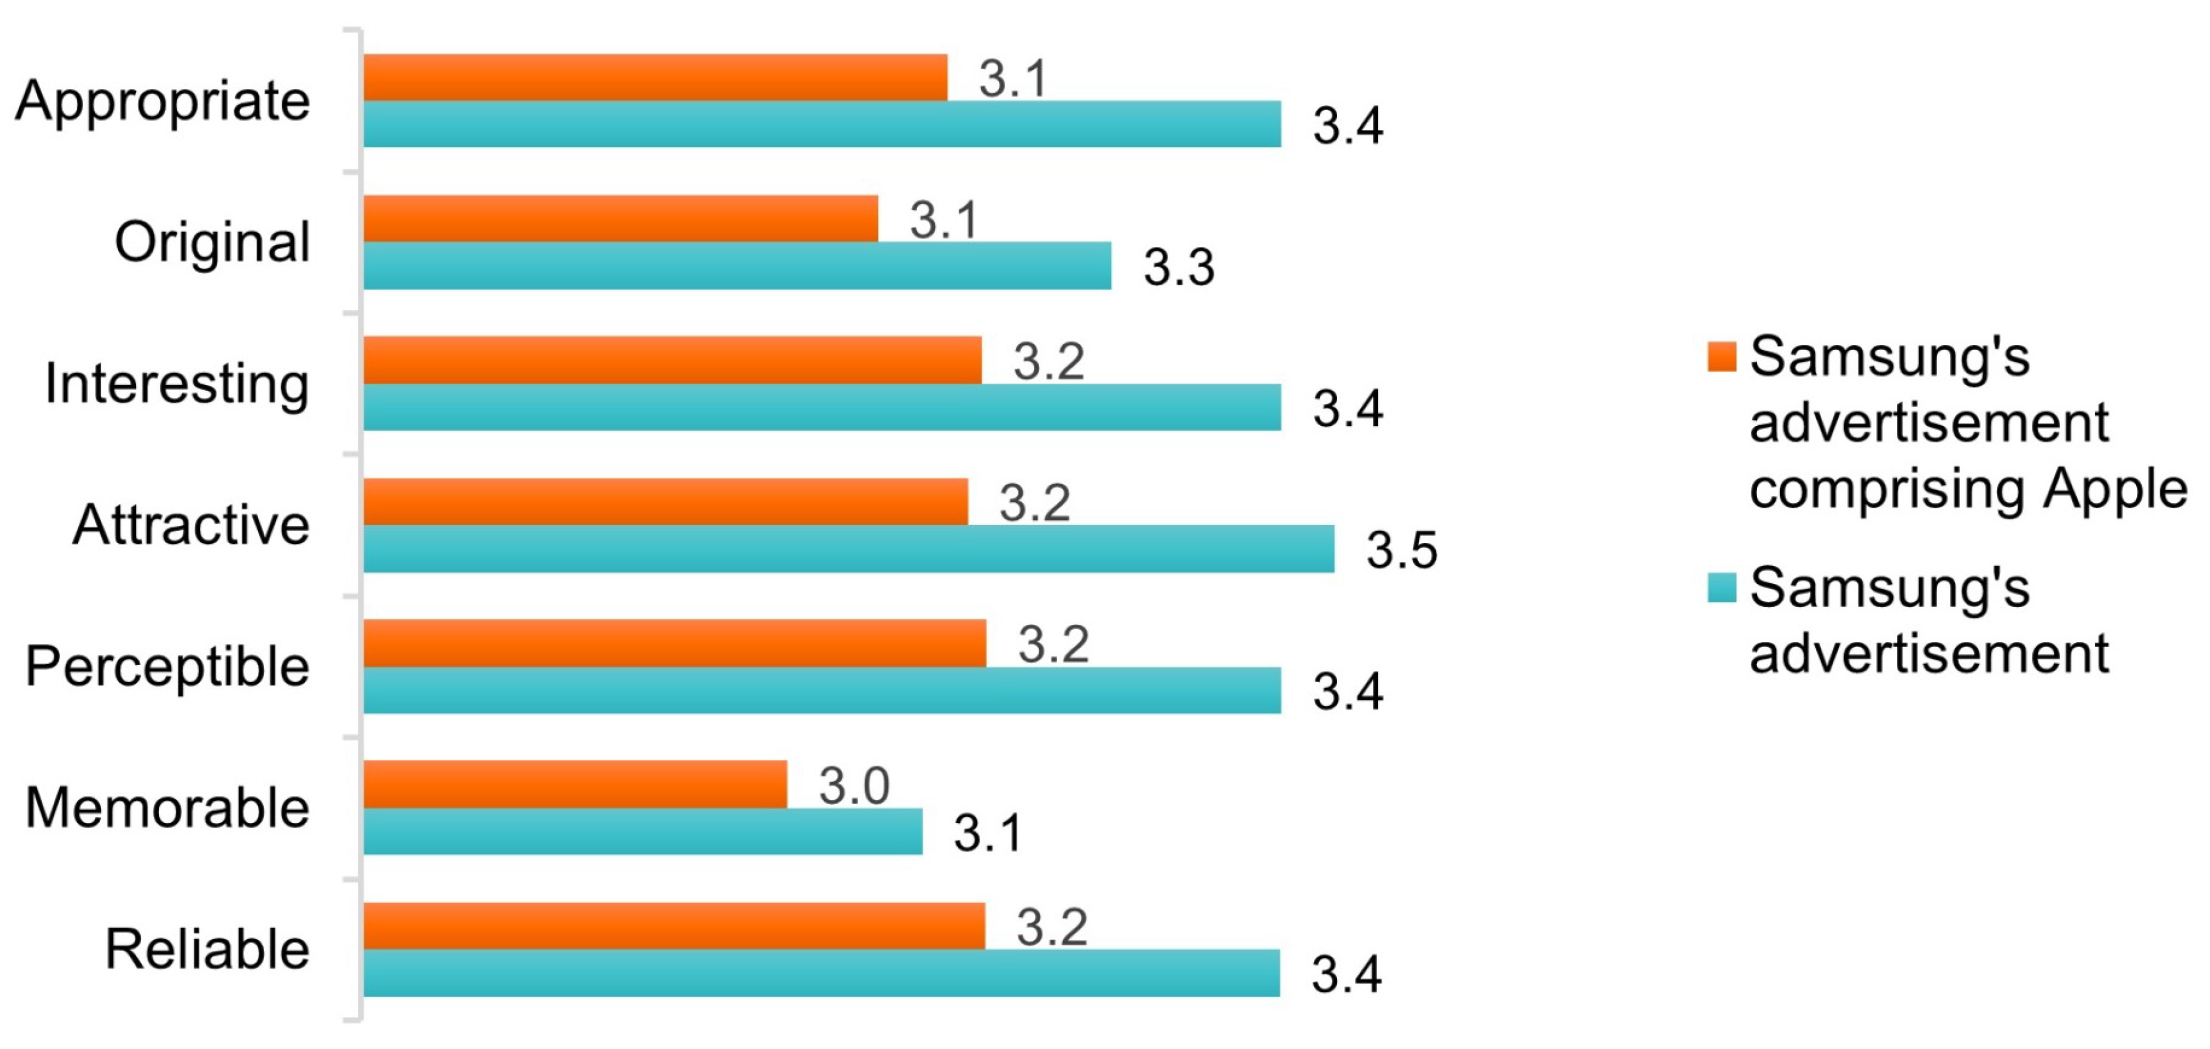
Apple’s or Samsung’s advertisements, on social media and inserted in television programs, are considered by the respondents to be, on average, equivalent. When the publicity appears during television breaks, Samsung is better classified. In what accounts for the different characteristics of Apple’s and Samsung’s advertisements, our respondents manifested a really interesting point. They were, overall, really neutral about every considered characteristic: remarkable, trustworthy, perceptible, attractive, interesting, original, or suitable. However, the not-neutral respondents appeared to be more positive than negative about the different characteristics. Focusing on the advertisements in which Samsung does compare their devices directly with Apple’s, the respondents agreed more with the characteristics when they describe normal Samsung advertisements than when it compares the devices directly with other brands’ devices (see Figure 1). Despite the worst classification given to Samsung’s attack marketing campaigns, the difference is only remarkable due to its consistency for all adjectives. Samsung uses this strategy to show the differences between its brand and the closest rival comparing device specificities. Notice that it is not common for a brand to do so.
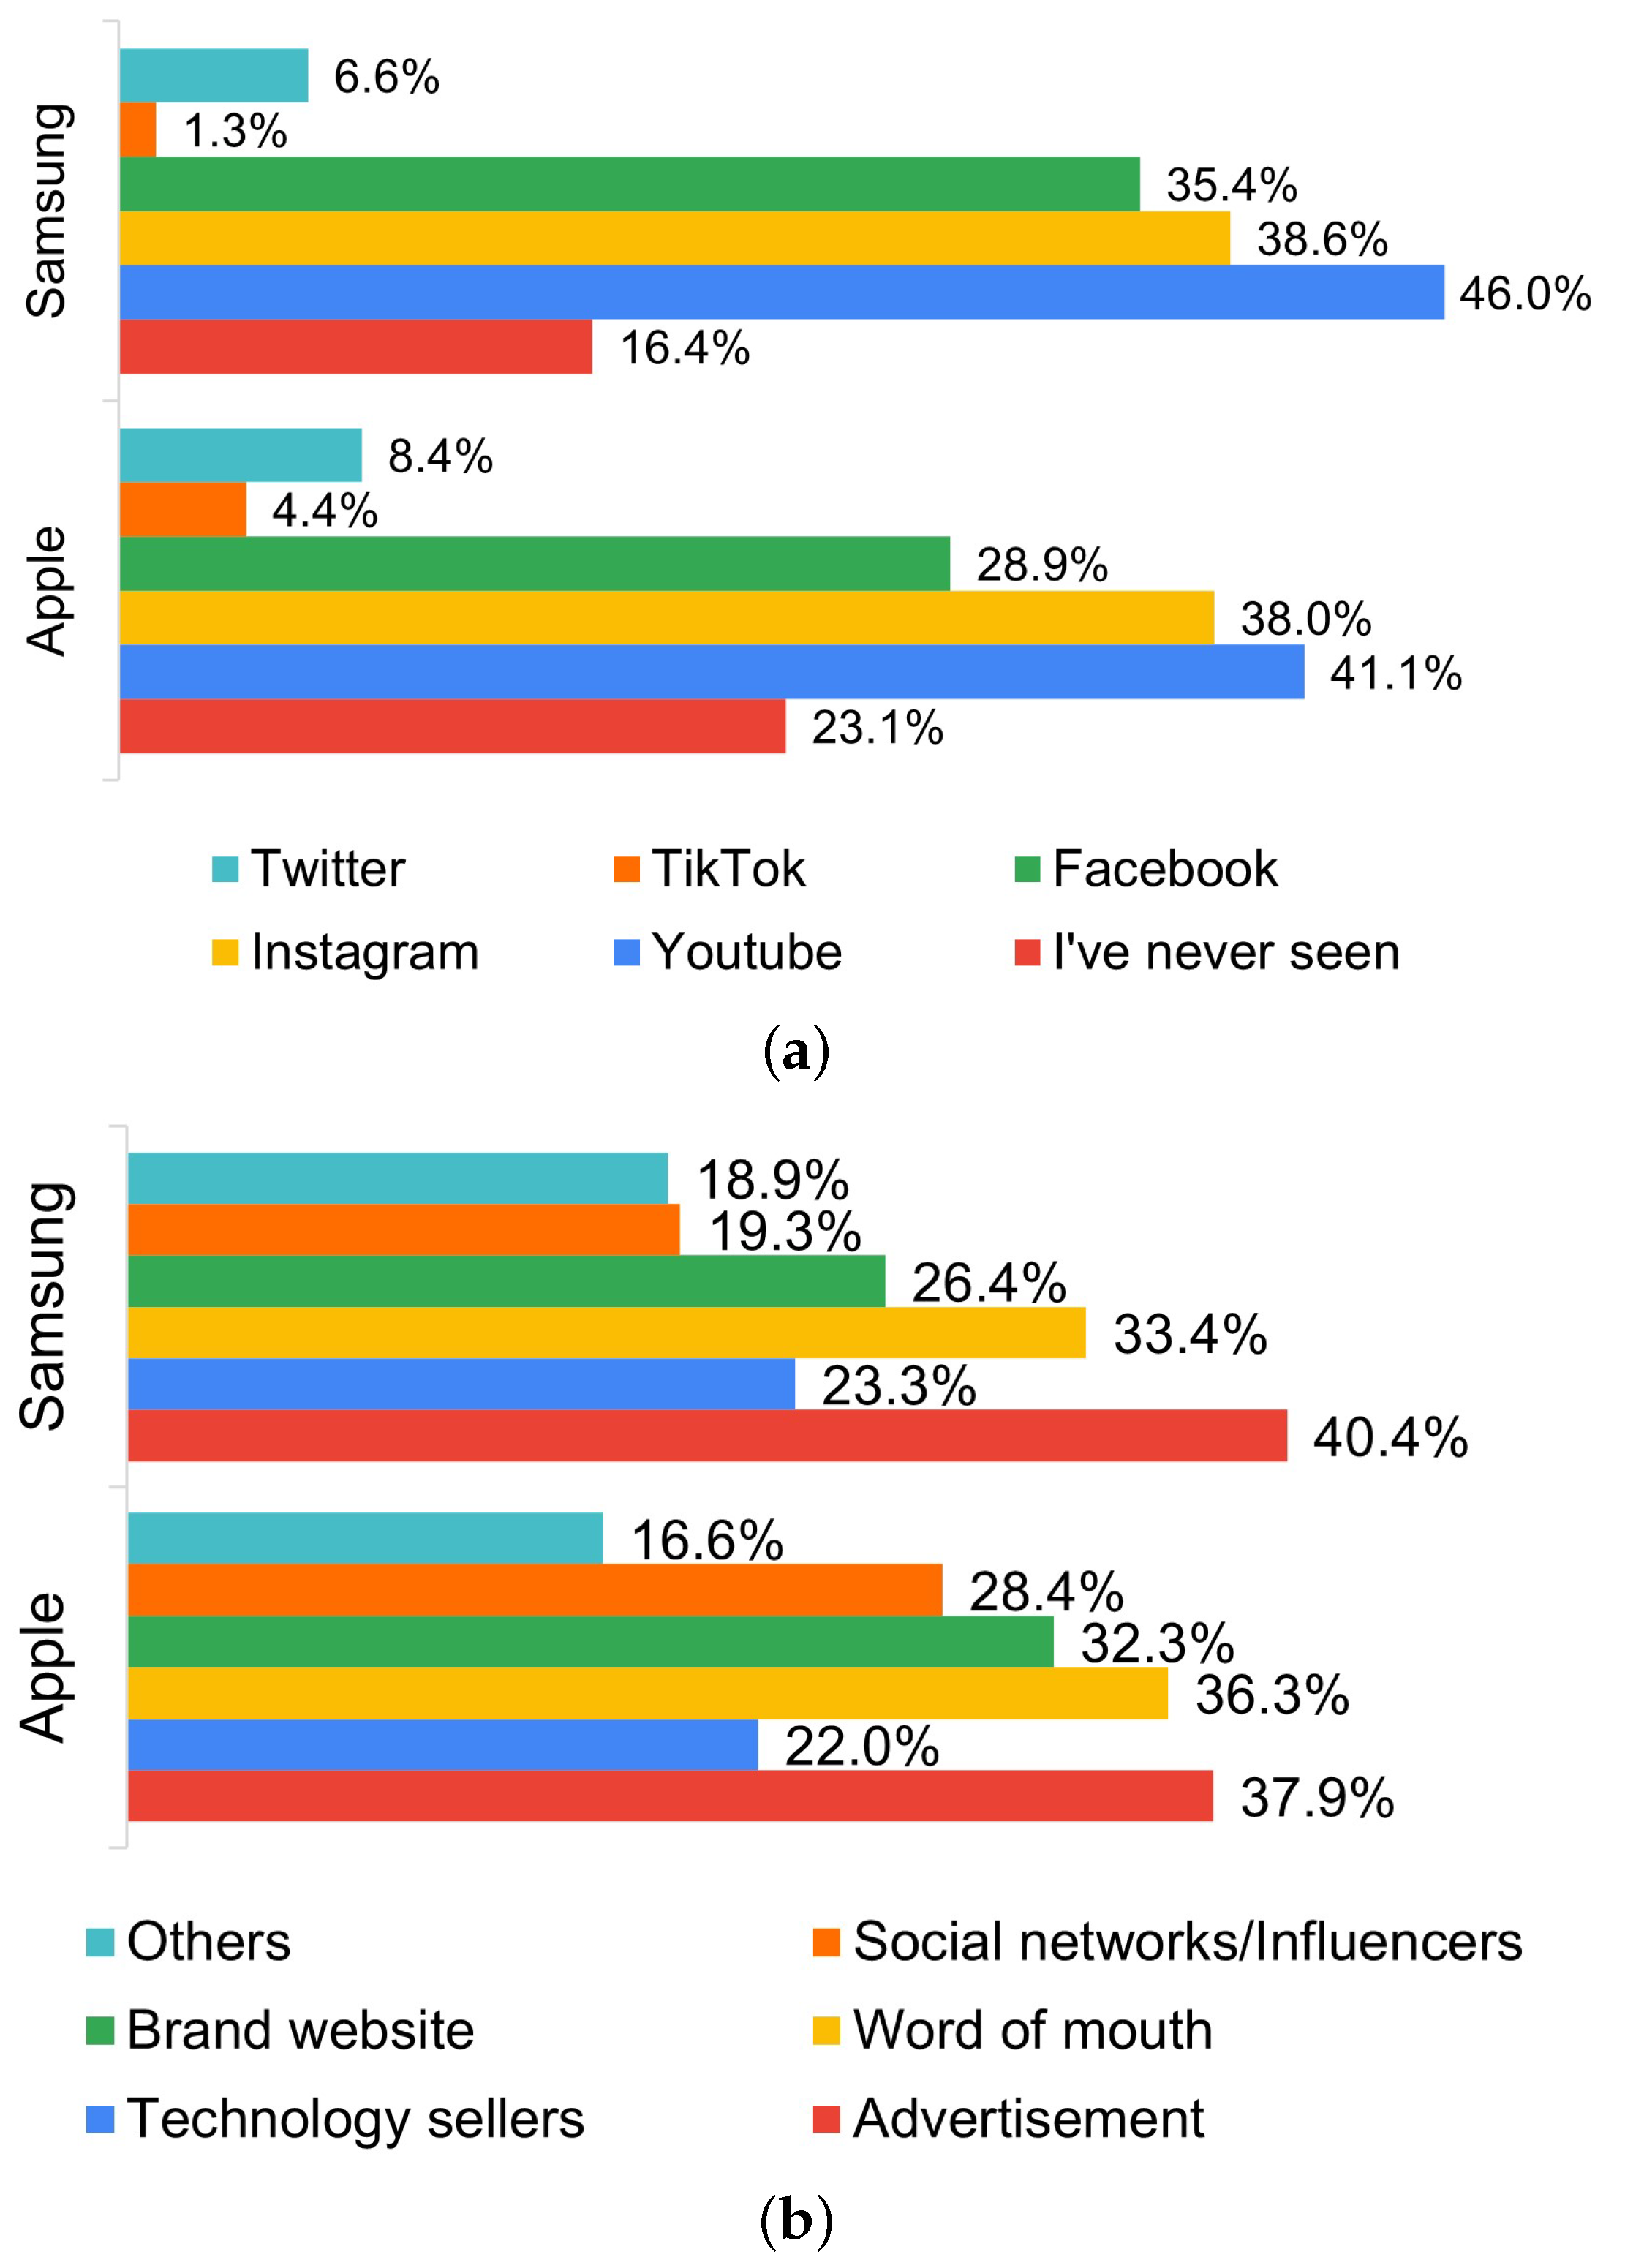
The social networks where the respondents see more advertisements by Apple or Samsung are YouTube, followed by Instagram and Facebook (see Figure 2a). Interestingly, Apple advertisements are seen less on social media. This, along with the fact that Apple devices are owned in greater number by the respondents, confirms the supra mentioned results that advertisements have a lower impact on consumers’ purchasing decisions. A relationship was found between the brand and the social network where the brand’s advertisement is most seen, at a significance level of 0.1%, with a total chi-square value of 28.82 > 22.457 (6 degrees of freedom). The chi-square calculus is presented Table 4.
Despite this, according to the results presented in Figure 2b concerning the source of information for electronic devices, one has that advertisements are, for both Samsung and Apple, the main source of device information that a consumer has. This might be counter-intuitive since one would think that consumers acknowledge electronic devices through the brand website or technology sellers, which present the devices’ technical specifications. However, these sources come after advertisements and word-of-mouth, and for Apple, also after social networks and influencers. Notice that, before searching for the technical specifications of a specific product, usually consumers need to know of the existence of the product, which is usually done through advertisements and word-of-mouth. Furthermore, the more well-perceived are the brand’s advertisement campaigns, the more likely it is for its products to spread through word-of-mouth. Once again, a chi-square test was developed to test a possible association between the brand and the source of information about the brand’s products. Such an association was found for a significance level of 1%, with a calculated test statistic of 16.21 which was higher than the critical value from the chi-square distribution table of 15.086, for 5 degrees of freedom (Table 5). A chi-square test was also developed to test if the source of information about the brand’s products is independent of the age range of the users (considering only ages lower than 56 years old). From the p-values 0.270 and 0.574 (20 degrees of freedom), for Apple and Samsung’s products, respectively, it can be stated that no association was indeed found.
4.4. People’s Influence on Purchasing Decisions
When asked how much they felt the influence by influencers who, in their day-to-day life, use or work directly with Apple or Samsung, the respondents answered, mostly, 0/5 (MED value). However, when the subject under study changed from them to the people from their communities, the answer increased to 2/5 (MED value). Even though one thinks that others are influenced, we do not account for ourselves being influenced. Despite what we perceive, everyone can be influenced by what surrounds them every day. This is an unconscious act that brands use for their benefit. Additionally, this influence is not only obtained through the use of social media influencers, as Samsung is known for. Notice the Apple Store concept, which has become the physical embodiment of the Apple lifestyle, helping to raise its market, despite the handful of skeptics in early times. Anyone visiting an Apple Store is greeted by helpful employees who seem to be living the Apple lifestyle and not selling Apple products. This behavior spreads to customers (Pogačnik and Aleš 2014), and, thus, Apple’s marketing mix is acknowledged to induce fans to stand in line for hours to get any new product the minute it is released. The behavior is usually associated with groupies and not technology consumers (Piedfort 2017).
To test a possible dependence between the stores where Apple and Samsung devices are bought and the brand of the devices, a chi-square test was performed (see Table 6). With a total chi-square value of 41.22 higher than 18.467 (4 degrees of freedom), the hypothesis of no association between brand and type of store can be rejected at a significance level of 0.1%. Therefore, a relationship is found, in the Portuguese market, between the brand and the store where the products are bought. According to the survey, Apple users buy more products in Apple stores, both physical and online, than Samsung users do in Samsung stores, with a difference of 9.0% and 6.7%, respectively. Samsung users resort more, in 25.6%, to physical tech stores to buy Samsung devices than Apple users. Considered once more the chi-square test conducted above, the physical tech stores are associated with higher and lower frequencies than expected for the brands Samsung and Apple, respectively. All other considered categories of stores have a higher frequency than expected for Apple products than for Samsung’s. This enhances the effect that Apple stores have on consumers, which can be mostly due to the marketing strategy of the Apple Store concept. On the other hand, Samsung stores have almost no effect on customers.
As mentioned above, the WWDC is a very well-known Apple marketing strategy. At the WWDC, Apple announces new products and updates to existing ones. This conference is waited for, all year long, and after it happens, social media is invaded by posts about it originating from everyone, even from people who have not seen the conference. No other conference in this area has this impact. Maybe this popularity is due to the impact of Steve Jobs or to the loyalty of Apple users. Whatever the reason, this conference has a lot of promotion around it and thus seems to be one of Apple’s principal communication strategies (Thomas 2019). A larger number of the respondents follow the conference annually, either by watching it or by watching the news or posts on social media after it has happened (50.5%). Either way, they pay attention to it. Albeit 17.7% of the sample had never heard of this conference. Samsung also hosts an annual conference, the Samsung Developer Conference. However, it is not so well known. 58.3% of the respondents are neutral about its existence, and thus it cannot be considered as a crucial marketing strategy for Samsung.
5. Conclusions and Future Work
As technology is a key part of our day-to-day lives and as Apple and Samsung are revolutionary brands in this field, this study was performed to compare the different communication strategies adopted by these two brands in Portugal. To substantiate this study, a survey was conducted. In this survey, we cover what determines the purchase of electronic devices, advertising on different social networks, and the comparison of advertising between Apple and Samsung.
Regarding the study of what determines the purchase of electronic devices, it was concluded that consumers look for devices based on cost/benefit and the performance of the device. From the data collected, it was also possible to conclude that the advertising made by the brand hardly influences the choice process, however, it is fundamental for customers to know about the brand’s devices. An association between the brands under study and the source of information about the products was indeed found through a chi-square independence test. From the results, in Portugal, the prestige of the brand has a great influence on the choice of electronic devices, as was already shown by (Chepchirchir and Leting 2015) considering a population with different characteristics. Through chi-square independence tests we found that, in Portugal, Apple consumers are more loyal to the brand when compared to Samsung consumers. Apple users have more frequently more than one of the brand’s products, than Samsung users. In this work, it was also possible to conclude that the respondents seem to appreciate Apple’s novelties more than Samsung’s. As for the conferences, we concluded that Samsung does not use its conference as a marketing strategy and that Apple fans are more committed to it. Finally, an association between the type of store where the products are bought and the brand was also found. In Portugal, Apple users are more willing to buy its products from an Apple store, both physical and online, while Samsung users prefer to buy Samsung’s products in physical tech stores. All these characteristics and options lack an analysis considering the different age ranges, which would give a better understanding of the consumers’ behaviour according to each generation.
It can be deduced that Apple has a cult-like sentiment towards it (like the Harley Davidson or Red Bull communities, except perhaps being better, despite technology markets generally being more unstable), while Samsung is reputable for its wide range of products and prices. However, will it remain like this in the near future with the present turning point in the Smartphone market, with brands looking for foldable and rollable or flexible Smartphones, mainly with Samsung already advancing in this direction with the Samsung Galaxy Fold? Artificial intelligence and its development is also expected to tip customer preferences. On the other hand, one thing to learn with Apple’s brand is the development of a set of devices, and not independent ones (the Apple smartwatch does not work separate to the iPhone). For example, those users with an Apple iPhone, are more willing to buy other Apple products because they all belong to the same product line, they follow the same design and they are compatible, in an ecosystem. Samsung is starting to look at this option. Will Samsung be able to reach Apple’s loyalty levels just through this, or should it consider other options? The Apple brand breeds customer loyalty in a way which other technology brands, including Samsung, have not been able to reproduce, to date.
Despite having obtained a significant sample size (n = 700), there is a notable prevalence both in age, between 18–25 years (63.9%), and in region of Portugal, Aveiro (49.6%) (though we also have 42 responses from Lisbon and 44 responses from Porto, the two main districts in Portugal). There is also a prevalence in the activity of the respondents, as the majority of them are students (56.3%). This is something to bear in mind when evaluating the data, as in the right circumstances, the sample obtained should be totally random, and thus perhaps more diverse.
As future work, it would be interesting to compare the growth of Huawei with both Apple and Samsung and to analyse their communication strategies. Note that according to the survey, 20.1% of the respondents use a Huawei phone, being this the third most used phone brand. Also, according to (Columbus 2020), Huawei jumped from 48th to 6th from 2019 to 2020 in BCG’s annual analysis of the 50 most innovative companies. This leaves us the questions: Why is Huawei growing so much? Should Apple and Samsung start looking at Huawei as a threat?
Author Contributions
Conceptualization, M.A., E.S., M.B.C. and C.R.; methodology, M.A., E.S., M.B.C., C.R. and M.A.-Y.-O.; validation, M.A.-Y.-O.; formal analysis, M.A. and E.S.; investigation, M.A., E.S., M.B.C. and C.R.; writing—original draft preparation, M.A., E.S., M.B.C. and C.R.; writing—review and editing, M.A., E.S., M.B.C., C.R. and M.A.-Y.-O.; supervision, M.A.-Y.-O.; funding, M.A.-Y.-O. All authors have read and agreed to the published version of the manuscript.
Funding
This research received no external funding.
Institutional Review Board Statement
Not applicable.
Informed Consent Statement
Not applicable.
Data Availability Statement
Not applicable.
Acknowledgments
This work was financially supported by the research unit on Governance, Competitiveness and Public Policy (UIDB/04058/2020) + (UIDP/04058/2020), funded by national funds through FCT—Fundação para a Ciência e a Tecnologia. We would like to thank the University of Aveiro for granting us access to the main databases ISI Web of Science and Scopus, which were essential to this research.
Conflicts of Interest
The authors declare no conflict of interest.
References
- Adıgüzel, Selminaz. 2020. Market and Brand Positioning and Sustainability Strategies in International Marketing. International Journal of Scientific Research and Management 8: 9–24. [Google Scholar] [CrossRef]
- AgingInPlace. 2020. Technology In Our Life Today And How It Has Changed. Available online: https://aginginplace.org/technology-in-our-life-today-and-how-it-has-changed/ (accessed on 3 November 2020).
- Apple. 2020. Apple Site Map. Available online: https://www.apple.com/sitemap/ (accessed on 7 November 2020).
- Besanko, David, and Wayne L. Winston. 1990. Optimal Price Skimming by a Monopolist Facing Rational Consumers. Management Science 36: 555–67. [Google Scholar] [CrossRef]
- Bhasin, Hitesh. 2019. What Is a Brand? Marketing91. Available online: https://www.marketing91.com/what-is-a-brand/ (accessed on 7 November 2020).
- Bell, Emma, Alan Bryman, and Bill Harley. 2015. Business Research Methods. Oxford: Oxford University Press. [Google Scholar]
- Carvalho, Maria José, José António Fernandes, and Adelaide Freitas. 2018. Determinação da mediana em contexto tabelar e gráfico. Ciência & Educação (Bauru). FapUNIFESP 24: 779–98. [Google Scholar]
- Chepchirchir, Josphine, and Mark Leting. 2015. Effects of Brand Quality, Brand Prestige on Brand Purchase Intention of Mobile Phone Brands: Empirical Assessment from Kenya. The International Journal of Management Science and Business Administration 1: 7–14. [Google Scholar] [CrossRef] [Green Version]
- Coelho, Pedro Simões, Paulo Rita, and Zélia Raposo Santos. 2018. On the relationship between consumer-brand identification, brand community, and brand loyalty. Journal of Retailing and Consumer Services 43: 101–10. [Google Scholar] [CrossRef]
- Columbus, Louis. 2020. The Most Innovative Companies Of 2020 According to BCG. Available online: https://www.forbes.com/sites/louiscolumbus/2020/06/28/the-most-innovative-companies-of-2020-according-to-bcg/?sh=639e25472af3 (accessed on 7 November 2020).
- Etikan, Ilker, Sulaiman Abubakar Musa, and Rukayya Sunusi Alkassim. 2016. Comparison of Convenience Sampling and Purposive Sampling. American Journal of Theoretical and Applied Statistics 5: 1–4. [Google Scholar] [CrossRef] [Green Version]
- Fondevila-Gascón, Joan-Francesc, Marc Polo-López, Josep Rom-Rodríguez, and Pedro Mir-Bernal. 2020. Social Media Influence on Consumer Behavior: The Case of Mobile Telephony Manufacturers. Sustainability 12: 1506. [Google Scholar] [CrossRef] [Green Version]
- Ghaljaie, Fereshteh, Mahin Naderifar, and Hamideh Goli. 2017. Snowball Sampling: A Purposeful Method of Sampling in Qualitative Research. Strides in Development of Medical Education, 14. [Google Scholar] [CrossRef] [Green Version]
- Gil, Antonio Carlos. 2017. Como elaborar projetos de pesquisa. São Paulo: Atlas. [Google Scholar]
- Google Trends. 2020a. Interesse ao Longo do Tempo. Available online: https://trends.google.com/trends/explore?date=all&geo=PT&q=%2Fm%2F0k8z,%2Fm%2F05b5c,%2Fm%2F01nn79,%2Fm%2F01qkl1,%2Fm%2F0h6955b (accessed on 7 November 2020).
- Google Trends. 2020b. Interesse ao Longo do Tempo. Available online: https://trends.google.com/trends/explore?date=all&q=%2Fm%2F0k8z,%2Fm%2F05b5c,%2Fm%2F01nn79,%2Fm%2F01qkl1,%2Fm%2F0h6955b (accessed on 7 November 2020).
- Im, Eun Tack, Duk Jin Kim, Min Hye Jwa, and Gwang Yong Gim. 2019. A Study on Brand Identity and Image Utilizing SNA. Paper presented at 2019 20th IEEE/ACIS International Conference on Software Engineering, Artificial Intelligence, Networking and Parallel/Distributed Computing (SNPD), Toyama, Japan, July 8–11; pp. 372–84. [Google Scholar]
- Interbrand. 2020. Best Global Brands. Available online: https://www.interbrand.com/best-global-brands/?filter-sort=ASC&filter-brand-sector=technology&filter-brand-region= (accessed on 7 November 2020).
- Kotler, Philip, and Kevin Lane Keller. 2012. Marketing Management, 14th ed. Upper Saddle River: Pearson Prentice Hall. [Google Scholar]
- Lajoso, João, André Sousa, João Albuquerque, Ricardo Mineiro, and Manuel Au-Yong-Oliveira. 2020. Closed Against Open Innovation: A Comparison Between Apple and Xiaomi. In Trends and Innovations in Information Systems and Technologies. Berlin: Springer International Publishing, pp. 436–48. [Google Scholar]
- Nurwalia, Annisa, and Faila Shofa. 2017. The influence of segmenting strategy and brand positioning strategy on consumer purchasing decision (Study At Smartphone Samsung In Indonesia). Paper presented at 2nd International Conference Shield, Bandar Lampung, Indonesia, September 18–20. [Google Scholar]
- Oakshott, Les. 2016. Essential Quantitative Methods - For Business, Management and Finance. London: Palgrave. [Google Scholar]
- Piedfort, Maison. 2017. Apple’s Marketing Strategy: 10 Important Things To Know. workzone. Available online: https://www.workzone.com/blog/apple-marketing-strategy/ (accessed on 7 November 2020).
- Pogačnik, Anja, and Črnič Aleě. 2014. iReligion: Religious Elements of the Apple Phenomenon. The Journal of Religion and Popular Culture 26: 353–64. [Google Scholar] [CrossRef]
- Samsung. 2020. Samsung Site Map. Available online: https://www.samsung.com/pt/aboutsamsung/home/ (accessed on 7 November 2020).
- Saunders, Mark, and Stacey A. Cooper. 1993. Understanding Business Statistics—An Active-Learning Approach. , Guernsey: The Guernsey Press. [Google Scholar]
- Shavandi, Hassan, and Ata G. Zare. 1986. Analyzing the Price Skimming Strategy for New Product Pricing. Scientia Iranica 20: 2099–108. [Google Scholar]
- Solomon, Michael R., Greg Marshall, and Elnora Stuart. 2011. Marketing: Real People, Real Choices. Upper Saddle River: Pearson Prentice Hall. [Google Scholar]
- Statcounter GlobalStats. 2020. Mobile Vendor Market Share Portugal. Available online: https://gs.statcounter.com/vendor-market-share/mobile/portugal (accessed on 7 November 2020).
- Thomas, Jacob. 2019. 10 Imaginative Events From Apple. The Bizzabo Blog. June 19. Available online: https://blog.bizzabo.com/apple-event-marketing (accessed on 7 November 2020).
Figure 1.
Results about advertising made by Samsung only with branded products and about advertising made by Samsung when it includes Apple products.
Figure 1.
Results about advertising made by Samsung only with branded products and about advertising made by Samsung when it includes Apple products.

Figure 2.
(a) Results about online advertising locations where consumers see more Apple and Samsung ads. (b) Results on the source of information for electronic devices, according to consumers, for Apple and Samsung.
Figure 2.
(a) Results about online advertising locations where consumers see more Apple and Samsung ads. (b) Results on the source of information for electronic devices, according to consumers, for Apple and Samsung.

| .5 |
| (a) |
| .5 |
| (b) |

Table 1.
Characterization of the sample considering the (a) gender, (b) age range, (c) activity, and (d) district of residence of the respondents.
Table 1.
Characterization of the sample considering the (a) gender, (b) age range, (c) activity, and (d) district of residence of the respondents.
| (a) | ||
|---|---|---|
| District | Quantity | |
| Aveiro | 374 | 49.6% |
| Açores | 1 | 0.1% |
| Beja | 44 | 6.3% |
| Braga | 18 | 2.6% |
| Bragança | 3 | 0.4% |
| Castelo-Branco | 4 | 0.6% |
| Coimbra | 32 | 4.6% |
| Évora | 8 | 1.1% |
| Faro | 12 | 1.7% |
| Guarda | 7 | 1.0% |
| Leiria | 25 | 3.6% |
| Lisboa | 42 | 6.0% |
| Madeira | 33 | 4.7% |
| Portalegre | 2 | 0.3% |
| Porto | 44 | 6.3% |
| Santarém | 26 | 3.7% |
| Setúbal | 19 | 2.7% |
| Viana do Castelo | 6 | 0.9% |
| Vila-Real | 5 | 0.7% |
| Viseu | 22 | 3.1% |
| (b) | ||
| Age Range | Quantity | |
| 12–17 | 46 | 6.6% |
| 18–25 | 447 | 63.9% |
| 26–35 | 69 | 9.9% |
| 36–45 | 64 | 9.1% |
| 46–55 | 57 | 8.1% |
| 56–75 | 16 | 2.3% |
| 76 | 1 | 0.1% |
| (c) | ||
| Gender | Quantity | |
| Female | 424 | 60.6% |
| Male | 271 | 38.7% |
| Other | 5 | 0.7% |
| (d) | ||
| Activity | Quantity | |
| Student | 394 | 56.3% |
| Student-worker | 47 | 6.7% |
| Self-employed | 38 | 5.4% |
| Employed | 192 | 27.4% |
| Unemployed | 24 | 3.4% |
| Retired | 5 | 0.7% |
Table 2.
Characterization of the brands owned by the respondents in what accounts for smartphone, tablet, and personal computers. The values between brackets were obtained considering only the ones who possess the type of product under evaluation.
Table 2.
Characterization of the brands owned by the respondents in what accounts for smartphone, tablet, and personal computers. The values between brackets were obtained considering only the ones who possess the type of product under evaluation.
| Brand | Smartphone | Tablet | Personal Computer | |||
|---|---|---|---|---|---|---|
| Apple | 232 | 33.1% (33.4%) | 127 | 18.1% (39.0%) | 97 | 13.9% (14.5%) |
| Samsung | 183 | 26.1% (26.3%) | 103 | 14.7% (31.6%) | 26 | 3.7% (3.9%) |
| Huawei | 141 | 20.1% (20.3%) | 15 | 2.1% (4.6%) | 2 | 0.3% (0.3%) |
| Xiaomi | 89 | 12.7% (12.8%) | 2 | 0.3% (0.6%) | 1 | 0.1% (0.1%) |
| Other | 50 | 7.1% (7.2) | 79 | 11.3% (24.2%) | 541 | 77.3% (81.1) |
| Do not possess | 5 | 0.7% | 374 | 53.4% | 33 | 4.7% |
Table 3.
Ownership of Smartphones from Apple, Samsung, and others, according to the age range of the respondents.
Table 3.
Ownership of Smartphones from Apple, Samsung, and others, according to the age range of the respondents.
| Age Range | Apple | Samsung | Other Brands | Total | |||
|---|---|---|---|---|---|---|---|
| 12–17 | 11 | 23.9% | 18 | 39.1% | 17 | 37.0% | 46 |
| 18–25 | 161 | 36.3% | 106 | 23.9% | 176 | 39.7% | 443 |
| 26–35 | 17 | 24.6% | 18 | 26.1% | 34 | 49.3% | 69 |
| 36–45 | 22 | 34.4% | 17 | 26.6% | 25 | 39.1% | 64 |
| 46–55 | 17 | 30.4% | 16 | 28.6% | 23 | 41.1% | 56 |
| 56–75 | 4 | 25.0% | 8 | 50.0% | 4 | 25.0% | 16 |
| +76 | 0 | 0.0% | 0 | 0.0% | 1 | 100.0% | 1 |
Table 4.
Chi-square calculus for the question “In which social networks do you see more advertising from Apple and Samsung?”. O: Observed. E: Expected.
Table 4.
Chi-square calculus for the question “In which social networks do you see more advertising from Apple and Samsung?”. O: Observed. E: Expected.
| O | E | |||
|---|---|---|---|---|
| 162 | 137.691 | 24.309 | 590.938 | 4.292 |
| 288 | 303.218 | −15.218 | 231.587 | 0.764 |
| 266 | 266.434 | −0.434 | 0.188 | 0.001 |
| 202 | 223.685 | −21.685 | 470.256 | 2.102 |
| 31 | 19.883 | 11.117 | 123.584 | 6.216 |
| 59 | 52.193 | 6.807 | 46.332 | 0.888 |
| 98 | 102.895 | −4.895 | 23.964 | 0.233 |
| 115 | 139.309 | −24.309 | 590.938 | 4.242 |
| 322 | 306.782 | 15.218 | 231.587 | 0.755 |
| 270 | 269.566 | 0.434 | 0.188 | 0.001 |
| 248 | 226.315 | 21.685 | 470.256 | 2.078 |
| 9 | 20.117 | −11.117 | 123.584 | 6.143 |
| 46 | 52.807 | −6.807 | 46.332 | 0.877 |
| 109 | 104.105 | 4.895 | 23.964 | 0.230 |
| Total | 28.82 | |||
Table 5.
Chi-square calculus for the question “For you, what is the source of information of the products from Apple and Samsung?”. O: Observed. E: Expected.
Table 5.
Chi-square calculus for the question “For you, what is the source of information of the products from Apple and Samsung?”. O: Observed. E: Expected.
| O | E | |||
|---|---|---|---|---|
| 265 | 283.577 | −18.577 | 345.111 | 1.217 |
| 154 | 164.040 | −10.040 | 100.803 | 0.615 |
| 254 | 252.529 | 1.471 | 2.165 | 0.009 |
| 226 | 212.683 | 13.317 | 177.346 | 0.834 |
| 199 | 172.837 | 26.163 | 684.494 | 3.960 |
| 116 | 128.334 | −12.334 | 152.132 | 1.185 |
| 293 | 264.423 | 18.577 | 345.111 | 1.305 |
| 163 | 152.960 | 10.040 | 100.803 | 0.659 |
| 234 | 235.471 | −1.471 | 2.165 | 0.009 |
| 185 | 198.317 | −13.317 | 177.346 | 0.894 |
| 135 | 161.163 | −26.163 | 684.494 | 4.247 |
| 132 | 119.666 | 12.334 | 152.132 | 1.271 |
| Total | 16.21 | |||
Table 6.
Chi-square calculus for the question “Where did you acquire Apple and Samsung products?”. O: Observed. E: Expected.
Table 6.
Chi-square calculus for the question “Where did you acquire Apple and Samsung products?”. O: Observed. E: Expected.
| O | E | |||
|---|---|---|---|---|
| 68 | 54.099 | 13.901 | 193.233 | 3.572 |
| 35 | 24.731 | 10.269 | 105.451 | 4.264 |
| 246 | 300.379 | −54.379 | 2957.090 | 9.845 |
| 94 | 90.165 | 3.835 | 14.705 | 0.163 |
| 352 | 325.625 | 26.375 | 695.619 | 2.136 |
| 37 | 50.901 | −13.901 | 193.233 | 3.796 |
| 13 | 23.269 | −10.269 | 105.451 | 4.532 |
| 337 | 282.621 | 54.379 | 2957.090 | 10.463 |
| 81 | 84.835 | −3.835 | 14.705 | 0.173 |
| 280 | 306.375 | −26.375 | 695.619 | 2.270 |
| Total | 41.22 | |||
Publisher’s Note: MDPI stays neutral with regard to jurisdictional claims in published maps and institutional affiliations. |
© 2021 by the authors. Licensee MDPI, Basel, Switzerland. This article is an open access article distributed under the terms and conditions of the Creative Commons Attribution (CC BY) license (http://creativecommons.org/licenses/by/4.0/).
Share and Cite
MDPI and ACS Style
Almeida, M.; Sousa, E.; Rodrigues, C.; Candeias, M.B.; Au-Yong-Oliveira, M. Samsung vs. Apple: How Different Communication Strategies Affect Consumers in Portugal. Adm. Sci. 2021, 11, 19. https://doi.org/10.3390/admsci11010019
AMA Style
Almeida M, Sousa E, Rodrigues C, Candeias MB, Au-Yong-Oliveira M. Samsung vs. Apple: How Different Communication Strategies Affect Consumers in Portugal. Administrative Sciences. 2021; 11(1):19. https://doi.org/10.3390/admsci11010019
Chicago/Turabian StyleAlmeida, Margarida, Eva Sousa, Carolina Rodrigues, Maria Beatriz Candeias, and Manuel Au-Yong-Oliveira. 2021. "Samsung vs. Apple: How Different Communication Strategies Affect Consumers in Portugal" Administrative Sciences 11, no. 1: 19. https://doi.org/10.3390/admsci11010019
Note that from the first issue of 2016, this journal uses article numbers instead of page numbers. See further details here.