On the Differences in Precipitation Type Between the Arctic, Antarctica and Tibetan Plateau
 Diyi Yang1,2
  Minghu Ding1,3*
  Tingfeng Dou3,4
  Wei Han5
  Weigang Liu6 Jianyong Zhang7
  Zhiheng Du3
  Cunde Xiao3,8
- 1State Key Laboratory of Severe Weather, Chinese Academy of Meteorological Sciences, Beijing, China
- 2Haining Meteorological Bureau, Haining, China
- 3State Key Laboratory of Cryospheric Science, Northwest Institute of Eco-Environment and Resources, Chinese Academy of Sciences, Lanzhou, China
- 4College of Resources and Environment, University of Chinese Academy of Sciences, Beijing, China
- 5Beijing Meteorological Observation Center, Beijing, China
- 6Institute of Arid Meteorology, China Meteorological Administration, Lanzhou, China
- 7Meteorological Bureau of the Gannan Tibetan Autonomous Prefecture, Hezuo, China
- 8State Key Laboratory of Earth Surface and Resource Ecology, Beijing Normal University, Beijing, China
Under the effect of global warming, more precipitation will shift to rainfall in cryospheric regions. Considering the influence of the precipitation type on surface energy and mass cycles, it is important to determine the specific precipitation features and to classify the precipitation type in key areas correctly. We analyzed the monthly distribution, variations in each precipitation type’s annual days, and trends based on daily precipitation and air temperature observations from six tripolar stations. The results indicated that snow dominated the precipitation type at Zhongshan station (69.4°S, 76.4°E) throughout the year, while the Greatwall station (62.2°S, 59.0°W) exhibited a relatively diverse precipitation type distribution and significant seasonal cycles. Compared to the Greatwall station, every precipitation type was less frequently encountered at the Barrow (71.3°N, 156.8°W), Coral Harbour (64.2°N, 83.4°W), Linzhi (29.6°N, 94.5°E), and Maqu stations (34°N, 102.1°E), in which all the sites demonstrated classical reverse seasonal variation. A consistent trend across the years was found regarding the trends of the different precipitation types, except at the Greatwall and Coral Harbour stations. Due to snow/rain conditions partly converting into sleet conditions, which may be related to air temperature changes and synoptic atmospheric activities, inconsistent increasing trends of the sleet days were observed compared to the snow/rain days. Furthermore, a hyperbolic parameterized model was also fitted to determine the air temperature threshold of precipitation type transitions in this paper. According to the threshold comparison results, a warm bias in the temperature threshold was found at the warm stations. We also proposed that high relative humidity and low freezing levels were the likely reasons for the ERA5 reanalysis datasets. Finally, this paper’s fitted parameterized model was proven to perform better than the ERA5 reanalysis datasets through validation. This preliminary research provides observational evidence and possible interpretation of the mechanism of precipitation type changes in tripolar areas.
Highlights
• Data from six stations were used to analyze the different precipitation type characteristics of tripolar regions.
• Single-temperature thresholds of the precipitation type in tripolar regions were obtained and presented.
• A warm bias in the warm stations’ temperature threshold was found, and oceanic characteristics and low freezing levels were likely the main reasons.
• The precipitation type identification results based on the ERA5 product and new method were validated in tripolar regions.
Introduction
As an important weather phenomenon, precipitation affects the energy and mass cycles in nature via its different types (snow, rain, and sleet). For example, snow may cover the surface and interrupt the direct heat exchange between the soil and atmosphere, and increase the surface albedo to decrease the incoming radiation (Jakobs et al., 2018; Ding et al., 2020a). The surface energy balance is altered when snowfall occurs, while rain may also adjust the surface energy balance in certain ways through seepage into soil or albedo reduction over snow, facilitating notable ablation in key areas (Rennert et al., 2009; Cohen et al., 2015). Therefore, it is vital to ascertain whether precipitation occurs as snow or rain.
Many studies have addressed the precipitation features of mainly middle to high-latitude regions (Bourgouin, 2000; Dai, 2001; Sims and Liu, 2015). Sims and Liu (2015) investigated the influence of different geophysical parameters on the precipitation type and finally developed a parameterization scheme that could determine the conditional probability of solid precipitation based on meteorological input data to classify the precipitation type correctly. Dai (2001) also obtained the frequency of various precipitation types at the global scale and analyzed the geographical distribution and seasonal and interannual variations. To better identify the precipitation type, many studies have proposed relatively accurate parameterized models (Hux et al., 2001; Thériault et al., 2012; Ikeda et al., 2013). Unfortunately, most models’ application has been limited due to the lack of measurements of the necessary meteorological elements in polar areas and high mountains. Only a few studies on the characterization of the precipitation type with a single air temperature threshold parameter can be widely applied. For example, by using weather reports from land stations and ships, Liu (2008) calculated the conditional probability of snow precipitation as a function of the surface air temperature and found that a 50% probability occurred at an air temperature of approximately 2°C. In similar work by Dai (2008), who proposed a hyperbolic tangent parameterized model, the temperature thresholds over land areas (1.2°C) and oceans (1.9°C) were obtained based on observational records from 1977 to 2007.
As the most important heat sink on Earth, changes in tripolar regions profoundly impact the global atmosphere. Under the global warming effect, tripolar regions are more sensitive than other regions, which has resulted in a two-fold increase in the global average air temperature (Bekryaev et al., 2010; An et al., 2017; Huang et al., 2017). The rainfall-to-total precipitation ratio (RPR) has increased over the past decades, especially during spring (Dou et al., 2018). This may impose a domino effect on sea ice decline, vegetation growth, etc. However, related tripolar regional studies are rare (Ding et al., 2014; Han et al., 2018).
In summary, to enhance our understanding of precipitation type formation schemes and to further improve numerical models for precipitation type determination in tripolar regions, it is necessary to investigate the precipitation features and their thresholds in different climatologies. This study determines the seasonal cycles and trends of various precipitation types using precipitation and air temperature observations. Specific temperature thresholds to distinguish rain and snow are also obtained by a single parameterized model. We also examine the external reasons for the distinct thresholds. The paper is structured as follows: Section Data and Methods introduces the tripolar stations and identification model. Section Results describes the precipitation type characteristics and specific thresholds. Section Discussion discusses the mechanism of the different precipitation types and compares them to those at other polar sites. Section Conclusion presents the conclusions.
Data and Methods
Study Regions
In this study, we analyze the precipitation type features at six polar stations: Barrow, Coral Harbour (Arctic), Zhongshan, Greatwall (Antarctica), Linzhi, and Maqu (Tibetan Plateau). The specific location of each station is shown in Figure 1. The surroundings of the different stations exhibit high morphological diversity.
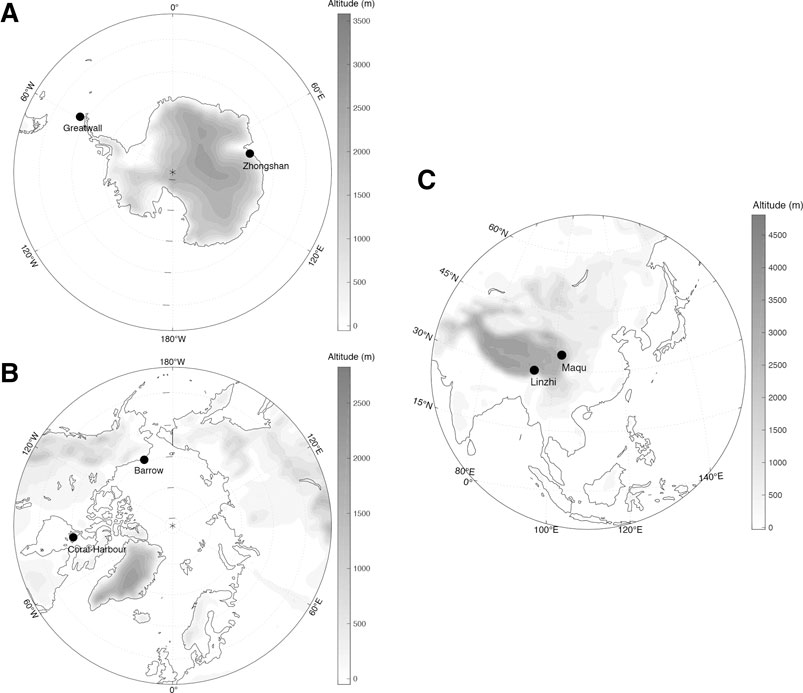
FIGURE 1. Topographic map of the tripolar regions and the locations of the Zhongshan, Greatwall, Barrow, Coral Harbour, Linzhi and Maqu stations. (A) Antarctica part; (B) Arctic part; (C) The coordinated labels coincide (80°E and 0°).
The Zhongshan station (69.4°S, 76.4°E, 17.7 m) is located in the Larsemann Hills, close to Prydz Bay, a few hundred kilometers southwest of the Amery Ice Shelf and the Prince Charles Mountains. Like most coastal sites in East Antarctica, it suffers a stable katabatic wind from the inland ice sheet. The Greatwall station (62.2°S, 59.0°W, 12.0 m) lies on King George Island, which is located in the low-latitude area of West Antarctica. It is surrounded by seas, which may experience an Antarctic maritime climate. It is also a good site to study climate change’s response and evolution due to dramatic weather changes.
The Barrow station (71.3°N, 156.8°W, 9.4 m) is situated on the northeastern most tip of the North American continent, also located on the coast of the Arctic Ocean. The terrain is fairly flat, causing the Barrow station to be easily affected by polar easterlies carrying marine moisture. The Coral Harbour station (64.2°N, 83.4°W, 62.2 m) is situated in the eastern part of the North American continent and close to South Bay with a similarly flat terrain to that surrounding the Barrow station.
The Linzhi station (29.6°N, 94.5°E, 3,001.0 m) lies in the southeastern part of the Tibetan Plateau, which is also a critical confluence area of warm and cold airflows, contributing to its special humid climate. In contrast, the Maqu station (34°N, 102.1°E, 3,473.0 m) is situated in the northeastern part of the Tibetan Plateau, traversed by the Kunlun Mountains, resulting in an obvious plateau continental climate.
Data Processing
To maintain a consistent temporal scale, the selected observation period in this study lasted from January 1, 1990 to December 31, 2017, including 10,227 pairs of data points at each station (except for Maqu, where the observation period lasted from 1997 to 2017, including 7,670 pairs of data points). For the Antarctica and Tibetan Plateau stations, the daily mean air temperature and precipitation type occurrence were obtained according to the surface meteorological observation data files from the China Meteorological Administration. In terms of the Arctic sites, we acquired the accumulated snowfall/rainfall amount each day, as well as the daily mean air temperature from the Alaska Climate Research Center (http://climate.gi.alaska.edu/acis_data) and Environment and Climate Change Canada’s Meteorological Service (https://climate.weather.gc.ca/index_e.html), which have good data accuracy (Han et al., 2018). The daily ERA5 reanalysis products of the precipitation type, freezing level (zero-degree level) above the ground, and relative humidity at 11 different pressure levels under 600 hPa were also downloaded for the corresponding grids.
In polar regions, precipitation is recorded by a precipitation accumulation gauge that stores the amount of rainfall and snowfall under reliable maintenance (Automated Surface Observing System, 1998). For identifying precipitation types, Antarctica and Tibetan Plateau stations were manually identified and recorded with some occasional errors. In contrast, the records in Arctic stations experienced the transition from manual to automatic observation. A precipitation amount of less than 0.1 mm is observed to be negligible, according to the China Meteorological Administration (2011). Moreover, drifting/blowing snow may slightly increase the measurements when there is no snowfall or rainfall, so we first corrected the snow/rain records that are under 0.1 mm to zero. Second, considering the difference between the automatic weather station and manual observations, beyond removing the temperature outliers and missing records, we also performed further quality control according to statistical results of observed precipitation types, whereby any records satisfying the following conditions were removed:
For the Antarctica/Arctic stations:
(1) Rain only,
(2) Sleet,
(3) Snow only,
For the Tibetan Plateau stations (Ding et al., 2014):
(1) Rain only,
(2) Sleet,
(3) Snow only,
Precipitation Type Identification Method
Based on the obtained daily data after quality control, we applied the precipitation type identification model proposed by Ding et al. (2014). We used the air temperature to replace the wet-bulb temperature due to the lack of relative humidity and air pressure. However, this method still generally attains an acceptable accuracy with precipitation records on the Tibetan Plateau and Arctic (Ding et al., 2014; Han et al., 2018; Zeng et al., 2020):
where R is the frequency ratio of the solid precipitation ranging from 0 to 1, which is exactly the centralized value between the probability of snow and the cumulative probability of snow and sleet.
Validation
The performance of the precipitation type identification method and reanalysis product are both assessed against observation records. According to Eq. 1, which was fitted at each site, the time series of modeling precipitation type was obtained based on the relationship between air temperature and each fixed
Results
Seasonal Cycles of the Precipitation Types
Using the observation records, the monthly mean variations in the days of the different precipitation types (i.e., snow, sleet, or rain days) are shown in Figure 2. Snow dominated the Zhongshan station’s precipitation type, whose snow days exceeded 10 days each month except during the summertime. There were nearly no rain events throughout the whole year. In contrast, all the precipitation types occurred every month with obvious seasonal cycles at the Greatwall station. The rainy days at the Greatwall station mostly occurred from January to March, with a peak in February and a valley in August. The snow days exhibited the opposite variation to that during rainy days and occurred most frequently in July, accounting for almost 2/3 of the time. As a mixed type, the sleet days always increased when Antarctica entered the transition period. This suggests a typical distribution of the precipitation types across the coastal stations on the Antarctica Peninsula. In the Arctic, the Barrow and Coral Harbour stations both demonstrated reverse-type trends to those at the Greatwall station, where snow and rain dominated from October to May and from July to August, respectively. Sleet occurs mostly around the early summer/autumn, reflecting the temperature transition, while it hardly happens during the rest of the year. On the Tibetan Plateau, the Linzhi station, located along the southeast edge, experienced much higher precipitation and more rainy days than the northern Maqu station did, where snow and rain equally occurred. All six stations exhibited different seasonal variations in precipitation type.
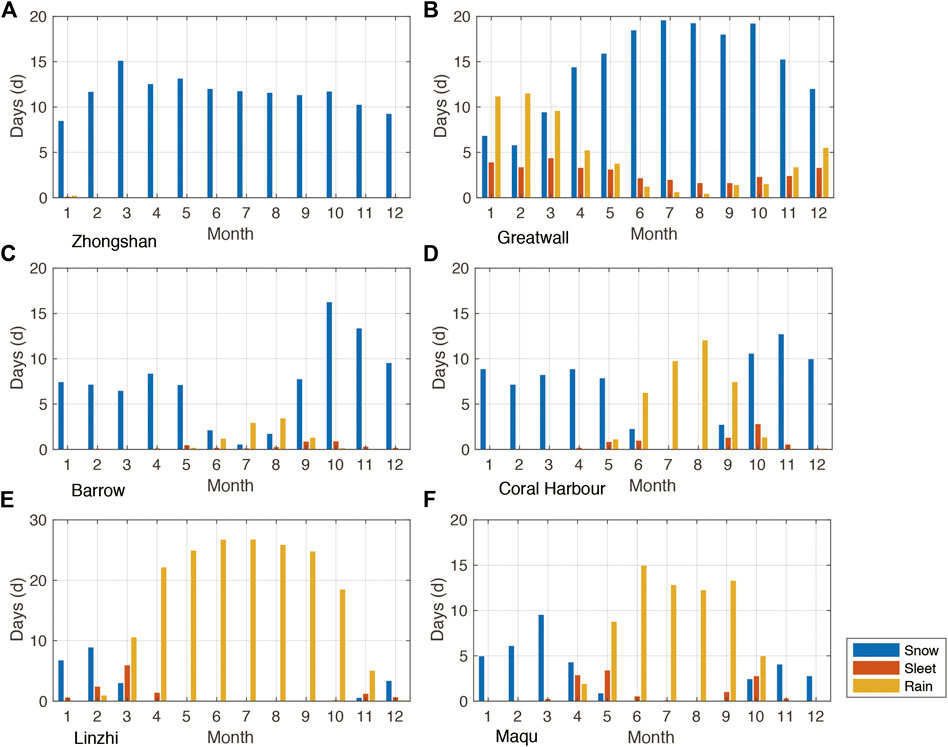
FIGURE 2. Monthly variations in snow, sleet and rain days at the Zhongshan, Greatwall, Barrow, Coral Harbour, Linzhi and Maqu stations (a–e: 1990–2017; f: 1997–2017).
Many factors, including latitude, elevation, and atmospheric conditions, influence the precipitation type at stations (e.g., Ye et al., 2013; Ding et al., 2014). The Zhongshan and Maqu stations both have higher latitudes than the Greatwall and Linzhi stations, respectively, leading to an obviously lower air temperature and thus inducing more snow under the same moisture conditions. As Figure 3 presents, the monthly mean air temperature at Zhongshan station has rarely reached 0°C over the past 20 years, resulting in snow-dominated conditions. The Linzhi station always exhibited a monthly air temperature above 0°C, but the freezing height was likely low, so snow was also observed in winter. The Coral Harbour station demonstrated the largest annual temperature variation, while the Barrow station, located in a higher latitude and coastal region of the Arctic Ocean, exhibited mild atmospheric properties due to ocean air masses (a smaller variation in the monthly temperature). Furthermore, cyclones transport meridional atmospheric heat and moisture from the mid-latitudes to the Arctic (Akperov and Mokhov, 2013; Akperov et al., 2018). More intense invasions of warm, moist air masses could have a deeper northward path and an obvious effect in the Arctic. During the cold season, cyclones will be more active and frequent (McCabe et al., 2001; Akperov et al., 2014), which provides a reasonable explanation for why there are rapidly increased snowfall days at the Barrow station.
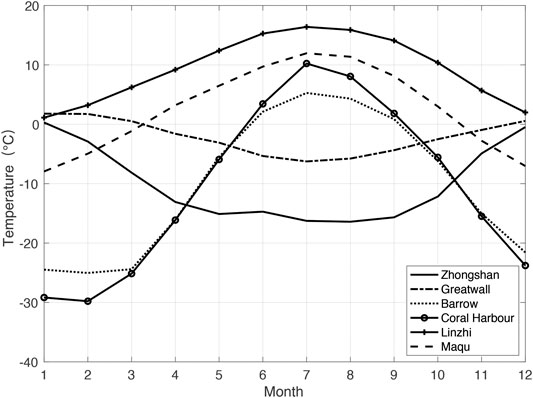
FIGURE 3. Monthly variations in the surface air temperature at the Zhongshan, Greatwall, Barrow, Coral Harbour, Linzhi and Maqu stations.
Trends of the Precipitation Types
To analyze the difference in precipitation type among the above stations under climate change, the trends of snow, rain, sleet, and total precipitation days since 1990 were calculated (Figure 4). On average, the yearly precipitation days at all stations exceeded 100 days. The mean of the total days at the Greatwall station even reached 262.6 days from 1990–2017, demonstrating that five precipitation days occurred per week on average. The driest station was the Barrow station, and a yearly average of 100.3 precipitation days was observed from 1990–2017. The three types exhibited a relatively consistent trend at these stations except at the Greatwall and Coral Harbour stations. A decrease rate of 0.7 snow days per decade was found at the Greatwall station, while the rain and sleet days increased at rates of 6.3 and 0.5 days per decade, respectively. This may be related to the snow-rain transition due to air temperature changes and synoptic atmospheric activities, as suggested by Bozkurt et al. (2018) and Ding et al. (2020b).
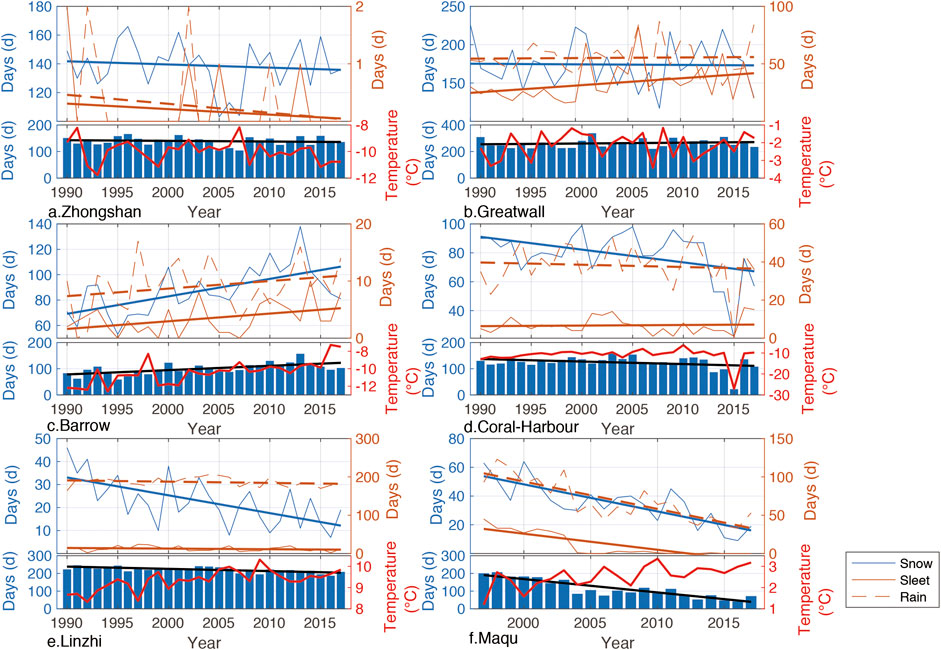
FIGURE 4. Variations in the annual rain, sleet, snow, and total precipitation days and their linear trend (bold line) at the Zhongshan, Greatwall, Barrow, Coral Harbour, Linzhi and Maqu stations (a–e: 1990–2017; f: 1997–2017, red bold lines are the annual mean air temperature curves).
Similarly, the inconsistent trends at the Coral Harbour station between the decreasing snow/rain days and increasing sleet days could also be explained by the fact that the snow/rain conditions were partly converted into increased sleet conditions (please note that the decrease in snow days was much larger). The sharpest decline occurred at Maqu station, where the decrease rates of snow, sleet, and rain days were 18.8, 20.9, and 35.7 days per decade, respectively. The number of snow and sleet days gradually approached 0, accompanied by significantly negative correlations of annual mean air temperature (−0.76 and −0.58), indicating a severe drought under climate warming and serious ecological challenges (Mao et al., 2008). The Barrow station is the only station experiencing increasing trends of the snow, rain, and sleet types, at rates of 13.8, 1.3, and 1.3 days per decade, respectively. Previous studies have pointed out that Arctic precipitation has increased due to climate warming and sea ice decline (e.g., Anderson et al., 2018; Dou et al., 2018). The increase in cyclonic activities in the Arctic (Rinke et al., 2017; Akperov et al., 2018) may also enhance the weather complexity and give rise to more precipitation days. The number of rain days at Linzhi station was relatively large and remained stable, while there were consistently few sleet days, whereas the snow days revealed a notable downward trend at a rate of 7.7 days per decade. Considering the warming rate (∼0.40°C/10 years) from 1990 to 2017 based on the Linzhi meteorological station, which is approximately two times higher than the global average, and has a highly negative correlation coefficient with the annual snow days (−0.69), the decline in snow days is reasonable.
Determination of the Precipitation Type Thresholds
According to Eq. 1 and the meteorological observations, snow and rain proportions and fitted curves were obtained for the six stations (Figure 5). Most of the study stations exhibited very high coefficients of determination, with
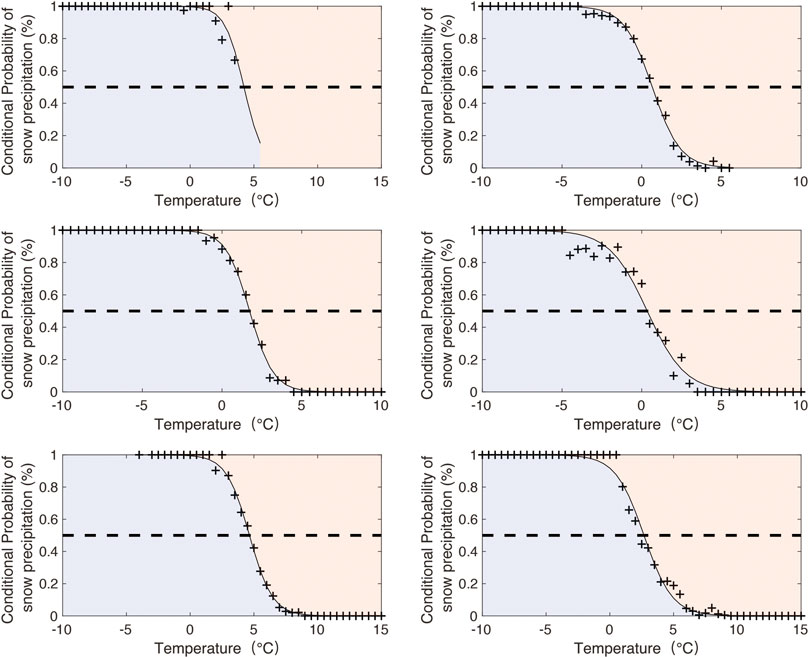
FIGURE 5. Conditional probability of snow precipitation vs the near-surface air temperature, based on the Zhongshan, Greatwall, Barrow, Coral Harbour, Linzhi and Maqu station surface observations, with respective curvilinear fits (the upper half of the curve represents the conditional probability of rain precipitation; in addition, sleet was excluded).
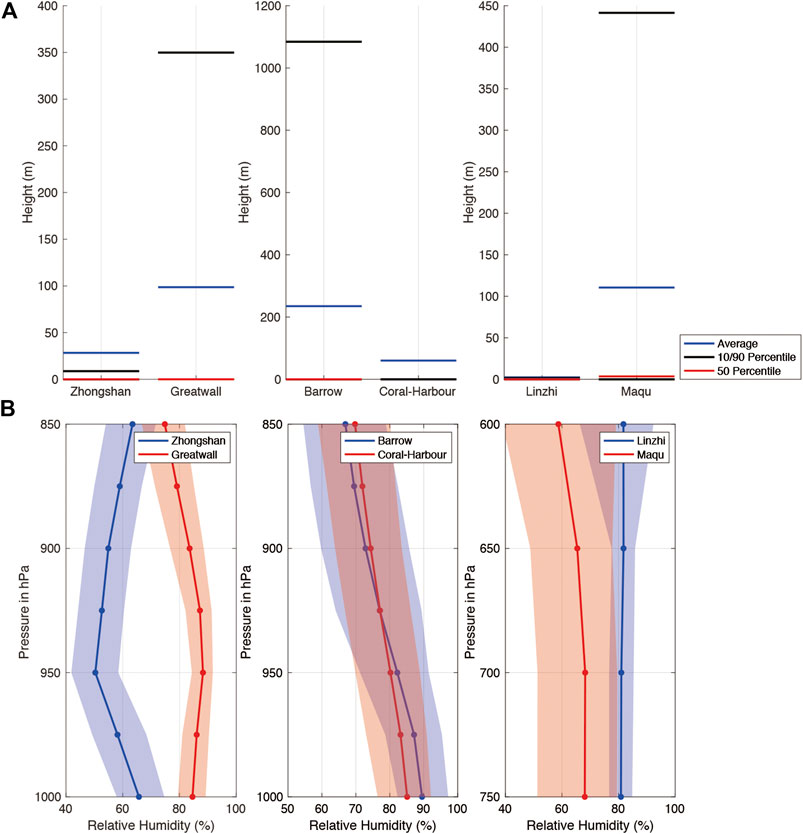
FIGURE 6. (A) The average heights and 10/50/90 percentile freezing levels of the ERA5 reanalysis above each station during snowfall events and (B) the mean vertical relative humidity distribution of the ERA5 reanalysis at six stations (the shadow boundaries are the 10 and 90 percentiles of relative humidity).
Discussion
Performance of the Method and ERA5 Reanalysis Datasets
To verify the precipitation type identification method’s performance, the accuracy of Eq. 1 and the reanalysis product was assessed against the observation records. Figure 7 shows that the threshold identification model attains a high accuracy regarding snow events, with an average accuracy higher than 80%. In contrast to the snow type, the rain type performance showed a notably uneven distribution, with accuracies ranging from 53.2 to 96.7% (the calculation captured none of the 12 rain days observed at the Zhongshan station from 1990–2017). Moreover, the model yielded better snow identification results at the coastal stations (the Zhongshan, Greatwall, Barrow, and Coral Harbour stations) than at the inland stations (the Linzhi and Maqu stations), while the rain identification accuracy exhibited the opposite trend. This suggests that this model may be suitable for rainy inland and snowy coastal regions.
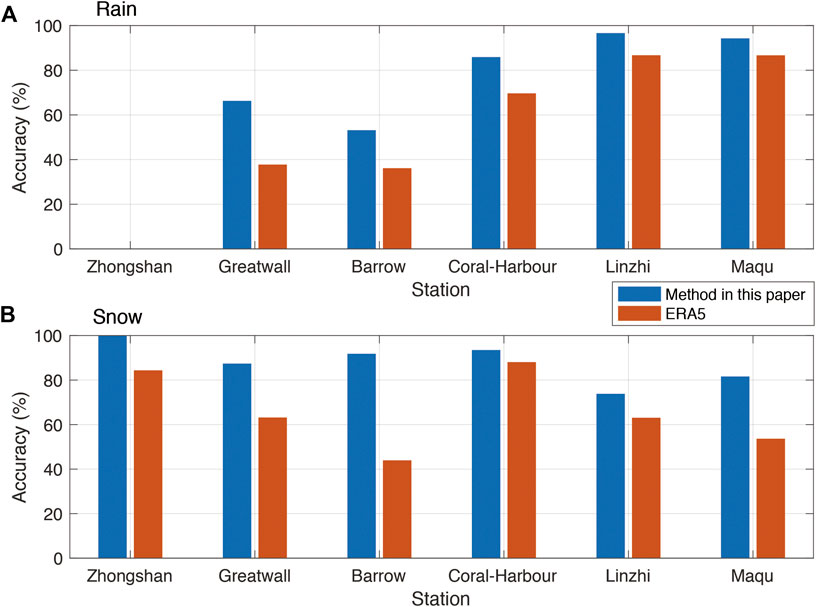
FIGURE 7. Accuracy of precipitation type identification using the method in this paper and the ERA5 reanalysis datasets (sleet is excluded).
From the comparison to the ERA5 reanalysis datasets, we found that moderate reproducibility in the rain type was achieved at the Coral Harbour, Linzhi, and Maqu stations, while the rain type reproducibility was quite low at the other stations. Moreover, the snow days at almost all stations were captured well by the ERA5 reanalysis datasets except at the Barrow station (Figure 7B). We found that a high rain identification performance usually occurred at the inland/continental stations, and there were no obvious geographic differences in snow identification. Further analysis indicated that stations such as the Coral Harbour and Linzhi stations realized a relatively higher integrated accuracy than the other stations where the rain/snow accuracy reached as low as 36.2/44.0% (the Barrow station). Notably, the performance of the method proposed in this paper was better than that of the ERA5 product at these stations.
Comparison to Other Studies
Generally, the precipitation type depends on the tropospheric vertical temperature profile. Snow particles may melt or refreeze while they fall through different layers at air temperatures above or below 0°C. Bourgouin (2000) proposed a method to determine the precipitation type under four kinds of atmospheric vertical temperature profiles. According to the theory proposed by Bourgouin (2000), rain, snow, and mixtures of snow and rain are all possible when a freezing layer occurs (which is common in most cases, as shown in Figures 8A–C). However, with a low freezing layer above the surface (Figure 6), snow is generally expected at the Zhongshan and Linzhi stations. In addition to the freezing level, the temperature inversion distribution in the boundary layer can also lead to a different precipitation type (Figures 8A,B). Compared to the Linzhi station, elevated inversion and surface-based inversion conditions preferentially occur at the Maqu station (Guo et al., 2020), which corresponds to a complex precipitation distribution. This approach has good physical meaning in terms of precipitation type identification. However, vertical air temperature profile acquisition is too complex to effectively popularize in tripolar regions, limiting the application of the above method.
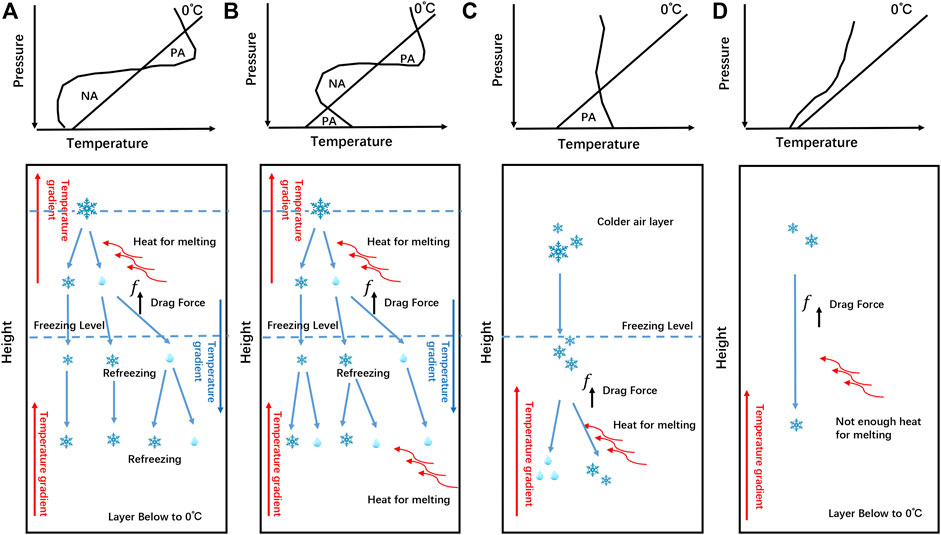
FIGURE 8. Schematic diagram illustrating the formation of the different precipitation types under the four typical vertical temperature profiles. Plots A-D are adapted from Bourgouin (2000). The positive (PA) and negative (NA) areas indicate the above and below freezing layers, respectively.
Prein and Heymsfield (2020) pointed out that the falling speed of liquid drops ranged from 0.0003 to 9 m/s. For solid precipitation, aggregates fall at a mean value of 0.72 m/s, with rimed snow and graupel falling faster and whose average falling speed can reach 0.86 and 0.90 m/s, respectively (Garrett and Yuter, 2014). This is also an important factor, as the snow particles’ original shape affects the precipitation type reaching the surface. These factors could be altered under special and varied climatic conditions (e.g., the freezing level’s height, elevation). On the one hand, the elevation greatly influences the precipitation type identification threshold according to the falling speed (Ding et al., 2014), because the air is thin, and the pressure is low in high-elevation regions. Therefore, snow particles suffer a low drag force from their surroundings and fall rapidly, resulting in less melting on snow particles. They more readily remain solid, which may not be clearly reflected in our study on the Tibetan Plateau. On the other hand, the vapor pressure difference between snow particles and the environmental atmosphere declines with increasing humidity of the surrounding air, which could lead to a low sublimation cooling rate of the snow particles and a high threshold during snowfall. This fits well with the Arctic and Tibetan Plateau stations’ threshold performance, where the sites that are drier near the ground more easily have liquid precipitation (the Coral Harbour and Maqu stations).
Several precipitation type identification methods/models have been proposed for middle to high-latitude regions (Liu, 2008; Ding et al., 2014; Han et al., 2018). Dai (2008) proposed that the 50% frequency for both snow and rain occurs at temperatures considerably above 0°C, at approximately 1.2°C for land snow and 1.9°C for ocean snow, based on global datasets. This warm bias mainly stems from the different melting times during snowfall through warm near-surface air layers. Similarly, the overall threshold in the Arctic is ∼1.17°C (Han et al., 2018), which is exactly between the two thresholds determined in this paper (0.35 ∼ 1.73°C).
At the Arctic and Tibetan Plateau stations, we found that the stations experiencing high-temperature and high-humidity conditions attained high thresholds. We propose that this warm bias may largely originate from their oceanic characteristics (high relative humidity) and low freezing levels. However, due to the lack of quantitative data on the Tibetan Plateau and Antarctica, we used the ERA5 reanalysis product for the specific freezing and vertical humidity analysis. We did not subdivide the obtained statistics at the hourly scale, nor did we adopt the RPR in the threshold analysis. Furthermore, we did not consider the uncertainties in the temperature data. The high solar radiation and low wind speed during the summertime could lead to a warm bias (Genthon et al., 2011) in the air temperature. However, all the temperature sensors were equipped with ventilation devices enabling natural ventilation. A major gap remains between the various models and observations in terms of precipitation type identification and prediction. Given the importance of the tripolar region precipitation type for the global climate, further studies are required to improve our ability to respond to the temperature-induced precipitation shift from snow to rain.
Conclusion
Two typical stations in Antarctica, the Arctic, and Tibetan Plateau were selected to analyze precipitation type characteristics. The results indicated that in Antarctica, snow was the main precipitation type at Zhongshan station throughout the year, with a monthly mean value of 10 days except during the summertime. In contrast to the Zhongshan station, the Greatwall station located at a lower latitude exhibited obvious variability and seasonal cycles for all precipitation types. Regarding the mixed type there, the sleet days always increased when Antarctica entered a transition period. In the Arctic, the Barrow and Coral Harbour stations both demonstrated classical reverse monthly precipitation type distributions to those at the Greatwall station. Similar to Antarctica, there is an increase in sleet events around early summer/autumn. Due to the high air temperature, the Linzhi station experienced more liquid precipitation than the Maqu station on the Tibetan Plateau.
The trends of the precipitation types and thresholds at each station were also determined in this paper. Most of the stations exhibited consistent annual variation trends except the Greatwall and Coral Harbour stations. The inconsistent decreasing snow or rain days could be explained by the increasing conversion of rain/snow conditions into sleet conditions. In addition, the number of days of the three precipitation types at the Maqu station continuously declined, and the sleet and snow days gradually approached 0, indicating serious ecological challenges. Furthermore, the precipitation type transition threshold is generally related to the tropospheric vertical profile, and different thresholds were determined, ranging from 0.35°C (the Coral Harbour station) to 4.65°C (the Linzhi station). Depending on the threshold relationship and ERA5 reanalysis, we identified the high moisture condition and low freezing levels as the likely cause for the warm bias in the warm stations’ temperature threshold. Finally, the parameterized model established in this paper was also verified to clearly perform better than the ERA5 product at these six stations.
This paper provides a new perspective and an important reference for studying precipitation type transitions in key tripolar areas. More long-term quantitative precipitation observations and, in particular, short-term atmospheric temperature profile research for a detailed physical study remain urgent in these areas.
Data Availability Statement
The data analyzed in this study is subject to the following licenses/restrictions: Some parts of data could be obtained in The Alaska Climate Research Center (http://climate.gi.alaska.edu/acis_data) and Environment and Climate Change Canada’s Meteorological Service (https://climate.weather.gc.ca/index_e.html). For the scientific research needs, the data requests on Antarctica stations can be made directly to dingminghu@foxmail.com. The detailed data from Tibetan Plateau station are subject to legal restrictions. The access to these datasets should be communicated with the corresponding author.
Author Contributions
DY and MD supervised the paper. DY wrote the manuscript. TD, WH and JZ provided the datasets. WL, ZD and CX helped with the discussion and revision.
Acknowledgments
This study was funded by the National Key R&D Program of China (2019YFC1509100), the Strategic Priority Research Program of the Chinese Academy of Sciences (XDA20100300), the National Natural Science Foundation of China (41771064), and the Basic Fund of the Chinese Academy of Meteorological Sciences (Grant Nos. 2018Z001 and 2019Z008). The observations in Antarctica were logistically supported by the Chinese National Antarctic Research Expedition (CHINARE).
Conflict of Interest
The authors declare that the research was conducted in the absence of any commercial or financial relationships that could be construed as a potential conflict of interest.
References
Akperov, M. G., and Mokhov, I. I. (2013). Estimates of the sensitivity of cyclonic activity in the troposphere of extratropical latitudes to changes in the temperature regime. Izv. Atmos. Ocean. Phys. 49 (2), 113–120. doi:10.1134/s0001433813020035
Akperov, M. G., Mokhov, I. I., Rinke, A., Dethloff, K., and Matthes, H. (2014). Cyclones and their possible changes in the arctic by the end of the twenty first century from regional climate model simulations. Theor. Appl. Climatol. 122 (1–2), 85–96. doi:10.1007/s00704-014-1272-2
Akperov, M., Rinke, A., Mokhov, I. I., Matthes, H., Semenov, V. A., Adakudlu, M., et al. (2018). Cyclone activity in the Arctic from an ensemble of regional climate models (Arctic CORDEX). J. Geophys. Res. Atmos. 123, 2537–2554. doi:10.1002/2017jd027703
An, W., Hou, S., Hu, Y., and Wu, S. (2017). Delayed warming hiatus over the Tibetan plateau. Earth Space Sci. 4 (3), 128–137. doi:10.1002/2016ea000179
Anderson, B. T., Feldl, N., and Lintner, B. R. (2018). Emergent behavior of arctic precipitation in response to enhanced arctic warming. J. Geophys. Res. Atmos. 123 (5), 2704–2717. doi:10.1002/2017jd026799
Automated Surface Observing System. (1998). Automated Surface Observing System (ASOS). Available at: https://www.weather.gov/media/asos/aum-toc.pdf (Retrieved December 17,2020).
Bekryaev, R. V., Polyakov, I. V., and Alexeev, V. A. (2010). Role of polar amplification in long-term surface air temperature variations and modern arctic warming. J. Clim. 23, 3888–3906. doi:10.1175/2010jcli3297.1
Bourgouin, P. (2000). A method to determine precipitation types. Weather Forecast. 15 (5), 583–592. doi:10.1175/1520-0434(2000)015<0583:amtdpt>2.0.co;2.
Bozkurt, D., Rondanelli, R., Marin, J. C., and Garreaud, R. (2018). Foehn event triggered by an atmospheric river underlies record-setting temperature along continental Antarctica. J. Geophys. Res. Atmos. 123, 3871–3892. doi:10.1002/2017jd027796
China Meteorological Administration (2011). Specifications for surface meteorological observation. Beijing, China: China Meteorological Press [in Chinese]
Cohen, J., Ye, H., and Jones, J. (2015). Trends and variability in rain‐on‐snow events. Geophys. Res. Lett. 42, 7115–7122. doi:10.1002/2015gl065320
Dai, A. (2001). Global precipitation and thunderstorm frequencies. part I: seasonal and interannual variations. J. Clim. 14 (6), 1092–1111. doi:10.1175/1520-0442(2001)014<1092:gpatfp>2.0.co;2
Dai, A. (2008). Temperature and pressure dependence of the rain-snow phase transition over land and ocean. Geophys. Res. Lett. 35 (12), 62–77. doi:10.1029/2008gl033295
Ding, B., Yang, K., Qin, J., Wang, L., Chen, Y., He, X., et al. (2014). The dependence of precipitation types on surface elevation and meteorological conditions and its parameterization. J. Hydrol. 513, 154–163. doi:10.1016/j.jhydrol.2014.03.038
Ding, M., Han, W., Zhang, T., Yue, X., Fyke, J., Liu, G., et al. (2020b). Towards more snow days in summer since 2001 at the great wall station, Antarctic peninsula: the role of the amundsen sea low. Adv. Atmos. Sci. 37 (5), 494–504. doi:10.1007/s00376-019-9196-5
Ding, M., Yang, D., van den Broeke, M., Allison, I., Xiao, C., Qin, D., et al. (2020a). The surface energy balance at Panda 1 Station, Princess Elizabeth Land: a typical katabatic wind region in East Antarctica. J. Geophys. Res. Atmos. 125, e2019JD030378. doi:10.1029/2019jd030378
Dou, T., Xiao, C., Liu, J., Han, W., Du, Z., Mahoney, A. R., et al. (2018). A key factor initiating surface ablation of arctic sea ice: earlier and increasing liquid precipitation. Cryosphere Discuss. 13 (4), 1233–1246. doi:10.5194/tc-13-1233-2019
Garrett, T. J., and Yuter, S. E. (2014). Observed influence of riming, temperature, and turbulence on the fallspeed of solid precipitation. Geophys. Res. Lett. 41, 6515–6522. doi:10.1002/2014gl061016
Genthon, C., Six, D., Favier, V., Lazzara, M., Keller, L., et al. (2011). Atmospheric temperature measurement biases on the antarctic plateau. J. Atmos. Ocean. Technol. 28 (12), 1598–1605. doi:10.1175/jtech-d-11-00095.1
Guo, J., Chen, X., Su, T., Liu, L., Zheng, Y., Chen, D., et al. (2020). The climatology of temperature inversions in China from radiosonde measurements: roles of black carbon, local meteorology, and large-scale subsidence. J. Clim. 33 (21), 9327–9350. doi:10.1175/jcli-d-19-0278.1
Han, W., Xiao, C., Dou, T., and Ding, M. (2018). Arctic has been going through a transition from solid precipitation to liquid precipitation in spring. Chin. Sci. Bull. 63 (12), 1154–1162. doi:10.1360/n972018-00088 [in Chinese]
Huang, J., Zhang, X., Zhang, Q., Lin, Y., Hao, M., Luo, Y., et al. (2017). Recently amplified arctic warming has contributed to a continual global warming trend. Nat. Clim. Change. 7 (12), 875–879. doi:10.1038/s41558-017-0009-5
Hux, J. D., Knappenberger, P. C., Michaels, P. J., Stenger, P. J., Cobb, H. D., Rusnak, M. P., et al. (2001). Development of a discriminant analysis mixed precipitation (damp) forecast model for mid-atlantic winter storms. Weather Forecast. 16 (2), 248–259. doi:10.1175/1520-0434(2001)016<0248:doadam>2.0.co;2
Ikeda, K., Steiner, M., Pinto, J., and Alexander, C. (2013). Evaluation of cold-season precipitation forecasts generated by the hourly updating high-resolution Rapid Refresh Model. Weather Forecast. 28, 921–939. doi:10.1175/waf-d-12-00085.1
Jakobs, C. L., Reijmer, C. H., Munneke, P. K., König-Langlo, G., and Broeke, M.R. (2018). Quantifying the snowmelt-albedo feedback at neumayer station, East Antarctica. Cryosphere Discuss., 13 (5), 1473–1485. doi:10.5194/tc-13-1473-2019
Liu, G. (2008). Deriving snow cloud characteristics from CloudSat observations. J. Geophys. Res. 113, D00A09. doi:10.1029/2007jd009766
Mao, F., Tang, S., and Sun, H. (2008). A study of dynamic change of dry and wet climate regions in the Tibetan plateau over the last 46 years. Chin. J. Atmos. Sci. 32 (3), 499–507. doi:10.1016/j.chinastron.2008.10.011 [in Chinese]
McCabe, G. J., Clark, M. P., and Serreze, M. C. (2001). Trends in Northern hemisphere surface cyclone frequency and intensity. J. Clim. 14 (12), 2763–2768. doi:10.1175/1520-0442(2001)014<2763:tinhsc>2.0.co;2
Prein, A. F., and Heymsfield, A. J. (2020). Increased melting level height impacts surface precipitation phase and intensity. Nat. Clim. Change. 10 (8), 771–776. doi:10.1038/s41558-020-0825-x
Rennert, K. J., Roe, G., Putkonen, J., and Bitz, C. M. (2009). Soil thermal and ecological impacts of rain on snow events in the circumpolar arctic. J. Clim. 22 (9), 2302–2315. doi:10.1175/2008jcli2117.1
Rinke, A., Maturilli, M., Graham, R. M., Matthes, H., Handorf, D., Cohen, L., et al. (2017). Extreme cyclone events in the Arctic: wintertime variability and trends. Environ. Res. Lett. 12 (9), 094006. doi:10.1088/1748-9326/aa7def
Sims, E. M., and Liu, G. (2015). A parameterization of the probability of snow–rain transition. J. Hydrometeorol. 16 (4), 1466–1477. doi:10.1175/jhm-d-14-0211.1
Thériault, J. M., Rasmussen, R., Smith, T., Mo, R., Milbrandt, J. A., Brugman, M. M., et al. (2012). A case study of processes impacting precipitation phase and intensity during the Vancouver 2010 Winter Olympics. Weather Forecast. 27, 1301–1325. doi:10.1175/waf-d-11-00114.1
Ye, H., Cohen, J., and Rawlins, M. (2013). Discrimination of solid from liquid precipitation over northern Eurasia using surface atmo-spheric conditions. J. Hydrometeorol. 14, 1345–1355. doi:10.1175/jhm-d-12-0164.1
Keywords: precipitation types, tri-polar regions, single temperature threshold, precipitation trend, freezing level
Citation: Yang D, Ding M, Dou T, Han W, Liu W, Zhang J, Du Z and Xiao C (2021) On the Differences in Precipitation Type Between the Arctic, Antarctica and Tibetan Plateau. Front. Earth Sci. 9:607487. doi: 10.3389/feart.2021.607487
Received: 17 September 2020; Accepted: 11 January 2021;
Published: 19 February 2021.
Edited by:
Michael Lehning, École Polytechnique Fédérale de Lausanne, SwitzerlandReviewed by:
Satoru Yamaguchi, National Research Institute for Earth Science and Disaster Resilience (NIED), JapanAlfonso Ferrone, École Polytechnique Fédérale de Lausanne, Switzerland
Copyright © 2021 Yang, Ding, Dou, Han, Liu, Zhang, Du and Xiao. This is an open-access article distributed under the terms of the Creative Commons Attribution License (CC BY). The use, distribution or reproduction in other forums is permitted, provided the original author(s) and the copyright owner(s) are credited and that the original publication in this journal is cited, in accordance with accepted academic practice. No use, distribution or reproduction is permitted which does not comply with these terms.
*Correspondence: Minghu Ding, dingminghu@foxmail.com