Minding the Data-Gap Trap: Exploring Dynamics of Abundant Dolphin Populations Under Uncertainty
 Erin Ashe1*
  Rob Williams1
  Christopher Clark2
  Christine Erbe3
  Leah R. Gerber4
  Ailsa J. Hall5
  Philip S. Hammond5
  Robert C. Lacy6 Randall Reeves7
  Nicole L. Vollmer8
- 1Oceans Initiative, Seattle, WA, United States
- 2Cornell Lab of Ornithology, Ithaca, NY, United States
- 3Centre for Marine Science and Technology, Curtin University, Perth, WA, Australia
- 4Center for Biodiversity Outcomes, Arizona State University, Tempe, AZ, United States
- 5Sea Mammal Research Unit, University of St Andrews, St Andrews, United Kingdom
- 6Chicago Zoological Society, Brookfield, IL, United States
- 7Okapi Wildlife Associates, Hudson, QC, Canada
- 8Smithsonian Institution, Washington, DC, United States
Preventing declines in common species is key to sustaining the structure and function of marine ecosystems. Yet for many common marine mammals, including oceanic dolphins, statistical power to detect declines remains low due to patchy distribution and large variability in group sizes. In this study, population viability analyses (PVA) were used to model the dynamics of four oceanic dolphin populations off the United States West Coast: eastern North Pacific long-beaked common dolphins (Delphinus delphis capensis), short-beaked common dolphins (D. delphis delphis), Pacific white-sided dolphins (Lagenorhynchus obliquidens), and “offshore” common bottlenose dolphins (Tursiops truncatus). We calibrated the PVA with life-history tables, studies on proxy species, and stock assessment reports. We explored the sensitivity of populations to demographic variation and projected how they may respond to changes in three sublethal threats (prey limitation, ocean noise, and chemical pollution) and one lethal threat (fisheries bycatch). We found the most serious projected declines in long-beaked common dolphins, which showed the lowest birth rate. Most threat scenarios resulted in declines that would not be detected by existing monitoring programs in the United States, which are among the most data-rich surveys of their kind. The cumulative effects of the three sublethal stressors exceeded the effect of the one lethal stressor (fisheries bycatch). To implement pro-active management and monitoring programs, anticipating which cetaceans are more at risk and which anthropogenic threats could cause declines is paramount. Our study highlights the value of model testing with PVA when monitoring data are poor, thereby identifying priorities for future research, monitoring, and management.
Introduction
Despite calls to move beyond a “crisis discipline” (Soulé, 1991), conservation biology heavily prioritizes small, localized populations at imminent risk of extinction. This often comes at a cost to abundant (yet declining) populations that underpin ecosystem structure and function (Caughley, 1994; Gaston and Fuller, 2008; Gaston, 2010). Continuing declines may become irreversible and lead to substantial ecosystem change (Jackson et al., 2001; Ellsworth and McComb, 2003; Sekercioglu, 2006). Yet, identifying large populations that are declining is challenging when data are lacking and/or statistical power is low.
Knowledge of abundance and population trends is particularly sparse for oceanic mammals. In many parts of the world, no legal obligation exists to monitor the status of marine mammals leading to pronounced data gaps (Kaschner et al., 2012). Even in the United States, where monitoring of defined marine mammal stocks is required under the Marine Mammal Protection Act (MMPA), >70% of these stocks lack trend information needed to detect declines (Roman et al., 2013). In North America as a whole, the United States MMPA and Canada’s Species at Risk Act encourage the equitable monitoring of stocks to prevent declines (Mooers et al., 2007) but, in practice, funding is typically focused on endangered taxa. Species listed as threatened under these country’s legislation are of higher priority when collecting crucial data on threat impacts (e.g., full necropsies to identify cause of death; Williams et al., 2008; Reynolds et al., 2009). Pelagic dolphin populations tend not to be listed under national endangered species legislation and there is thus little incentive to study the population-level impacts of human activities (e.g., fishing, offshore oil and gas development, and military sonar exercises; Booth et al., 2020) on these populations (e.g., Carretta et al., 2015).
A consequence of the high abundance and large group size of most pelagic dolphin species is that many individuals may be affected if the population is exposed to an anthropogenic threat. For example, large numbers of oceanic dolphins may be exposed to fisheries bycatch in waters beyond national jurisdiction or to high-amplitude noise from seismic surveys or military sonar throughout the world’s oceans (Jepson et al., 2003; Weilgart, 2007; Gerrodette, 2009). Patchy distribution and large variation in group size leads to high sampling variability that increases the variance on any abundance estimate of pelagic dolphins (Hammond et al., 2013) and decreases the power to detect trends. Even in the best-surveyed United States waters, for example, there is low statistical power to detect “precipitous” declines (i.e., a 50% or greater decline over a 15-year period) in oceanic stocks (Taylor et al., 2007b; Kaschner et al., 2012). Lack of data on threat exposure or population decline can lead to a species (or other unit to conserve) remaining in a low concern or data-deficient category; such species are unlikely to be prioritized for conservation assessment (Gaston and Fuller, 2008; Martín-López et al., 2011). We call this problem the “data-gap trap.”
In data-poor contexts, a model-testing approach may be useful to identify which species or populations and threats to them warrant further research. For example, model testing has been used to predict cumulative threat impacts in ecosystems (Côté et al., 2016), assess which population parameters are more sensitive to threats in marine populations, and anticipate marine ecosystem responses to policy and management scenarios (Bland et al., 2015). Model testing and scenario analysis are also becoming crucial underpinnings of global conservation policy and management (Sutherland et al., 2011).
Here, we explore the population dynamics of four species or sub-species of oceanic dolphin off the west coast of the United States: eastern North Pacific long-beaked common dolphin (LBCD, Delphinus delphis capensis), short-beaked common dolphin (SBCD, D. delphis delphis), Pacific white-sided dolphin (PWSD, Lagenorhynchus obliquidens), and “offshore” common bottlenose dolphin (OBND, Tursiops truncatus). We note that the taxonomic resolution of some of these species is in flux and that population definitions are not well understood (e.g., McGowen et al., 2009, 2020; Perrin et al., 2011; Vollmer et al., 2019). In particular, there is ongoing debate about whether long- and short-beaked common dolphins represent different populations, ecotypes, subspecies or species (Cunha et al., 2015). Here we consider them as different “units to conserve” and throughout this paper refer to each as a population (Taylor et al., 2010).
We model how these populations are likely to respond to changes in three sublethal threats (prey limitation, ocean noise, and chemical pollution) and one lethal threat (fisheries bycatch). Within our data-poor context, we rely on inter-specific variation in life-history traits and known threat impacts (i.e., variability in prey density, effects of ocean noise on foraging efficiency, and effects of contaminants on probability of calf survival) to calibrate population viability analyses (PVA). Specifically, our PVA approach provides an opportunity to review, collate, and integrate existing life-history and threat information into a demographic framework. We highlight how a model-testing approach can help predict the cumulative impacts of different stressors and identify which species and/or threats warrant further monitoring to fill data gaps. Given the lack of data, we do not use our PVA to estimate minimum viable population size or to estimate the probability of extinction, which are known challenges with even the most robust PVA (Ruggiero et al., 1994; Reed et al., 2002; Chaudhary and Oli, 2020). Rather, our study constitutes a first step toward finding solutions to the data-gap trap for small cetaceans (i.e., whales, dolphins, and porpoises), a taxonomic group plagued by data uncertainty worldwide.
Materials and Methods
Case Studies
A PVA can be used to model population growth rate and to simulate the probability of extinction of populations in a range of conservation contexts (Lacy, 2000; Coulson et al., 2001). The four dolphin populations identified above were selected as case studies based on a number of characteristics: their large population sizes (Barlow and Forney, 2007), the availability of basic data on both life history (Taylor et al., 2007a) and fisheries-related mortality (Carretta et al., 2015), and the typically low statistical power to detect population trends (Taylor et al., 2007b).
For each population, a population model was constructed in Vortex v. 10 (Lacy and Pollak, 2015) using the best information available on demography and threat impacts. Vortex is an individual-based simulation that steps through the demographic events that can occur each year (reproduction, sex determination of newborns, annual survival of each age class, immigration and emigration, harvest of individuals, truncation of population size if it exceeds carrying capacity) and then generates the population trajectory as the aggregate of the fates of the individuals. Occurrences of demographic events for each individual are simulated as binomial sampling processes from the specified demographic rates (as probabilities), with those probabilities being age and sex specific, subject to variation over time (environmental variation), and optionally influenced by individual variability in genetics or other properties. The structure of the Vortex model is described in Lacy (2000). The Vortex software and a full manual are freely available at http://scti.tools/vortex.
The absence of empirical data for some species required us to draw on other cetacean species or populations from other locations. To parameterize the PVA, the default values used in IUCN assessments (Taylor et al., 2007a) were used as inputs (Table 1) as empirical demographic estimates were lacking for all four populations. In order to speed up processing time of the individual-based models run in Vortex, all four populations were set to the same initial population size (1,000 individuals) to explore mean trajectories. Our primary objective was to assess the relative influences of different factors on population growth rates, not absolute effects on population sizes. In addition, our aim was not to model pristine populations in the absence of anthropogenic threats, but rather to explore realistic demographic rates and levels of threats under different management scenarios (Bland et al., 2015; Rowland et al., 2020). Therefore, a “baseline” model was first developed to represent the trajectories of the four populations if demographic rates remained at current levels for each, with bycatch set at current levels and assuming no additional threats.
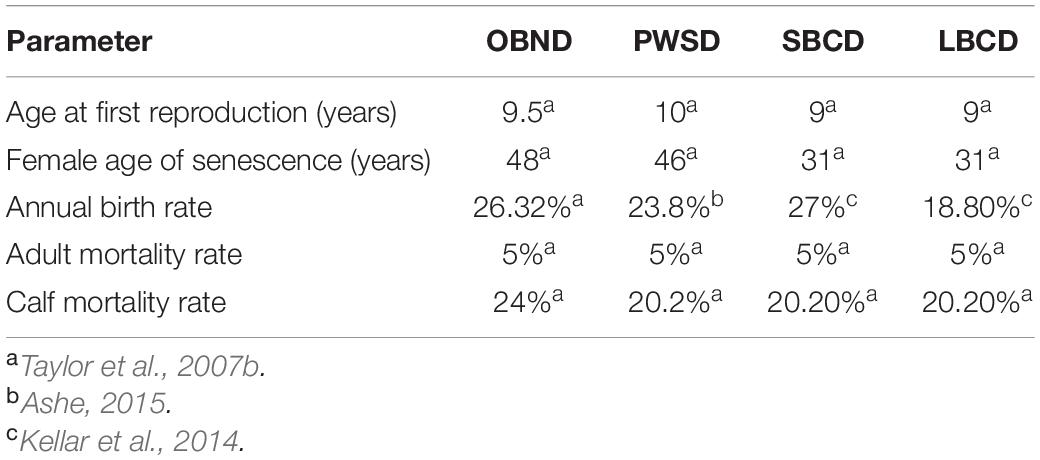
Table 1. Parameter inputs for the baseline population viability analyses (PVA) for the following: Common Bottlenose Dolphins CA-WA-OR Offshore Stock (OBND); Pacific Shite-Sided Dolphins CA-OR-WA Northern and Southern Stocks (PWSD); Short-Beaked Common Dolphins CA-OR-WA stock (SBCD); and Long-Beaked Common Dolphins CA Stock (LBCD).
We ran 10,000 iterations of the population model where threat levels were varied by sampling from a uniform distribution across the plausible ranges described below (Table 2). The cumulative effect of all threats was not modeled; given the necessarily indirect estimates of model parameters, a full exploration of interactions among threats (i.e., their cumulative effects) would not be warranted. Unless otherwise noted, all information was taken from the U.S. Pacific Marine Mammal Stock Assessment: 2014 (Carretta et al., 2015). The Vortex input file with all scenarios examined in this study is available in the zenodo.org repository at http://doi.org/10.5281/zenodo.4292353.
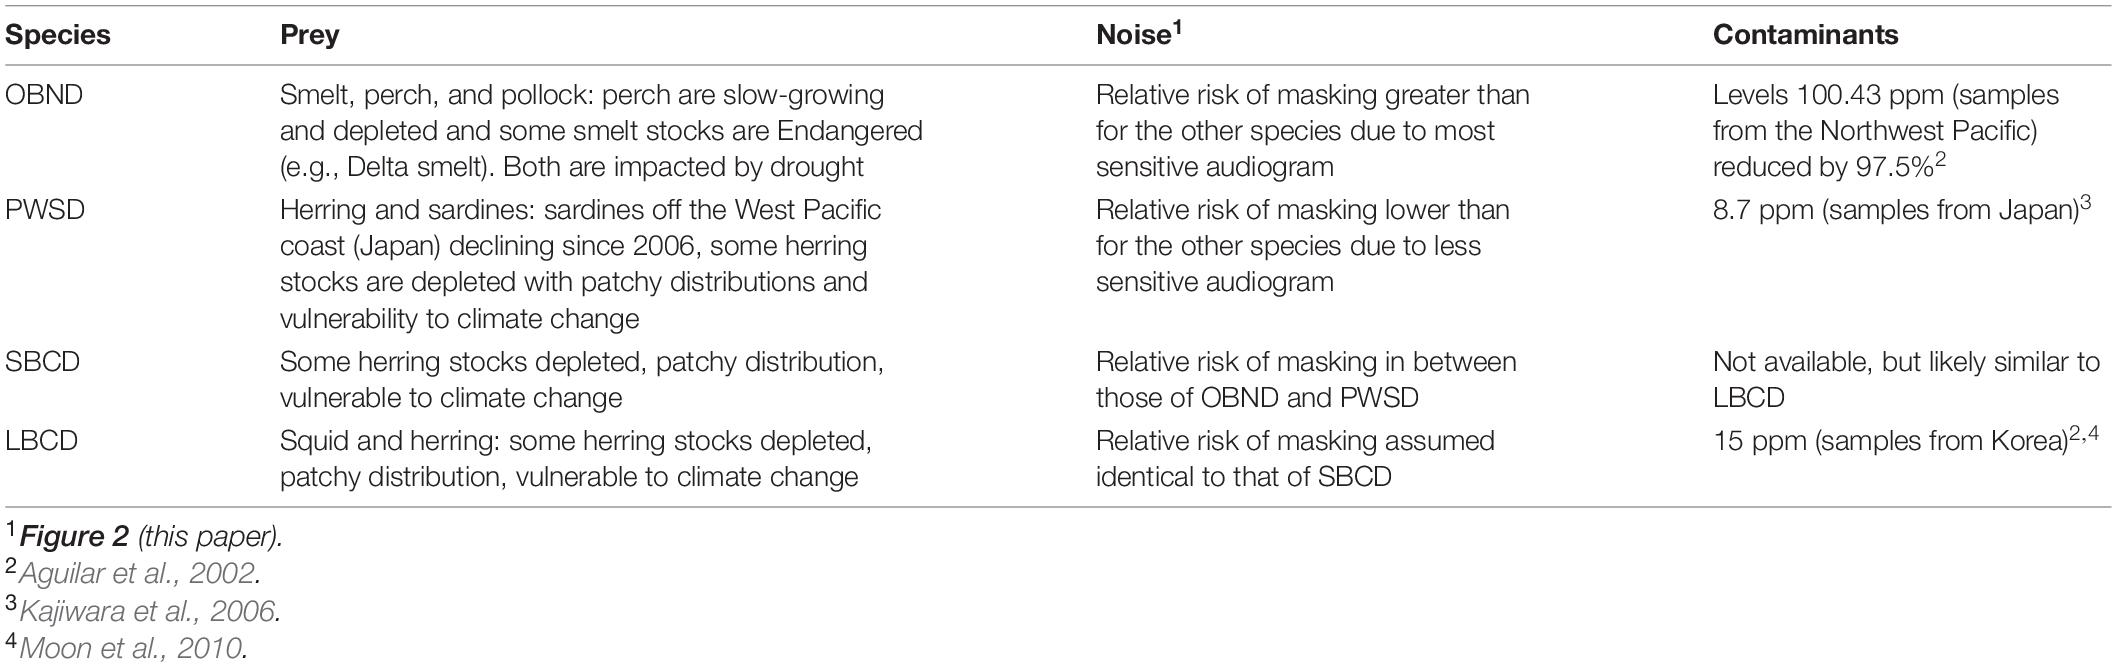
Table 2. Review of the impacts of three threats on four oceanic dolphin populations off the Pacific Coast of the United States: Pacific offshore bottlenose dolphins (OBND), white-sided dolphins (PWSD), short-beaked common dolphins (SBCD), and long-beaked common dolphins (LBCD).
Prey Availability
Currently, no quantitative relationships have been published between prey variability and the demography of the study populations. The demographic consequences of interannual variability in prey abundance have been studied in other cetaceans (e.g., St. Lawrence beluga whales, Delphinapterus leucas; Mosnier et al., 2015; and “southern resident” killer whales, Orcinus orca; Ward et al., 2009; Ford et al., 2010; Williams et al., 2016). Although belugas are more distantly related to our oceanic dolphins than are killer whales (McGowen et al., 2009), prey base-demography relationships for belugas were used because the killer whale studies focused on a population with extreme dietary specialization, whereas oceanic dolphins and belugas are generalist predators.
To quantify the prey base-demography relationship, we fitted a logistic regression of beluga calf mortality to an index of spring-season herring biomass ranging from 0 to 1 with a “middle of the road” baseline scenario of 0.5 (Mosnier et al., 2015). To derive a multiplier of the baseline survival factor, the survival rate provided by the logistic regression (survival = ; standard error (SE) of the slope = 0.5538) was divided by the survival predicted for the baseline index (survival = 0.758 at prey index = 0.5). This allowed us to infer survival for different levels of prey availability for each population. The regression was not forced through the origin, so the model does not predict zero probability of survival when prey availability is zero. The model structure assumes that generalist predators such as dolphins would switch to an alternative prey species when the preferred prey species is unavailable.
Ocean Noise
Effects of ocean noise on dolphin demography were modeled as a reduction in prey availability caused by the acoustic masking of dolphin echolocation and communication signals and/or behavioral disturbance. The relative risks of acoustic disturbance (including masking) for our species were computed as the integral (over frequency) of the 95th percentile of ship noise (reported by Veirs et al., 2016), minus the species-specific audiogram (Figure 3A in Erbe et al., 2016), plus the critical ratio (Figure 4A in Erbe et al., 2016).
Noise impacted calf mortality through the prey-demography relationship described above. Noise effects were also modeled as an index ranging from 0.5 to 2.0 (with a baseline of 1.0) as a multiplier of foraging efficiency. We tested the effects of rising noise levels (i.e., noise levels in the North Pacific are thought to be increasing by 2.5–3.0 dB every decade; McDonald et al., 2006). The upper end of the multiplier was derived from the Okeanos global pledge to reduce the contribution of shipping to global ocean noise levels by 50% in a decade (Williams et al., 2014).
Contaminants
In the absence of information on the relationship between oceanic dolphin demography and tissue concentrations of polychlorinated biphenyls (PCBs), we used a relationship for marine mammals based on annual accumulation rates and calf mortality (Hall et al., 2006, 2018). We followed Hall’s (2006) model where calves, during gestation and lactation, acquire a PCB level of 77% of the maternal level (the mother depurates this amount and reduces her own PCB load). We assumed that when a calf dies in its first year of life, the reduction in PCBs in the mother is half this amount (Hall et al., 2006). Following the first year of life, PCBs are assumed to accumulate in tissues at a constant rate, except for the depuration that occurs when a female produces and nurtures a calf.
Few data are available on mean levels of PCBs in oceanic dolphins, so we modeled the effects of annual PCB accumulation ranging from optimistic to pessimistic scenarios (0.0–5.0 μg/g/y), resulting in predictions spanning previously reported values. With this model of accumulation and depuration applied in individual-based simulations, accumulation rates of 5.0 μg/g/y resulted in mean levels of ∼115.0 μg/g in adult males and 45.0 μg/g in adult females, with an approximately linear relationship between accumulation rate and mean levels in the population.
We applied the logistic regression derived by Hall et al., 2006, calf mortality = ; SE of the slope = 0.008; SE of the intercept = 0.368; PCB measured in maternal blubber as μg/g). This relationship predicts 19.1% calf mortality when PCB levels are zero, slightly less than the 20.2% mortality estimated for PWSD, SBCD, and LBCD (Table 1; Taylor et al., 2007a). The mortality rate of 20.2% was projected from the PCB response relationship using mean PCBs in maternal blubber at 2.0 μg/g. For modeling PCB impacts in OBND, we adjusted the intercept of the logistic regression to 1.215 so that a low PCB level of 2.0 μg/g would result in the observed baseline calf mortality rate of 24% (Table 1).
Bycatch Mortality
Bycatch was assessed using the estimates of entanglement in fishing gear from the NOAA Stock Assessment Reports for each population available at the time of the study (Carretta et al., 2015). Population-specific information on bycatch mortality was rescaled to predict the expected bycatch mortality rate in an initial population size of 1,000 individuals in each population. Bycatch was treated as the annual removal of 11.8 individuals from a population of 26,930 PWSD; 2.0 removals from 1,006 OBND; 64.0 removals from 411,211 SBCD; and 13.0 removals from 107,016 LBCD (Carretta et al., 2015). To test plausible alternative levels, bycatch was varied from zero to five times the estimated level. This plausible range captured variation expected from mitigation strategies at one end to low carcass detection rates or underestimation of bycatch mortality in poorly monitored fisheries at the other end (Williams et al., 2011).
Results
All four populations were projected to have low intrinsic rates of population growth (r), which result from a long period of gestation and lactation. Our baseline models indicate that all four populations may have low (or negative) growth rates under current levels of bycatch and contaminants. The point estimates of mean Population Growth Rate (r) across the 100-year simulations in the absence of bycatch were: LBCD, r = −0.021; PWSD, r = 0.001; SBCD, r = −0.001; and OBND, r = 0.005. The more optimistic predictions for OBND populations are driven, in part, by an expectation of a long reproductive lifespan that offsets higher calf mortality (Table 1). Given reported levels of bycatch along the west coast of the United States, the mean rate of increase for OBND drops to r = 0.003. For the other three populations, the estimated bycatch is so low that r is reduced by <0.001.
All four populations were predicted to be highly sensitive to reductions in prey, causing a ∼2% decline in population growth rate at the highest levels of prey reduction (Figure 1). The ranking of populations in terms of sensitivity to prey limitation mirrors the ranking of populations in terms of population growth rate: LBCD are expected to be most vulnerable to prey limitation and OBND (with the highest growth rate) least vulnerable (Figure 1). Even the most optimistic scenarios failed to predict an increasing population for LBCD (Figure 1).
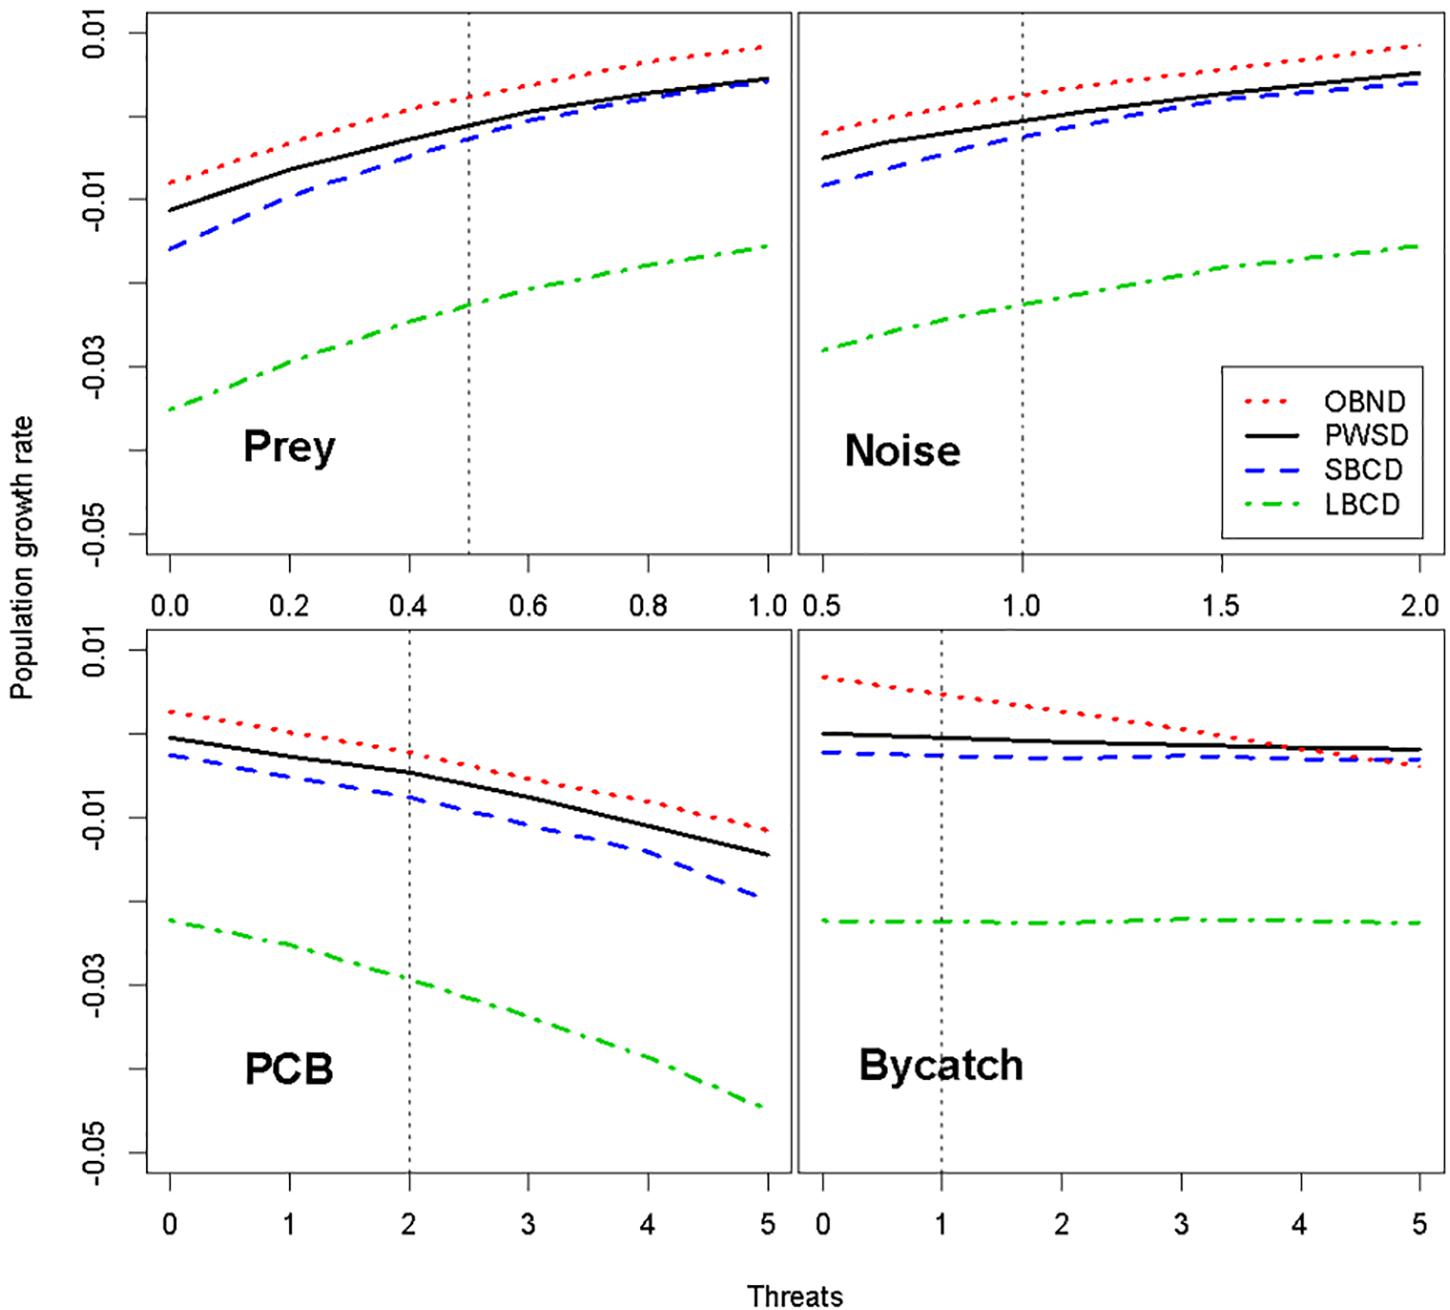
Figure 1. Predicted impacts of prey reduction, reduced foraging efficiency due to underwater noise, elevated contaminant levels, and bycatch from fisheries on four oceanic dolphin populations. The effects of noise on population growth rate were modeled as a reduction in prey availability caused by the acoustic masking of dolphin echolocation and communication signals and/or behavioral disturbance. The relative mean population growth rate projected under each threat (index on x-axis) is shown with the remaining threats held at baseline levels. See section “Materials and Methods” for further definitions of threats, threat indices, and baseline levels. OBND, Pacific offshore bottlenose dolphins; PWSD, white-sided dolphins; SBCD, short-beaked common dolphins; and LBCD, long-beaked common dolphins; PCBs, polychlorinated biphenyls.
Because the effects of noise on population growth rate were modeled as modifying the prey-demography link, the structure of the model is such that noise amplifies the effects of prey limitation on dolphin population growth rate (Figure 1). As a result, the ranking of populations from most to least likely to show a population-level consequence of noise (OBND > SBCD > PWSD) is the same as for prey limitation. Recall that noise and disturbance in Figure 1 refers to the relative rate of foraging efficiency under the various noise scenarios (e.g., a value of 2 corresponds to a doubling of foraging efficiency, whereas a value of 0.5 corresponds to a halving of foraging efficiency over the baseline reference point). Masking (Figure 2) offers a different perspective on the sensitivity of the four dolphins to chronic ocean noise from ships and other human activities. Given no additional information, we predict that OBND should be most sensitive to noise over a broad range of frequencies, and PWSD least sensitive (Figure 2).
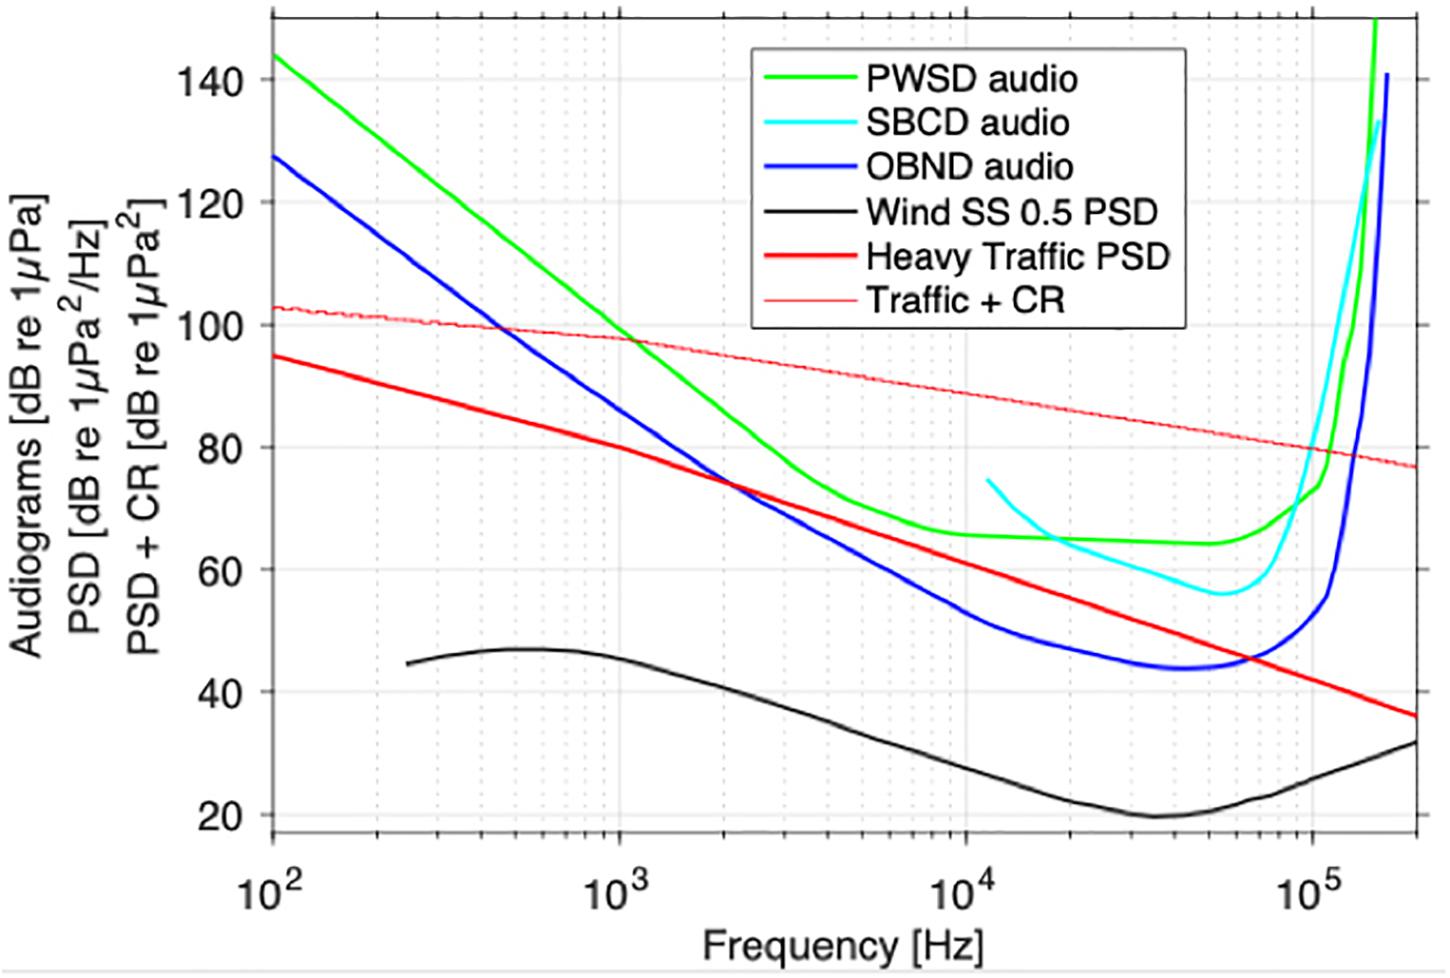
Figure 2. Oceanic dolphin audiograms [blue and green curves (dB re 1 μPa) (Erbe et al., 2016) and noise spectra (power spectral density, PSD; thick black and red curves (dB re 1 μPa2/Hz)] in their environment. Wind-driven noise in calm sea states (SS < 0.5; Wenz, 1962) has little acoustic disturbance and masking risk, because it is mostly more than one critical ratio (CR ∼20–40 dB, increasing with frequency) below the audiograms. The thin red line represents ship noise PSD + CR. It indicates the minimum level a narrowband signal must have for it to be detectable above the ship noise. The risk of acoustic disturbance and masking is estimated as the area between the thin red line and the audiograms. This area is greatest for OBND (87 dB re 1 Hz), then SBCD (72 dB re 1 Hz), and finally PWSD (68 dB re 1 Hz). Information on low-frequency hearing abilities of SBCD (aqua line) is incomplete, so the audiogram was extrapolated to 86 dB re 1 μPa at 7.7 kHz.
If impacts of PCBs on oceanic dolphins are similar to those reported for coastal cetaceans (Hall et al., 2018), plausible levels of PCBs are predicted to cause population declines in all four oceanic dolphin populations by increasing calf mortality rates (Figure 1). The predicted impact of PCBs on population growth rate appears to be greatest in LBCD and smallest in OBND (Figure 1). The highest level of PCB accumulation resulted in population declines in all four populations. The bycatch mortality rates tested were low and had negligible impacts on the growth rates of PWSD, SBCD, and LBCD, while having a small impact on OBND.
The proportion of variance in population growth accounted for by each of the four threats across the ranges tested is given in Table 3.
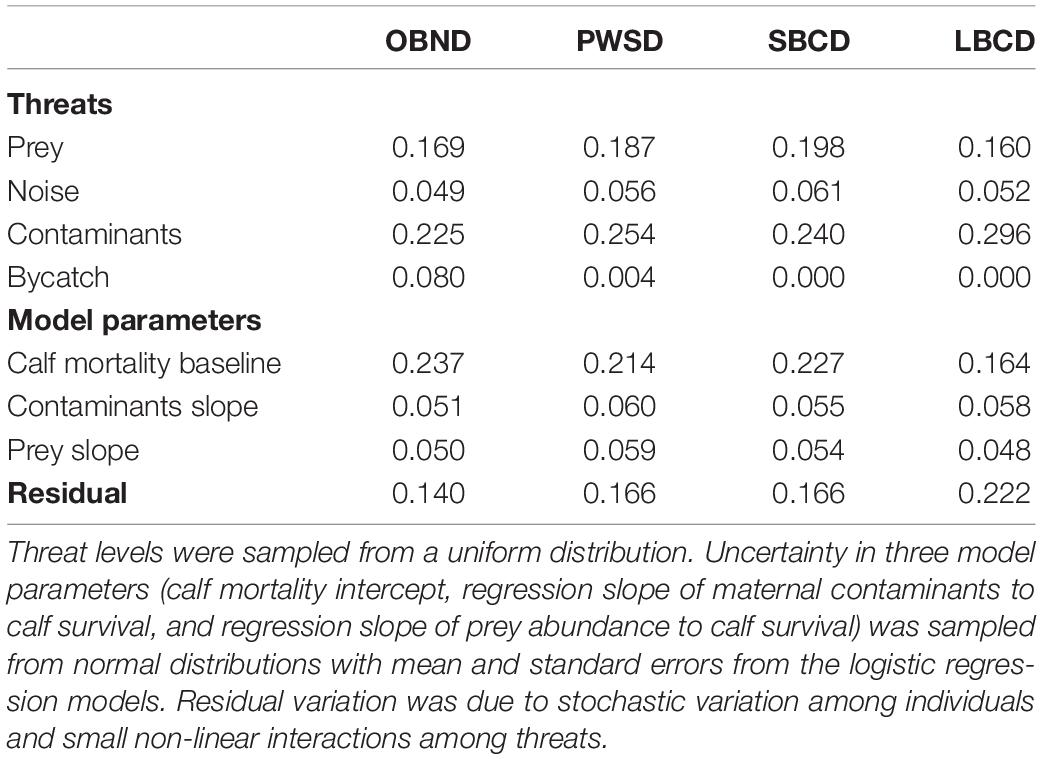
Table 3. Proportion of variance in population growth explained by each threat for four oceanic dolphin species: Pacific offshore bottlenose dolphins (OBND), white-sided dolphins (PWSD), short-beaked common dolphins (SBCD), and long-beaked common dolphins (LBCD).
Discussion
Prioritizing which species to monitor and focus conservation resources on is now a cornerstone of conservation biology, a process known as conservation “triage” (Bottrill et al., 2008). Unfortunately, this may result in funding only being awarded under times of crisis or to species with dire conservation status (Restani and Marzluff, 2002; Kareiva and Marvier, 2003; Joseph et al., 2009). Existing survey data off the west coast of the United States are expected to have low power (13–29%) to detect a 50% decline in 15 years (Taylor et al., 2007b). Given the low precision of many monitoring programs (Taylor et al., 2007b), we explored the value of PVA to model population declines under plausible scenarios of threat.
Conservation science involves making difficult decisions in the absence of perfect knowledge (Taylor and Gerrodette, 1993). There is a great deal of uncertainty in each of our predictions, in part because they rely on life-history tables of bycaught animals and information derived from population models and threat responses of other cetacean species. Because our models rely on placeholder data, our results should be interpreted as plausible, model-tested ranges and alternatives. However, our models can provide insights into how threats may impact each of the four dolphin populations and highlight where accurate population-level data are most needed.
Of most concern, our models project that declines of >20% per decade could be occurring under current threat levels, while the power to detect those declines using existing survey data is near zero (Taylor et al., 2007b). SBCDs showed relatively stable population growth rates (r = −0.001) under baseline conditions and an ability to withstand low levels of all three sub-lethal stressors (Figure 1). SBCDs and PWSDs were the only populations whose growth rates spanned 0 for all three threats. In other words, across the range of threat values we considered, each threat has the potential to tip a stable population into decline. Conversely, mitigating any threat has the potential to cause the stabilization or recovery of a declining population. In the absence of accurate monitoring and threat-response data, these results provide some hints as to how alternative management responses could aid the conservation status of these populations.
Reported levels of bycatch were found to be negligible for all four populations (Table 3 and Figure 1). However, this would not be the case in regions where high bycatch mortality was occurring in unmonitored fisheries (e.g., in international waters or in countries with insufficient resources to conduct adequate bycatch monitoring). As noted above, we did not pursue a cumulative effects model, because a fully factorial analysis of interactions among threats would stretch the modeling too far for the data. If we assumed that the cumulative effects were additive, for all four populations, the cumulative effects of the three sublethal threats tested (prey limitation, ocean noise, and chemical pollution) would easily exceed the effects of the lethal threat (bycatch).
From our simulation study, we tentatively conclude that LBCD are least resilient and OBND most resilient to prey limitation (Figure 1), an important insight for management. Given the large overlap in diet among all four focal populations in the California Current (Bearzi, 2005), understanding the status of the main prey species is paramount. This exercise has become more tractable in recent years with the release of the RAM (Ransom A. Meyers) Legacy Database, which includes time series of fish stock assessments (Ricard et al., 2012; Melnychuk et al., 2017). Correlating interannual variability in prey abundance with demographic parameters of the four dolphin populations may prove useful (as it has been for killer whales and belugas; Ford et al., 2010; Mosnier et al., 2015), possibly using archived time-series data on the reproductive status of bycaught animals. Similarly, prey-demography links could be derived from comparisons of pregnancy rates of bycaught animals in years with high and low prey abundance (e.g., Williams et al., 2013).
We conclude that vessel noise and disturbance could be important factors to consider in any conservation plan for the four dolphin populations. There is sufficient information to conclude, tentatively, that ocean noise can affect the trajectory of any of the four populations (Figure 1), with the loss of acoustic space greatest for OBNDs and smallest for SBCDs and LBCDs. Although noise may not be the biggest threat we considered, it may well be the most amenable to mitigation. Time-area closures, speed restrictions on large ships, and whale-watching regulations for small boats (Tyne et al., 2014) are all relatively easy ways to reduce noise levels in important feeding habitat of oceanic dolphins in areas like southern California, where the continental shelf is narrow. While it is straightforward to predict the physical effects of noise on the distance at which a dolphin communication signal can be heard, it is difficult to estimate the biological and demographic significance of noise, for example, its effect on social communication used to coordinate group activities or echolocation clicks used in foraging. We quantified sensitivity to ship noise by estimating the reduction in acoustic signal detection ranges between quiet ambient conditions (equivalent to sea state 0.5) and heavy traffic conditions based on species-specific audiograms and critical ratios. We also lacked data on behavioral responses of populations to noise as well as spatially explicit data on the distribution and abundance of dolphins relative to chronic ship noise levels (e.g., Erbe et al., 2014). Sensitivity to sound is based on audiograms alone and does not account for inter-specific variation in behavioral responses. Future analyses could use NOAA’s Cetacean and Sound field Mapping1 tools data and dedicated field experiments to explore inter-specific variability in vulnerability to ship noise.
There are insufficient reports of comparable and locally derived PCB levels to compare predicted population-level effects to empirical measurements of PCBs in oceanic dolphins in the northeast Pacific (Table 2). In the absence of data on age and sex, measurements are difficult to compare and impossible to convert to annual accumulation rates (Lebeuf et al., 2014). This points to a clear data gap when attempting to predict the effects of PCBs on oceanic dolphins. Our models all use the same underlying prediction of the population consequences of PCBs on calf mortality (Hall et al., 2018). Hall’s model is pioneering because few field studies have attempted to translate tissue concentrations to demographic effects. However, many other persistent organic pollutants affect cetaceans, so our analyses may underestimate the total impact of pollutants on dolphin populations. Substantial foundational work would be needed to predict the population consequences of flame retardants and other persistent organic pollutants. For now, we can conclude that any contaminant could cause serious population-level effects in any of the four populations studied if concentrations were found to be at the high end of the range of values considered.
There is little power to detect precipitous declines in oceanic dolphin populations, even in the comparatively well-studied waters of the California Current (Taylor et al., 2007b). That will remain true for some time, but we now have a framework for predicting which populations are most likely to be declining given the best-available information on life-history traits and threats. For example, based on the available data on inter-specific differences in demography, we projected that common dolphins (Delphinus sp.) possess life-history traits that make them more likely to have lower intrinsic growth rates, even in the absence of anthropogenic threats, or are more sensitive to inter-annual variation in environmental conditions. Sensitivity tests (e.g., Caswell, 2001) indicate that changes in adult mortality could have large impacts on population growth; however, reproduction and infant survival are often influenced much more by environmental factors (Manlik et al., 2018). Furthermore, the life-history analyses project that both long-beaked and short-beaked common dolphins are more likely than offshore bottlenose dolphins to be sensitive to prey limitation, noise, and contaminants.
Our approach could inform a structured decision-making process (Martin et al., 2009) to draw on the collective wisdom of species- and subject-matter experts to assess the likelihood that any of these populations is exposed to threats that would cause declines large enough to trigger management action. Given the competition for conservation funding, we see value in using PVA as opportunities to review, collate, and integrate existing information into a testable demographic framework. This in turn can provide insights into which threats are likely to have the greatest single or cumulative impacts on populations, which populations are intrinsically more at risk due to their demographic parameters, and what data and studies are needed to further calibrate or validate a PVA. Our study provides the first step in such an iterative approach based on case studies of abundant cetaceans assumed not to be at risk (Lindenmayer et al., 2011). One way to avoid the data-gap trap is to at least periodically allocate funds to monitor all marine mammal populations irrespective of conservation status (Hammond et al., 2013) and to keep human-caused mortality rates sufficiently low that populations never become depleted below some agreed-upon level (Wade, 1998).
Data Availability Statement
The original contributions presented in the study are included in the article/supplementary material, further inquiries can be directed to the corresponding author/s.
Author Contributions
EA: study design, data analysis, and writing. RW and RL: study design, analysis, and writing. CC, CE, AH, PH, RR, and NV: study design and writing. All authors contributed to the article and approved the submitted version.
Funding
This work was supported by Save Our Coast, Sitka Foundation, and McLean Foundation.
Conflict of Interest
The authors declare that the research was conducted in the absence of any commercial or financial relationships that could be construed as a potential conflict of interest.
Footnotes
References
Aguilar, A., Borrell, A., and Reijnders, P. J. H. (2002). Geographical and temporal variation in levels of organochlorine contaminants in marine mammals. Mar. Environ. Res. 53, 425–452. doi: 10.1016/s0141-1136(01)00128-3
Ashe, E. (2015). Ecology of Pacific White-Sided Dolphins (Lagenorhynchus obliquidens) in the Coastal Waters of British Columbia, Canada. Doctoral dissertation, St Andrews, Scotland: University of St Andrews.
Barlow, J., and Forney, K. A. (2007). Abundance and population density of cetaceans in the California current ecosystem. Fish. Bull. 105, 509–526.
Bearzi, M. (2005). Habitat partitioning by three species of dolphins in Santa Monica Bay, California. Bull. South. Calif. Acad. Sci. 104, 113–124. doi: 10.3160/0038-3872(2005)104[113:hpbtso]2.0.co;2
Bland, L. M., Collen, B., Orme, C. D. L., and Bielby, J. (2015). Predicting the conservation status of data−deficient species. Conserv. Biol. 29, 250–259. doi: 10.1111/cobi.12372
Booth, C. G., Sinclair, R. R., and Harwood, J. (2020). Methods for monitoring for the population consequences of disturbance in marine mammals: a review. Front. Mar. Sci. 28:115. doi: 10.3389/fmars.2020.00115
Bottrill, M. C., Joseph, L. N., Carwardine, J., Bode, M., Cook, C., Game, E. T., et al. (2008). Is conservation triage just smart decision making? Trends Ecol. Evol. 23, 649–654. doi: 10.1016/j.tree.2008.07.007
Carretta, J. V., Oleson, E. M., Weller, D. W., Lang, A. R., Forney, K. A., Baker, J., et al. (2015). U.S. Pacific Marine Mammal Stock Assessments: 2014. U.S. Department of Commerce, NOAA Technical Memorandum NOAA-TM-NMFS-SWFSC-549.
Caswell, H. (2001). Matrix Population Models: Construction, Analysis, and Interpretation, 2nd edn, Sunderland, MA: Sinauer Associates.
Chaudhary, V., and Oli, M. K. (2020). A critical appraisal of population viability analysis. Conserv. Biol. 34, 26–40. doi: 10.1111/cobi.13414
Côté, I. M., Darling, E. S., and Brown, C. J. (2016). Interactions among ecosystem stressors and their importance in conservation. Proc. R. Soc. B Biol. Sci. 283:20152592. doi: 10.1098/rspb.2015.2592
Coulson, T., Mace, G. M., Hudson, E., and Possingham, H. (2001). The use and abuse of population viability analysis. Trends Ecol. Evol. 16, 219–221. doi: 10.1016/s0169-5347(01)02137-1
Cunha, H. A., de Castro, R. L., Secchi, E. R., Crespo, E. A., Lailson-Brito, J., Azevedo, A. F., et al. (2015). Molecular and morphological differentiation of common dolphins (Delphinus sp.) in the Southwestern Atlantic: testing the two species hypothesis in sympatry. PLoS One 10:e0140251. doi: 10.1371/journal.pone.0140251
Ellsworth, J. W., and McComb, B. C. (2003). Potential effects of passenger pigeon flocks on the structure and composition of presettlement forests of eastern North America. Conserv. Biol. 17, 1548–1558. doi: 10.1111/j.1523-1739.2003.00230.x
Erbe, C., Reichmuth, C., Cunningham, K., Lucke, K., and Dooling, R. (2016). Communication masking in marine mammals: a review and research strategy. Mar. Pollut. Bull. 103, 15–38. doi: 10.1016/j.marpolbul.2015.12.007
Erbe, C., Williams, R., Sandilands, D., and Ashe, E. (2014). Identifying modeled ship noise hotspots for marine mammals of Canada’s Pacific region. PLoS One 9:e89820. doi: 10.1371/journal.pone.0089820
Ford, J. K. B., Ellis, G. M., Olesiuk, P. F., and Balcomb, K. C. (2010). Linking killer whale survival and prey abundance: food limitation in the oceans’ apex predator? Biol. Lett. 6, 139–142. doi: 10.1098/rsbl.2009.0468
Gaston, K. J., and Fuller, R. A. (2008). Commonness, population depletion and conservation biology. Trends Ecol. Evol. 23, 14–19. doi: 10.1016/j.tree.2007.11.001
Gerrodette, T. (2009). “The tuna-dolphin issue A2,” in Encyclopedia of Marine Mammals, 2nd Edn, eds W. F. Perrin, B. Würsig, and J. G. M. Thewissen (London: Academic Press), 1192–1195. doi: 10.1016/b978-0-12-373553-9.00272-8
Hall, A. J., McConnell, B. J., Rowles, T. K., Aguilar, A., Borrell, A., Schwacke, L., et al. (2006). Individual-based model framework to assess population consequences of polychlorinated biphenyl exposure in Bottlenose dolphins. Environ. Health Perspect. 114, 60–64. doi: 10.1289/ehp.8053
Hall, A. J., McConnell, B. J., Schwacke, L. H., Ylitalo, G. M., Williams, R., and Rowles, T. K. (2018). Predicting the effects of polychlorinated biphenyls on cetacean populations through impacts on immunity and calf survival. Environ. Pollut. 233, 407–418. doi: 10.1016/j.envpol.2017.10.074
Hammond, P. S., Macleod, K., Berggren, P., Borchers, D. L., Burt, L., Cañadas, A., et al. (2013). Cetacean abundance and distribution in European Atlantic shelf waters to inform conservation and management. Biol. Conserv. 164, 107–122. doi: 10.1016/j.biocon.2013.04.010
Jackson, J. B., Kirby, M. X., Berger, W. H., Bjorndal, K. A., Botsford, L. W., Bourque, B. J., et al. (2001). Historical overfishing and the recent collapse of coastal ecosystems. Science 293, 629–637. doi: 10.1126/science.1059199
Jepson, P. D., Arbelo, M., Deaville, R., Patterson, I. A., Castro, P., Baker, J. R., et al. (2003). Gas-bubble lesions in stranded cetaceans. Nature 425, 575–576. doi: 10.1038/425575a
Joseph, L. N., Maloney, R. F., and Possingham, H. P. (2009). Optimal allocation of resources among threatened species: a project prioritization protocol. Conserv. Biol. 23, 328–338. doi: 10.1111/j.1523-1739.2008.01124.x
Kajiwara, N., Kamikawa, S., Ramu, K., Ueno, D., Yamada, T. K., Subramanian, A., et al. (2006). Geographical distribution of polybrominated diphenyl ethers (PBDEs) and organochlorines in small cetaceans from Asian waters. Chemosphere 64, 287–295. doi: 10.1016/j.chemosphere.2005.12.013
Kareiva, P., and Marvier, M. (2003). Conserving biodiversity coldspots: recent calls to direct conservation funding to the world’s biodiversity hotspots may be bad investment advice. Am. Sci. 91, 344–351. doi: 10.1511/2003.4.344
Kaschner, K., Quick, N. J., Jewell, R., Williams, R., and Harris, C. M. (2012). Global coverage of cetacean line-transect surveys: status quo, data gaps and future challenges. PLoS One 7:e44075. doi: 10.1371/journal.pone.0044075
Kellar, N. M., Trego, M. L., Chivers, S. J., Archer, F. I., and Perryman, W. L. (2014). From progesterone in biopsies to estimates of pregnancy rates: large scale reproductive patterns of two sympatric species of common dolphin, Delphinus spp. off California, USA and Baja, Mexico. Bull. South. Calif. Acad. Sci. 113, 58–80. doi: 10.3160/0038-3872-113.2.58
Lacy, R. C. (2000). Structure of the VORTEX simulation model for population viability analysis. Ecol. Bull. 48, 191–203.
Lacy, R. C., and Pollak, J. P. (2015). Vortex: A Stochastic Simulation of the Extinction Process. Version 10.0. Brookfield, IL: Chicago Zoological Society, Brookfield Zoological Society.
Lebeuf, M., Noël, M., Raach, M., and Trottier, S. (2014). A twenty-one year temporal trend of persistent organic pollutants in St. Lawrence Estuary beluga, Canada. Sci. Total Environ. 485, 377–386. doi: 10.1016/j.scitotenv.2014.03.097
Lindenmayer, D. B., Wood, J. T., McBurney, L., MacGregor, C., Youngentob, K., and Banks, S. C. (2011). How to make a common species rare: a case against conservation complacency. Biol. Conserv. 144, 1663–1672. doi: 10.1016/j.biocon.2011.02.022
Manlik, O., Lacy, R. C., and Sherwin, W. B. (2018). Applicability and limitations of sensitivity analyses for wildlife management. J. Appl. Ecol. 55, 1430–1440. doi: 10.1111/1365-2664.13044
Martin, J., Runge, M. C., Nichols, J. D., Lubow, B. C., and Kendall, W. L. (2009). Structured decision making as a conceptual framework to identify thresholds for conservation and management. Ecol. Appl. 19, 1079–1090. doi: 10.1890/08-0255.1
Martín-López, B., González, J. A., and Montes, C. (2011). The pitfall-trap of species conservation priority setting. Biodivers. Conserv. 20, 663–682. doi: 10.1007/s10531-010-9973-z
McDonald, M. A., Hildebrand, J. A., and Wiggins, S. M. (2006). Increases in deep ocean ambient noise in the Northeast Pacific west of San Nicolas Island, California. J. Acoust. Soc. Am. 120, 711–718. doi: 10.1121/1.2216565
McGowen, M. R., Spaulding, M., and Gatesy, J. (2009). Divergence date estimation and a comprehensive molecular tree of extant cetaceans. Mol. Phylogenet. Evol. 53, 891–906. doi: 10.1016/j.ympev.2009.08.018
McGowen, M. R., Tsagkogeorga, G., Álvarez-Carretero, S., dos Reis, M., Struebig, M., Deaville, R., et al. (2020). Phylogenomic resolution of the cetacean tree of life using target sequence capture. Syst. Biol. 69, 479–501. doi: 10.1093/sysbio/syz068
Melnychuk, M. C., Peterson, E., Elliott, M., and Hilborn, R. (2017). Fisheries management impacts on target species status. Proc. Natl. Acad. Sci. U.S.A. 114, 178–183. doi: 10.1073/pnas.1609915114
Mooers, A., Prugh, L., Festa-Bianchet, M., and Hutchings, J. (2007). Biases in legal listing under Canadian endangered species legislation. Conserv. Biol. 21, 572–575. doi: 10.1111/j.1523-1739.2007.00689.x
Moon, H.-B., Kannan, K., Choi, M., Yu, J., Choi, H.-G., An, Y.-R., et al. (2010). Chlorinated and brominated contaminants including PCBs and PBDEs in minke whales and common dolphins from Korean coastal waters. J. Hazard. Mater. 179, 735–741. doi: 10.1016/j.jhazmat.2010.03.063
Mosnier, A., Doniol-Valcroze, T., Gosselin, J. F., Lesage, V., Measures, L. N., and Hammill, M. O. (2015). Insights into processes of population decline using an integrated population model: The case of the St. Lawrence Estuary beluga (Delphinapterus leucas). Ecol. Model. 314, 15–31. doi: 10.1016/j.ecolmodel.2015.07.006
Perrin, W. F., Thieleking, J. L., Walker, W. A., Archer, F. I., and Robertson, K. M. (2011). Common bottlenose dolphins (Tursiops truncatus) in California waters: cranial differentiation of coastal and offshore ecotypes. Mar. Mammal Sci. 27, 769–792. doi: 10.1111/j.1748-7692.2010.00442.x
Reed, J. M., Mills, L. S., Dunning, J. B. Jr., Menges, E. S., McKelvey, K. S., Frye, R., et al. (2002). Emerging issues in population viability analysis. Conserv. Biol. 16, 7–19.
Restani, M., and Marzluff, J. M. (2002). Funding extinction? Biological needs and political realities in the allocation of resources to endangered species recovery: an existing priority system, which should guide the fish and wildlife service in endangered species recovery, is ineffective, and current spending patterns decrease long-term viability of island species. Bioscience 52, 169–177. doi: 10.1641/0006-3568(2002)052[0169:febnap]2.0.co;2
Reynolds, J. E. III, Marsh, H., and Ragen, T. J. (2009). Marine mammal conservation. Endanger. Species Res. 7, 23–28.
Ricard, D., Minto, C., Jensen, O. P., and Baum, J. K. (2012). Examining the knowledge base and status of commercially exploited marine species with the RAM legacy stock assessment database. Fish Fish. 13, 380–398. doi: 10.1111/j.1467-2979.2011.00435.x
Roman, J., Altman, I., Dunphy-Daly, M. M., Campbell, C., Jasny, M., and Read, A. J. (2013). The marine mammal protection act at 40: status, recovery, and future of US marine mammals. Ann. N. Y. Acad. Sci. 1286, 29–49. doi: 10.1111/nyas.12040
Rowland, J. A., Lee, C. K., Bland, L. M., and Nicholson, E. (2020). Testing the performance of ecosystem indices for biodiversity monitoring. Ecol. Indic. 116:106453. doi: 10.1016/j.ecolind.2020.106453
Ruggiero, L. F., Hayward, G. D., and Squires, J. R. (1994). Viability analysis in biological evaluations: concepts of population viability analysis, biological population, and ecological scale. Conserv. Biol. 8, 364–372. doi: 10.1046/j.1523-1739.1994.08020364.x
Sekercioglu, C. H. (2006). Increasing awareness of avian ecological function. Trends Ecol. Evol. 21, 464–471. doi: 10.1016/j.tree.2006.05.007
Soulé, E. M. (1991). Conservation: tactics for a constant crisis. Science 253, 744–750. doi: 10.1126/science.253.5021.744
Sutherland, W. J., Fleishman, E., Mascia, M. B., Pretty, J., and Rudd, M. A. (2011). Methods for collaboratively identifying research priorities and emerging issues in science and policy. Methods Ecol. Evol. 2, 238–247. doi: 10.1111/j.2041-210x.2010.00083.x
Taylor, B. L., Chivers, S. J., Larese, J., and Perrin, W. F. (2007a). Generation Length and Percent Mature Estimates for IUCN Assessments of Cetaceans. Administrative Report LJ-07-01. La Jolla, CA: Southwest Fisheries Science Center, 24.
Taylor, B. L., and Gerrodette, T. (1993). The uses of statistical power in conservation biology: the vaquita and northern spotted owl. Conserv. Biol. 7, 489–500. doi: 10.1046/j.1523-1739.1993.07030489.x
Taylor, B. L., Martien, K., and Morin, P. (2010). “Identifying units to conserve using genetic data,” in Marine Mammal Ecology and Conservation—a Handbook of Techniques, eds J. E. Reynolds, W. F. Perrin, R. R. Reeves, S. Montgomery, and T. J. Ragen (Oxford: Oxford University Press), 306–344.
Taylor, B. L., Martinez, M., Gerrodette, T., Barlow, J., and Hrovat, Y. N. (2007b). Lessons from monitoring trends in abundance of marine mammals. Mar. Mammal Sci. 23, 157–175. doi: 10.1111/j.1748-7692.2006.00092.x
Tyne, J., Loneragan, N., and Bejder, L. (2014). “The use of area–time closures as a tool to manage cetacean-watch tourism,” in Whale-Watching: Sustainable Tourism and Ecological Management, eds J. Higham, L. Bejder, and R. Williams (New York, NY: Cambridge University Press), 242–260. doi: 10.1017/cbo9781139018166.020
Veirs, S., Veirs, V., and Wood, J. D. (2016). Ship noise in an urban estuary extends to frequencies used for echolocation by endangered killer whales. PeerJ 4:e1657. doi: 10.7717/peerj.1657
Vollmer, N. L., Ashe, E., Brownell, R. L. Jr., Cipriano, F., Mead, J. G., Reeves, R. R., et al. (2019). Taxonomic revision of the dolphin genus Lagenorhynchus. Mar. Mammal Sci. 35, 957–1057. doi: 10.1111/mms.12573
Wade, P. (1998). Caluclating limits to the allowable human-caused mortality of Cetaceans and Pinnipeds. Mar. Mammal Sci. 14, 1–37. doi: 10.1111/j.1748-7692.1998.tb00688.x
Ward, E. J., Holmes, E. E., and Balcomb, K. C. (2009). Quantifying the effects of prey abundance on killer whale reproduction. J. Appl. Ecol. 46, 632–640. doi: 10.1111/j.1365-2664.2009.01647.x
Weilgart, L. S. (2007). The impacts of anthropogenic ocean noise on cetaceans and implications for management. Can. J. Zool. 85, 1091–1116. doi: 10.1139/z07-101
Wenz, G. M. (1962). Acoustic ambient noise in the ocean: spectra and sources. J. Acoust. Soc. Am. 34, 1936–1956. doi: 10.1121/1.1909155
Williams, R., Gero, S., Bejder, L., Calambokidis, J., Kraus, S. D., Lusseau, D., et al. (2011). Underestimating the damage: interpreting cetacean carcass recoveries in the context of the deepwater horizon/BP incident. Conserv. Lett. 4, 228–233. doi: 10.1111/j.1755-263x.2011.00168.x
Williams, R., Grand, J., Hooker, S. K., Buckland, S. T., Reeves, R. R., Rojas−Bracho, L., et al. (2014). Prioritizing global marine mammal habitats using density maps in place of range maps. Ecography 37, 212–220. doi: 10.1111/j.1600-0587.2013.00479.x
Williams, R., Hall, A., and Winship, A. (2008). Potential limits to anthropogenic mortality of small cetaceans in coastal waters of British Columbia. Can. J. Fish. Aquat. Sci. 65, 1867–1878. doi: 10.1139/f08-098
Williams, R., Thomas, L., Ashe, E., Clark, C. W., and Hammond, P. S. (2016). Gauging allowable harm limits to cumulative, sub-lethal effects of human activities on wildlife: a case-study approach using two whale populations. Mar. Policy 70, 58–64. doi: 10.1016/j.marpol.2016.04.023
Keywords: data deficient, population viability analysis, management, cetacean, endangered, anthropogenic threats
Citation: Ashe E, Williams R, Clark C, Erbe C, Gerber LR, Hall AJ, Hammond PS, Lacy RC, Reeves R and Vollmer NL (2021) Minding the Data-Gap Trap: Exploring Dynamics of Abundant Dolphin Populations Under Uncertainty. Front. Mar. Sci. 8:606932. doi: 10.3389/fmars.2021.606932
Received: 16 September 2020; Accepted: 27 January 2021;
Published: 18 February 2021.
Edited by:
Karen A. Stockin, Massey University, New ZealandReviewed by:
Adriana Vella, University of Malta, MaltaPierre Pistorius, Nelson Mandela University, South Africa
Copyright © 2021 Ashe, Williams, Clark, Erbe, Gerber, Hall, Hammond, Lacy, Reeves and Vollmer. This is an open-access article distributed under the terms of the Creative Commons Attribution License (CC BY). The use, distribution or reproduction in other forums is permitted, provided the original author(s) and the copyright owner(s) are credited and that the original publication in this journal is cited, in accordance with accepted academic practice. No use, distribution or reproduction is permitted which does not comply with these terms.
*Correspondence: Erin Ashe, ea84@st-andrews.ac.uk