Equitable Allocations in Northern Fisheries: Bridging the Divide for Labrador Inuit
 Melina Kourantidou
 Porter Hoagland
 Aaron Dale3
  Megan Bailey
- 1Marine Policy Center, Woods Hole Oceanographic Institution, Woods Hole, MA, United States
- 2Dalhousie University Marine Affairs Program, Halifax, NS, Canada
- 3Torngat Secretariat, Happy Valley-Goose Bay, NL, Canada
Canada has undertaken commitments to recognize the rights of Indigenous Peoples in fisheries through policies and agreements, including Integrated Fishery Management Plans, the Reconciliation Strategy, and Land Claim Agreements (LCAs). In addition to recognizing rights, these commitments were intended to respect geographic adjacency principles, to enhance the economic viability of Indigenous communities, and to be reflective of community dependence on marine resources. We examined the determinants of quota allocations in commercial fisheries involving Nunatsiavut, Northern Labrador, the first self-governing region for the Inuit peoples in Canada. It has been argued that current fishery allocations for Nunatsiavut Inuit have not satisfied federal commitments to recognize Indigenous rights. Indicators that measure equity in commercial allocations for the turbot or Greenland halibut (Reinhardtius hippoglossoides) and northern shrimp (Pandalus borealis) fisheries were identified and assessed. In these two cases, historical allocations continue to predominate for allocations based upon equity or other social or economic considerations. We illustrate equity-enhancing changes in the quota distribution under scenarios of different levels of inequality aversion, and we make qualitative assessments of the effects of these allocations to Nunatsiavut for socioeconomic welfare. This approach could benefit fisheries governance in Northern Labrador, where federal commitments to equity objectives continue to be endorsed but have not yet been integrated fully into quota allocations.
Translations of the abstract in Inuttitut and Inuktitut can be found in the Supplementary Material.
Introduction
The social, cultural, ecological, and economic importance of marine ecosystems in the Arctic remain to a large extent understudied, despite their importance to the wellbeing of Inuit communities. In recent years, climate shifts have drawn increasing attention of scientists toward understanding the shifting ecosystem dynamics in the Arctic and the effects of those shifts on both inshore and offshore harvested marine resources. If coastal communities are to be resilient, this focus has to shift to involve greater consideration of economic and social dynamics in providing access to these marine resources. We recast some of these well-known Arctic challenges by looking at fisheries management, including access to and allocations of commercial fisheries involving the Northern Labrador Inuit. In this context, access refers to both resources and space as defined by Bennett et al. (2018) to describe “the ability to use and benefit from available marine resources or areas of the ocean or the coast.”
Nunatsiavut is located at the northern tip of Newfoundland and Labrador on the east coast of Canada (Figure 1), covering an area of about 72,520 km2 of land and inland waters, 48,690 km2 of sea (adjacent tidal waters) with 15,000 km of coastline along the Labrador Sea (CIRNAC, 2005; Snook et al., 2018). About 5% (2,325) of the population identifying as Indigenous in Inuit Nunangat, the homeland of Inuit (ITK, 2019), lives in Northern Labrador, the Inuit Land Claims Settlement Area of Nunatsiavut, according to the 2011 National Household Survey and the 2012 Aboriginal Peoples Survey (Statistics Canada, 2016). The Inuit living in Labrador are a little more than 3.5% of the whole Inuit population in Canada (2016) (ITK, 2018). Marine resource harvesting has been a fundamental component of the subsistence economy in Northern Labrador for many years (Brice-Bennett, 1977) as well as of the wage-based economy with commercial harvesting and processing operations supporting in multiple ways the coastal communities of Nunatsiavut.
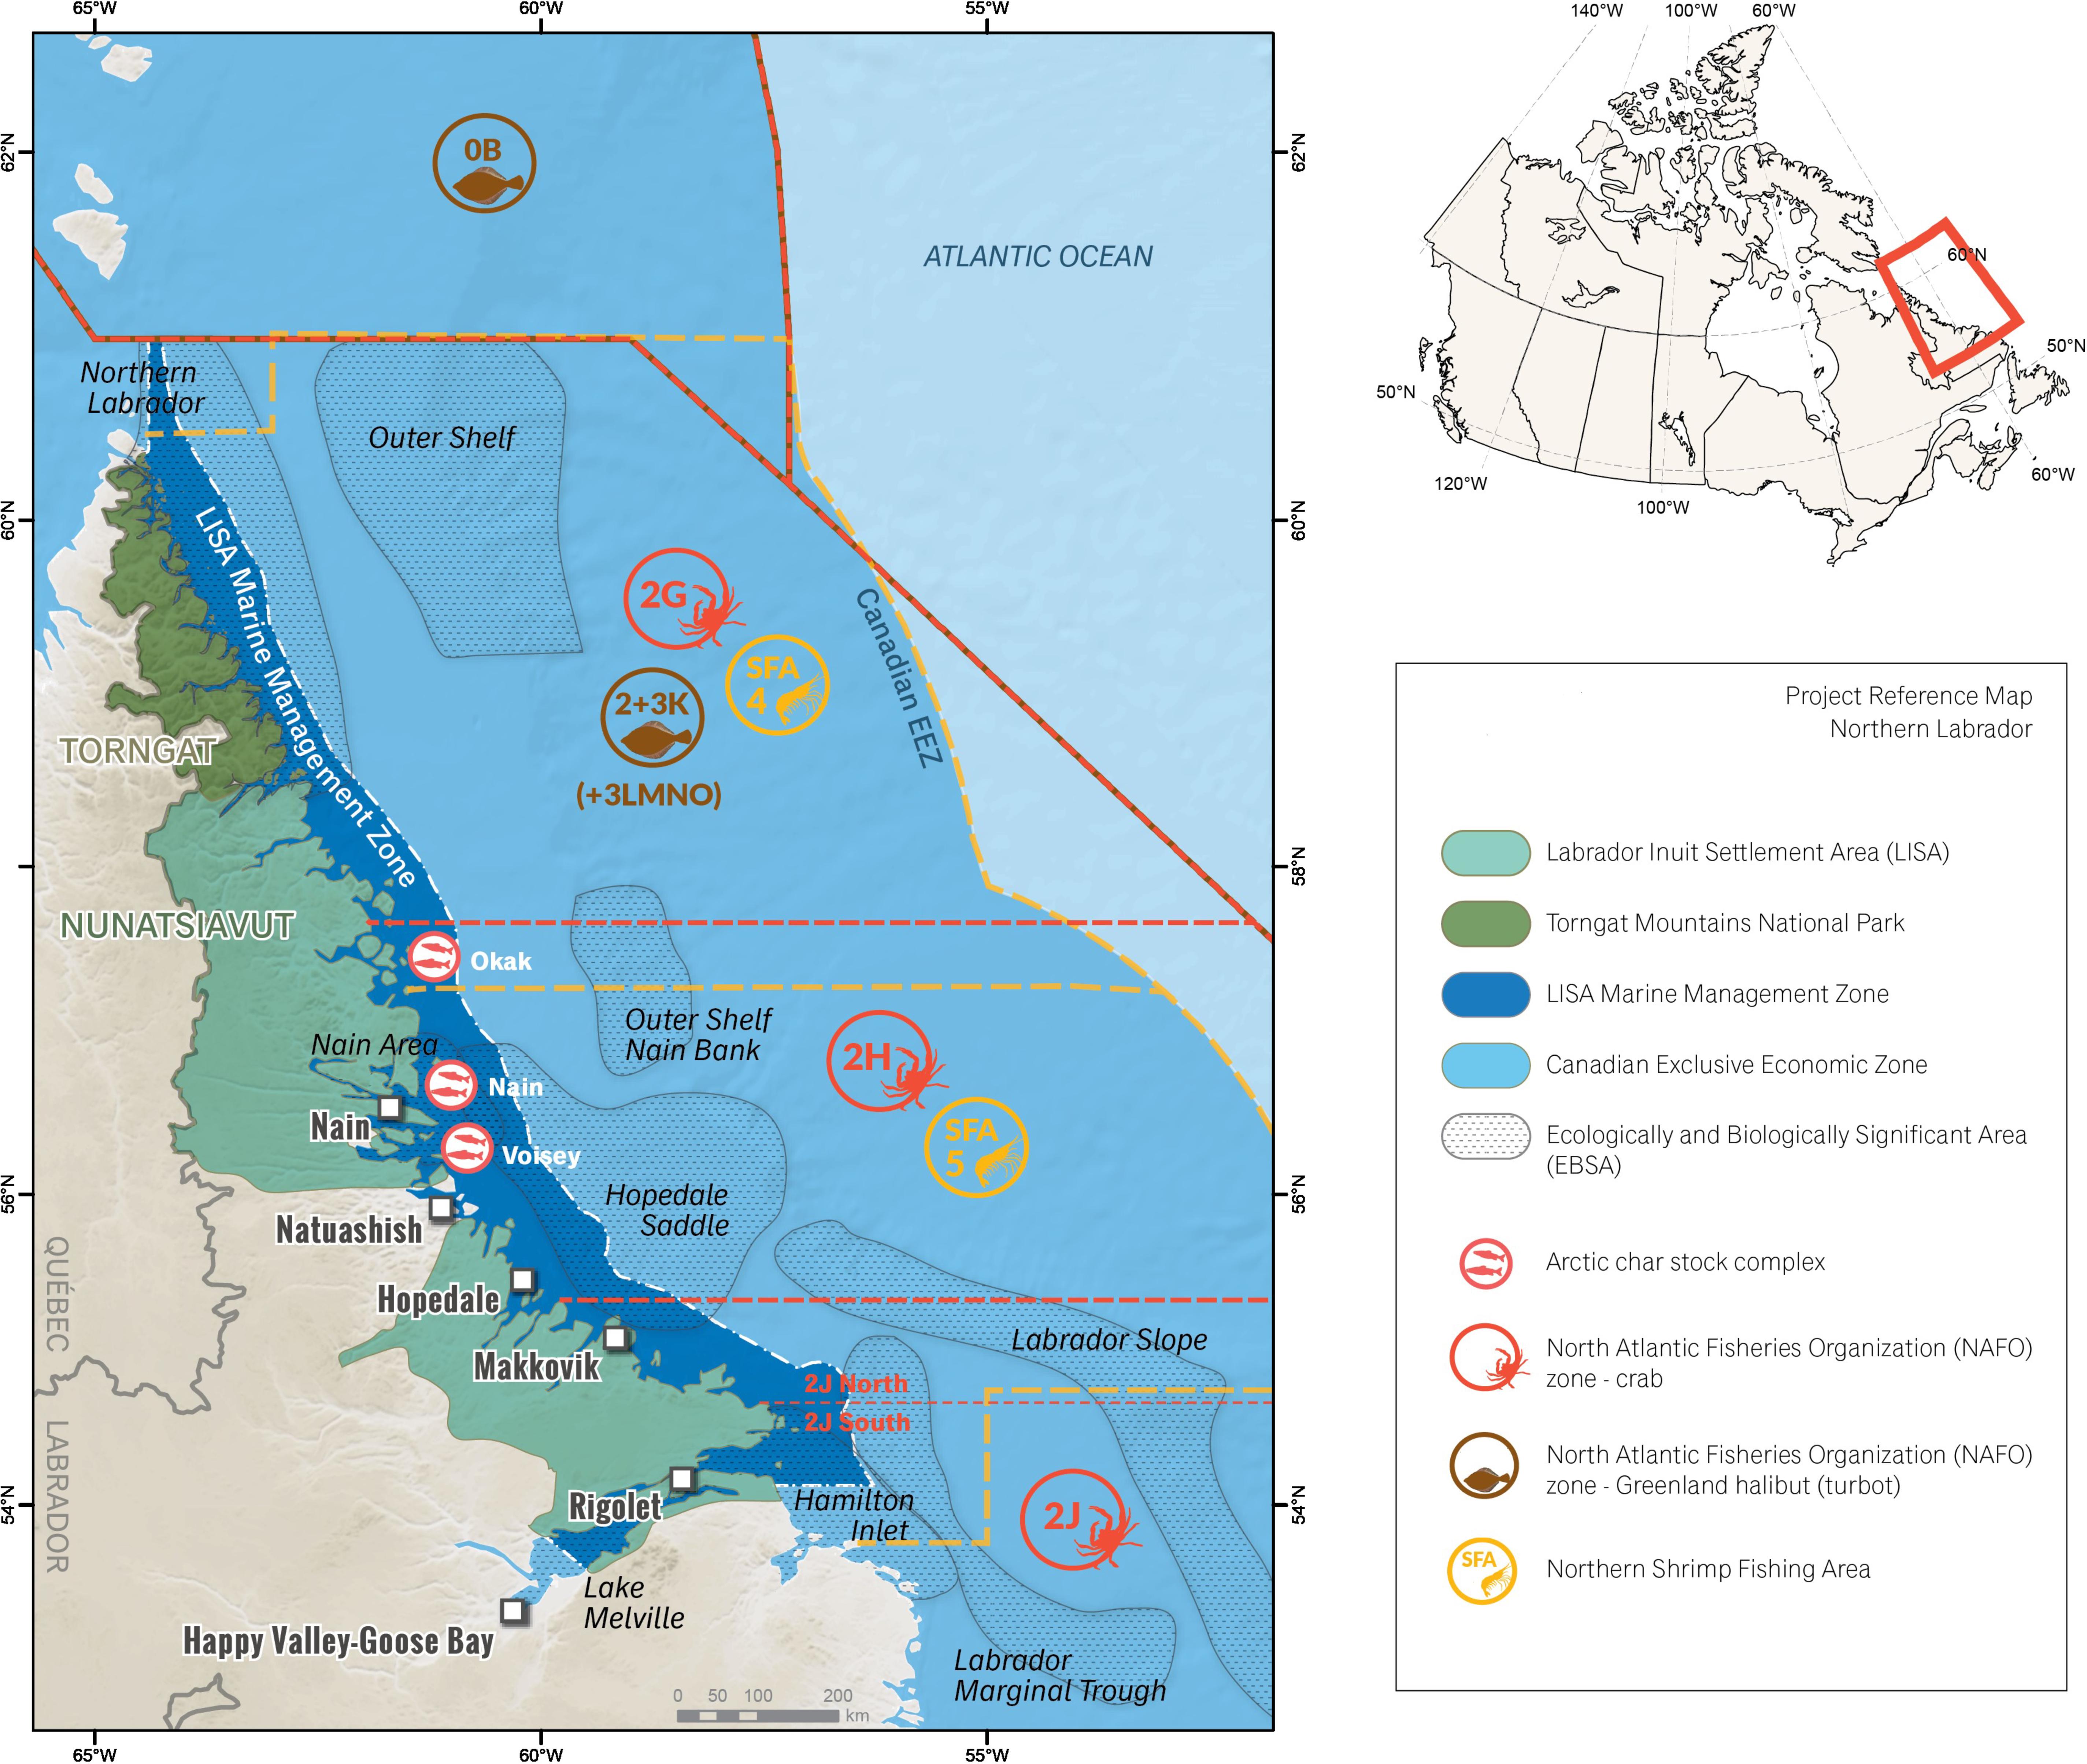
Figure 1. Nunatsiavut, commercial fisheries, and management areas.
After more than 30 years of negotiations between the Labrador Inuit Association and the federal and provincial (Newfoundland and Labrador) governments, Labrador Inuit voted to accept the Labrador Inuit Land Claim Agreement (LILCA) (CIRNAC, 2005), which led to today’s self-governance regime. This regime provides the Nunatsiavut Government (NG) with the opportunity of deciding how natural resources should be managed and developed. Chapter 13 of the LILCA is the main instrument determining Inuit access rights to marine resources, including those harvested for commercial and subsistence purposes. It defines the “Zone” (Labrador Inuit Settlement Area, LISA, Figure 1) and the “Waters Adjacent to the Zone”1 and is therefore viewed as a path to sovereignty for increased control and access to locally harvested marine resources. The LILCA also led to the creation of the Torngat Secretariat which is the implementation agent for the Torngat Joint Fisheries Board (TJFB) and the Torngat Wildlife and Plants Co-Management Board. These boards, in line with the LILCA co-management approach to marine resources in the region, provide recommendations for fisheries’ conservation and management. Despite the LILCA provisions and the recommendations of the boards, fisheries management is largely driven by federal authorities, with decision-making on quotas and allocations being subject to ministerial discretion. Nunatsiavut’s socioeconomic objectives associated with the fisheries sector often are at odds with those of the federal and the provincial governments. In addition, the current allocation system for commercial fisheries in Nunatsiavut creates a sense of unfairness, inequity, and marginalization among local harvesters (Snook et al., 2018), most of whom have an Inuit identity background.
The commercial fisheries that fall within Nunatsiavut interests2 (Figure 1) include snow crab (Chionoecetes opilio) in NAFO Divisions 2GHJ, northern shrimp (Pandalus borealis) in shrimp fishing areas (SFAs) 4 and 5, turbot or greenland halibut (Reinhardtuis hippoglossoides) in 2+3KLMNO and 0B, Arctic char (Salvelinus alpinus) stock complexes of Nain, Okak, and Voisey (fishing primarily occurs around Nain Bay) and Icelandic Scallop (Chlamys islandica) which is fished intermittently in scallop Fishing Area 1 (not depicted in Figure 1, but see DFO, 2019c, Appendix 4).
In this paper, we review the current status of the socioeconomic benefits that commercial fisheries produce as a result of turbot and shrimp allocations to the NG along with management and governance issues associated with access to commercial fisheries. We encompass equity considerations and attempt to bring together existing knowledge on current and past allocations, identify current and past successes and failures connected to the distribution of benefits among adjacent users, and suggest ways that could help sustain long-lived commercial fisheries in Nunatsiavut. Specifically, we examine socioeconomic welfare implications of shifts in allocations using different allocation scenarios under which the spirit and intent of the LILCA could be more fully realized. Although we recognize the complexity of decision-making for allocations, we propose the use of economic tools that can help increase transparency, which we expect may contribute toward alleviating conflicts on resource access caused by top-down decision-making processes.
Our approach contributes to the knowledge base needed for understanding how realigning Nunatsiavut’s fisheries allocations with the LILCA and other federal mandates (e.g., adjacency principle and Reconciliation Strategy) could help deliver increased socioeconomic benefits to Labrador Inuit and support reconciliation and self-determination across Inuit Nunangat and other Indigenous groups who are in the process of negotiating Land Claim Agreements (LCAs) (e.g., Inuit in Southern Labrador). Almost 15 years after the LILCA, it is both timely and important to acquire a better understanding of the socioeconomic outcomes of fisheries management and draw lessons for monitoring progress and evaluating whether social and economic goals are being met.
Fisheries Governance and Allocations in Nunatsiavut
Canada’s Commitments to Indigenous Rights in Fisheries
Fisheries and Oceans Canada (DFO) and the Canadian Coast Guard, as a part of the Reconciliation Strategy (DFO, 2019e) have taken a long-term commitment to “recognize and implement Indigenous and treaty rights related to fisheries” in line with: (a) section 35 of the Constitution Act, 1982 (Department of Justice, 2017); (b) the United Nations Declaration on the Rights of Indigenous Peoples (United Nations, 2007; CIRNAC, 2016); (c) the Voluntary Guidelines on the responsible governance of tenure of land, fisheries and forests in the context of national food security (FAO, 2012); and (d) the Principles Respecting the Government of Canada’s Relationship with Indigenous Peoples (Department of Justice., 2018). While the Reconciliation strategy is a relatively new initiative, since 2005, the LILCA has defined adjacency and provided the NG with a constitutional right to be included in consultations for fisheries management (CIRNAC, 2005, 13.11.1). The exclusion of the TJFB from some consultations and the subsequent changes in considerations regarding adjacency, access to fish stocks and fisheries management have previously created tensions between the TJFB and the Ministry of Fisheries and Oceans (see for example the case for northern shrimp in Torngat Wildlife Plants and Torngat Wildlife Plants and Fisheries Secretariat [TWPFS], 2017).
Besides the Reconciliation Strategy, DFO has also long been committing through the Integrated Fisheries Management Plans (IFMPs), the primary mechanism for fisheries management in Canada, to “provide fair access and equitable sharing of the resource” and “promote the continued development of a commercially viable and self-sustaining fishery.” Both long-term and short-term objectives of benefits to stakeholders emphasize access and equitable sharing of the resource, acknowledging and respecting economic viability and dependence, adjacency and transparent sharing principles and at the same time promoting the co-management of marine resources. The need to fulfill obligations under LCAs and respecting Aboriginal rights to fish is at the forefront of IFMPs (e.g., see DFO, 2018, 2019d). It is also worth noting that certification standards do not pay close attention to such issues when evaluating fisheries management. The Marine Stewardship Council for example, in evaluating the management of Greenland halibut, finds the existence of LCAs a sufficient form of acknowledgment and respect for the rights of people dependent on fishing for food and livelihood (MSC, 2019, p. 127, 3.7 and PI 3.1.1).
The recent bill, C-68, which amends the Fisheries Act and other laws primarily for the protection of fish and fish habitats, explicitly requires the Minister to consider the potential adverse effects that decisions may have on Indigenous rights and consider Indigenous Knowledge (IK) in decision-making (Parliament of Canada, 2019). Nevertheless, it still does not adequately address adjacency, which is inherent in Indigenous rights and determines much of the benefits from allocations and resource access. This remains an issue despite calls from regional stakeholders to consider addressing the highly debated and controversial issue of access and allocation (Barker, 2018).
In addition to the commitments described earlier, Canada’s support in the development of the United Nations Convention on the Law of the Sea was driven primarily by the needs of coastal communities which include sovereignty claims for the oceans, with a particular focus in the Arctic (Mathias et al., 2008; Bennett et al., 2018). Other fisheries policies, such as the New Access Framework (DFO, 2002) are also meant to support adjacency, historic dependence and economic viability, but their implementation has had limited success in Nunatsiavut. The access of some Indigenous communities in Atlantic Canada has benefitted from the R. v. Marshall court decision, which sets a precedent for increased access of other Indigenous communities in the region (Bennett et al., 2018). In recent years there have been increasing efforts to promote inclusion of Indigenous Peoples in decision-making in support of increased access and allocation (Denny and Fanning, 2016a, b; Bennett et al., 2018).
From an institutional standpoint, notwithstanding all the improvements in gaining independence for natural resource management in Nunatsiavut through the LILCA, sovereignty over fisheries management lags behind. Despite the dynamic and ambitious goals of the TJFB in the first years of its establishment, as well as its efforts to foster both Western Science and IK in decision-making, its effectiveness in ensuring a fair allocation of marine resources to Nunatsiavut has been limited. Snook et al. (2018) attribute this, in part, to the “newness” of the Board and Nunatsiavut itself as a self-governance region (since 2005) as well as to the uncertainties in establishing relationships with provincial and federal bodies.
Access and Fisheries Management in Nunatsiavut
On a yearly basis, DFO provides allocations to the NG which in turn sub-allocates them to land-claim beneficiaries, under the LILCA provisions (Coombs et al., 2011; NG, n.d.). Commercial fisheries are managed through communal licenses, under which individuals are designated to fish the quota attached to these licenses (Department of Justice, 2009). Designates need to fulfill certain eligibility criteria pertaining to their prior participation in the commercial fishery and their plans for long-term engagement in the fishery (NG, n.d.). In the interest of best utilizing its quotas, the NG prioritizes allocations to those designates with a history of performance and commitment in fisheries, who own a registered operational vessel suitable to partake in the fishery or can provide evidence for their intention to go into a lease or co-op arrangement (see more details on the priority criteria in NG, n.d.). Allocations thus far have been primarily provided to a small number of fishers with a continuous interest for participation and for pursuing a livelihood from the fishery.
The communal management comes with strengths and limitations. It is meant to ensure that property rights for fisheries stay within the communities, which may help avoid some of the negative effects of rights-based management systems, such as those of Individual Transferable Quotas (ITQs). ITQs have been criticized for impacting wellbeing in small fishing communities by inducing concentration of fishing rights in few hands, often outside the communities, inequitable allocations, as well as limited access and distribution of benefits from the fisheries across rightsholders (Eythórsson, 2000; Bromley, 2009; Carothers, 2011; Carothers and Chambers, 2012; Richmond, 2013). The communal management system also helps prevent vertical integration, including in processing, which may also lead to the concentration of economic benefits. Despite these perceived strengths, communal management provides limited financial independence to local fishers for professional development. Third party institutions are often unwilling to finance fishers with no independently owned licenses and quotas since they entail a higher risk. This limits registers of new fishers, prevents existing fishers from acquiring new vessels or equipment, and leads to a sense of unfairness when compared to the potential for capacity development of fishers elsewhere accessing the same fish stocks (Torngat Wildlife Plants and Torngat Wildlife Plants and Fisheries Secretariat [TWPFS], 2018, 2019).
At the same time, the communal way of managing fisheries is questionable from both an efficiency and an equity standpoint. Transferability is often seen as a means that helps achieve efficiency and minimize overcapacity (Hannesson, 2004; Squires et al., 2010; Sumaila, 2010). Given that, in the absence of locally owned vessels, many beneficiaries in Nunatsiavut go into lease arrangements with vessel owners, overcapacity does not seem to be a problem at a regional scale; note though that overcapacity triggered by significant cuts in shrimp quotas to southern Newfoundland and Labrador inshore fishers (Foley et al., 2019) may expand over to Nunatsiavut as they increasingly go into lease arrangements. The efficiency of the communal management system, however, in terms of maximizing rents has not been studied. Efficiency considerations do not explicitly inform allocation decisions at a federal level and therefore it is hard to evaluate trade-offs between equity and efficiency and address Nunatsiavut’s claims for unfair allocations. It is possible that an optimal combination of tradable and non-tradable quotas provides more flexibility and addresses both equity and efficiency concerns, but this has not been examined either. One may hypothesize for example, that the current allocation may look similar to today’s allocation under a tradable quota system minus the income that the NG would get from selling its shares. In other words, if the NG had access to all the quota for stocks adjacent to their lands, as the TJFB has been advising, they could potentially choose to sell almost all of it resulting in an ex post allocation very similar to today’s allocation, assuming that this is the efficient outcome.
So while communal fisheries management may have some benefits, it is not clear whether it empowers local fishers and allows them to benefit fully from fisheries socially and economically. The NG is currently in the process of revising its fisheries policy to address these concerns, alleviate the difficulties to entry, and assess and capture any socioeconomic benefits foregone due to the communal way of managing fisheries.
The current fisheries access arrangements in Nunatsiavut, along with key fishing areas and management divisions, are illustrated in Figure 2. Nunatsiavut enjoys exclusive access to snow crab in 2H and 2J and to all Arctic char stocks in the region. In what follows, we focus on the turbot and northern shrimp fisheries to which Nunatsiavut has limited access and for which the TJFB has expressed concerns on access equity. We examine issues associated with access rights of the NG, despite recognizing that there exist additional access avenues to fisheries from regional stakeholders. We focus on access to the NG because it has been granted through the LILCA and is directly associated with the Federal Government’s reconciliation plans with Northern Labrador Inuit. Access to additional allocations to regional stakeholders has been acquired through different means, such as the purchase of licenses.
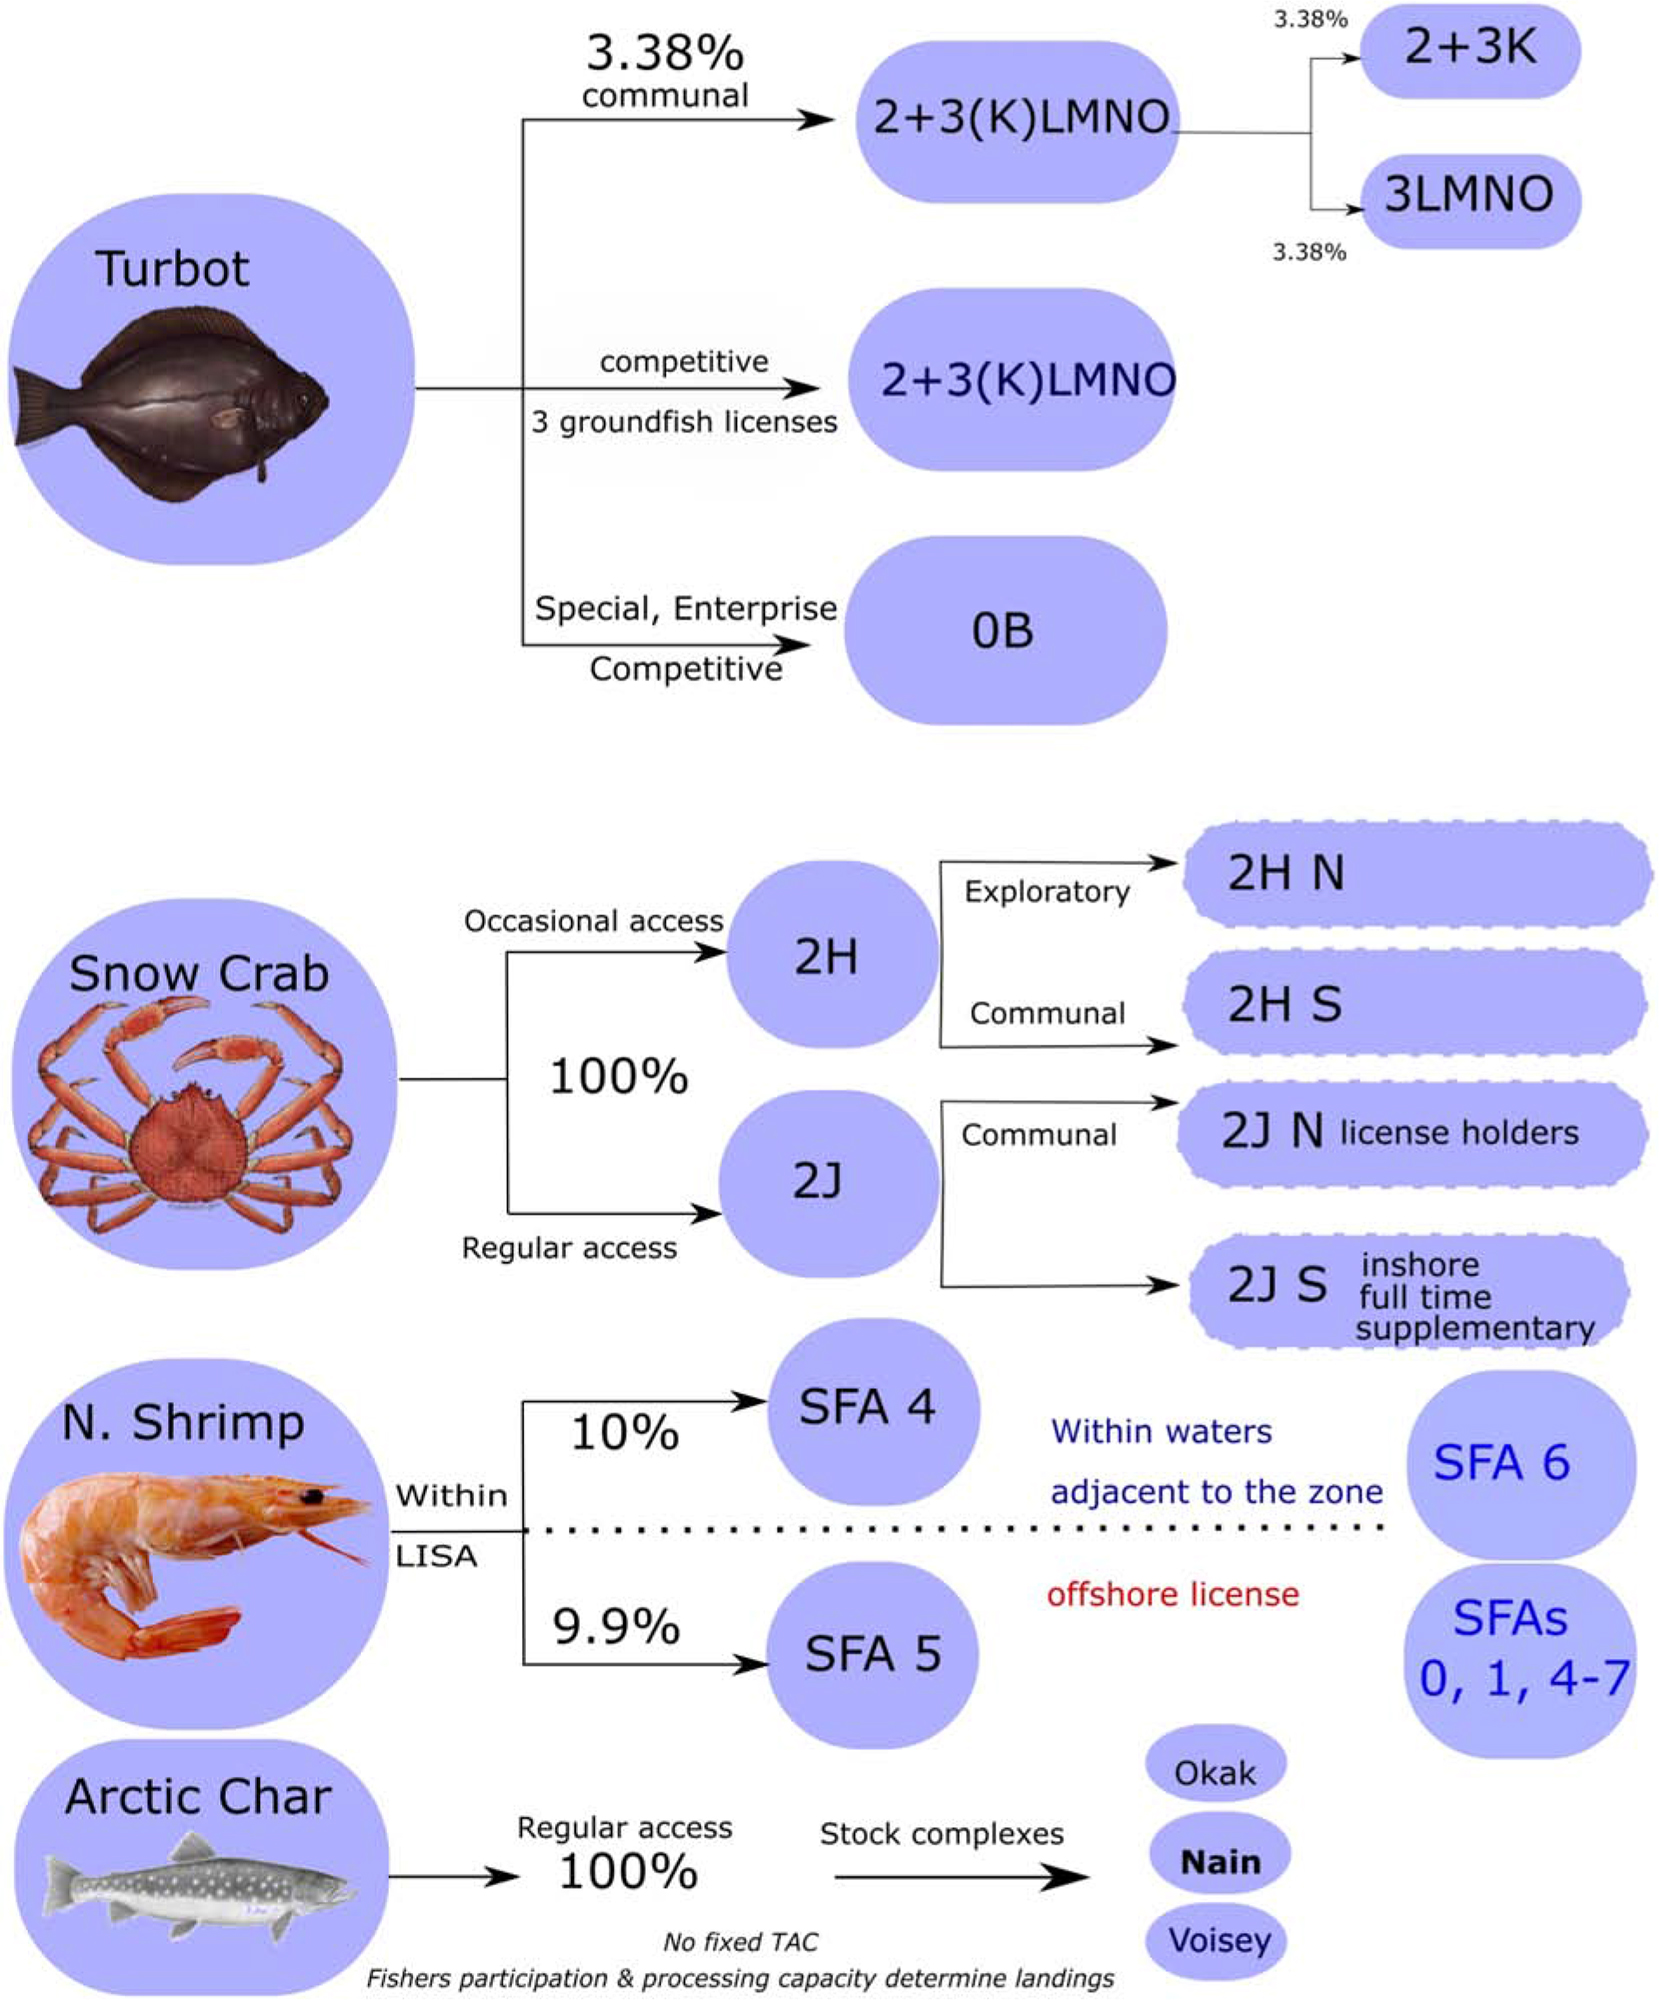
Figure 2. Access and allocation to commercial fisheries in Nunatsiavut.
A brief overview of access that falls within the Nunatsiavut interests, as depicted in Figure 2, is given below: Access to turbot stocks in area 0B is through special, enterprise and competitive allocations while access to 2+3(K)LMNO is through two different avenues: (a) the communal allocation to the NG (3.38% of the Canadian TAC) and (b) 3 groundfish licenses in the competitive fishery. The primary fishing areas for northern shrimp within (and adjacent to) the LISA are SFAs 4 and 5, where access is limited to about 10 and 9.9%, respectively. Similar to the turbot, broader interests within the region of Nunatsiavut include access to SFA 6 (waters adjacent to the “zone”) and through offshore licenses (1.5 license) that provide quotas to SFAs 0, 1, and 4–7.
In the sections that follow, we discuss different approaches to distributional equity and relevant metrics. DFO does not provide a clear definition of “equity” and we therefore see value in identifying relevant tools for its measurement. From a social planner’s standpoint, the priority should be to manage the fishery for maximizing rents and then consider wealth distribution mechanisms to e.g., meet societal goals, such as equity. When rents are dissipated because of poor management, this is likely to hurt all rightsholders and exacerbate the equity problem. In line with this, previous studies on inter-sectoral allocations, addressing allocation disputes between the recreational and commercial sector, conclude that reallocation should not be a first-order concern (Abbott, 2015). While recognizing the importance of this from a larger-picture perspective and the needs for reforms to fisheries as a whole, contrasting views on allocations between different fleet sectors still need to be reconciled to alleviate current controversies and contribute to the reconciliation agenda. We suggest that the way to do this is by shedding light on economic and equity considerations that factor into decision-making for allocations.
Distributional Equity in Allocations
Distributional Equity Metrics
Perceptions and definitions of equity differ among scholars, practitioners, managers, and resource users. Armstrong and Clark (1997) for example consider three dimensions of egalitarianism within a utilitarian spectrum that ensures maximum profit, so that no reallocation can increase total profits. These dimensions include an equal access management, an equal resource management (equal harvests among all), and an equal average product (equal average harvest relative to fishing effort). It is clear that, in the absence of a clear definition, equity is susceptible to different interpretations.
Just as perceptions and definitions differ, so do ways of measuring inequalities, such as income inequalities. Examples of most commonly used inequality measurement frameworks include the Lorenz curve and the Gini coefficient, generalized entropy measures (Theil index), the Atkinson index and the Herfindahl-Hirschman index (HHI), the Robin Hood (or Hoover or Pietra) index, ratios such as the decile dispersion, the Palma and the 20/20 ratio (De Maio, 2007; Afonso et al., 2015). It is reasonable to expect that some of these measures may be highly correlated (Kawachi and Kennedy, 1997). However, there are empirical studies finding that the choice of inequality metric does lead to a noticeable difference. Weich et al. (2002), for example, find important differences in the Gini and General Entropy metrics for the U.K. which were attributed to how sensitive they were to income differences among people at the top or bottom of the income distribution. Using multiple indicators is therefore highly recommended within different domestic and international policy frameworks (Afonso et al., 2015) to allow for income differences at different parts of the distribution to be reflected (Wen et al., 2003; De Maio, 2007).
Despite the many ways in which income inequality may influence decisions on resource allocation, not all of them are meaningful in a fisheries context or in many cases the data to support the development of these metrics are absent. Much of the fisheries economics literature on fairness, distributional effects, and equity, focuses on distributional issues related to the impacts of alternative management schemes or changes in the existing ones as well as trade-offs between efficiency and equity (Dupont and Phipps, 1991; Armstrong and Clark, 1997). These trade-offs have been examined in different spatial management contexts (e.g., Marine Protected Areas) and with the use of a variety of economic tools (e.g., game theory) (Sumaila and Armstrong, 2006). Rights-based fisheries management such as ITQs and their distributional effects have attracted, for a long time now, the most attention in this literature (Matthiasson, 1992; Guyader and Thebaud, 2001). Fewer studies have addressed equity of access using income inequality metrics, but again those that do, emphasize testing the effects of quota transferability (Adelaja et al., 1998; Connor, 2000; Hamon et al., 2009).
If marginal costs of production are available, the most straightforward way to examine concentration is to compare prices for estimating the degree of monopoly power (Connor, 2000). The Concentration ratio can been used as the proportion of the market (or quota) share that certain firms hold (Adelaja et al., 1998; Connor, 2000). Other straightforward examples that have been used to measure concentration include the number and % of owners with 95% share, the % share controlled by the top 5% of owners and the number of owners with less than minimum holdings for the class (Connor, 2000). Other commonly used inequality metrics that measure market concentration and inequality resulting from implementation of ITQs include the Gini Index (GI) and the Herfindahl-Hirschman Index (HHI) (Adelaja et al., 1998; Connor, 2000; Hamon et al., 2009).
The GI along with the Lorenz curve are among the most popular metrics of income inequality with multiple applications in fisheries (Gini, 1921). The GI framework is appealing and easy to use for communicating policies through a single summary statistic that measures the ratio of the area between a Lorenz curve and a 45-degree line of income equality to the total area under this line. It ranges from 0 to 1 reflecting the range from a perfectly equal (egalitarian) to a perfectly unequal distribution of income or property rights that generate income. With higher levels of inequality, the GI increases and the Lorenz curve starts deviating from the equality line. Two common shortcomings discussed in the literature are that (a) despite different patterns of income distribution, GI values may remain similar and (b) it is overly sensitive to inequalities in the middle of the income distribution (usually the mean) which makes it inappropriate for cases where inequalities on the top or the bottom of the distribution matter. Indexes such as the Atkinson and Theil, which are briefly discussed below, are more suitable for attaching more weight to the tails of a distribution.
In a fishery context, since the GI does not account for the number of participants, it has been criticized for lagging behind in revealing inequities from comparisons among participants that may have the same quota shares. As Connor (2000) explains, it treats two firms with 50% quota each and 100 firms with 1% quota in the same way. The HHI accounts for both the number of participants and inequality in quota shares, weighing the larger firms quadratically. It is expressed through the sum of the squared proportionate shares of all participants in the fishery, and similar to the GI ranges from 0 to 1. An increased number of fishers indicates decreased concentration and results in a decreased HHI index.
Inequality within and between subgroups of vessels or fishers has attracted less attention overall (Armstrong and Clark, 1997) and particularly in the literature that uses inequality metrics (Bellanger et al., 2016). General Entropy (GE) measures can address the limitation of the GI framework to distinguish between different distribution curves, through their decomposability properties. GE may be measured either through the “Theil′s L” (referred to as Theil) and “Theil’s T” or Mean Log Deviation (MLD), depending on the sensitivity parameter chosen which varies in the weight given to inequalities in differing parts of the income distribution (Theil, 1967; De Maio, 2007). Lower values indicate more sensitivity to changes in the lower tail of the distribution and higher values indicate the opposite. When this parameter is 0 then the index is called Theil′s L or Theil and when 1, it is the MLD. The Theil index is estimated as the weighted average of inequality among subgroups and measures the entropic distance between the observed and perfect equality distribution (Bellanger et al., 2016). It has been used at a regional scale for decomposing within and between components of different features of a fishery such as fishing gear, vessel length, distance from fishing grounds and production (Bellanger et al., 2016) as well as at a global scale to distinguish the between and within inequality attributed to biological and technological conditions, respectively (Gutiérrez and Inguanzo, 2019). In other words, the Theil index can answer the question of how much of the observed inequality can be explained by differences between fishing areas (e.g., species diversity, climate, nutrients, and other productivity factors) and how much by differences between different fishing actors in these areas (e.g., technological features of the fleet such as gear length, power, and distance) (Gutiérrez and Inguanzo, 2019).
The Atkinson (1970) index (AI) addresses disparities by applying weights to society’s aversion to inequality. It utilizes a social inequality aversion parameter that ranges from 0 to infinity, reflecting indifference to the nature of the distribution or concerns for the income of the poorest group. Similar to the GI, the AI ranges from 0 for an egalitarian distribution to 1 for maximum inequality, with higher values of the aversion parameter making the index more sensitive to inequalities at the bottom of the distribution (De Maio, 2007). It has been used in a fishery context, through scenarios for different levels of inequality aversion, primarily to reflect equity in distribution of fisheries resources but also to spatially demonstrate the impact of competing ocean uses (Hoagland et al., 2015; Gutiérrez and Inguanzo, 2019). One can interpret the AI as the percentage of total income that would have to be sacrificed to achieve equally distributed incomes (see more details in section “Inequality Aversion”).
Intra-Country Distributional Equity: Allocations to Indigenous Groups
The role of social justice and equity in resource management and conservation is increasingly being recognized in the Indigenous literature (Artelle et al., 2019). Despite the attention equity has attracted, particularly within resource governance frameworks, it is still largely a concept that remains elusive and is tied primarily to political arguments that relate to past wrongdoings of central governments and the ongoing reconciliation process. Decision-makers though face pressures from multiple stakeholders with interests in accessing natural resources which in theory should force them to be transparent about the rationale that directs their allocation decisions and the underlying socioeconomic impacts of those.
The income disparities among Indigenous and non-Indigenous groups have received attention from both researchers and governments since the 1990s [see for example Patrinos and Sakellariou (1992); De Silva (1999), Duhaime and Édouard (2015), and other references in Maxim et al. (2001)]. Despite the evidence for the economic disadvantage that Indigenous communities may face, whether this factors into resource allocation decisions remains ambiguous. Some view the communal allocations or newly granted access rights to Indigenous groups as a means of addressing the income disparities. Most allocations or access rights across Inuit Nunangat though are largely the outcome of negotiation processes in Land Claim Agreements in expectation of anticipated negative impacts from non-renewable resource extraction. They do not represent compensatory allocations for the current economic disadvantage of those communities and are not grounded on any economic or distributional equity considerations. There is anecdotal evidence though that non-Indigenous fishers feel disadvantaged since it is costly for them to acquire a license and enter the fishery, unlike Indigenous fishers who do not face such costs when fishing under the communal license. As many fisheries in Canada are fully subscribed, granting access for new Indigenous entrants is wrought with conflict (Withers, 2018; NCC, 2019).
In what follows we discuss the current distribution of quotas for the turbot and northern shrimp fisheries among different stakeholder groups in order to characterize what distributional equity may look like. This type of equity analysis would normally require knowing the number of fishers and households connected to these fishers who benefit from the allocation to each group. In the absence of this information though and the lack of any relevant considerations justifying current allocations, we first described what an equal allocation, in the sense of a uniform distribution of quotas, would look like among the different stakeholder groups in each fishery. We do recognize though that it may not be the intention of the management authority (DFO in this case), to distribute quotas in an equal or uniform manner across stakeholder groups. Nevertheless, we see value in illustrating the way of thinking for such an approach given the Government’s commitments described in the previous section, for “equitable” sharing of the resource, which are loosely defined in fisheries management plans.
In addition to this limitation of using the stakeholder groups to reflect distributional equity, another caveat of this approach is that it does not account for heterogeneity among these groups and their capacity to access the resource. This becomes important, especially for the turbot fishery for which allocations are shared among different fleet sectors (Supplementary Tables 1, 2). Although considerations regarding access capacity may factor in DFO’s decision-making for allocations, this is not done in an explicit or transparent enough manner.
We assume that all stakeholder groups face identical prices, and we therefore use the quota allocations to each stakeholder group (in tons) to estimate distributional equity metrics. This is a key simplifying assumption which allows us to ignore for the purposes of this exercise any disparities in income generated from the fisheries to the different stakeholder groups. In reality though, some fishers may be getting a lower price than others depending on their distance to markets. Most fishers in the province, with the exception of Nunatsiavut fishers, are members of the Fish Food and Allied Workers Union (FFAW) that determines prices. However, the single processor in Nunatsiavut, the Torngat Fish Producers Co-Operative (Co-Op), offers prices similar to those offered by the FFAW.
Turbot Allocation and Management
For the turbot fishery we focus on quota allocations from areas 2+3K and 3LMNO, to which the NG gets 3.38% of the total Canadian TAC through its communal allocation (Supplementary Tables 1, 2). For the purposes of this exercise we ignore non-communal access3 to turbot that falls within the broader interests of Nunatsiavut. This includes for example the special, enterprise or competitive allocations in area 0B held by the Torngat Co-Op and the Nunatsiavut Group of companies (NGC). Additionally, we focus on the allocations within Canada, ignoring allocations to other NAFO members and the French quota.
Most of today’s fishing activity is concentrated in the southern part of 3L, followed by areas 3K and 2J; the activity in 2H (also adjacent to northern Labrador and within the LISA) is quite small (MSC, 2019). The changes in turbot allocations over the past few years have been very minimal in both areas 2+3K and 3LMNO which results in similar Lorenz curves and consequent Gini coefficients (see turbot allocations for the past 7 years in Supplementary Tables 1, 2 and Lorenz curves for 2019 in Figures 1, 2). The Supplementary Table 5 shows the General Entropy (GE) index metrics estimated for 2019 collectively in areas 2+3K and 3LMNO for varying degrees of weights to distances between allocations as explained in section “Distributional Equity Metrics” Distributional equity metrics (Theil’s T/GE for a = 1, Theil’s L/Mean Log Deviation/GE for a = 0 and GE for a = 2).
The Lorenz curves show how uniformly allocations are distributed across stakeholder groups, with the 45 degree line representing the scenario of all groups receiving exactly the same quota. The Gini coefficients of ∼ 0.62 and 0.59, for areas 2+3K and 3LMNO, respectively, indicate that quotas are distributed across stakeholder groups in the two areas in a fairly similar manner, with a high degree of concentration for both of them. The GE index metrics, collectively for 2+3K and 3LMNO, also reveal a relatively high degree of concentration in certain groups. This approach is oversimplified in that it does not account for the number of fishers or vessels in each stakeholder group or their incomes from other sources. In the absence of a clear definition of distributional equity, this metric is a starting point for the logic to be followed in the future. Such metrics should be evaluated considering information about individual vessel owners and their access to quotas.
The appropriate metric to use ultimately depends on DFO’s definition of distributional equity. If equity concerns include how fairly income from fisheries (or allocations) is distributed among the “middle” stakeholder groups, then Gini could make an appropriate indicator. It is important to note though the limitation of the GI in capturing inequality at the tails of the allocation distribution, given its sensitivity to the middle of the distribution. At the same time though the GI is not informative regarding where one may find the inequality (e.g., in the middle categories or also in the lower end of the distribution among the “poorest” ones), and it has been criticized for being insensitive to levels of high inequality. However, recent developments indicate that the criticisms of the GI being too sensitive in the middle of the distribution could be somewhat inaccurate. In support of this argument Gastwirth (2017) shows that when incremental transfers of income happen between upper to low income categories, those have a larger weight compared to transfers among incomes in the middle of the distribution and the effects on the GI tend to be larger in this case. This would deserve more research attention in the context of quota re-allocation.
Other indices with useful properties include the Theil index which can decompose “within” and “between-group” inequality (Gutiérrez and Inguanzo, 2019) to provide an idea of how much of the inequality can be explained by differences among stakeholders in the fishery. For differently sized groups though, such as those in the turbot fishery, the Theil index may not be as helpful for direct comparisons, especially across time and space. Some recent applications provide good examples of how the Theil index can be used to better understand how inequalities within fleet sectors contribute to total inequality, as well as decompose inequality by vessel characteristics and fishing areas (Bellanger et al., 2016).
The use of appropriate metrics may lead to new considerations regarding allocations decisions. Besides the communal quotas allocated to Nunatsiavut, the rest of the fleet sectors access the fishery through enterprise allocations, ITQs, and competitive quotas. According to sources referenced in MSC (2019), a single stakeholder has 60% of the offshore quota in the form of an enterprise allocation and has gained access through quota transfers to about 80% of the total offshore quota. The inshore and 2+3K and 3L < 65′ fixed gear fisheries are competitive with an access to a small quota (∼ 1,100 t in 2018). Every year, following an open call by DFO, fishers interested in participating in the 2+3K or 3LMNO fisheries are provided with permits for a certain quota to be fished within a specific period of the fishing season. In the case of either limited or excessive interest at the initial stage, DFO disseminates those permits based on a draw, which is perceived as a way of providing “equal” opportunities to all interested eligible fishers (MSC, 2019).
Last, the income dependence of participants on the fishery should be tracked consistently over time and be factored into decisions on allocations in a more explicit manner. DFO has tracked the dependency of harvesters on groundfish, reporting on these numbers occasionally, but there is limited evidence that a measure of dependency is taken into consideration when allocating quotas across different groups or when changes in the TAC occur. In 2017 the dependency of 2+3KLMNO groundfish harvesters operating < 65′ vessels (1,622 active) was primarily for crab (77%), cod (7%), turbot (5%), shrimp (5%), and other species (6%) (DFO, 2019b). The previous IFMP for 2+3KL (2013), provides the spectrum of income dependency on groundfish in 2012 for active harvesters; 15.4% of the active harvesters (1,848 in total) were completely dependent on groundfish for their fishing earnings (with annual earnings of less than $5,000). For the vast majority though (66.4%) the income dependency was less than 10% (annual earnings for those with low dependency $260,000). Where geographically disparate groups of harvesters have access to different fishing grounds or groundfish fisheries, and in the absence of quota transferability mechanisms for all groups, it becomes important to have fishers’ dependency factor into allocation decisions.
Shrimp Allocation and Management
For the northern shrimp fishery, we focus on quota allocations in SFA 4 and 5, to which the NG currently gets 10 and 9.9%, respectively through its communal commercial licenses (Supplementary Tables 3, 4)4. Similar to the turbot fishery, we ignore for the purposes of this exercise access that falls within the broader interests of Nunatsiavut which includes access to the portion of SFA 6 within waters adjacent to the Zone and access through offshore licenses to 0, 1, and 4–7. Additionally, we exclude, for SFAs 4 and 5, the scientific/offshore competitive quota which was discontinued after the 2015/16 season. Lorenz curves and Gini coefficients for the 2019/20 allocation shares are shown in Supplementary Figures 3, 4. The same limitations described earlier for the turbot fishery, also apply in the Lorenz framework for the shrimp. General Entropy (GE) index metrics for 2019, estimated collectively for SFA 4 and 5 and for varying degrees of weights to distances between allocations, are shown in Supplementary Table 5. The degree of concentration of allocations to certain groups is relatively high for the northern shrimp fishery but slightly less than the concentration in the turbot fishery.
The northern shrimp is perceived as the most valuable fishery in Nunatsiavut, however, its economic impact has not been assessed and neither has its contribution to regional development (Foley et al., 2017). Different types of problems have been identified in the allocation of rights in the Nunatsiavut region. A good example is found in one of the audits for the implementation of the LILCA (OAG, 2015). The audit found that the interpretation of the obligation to provide the NG with commercial fishing access has been unclear. Up until 2015, access to the fishery was based on the Last In, First Out (LIFO) policy which determined how reductions (primarily) in the TAC would be shared among license holders. The LIFO policy has previously created large uncertainties regarding the prospects for future access of the NG to the fishery (e.g., quota reductions in SFA 5). LIFO was replaced in 2015 by a proportional sharing agreement (of changes in TAC) that allows for increased predictability in allocations and that DFO (2018) characterizes an “equitable” sharing.
The long-term objectives of the fishery with respect to benefits to stakeholders and Indigenous groups, as described in the IFMP (DFO, 2018, p. 30) include “fair access and equitable sharing.” Similar to the case of the turbot fishery, fairness and equity are loosely defined. The short term strategy for guiding allocations when TAC changes happen is to use percent shares for SFAs 4, 5, and 6. For the Western and Eastern Assessment Zones (WAZ, EAZ), however, decisions are made on a case by case basis, taking into consideration LCA obligations (see also DFO, 2018, p. 46 for Land Claim restrictions that apply to the Nunavut Settlement Area and the Nunavik Marine Region only). Nunatsiavut is therefore treated differently compared to other land claim regions (DFO, 2018, p. 30). In recent years there have been some changes in shrimp allocations to the NG which resulted for SFA 4 in an increase of 2.5% in 2016/17, an additional increase of 4.4% in 2017/18 and for SFA 5 in an increase of 4.5% in 2016/17. The increase was the result of the Minister’s decision to modify the NG’s percent shares, something which would not have been possible in areas further north where allocations are made on a case by case basis (DFO, 2018). The TJFB (2017a) though points out that these increases were much lower compared to those received by Nunavut and Nunavik with the 15% TAC increase of 2016 in the EAZ. Additionally, since 2013, 1,500–1,700 t from SFA 4 are being allocated to northern shrimp Research Foundation to fund science in the EAZ and WAZ. This is not seen through a positive lens by TJFB that finds this allocation unfair, especially in light of the TAC increases for Nunavut and Nunavik users (TJFB, 2017a).
Since 1979, there have been Nunatsiavut interests in the northern shrimp fishery through 3 offshore shrimp licenses (Foley et al., 2017). These licenses were partly a result of advocacy on behalf of what is today the FFAW, on the grounds of adjacency and the need for access to new resources following the cod collapse in the late 1960s (Foley and Mather, 2016; Foley et al., 2017). Foley et al. (2019) suggest that these licenses should be seen in the context of Inuit political mobilization in response to colonial and post-colonial resource extraction activities in the region. They also note that when the licenses were granted to Nunatsiavut fishing interests, there was significant effort into ensuring that the Northern Labrador communities would be the ones to benefit from those and relevant measures and mechanisms were suggested to serve this purpose. Nunatsiavut interests therefore benefitted significantly at the time from those shrimp allocations (Foley et al., 2019). More detailed information on local processes attached to indigenous rights and local control of resources that shaped allocations starting from the 1970s can be found in Foley et al. (2017, 2019). A key point of controversy with respect to allocations is that broader Nunatsiavut interests with access to shrimp quotas through non-communal licenses are seen by federal management authorities as supplementing the NG’s access, something that the NG disagrees with (Foley et al., 2017).
Today’s designate program in the shrimp fishery, started off in 1997 when DFO provided a 510 t allocation to the Labrador Inuit Association (LIA, today’s NG) in SFA 5 for inshore fishers in Nunatsiavut. Over the first years, this quota was caught by offshore partners in exchange for a royalty to the NG but today it is managed as a communal quota. In the early 2000s the LIA developed a “beneficiary designate” program that allowed those LILCA registered beneficiaries in the inshore fishery to be allocated a portion of LIA’s special allocation (essentially the communal license) (Foley et al., 2017). For a number of years, despite the shrimp quotas that the NG has made available to local fishers, most of it was transferred to offshore vessels (Coombs et al., 2010). Although the number of inshore fishers has initially been lower than expected, today most of the NG’s allocations are harvested by local designates (97–98% of quota in 2016) and the rest of the quotas are transferred to the offshore fleet for royalties (TJFB, 2017a).
The NG has the flexibility to convert special allocation quota into a communal license for designating beneficiaries to access the shrimp under this license. While the communal license allows for only a few designated fishers (maximum 14, DFO, 2019a), in order to boost employment, beneficiaries are required to hire at least one additional beneficiary on board. Employing two or more may increase their quota (Foley et al., 2017). While successful in boosting employment there is some controversy regarding the limitations that the communal license management puts for local vessel ownership and support from financial institutions. The NG faces a trade-off between distributing smaller quotas to many beneficiaries vs. higher quotas to a few of them which may allow for more security and growth to those few. This trade-off is the main driver behind seeking additional quotas on an ongoing basis (Foley et al., 2017). Additionally, the TJFB has been making recommendations since 2010 to the Minister of Fisheries for increased allocations in SFAs 4 and 5, to align with the LILCA (CIRNAC, 2005).
Due to the lack of local processing capacity, all shrimp caught by Nunatsiavut designates is landed in Charlottetown, NL in exchange for a royalty paid to the NG per pound of shrimp landed. The royalties contribute to the NG’s “Commercial Fisheries Fund,” which among other reasons, has been set up to build capacity for potential additional access to fisheries in the future. Although there have been no studies examining whether processing the shrimp outside Nunatsiavut makes more economic sense for regionally produced socioeconomic welfare compared to the royalties paid to the Fund, it has been suggested that additional shrimp allocations could enable processing in Nunatsiavut (Foley et al., 2017). Previous efforts though by the Torngat Co-op to acquire a shrimp processing license and operate locally, have not been approved by the provincial government.
Effects of Allocation Changes on Socioeconomic Welfare
The arguments of the NG for increased turbot allocations in NAFO Sub-Divisions 2+3KLMNO are primarily relying on the principle of adjacency. Unlike other Indigenous groups, such as in Nunavut and Nunavik, Nunatsiavut Inuit are not the primary beneficiaries of their adjacent marine resources.
The TJFB has been advising for several years now for an increased turbot allocation of 650 t or the equivalent of 12.1% of the Canadian quota (TJFB, 2017b). The interdependencies between the communal and competitive fisheries strengthen the NG’s argument for an increased communal allocation that will allow for more investments and risk diversification. Additionally, the TJFB in advising for higher communal allocations has brought forward the potential or expected (by DFO) elimination of the quota/season split between June/August that has been key in allowing for the NG’s participation in the (August) competitive portion of the fishery (TJFB, 2017b). In the most recent call to the Minister of Fisheries and Oceans to address the “inequity,” the TJFB (2019) argued for allocating the increase in the Canadian quota from 2019 to 2020 (from 16,521 to 16,926 t) exclusively to Nunatsiavut. Specifically they argued that the benefits to Nunatsiavut from this 145 t increase would be significantly higher compared to a proportional sharing among all stakeholders and would better serve the commitments and strategies of Canada’s reconciliation agenda (TJFB, 2019). Similar to the efforts for turbot, the TJFB has been recommending an increased allocation to the NG for northern shrimp in SFAs 4 and 5 of minimum 11%, either through an increase in commercial fishing licenses in waters adjacent to the zone or by other means (TJFB, 2017a).
Economic analysis has generally been absent, resulting in fisheries resources being allocated based on unclear criteria and processes. Despite relevant policy objectives in place at the federal level, allocation processes remain vague and decisions are not currently assessed against these objectives or criteria. We therefore see value in looking at these arguments through an economic lens and specifically in examining the economic effects of changes in allocations. In doing that, we encompass equity considerations which are part of the federal government’s mandates and therefore at the forefront of the discourse for changes in allocations. Although, missing data and knowledge gaps limit our ability to assess with accuracy the economic impact of changes, we argue that such analyses are important in advancing the discourse to one that includes economic considerations and may offer avenues for more transparency in decision-making.
Input—Output Analysis
In what follows, we use economic multipliers to examine the effect that changes in quota allocations to Nunatsiavut may have for the rest of the economy at a local and provincial and national level. In the decision-making process for quota allocations, DFO does not formally consider the overall economic impacts of the fishing industry which are driven by direct, indirect, and induced effects. We argue that, despite the limitations of the approach in capturing net benefits, for the purposes of transparency an analysis that encompasses the impacts to the economy needs to be factored into decisions for quota allocations.
In recognition of the “downstream effects” of fisheries to other sectors in the economy, fisheries economists have used different methods to capture the full picture of the sector’s economic impacts (Dyck and Sumaila, 2010). Examples of these methods include input-output models, fishery economic assessment models, social accounting matrices and computable general equilibrium models (see Loveridge, 2004; Seung and Waters, 2006 for a review of such methods and their suitability for different purposes). Input-output (I-O) models are among the most-commonly used approaches since they are straightforward and easy to compute and communicate to policy-makers and stakeholders (Hoagland et al., 2015). Their application ranges widely; they have been used to illustrate the outcome of marginal changes for example in the value of a fleet’s output to the total economic impacts as well as at much larger scales to capture the impact of unreported catches and illicit seafood trade at national and global scales (Sumaila et al., 2020).
Following the many examples in the literature supporting the use of I-O models to illustrate the outcome of marginal changes (Leung and Pooley, 2001; Dyck and Sumaila, 2010), we have chosen to use an I-O approach to show the effects of an increase in the turbot and shrimp quota allocation to the NG for the broader economy. Note though that from a welfare economics perspective I-O models come with several limitations, and economists have generally advised against using them to make allocation decisions. Their major limitation is that they do not capture consumer and producer surplus5 as they represent transfer payments, essentially referring to financial transactions. Therefore they cannot provide an estimate for net benefits or assess changes in net economic value (Hoagland et al., 2005). Income impacts have been used as a proxy for surplus but may provide an overestimate of consumer or producer value. Additionally, they do not encompass economic efficiency considerations such as minimizing costs of production or optimally allocating the resource (Edwards, 1990; Kirkley et al., 2000). However, despite all their limitations they provide a useful framework to understand the linkages of an economic sector to the rest of the economy as well as to assess how management may affect economic activity.
Economic multipliers are commonly used to illustrate the many linkages of the fish production industry. The multipliers are a factor by which one can multiply the value of final demand for the output of the fishing (or any other economic) activity to illustrate how it contributes to total economic output. Using these multipliers is important in order to be able to capture not only the direct impacts of the fishing activity, which national accounts report, but also the indirect and induced impacts, which if left aside may understate the contribution of the fishing industry to the economy (Dyck and Sumaila, 2010).
Direct impacts include the production of fisheries (landed value), income, employment, taxes, and expenditure associated to operations of harvesting and processing (employees, contractors, service providers, etc.). Indirect impacts arise from the changes in all the aforementioned categories that occur in backward linked industries (e.g., suppliers to the processing industry). Induced impacts measure the changes in household demand, or the value of production induced by a change in household income (for example increased expenditure due to increased wages). These households are linked to the fishing industry either directly (through employment in the harvesting or processing sector) or indirectly (by backward linked industries to harvesting or processing), so the changes in household income are generated from the direct or indirect impacts described earlier (see also Statistics Canada, 2005 for a more detailed overview of the logic behind the I-O structure of the Canadian economy).
Using estimates provided by ATN (2018) for the value of the fisheries sector in Nunatsiavut in 2017, we obtain multipliers for the Nunatsiavut region and estimate the economic impact of current and recommended allocations to the NG for turbot and northern shrimp. Since the primary data and the model for the value components and impact estimates in ATN (2018) were not available to the authors, the results should be interpreted with care. We therefore suggest that this shall be seen as an academic exercise that may offer insights into new considerations that need to factor in allocation decisions, rather than a prescriptive analysis.
To get a comparative perspective with the Newfoundland and Labrador province, we also estimate the economic impact for the whole province considering the scenarios of current and recommended by the TJFB shrimp and turbot quotas. We use the within-province multiplier for fishing, hunting and trapping (Statistics Canada, 2020, BS114), following the logic in Teh and Sumaila (2019). As opposed to Teh and Sumaila (2019) though who use the simple multiplier, we use the total multiplier that includes all 3 multipliers, the direct, indirect and induced. Statistics Canada does not provide estimates for the within—province multipliers Type I and Type II. Additionally, we focus on only four components of the economic impact for which the within province multipliers available from Statistics Canada match those available for Nunatsiavut (ATN, 2018). These economic impact components include sales, labor income, GDP at market prices and imports.
We estimate the Nunatsiavut multipliers as the fraction of the sum of direct, indirect and induced impacts in Nunatsiavut to total impacts in Canada. For estimating the direct value from sales of turbot and shrimp fisheries, we assume a price of $1.85/lb for turbot (2019 average price) and $1.67/lb for shrimp (2019 average price across all seasons, FFAW, 2019). Table 1 shows in the first two columns the NG’s current allocations in tons for turbot (2019) in 2+3KLMNO and shrimp (2018/2019) in SFAs 4 and 5, along with the increased allocations that the TJFB has been advising for in the past 2 years, NG advised (I) and NG advised (II). In choosing to use for the purposes of this exercise, the TJFB’s lines of recommendation for increased allocations to the NG, we do not consider capacity limitations of the locally available fleet and assume that either these have been factored in the TJFB’s recommendations or that they can be overcome (e.g., through vessel leases or other transferability mechanisms that allow capturing fishery rents). The last two columns then show the corresponding value for turbot and shrimp under the current allocation and the two scenarios of allocations that the TJFB has been recently advising for.
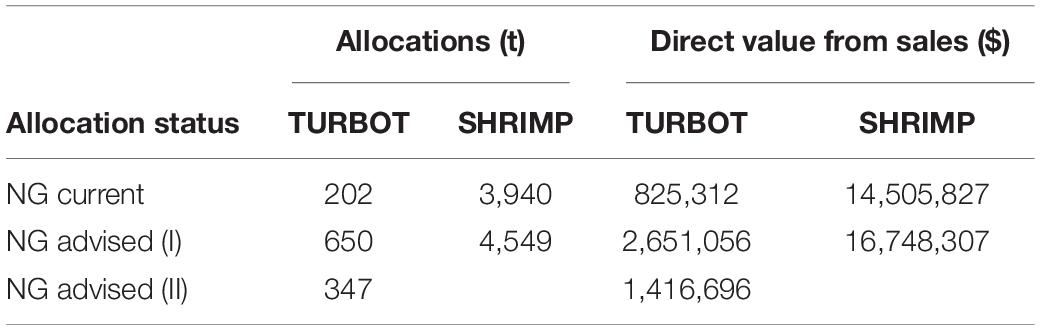
Table 1. Current and advised allocations (in t) and Direct value (in $ CAD) of sales for current and advised turbot (2+3KLMNO) and shrimp allocations (SFA 4, 5) to the Nunatsiavut Government (NG).
We further assume that the value of turbot and shrimp account for 6.83 and 70.78% of the total fisheries value in Nunatsiavut, respectively (ATN, 2018) and that the same shares apply to the value that these fisheries generate for household income, GDP and imports. Figure 3 shows, for each allocation scenario, the four-component economic impact that allocations to the NG in the turbot and northern shrimp fisheries generate, along with the regional impact for the province of Newfoundland and Labrador (NFL).
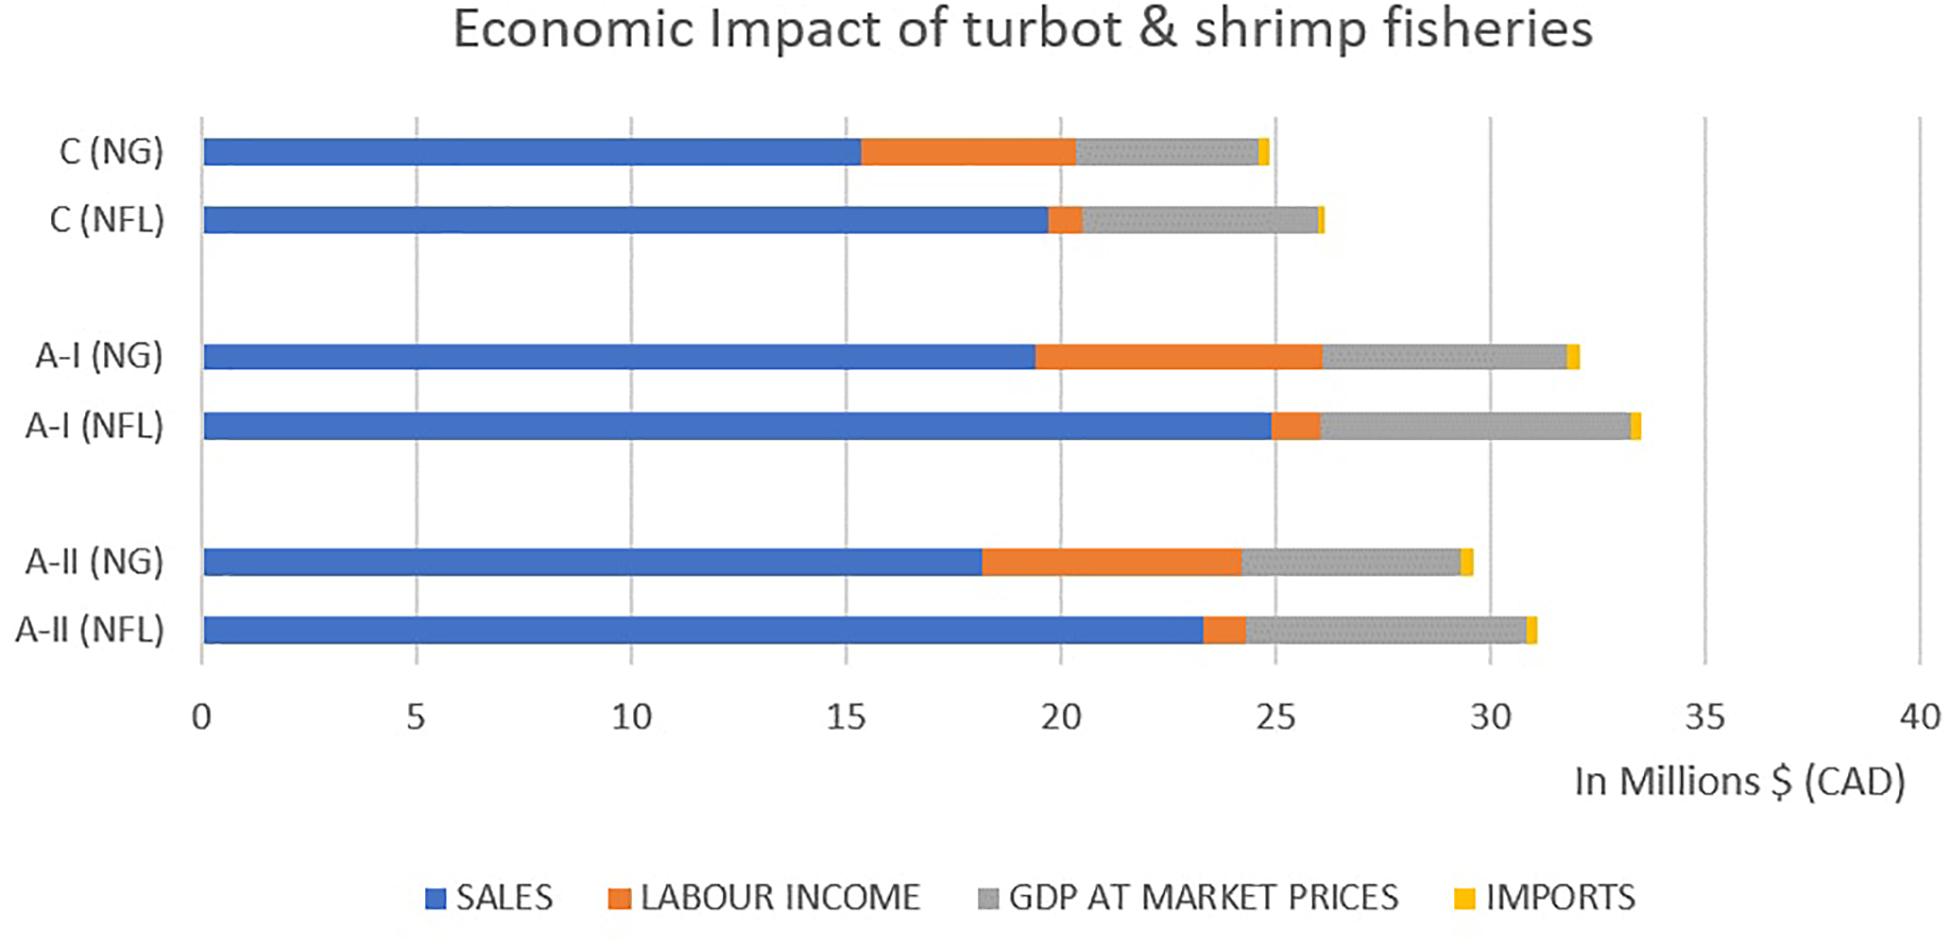
Figure 3. Economic Impact of Nunatsiavut fisheries (NG), including impacts for the Newfoundland province (NFL) under 3 status of Allocations: (1) Current (C), (2) Advised-I (A-I), and (3) Advised II (A-II) Note that the magnitude of sales in this graph is likely an underestimate (18–19%) which results in a difference in the share of sales in the total economic impact of about 3–4%. The discrepancies in shares are due to differences in the price of shrimp used to derive impacts on labor income, GDP at market prices and imports which were estimated for 2017, using 2016 prices (ATN, 2018). In this example, we have used 2019 prices for sales to reflect the value of current and recently recommended allocations but have used estimates for labor income, GDP and imports provided in ATN (2018).
This exercise illustrates that the economic impact from changes in allocations goes beyond just the direct value generated from fisheries and encompasses a number of other components which may factor into decision-making. Specifically, decisions should be made based on the regulators’ goals which may have to do for example with boosting household income regionally or increasing employment, revenues from provincial or federal taxes etc. In this exercise, we have not included the economic impact from employment insurance (EI) benefits generated from the fisheries, but given the seasonality of these fisheries and the heavy reliance on EI benefits in the region, this merits consideration as well. Understanding the regional economic impacts of fisheries production is also important when decisions are made for allocations to stakeholders from different regions. Additionally, in trying to administer requests from different stakeholder groups for changes in allocations of multiple fisheries, considering the economic impact of each fishery separately may prove useful in adjusting these allocations to achieve the desired socioeconomic goals.
Inequality Aversion
As discussed earlier, the AI is a very commonly used inequality indicator that accounts for society’s aversion to inequality. It can be used for better understanding the implications for socioeconomic welfare from alternative policy options. It captures the overall welfare loss to society resulting from an unequal distribution. Typically, it is used to assess economic impacts of policies across groups with different incomes. The metric depends on the degree to which society is averse to inequality, which is reflected through a weighting parameter, ε, known as the inequality aversion parameter. Higher values of ε indicate larger social utility or peoples’ willingness to accept smaller incomes in exchange for a more equal distribution (Afonso et al., 2015). An increasing ε, makes the index more sensitive to changes at the lower end of the income distribution while a declining ε makes it more sensitive to changes in the upper end of the distribution.
In this case, we are agnostic about the distribution of income among fishers. For the purposes of this exercise and in the absence of better information, we will be using the income generated from each stakeholder group to which turbot are allocated. Using a price of 1.85$/lb and converting the allocations to each group (Table 1) into lbs, we find the income generated for each stakeholder for turbot in 2+3KLMNO. Note that, in order to get a more holistic perspective for both areas 2+3K and 3LMNO, we have now included, in our estimates for area 3LMNO the groups of Offshore Enterprise Allocation (O-EA) holders (>100′) and Scandinavian Long Liners (>100′).
A moderate inequality aversion, ε = 0.5, yields Atkinson values 0.376 for turbot in 2+3KLMNO. This implies that 37.6% of total income could be “sacrificed” in order to have equal incomes or, better put, it is the fraction of income that could be sacrificed without reducing social welfare if income were equally distributed. Alternatively, 62.4% of the present income would be required to realize the same social welfare if it were equally distributed.
We further examine four allocation scenarios for the turbot fishery to illustrate the shifts in the Atkinson inequality metric. In scenario B-I the NG is getting access to, the long-now recommended, 650 t as a transfer from either the fixed gear < 65′ sector (fg < 65′) or the O-EA holders. These two options are the only transfers across sectors that ensure all current allocation holders continue to access the fishery. In scenario B-II the TAC increases by 405 t (2019–2020 increase, TJFB, 2019), and the increase is distributed uniformly across stakeholders so that each one of them gets a share based on the percent of turbot share they already hold. In scenario B-III, the 405 t TAC increase is allocated exclusively to the three more disadvantaged groups (mg 65′–100′, mg <65′ and NG) based on their predetermined shares. Last, in scenario B-IV, the TAC increase of 450 t is allocated exclusively to the NG.
We then estimate, in Table 2, the outcomes for varying degrees of inequality aversion, from medium to strong aversion (ε = 0.5, 1, 1.5, and 2). Note that for an Atkinson value of zero (At = 0), either outcomes need to be perfectly evenly distributed or ε needs to equal zero. When ε equals zero, this implies that society is indifferent between transfers between any two entities (Maguire and Sheriff, 2011) or that society gains no utility at all by complete redistribution of income or resources, which results in a zero AI. For an increasingly unequal distribution or as ε approaches infinity (ε→∞), meaning that society places more weights on transfer to entities with lower income or resources, the Atkinson value approaches 1 (At → 1). This means that complete redistribution of income or resources leads to infinite social utility gained. Therefore, under certain conditions of society’s inequality aversion (ε), lower values of At point at a more equal distribution compared to higher values. Note that since the choice of ε is normative, it is a common practice to calculate AIs for several ε values to determine how sensitive outcomes are to the choice of inequality aversion.
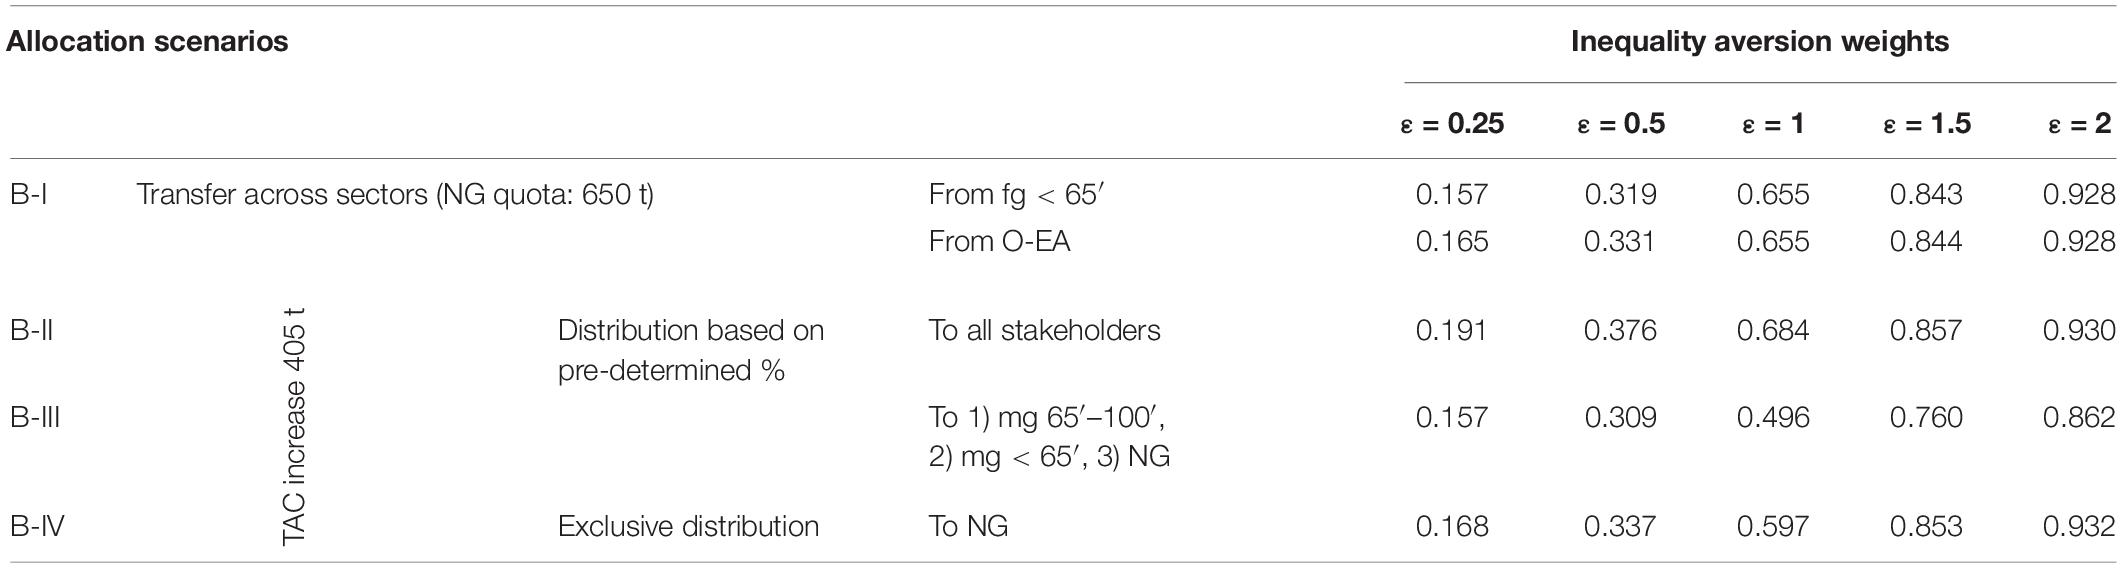
Table 2. Atkinson index (At) estimates for different allocation scenarios under varying aversion to inequality.
In a societal setting with weak inequality aversion (e.g., ε = 0.25), in order to fulfill the NG’s request for increased quota (650 t) and under equal distribution considerations, the preferred allocation scenario among those examined, would be to transfer quotas from the fixed gear < 65′ fleet directly to the NG. As society’s inequality aversion increases though, the fleet sector from which the transfer happens becomes less important (ε = 1, 1.5, 2). Alternatively, in the existence of a TAC increase (405 t), the additional quota could be distributed across the three most disadvantaged stakeholder groups according to their pre-determined shares (Scenario B-III, 3.36% for mg 65′–100′, 32.66% for mg < 65′ and 63.98% for the NG). These two policies yield the exact same outcome in terms of income inequality, under conditions of weak inequality aversion in society (Table 2, At = 0.157). As society’s aversion to inequality increases, the allocation in scenario B-III becomes more favorable. The least favorable scenario, in the case of a TAC increase, is to distribute the additional quota based on the pre-determined share of all stakeholders/allocation holders (scenario B-II). This holds for all degrees of inequality aversion and as expected, becomes even less favorable as society’s inequality aversion increases.
Had information been available on the income distribution of fishers, it would have been possible to compare the outcomes for scenarios of allocations using different inequality aversion weights. In the absence of this information we use instead for the purposes of this exercise, household incomes in Canada. Table 3 shows in the first column the income quintiles for the household income in Canada (2016) along with Atkinson index values for varying degrees of inequality aversion. The main assumption behind this metric is that marginal utility of income is diminishing across groups with increasing median income (Farrow, 2011; Hoagland et al., 2015). Marginal utility for income group i can be expressed as where yi is some measure of group income and λ a constant. Inequality can then be expressed relative to the marginal utility of median income for all stakeholders as , so that welfare gains or losses to low income groups are weighted more heavily relative to the median and the opposite holds for high income groups.
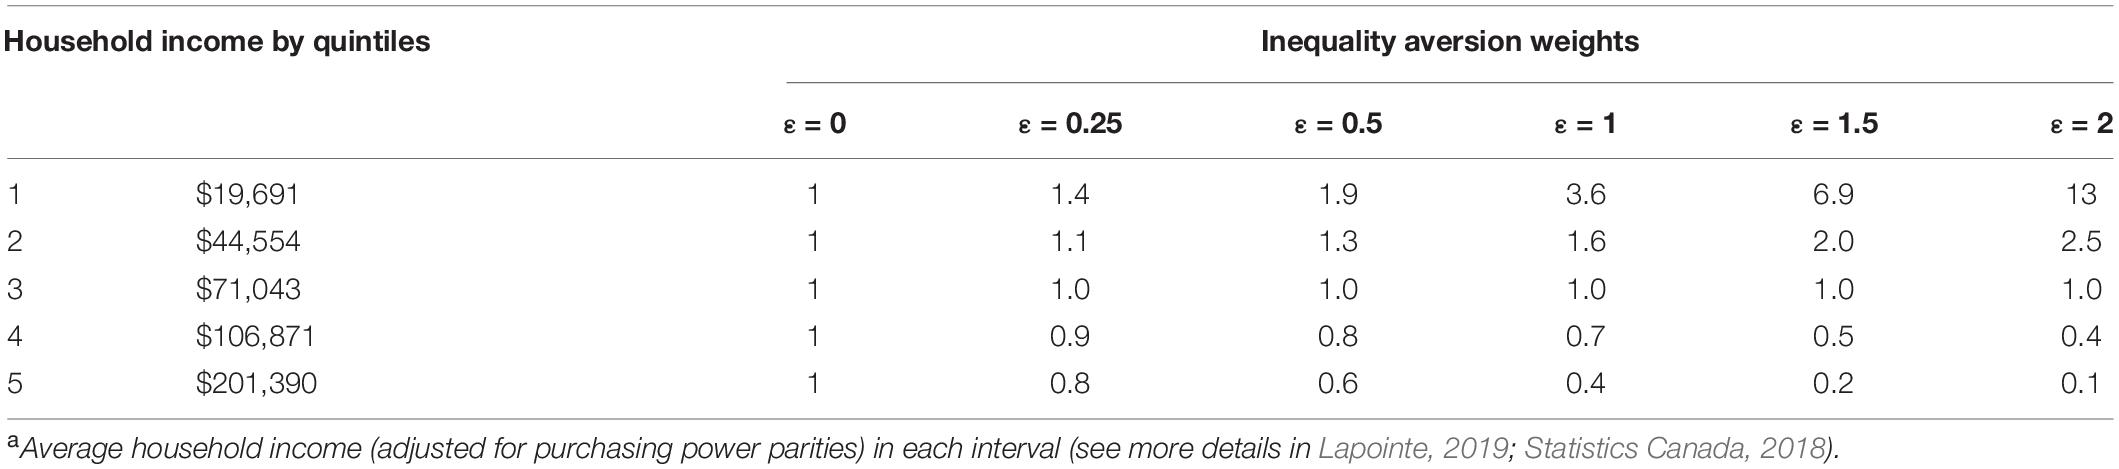
Table 3. Household Income quintilesa (in $ CAD) (2016) (Lapointe, 2019) and Atkinson value estimates for varying inequality aversion weights.
As an example, consider that fishers in one of the stakeholder categories to which DFO allocates the turbot quota belongs to the lowest quintile while the rest of the stakeholder groups are average income holders. In this example, we will be assuming that those fishing under the NG license are the ones in the lowest income quintile. The most recent census information, available by Statistics Canada for 2015, does not provide sufficient evidence that the median household total income in Nunatsiavut communities is among the lowest in the Newfoundland and Labrador province. However, a closer look at Census Division No. 11 (Statistics Canada, 2017, 2019b) and the literature describing poverty and vulnerability conditions in the region (Duhaime and Édouard, 2015; Government of Canada, 2020) suggests that this may be an assumption with empirical merit6.
Figure 4 shows, what the local and total welfare (in this exercise in terms of value produced from fisheries) would look like in the hypothetical case where the turbot fishers under NG’s communal license are in the lowest income quintile with all other fishers in the third income quintile.
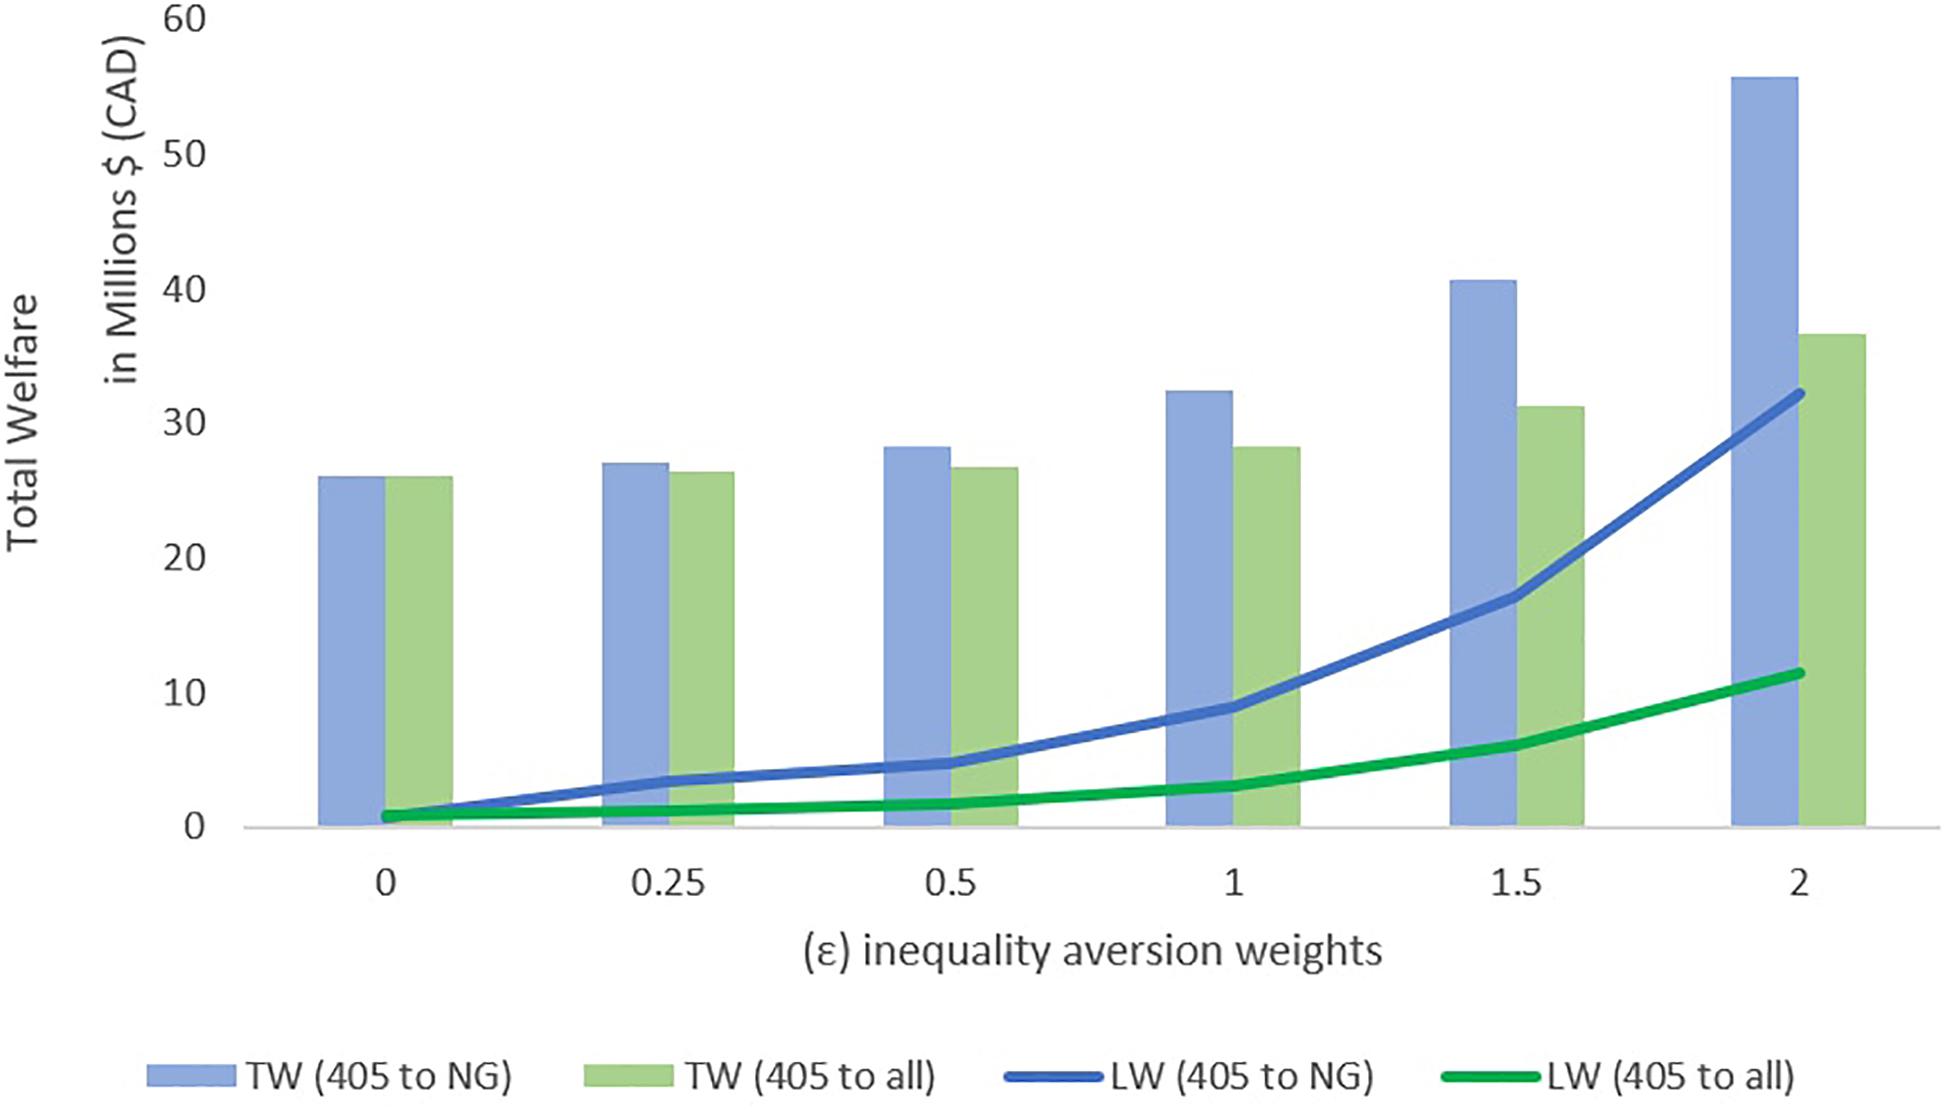
Figure 4. Local welfare (LW), in lines, and Total welfare (TW), in columns, produced from the turbot 2+3KLMNO fishery under varying inequality aversion weights for scenarios B-II (in green, distribution of TAC increase to all stakeholders) and B-IV (in blue, distribution of TAC increase to the NG only).
The ratio of weights for the lowest quintile compared to the highest quintile increases from 1:1 when ε = 0, to 1.75 when ε = 0.25, to 9 when ε = 1 and may reach up to 130 when ε = 2, the most “extreme” level of inequality aversion in this example. This type of analysis brings to surface the effects of allocations which are distributionally weighted. Decisions on ways of allocating an increase in TAC, would then need to factor in the magnitude of distributional weights.
Total welfare is higher when the increase in TAC is allocated exclusively to the NG compared to distributing it across all stakeholders according to their predetermined shares in the fishery. Notice though that with increasing inequality aversion, the difference between the two allocation mechanisms becomes larger.
While this example is again an academic exercise rather than an actual measure of the effects of the existing inequality in the allocation mechanism, it becomes clear why a sensitivity analysis to the assumption of equal marginal utility of income (ε = 0) is important (Farrow, 2011) or in other words why an unweighted analysis may be misguiding allocation policies.
Discussion and Conclusion
In this paper, we have addressed equity concerns for the NG’s access to commercial fisheries, suggesting that fisheries management authorities should consider using equity tools in their allocation decisions if they are to meet their commitments in federal and international mandates. Depending on the definition taken for equity and the scope within which it is considered, a variety of such tools are available to decision-makers. We discuss a few of the most prominent ones in the fisheries literature and focus on selected approaches that fit the NG’s concerns and for which the data available to us allow for such an exercise. We acknowledge that, given data limitations, our estimates of economic impacts and scenarios for the effects of shifts in allocations were developed as an academic exercise and should be seen through this lens. Nevertheless, we strongly recommend moving the tools and approaches discussed in this paper into the actual decision-making framework. Making the use of such tools more transparent can also help build trust in federal authorities, increase understanding of the reasoning behind allocation decisions and also possibly reduce future conflicts among stakeholders in the fisheries. This may allow regional bodies, such as the NG, to develop policies supporting their communities in fully capturing the benefits from their adjacent fisheries and better understanding the long-term economic benefits of additional investments in the sector.
Our focus is limited to the turbot and northern shrimp stocks which are both adjacent to LISA but to which the NG enjoys limited access to. It is important though to recognize the interdependencies between all four commercial fisheries in Nunatsiavut. Access to the Arctic char and snow crab fisheries may be exclusive to Nunatsiavut but are influenced in direct and indirect ways by how well the turbot and shrimp fisheries fare. Examples of direct ways include contributions to the Commercial Fisheries Fund which has the broader scope of strengthening Nunatsiavut’s fishing sector. The Arctic char fishery, which ranks high in the priorities of Labrador Inuit primarily for cultural reasons, suffers from insufficient scientific funding and attention from DFO, which has led to significant knowledge gaps on the stocks and their spatial distribution, especially after the early 1990s. Increased access to turbot and shrimp, and therefore profitability, subject to market conditions, may allow for more investments in research on behalf of the NG, beyond what DFO is willing to invest. More resources from increased access to turbot and shrimp may also allow for investments in better monitoring opportunities for all fisheries in Northern Labrador where the availability of observers is very limited. Additionally, it may contribute to the development of fleet capacity locally not only for those two fisheries but also for the snow crab fishery for which Nunatsiavut designates also go into leasing vessel arrangements with harvesters elsewhere. It is important to be mindful though that perspectives within Labrador Inuit communities differ, with some designates for example not seeing vessel-ownership as necessary because the current arrangements (e.g., for shrimp) allow them to use their time for other traditionally and culturally important activities (Foley et al., 2019). However local vessel ownership is generally seen as contributing positively to building local capacity and gaining sovereignty over adjacent fisheries. These are just a few examples of direct and indirect ways in which increased access may be seen as a path to increased sovereignty providing the ability to address locally important priorities and promoting the establishment of institutions that may advance fisheries locally.
Despite the LILCA’s provisions for local control and governance of resources and the recognition of these provisions in the mandates of the Federal Government’s resource management frameworks, in many instances there has been a failure in realizing this potential. Canada retains the power to control access, determine access rules, and allocate property rights to different stakeholders, because decisions are subject to Ministerial Discretion. Despite consultations with stakeholder groups, which are institutionalized in fishery management plans, the decision-making process on allocations is often unclear and based on non-transparent considerations. That is similar to several reported cases in the literature where quota distribution is determined based on the economic and political power that different fleet sectors may wield (Gray et al., 2011).
Additionally, DFO’s Policy and Economic Analysis Division does not formally consider the effects that quota cuts, changes in management or changes in allocations may have for fisheries dependent communities, such as those of Nunatsiavut that we have examined in this paper. Recent amendments to the Fisheries Act, however, do allow the Minister to incorporate socioeconomic implications as well as IK in decision-making. In order for the Minister to do so, however, this information needs to be collected, calculated, or provided. In addition to the Fisheries Act, several other federal government mandates put emphasis on inclusion of IK for guiding and informing science and management. These mandates cover both commercial and subsistence harvesting of marine resources, and, while there are stronger voices and literature that support the need to include and prioritize IK for subsistence harvest (Kourantidou et al., 2020), such is not the case for commercial fisheries. This is true despite strong evidence that ignoring IK can be detrimental for the conservation of stocks [e.g., see Milich (1999) for an example of undervaluation of IK in the Newfoundland (François) cod fishery]. The cod fishery collapse in Newfoundland and Labrador has also undermined trust on behalf of fishers in top-down management approaches given past failures to predict stocks (Schott, 2004). Past colonial practices in resource governance in Nunatsiavut and all across Inuit Nunangat (Felt et al., 2012; Keenan et al., 2018; Kourantidou et al., 2020) perpetuate mistrust and create barriers to fruitful partnerships between local users and resource managers which may come at the cost of mismanaging the fishery.
The role of co-management boards in confronting such colonial legacies by ensuring the uptake of IK and accommodating local user perspectives in decision-making is critical for building trust and reconciling contrasting views on fisheries management. Co-management also helps promote a long-term view to management, which is essential to maintaining healthy fish stocks and distributing rents in an equitable manner. In such decentralized approaches to fisheries governance, the role of provincial governments as part of co-management is seen as key, since they can help provide input into regional development issues and also education and communication between fishers, communities and scientists (Schott, 2004). Their involvement is seen as critical for income redistribution and specifically to ensure that wealth is evenly distributed. Schott (2004) warns though that providing them with more power could potentially be detrimental and suggests instead shifting authority and responsibility to resource users, because their behavior is influenced by management rules and institutions and having them cooperate is particularly important.
Co-management in Nunatsiavut is designed to involve the participation of local, provincial and federal government actors. The TJFB actively prioritizes the inclusion of local resource users in the co-management process as well as in its annual recommendations to the federal Minister. A lack of transparency though in the decision-making process at the ministerial level limits the potential of the co-management process. Additionally, as we have argued in this paper, the lack of transparency regarding economic and equity considerations to support decisions on access and allocation decisions allows for misinterpretations about what may factor into decision-making in practice.
Data Availability Statement
The original contributions presented in the study are included in the article/Supplementary Material, further inquiries can be directed to the corresponding author/s.
Author Contributions
MK and MB conceptualized the idea for the study. MK and PH designed the methodological part of the study. MK conducted the analysis and wrote the first draft. AD contributed the regional perspective and edited the manuscript accordingly. All authors contributed to the article, critically revised, and approved the submitted version.
Funding
This research was undertaken with funding from the Canada First Research Excellence Fund through the Ocean Frontier Institute (MK and MB) and the Johnson Endowment of the Woods Hole Oceanographic Institution’s (WHOI) Marine Policy Center (PH).
Conflict of Interest
The authors declare that the research was conducted in the absence of any commercial or financial relationships that could be construed as a potential conflict of interest.
Acknowledgments
The authors would like to thank Todd Broomfield, Director for Renewable Resources for the Nunatsiavut Government, for conversations over the past two years that influenced this work and Di Jin from the WHOI Marine Policy Center for providing feedback on the methodology.
Supplementary Material
The Supplementary Material for this article can be found online at: https://www.frontiersin.org/articles/10.3389/fmars.2021.590213/full#supplementary-material
Footnotes
- ^ Canadian fisheries waters within the portions of Northwest Atlantic Fisheries Organization Divisions 2G, 2H, and 2J adjoining and lying due eastward of the Zone.
- ^ The interests of Nunatsiavut regionally include: Communal and competitive, special and enterprise allocations as well as licenses to the Nunatsiavut Government, individuals from the region, the Torngat Fish Producers Cooperative (Torngat Co-op) and the Nunatsiavut Group of Companies (NGC) who have obtained the licenses independently (including their subsidiaries such as Pikalujak Fisheries Ltd or coalitions such as the Northern Coalition share to which the Torngat Co-op and the NGC are part of).
- ^ The NG has access to its quota either through its allocation or through the competitive allocation. For its allocation, the NG may designate multiple fixed gear inshore vessels to harvest its allocation simultaneously or may request DFO’s authorization for eligible fixed gear license holders to harvest it. The competitive allocation is in the competitive fixed gear fishery and falls under NG’s three communal commercial enterprises.
- ^ For the 2019/20 the shares are 8.62% (935 t) and 9.9% (2,188 t) for SFA 4 and 5, respectively, according to data provided by the Torngat Secretariat.
- ^ Surpluses may include other ocean uses such as recreation, subsistence, marine transportation or non-use values such as biodiversity protection. For a full picture of their economic value one would need to estimate their net present value (Hoagland et al., 2005). This becomes particularly relevant in Nunatsiavut where the value of fisheries encompass food security and sovereignty, cultural connections, social conditions attached to employment and many other, not easy to capture intangible values (Bennett et al., 2018; Kourantidou et al., 2020).
- ^ In 2015, the median total income of households in Division No. 11 was $70,315 ($67,272 in the province) with 21.1% of the population in low income (15.4% in the province) (Statistics Canada, 2017, 2019b). See also low income in Aboriginal Population Profile for census Division No. 11 (Statistics Canada, 2019a), including low-income measure and low-income cut-offs after tax. Previous studies have also indicated that the poverty rate in Nunatsiavut is 4–5 times higher than the one suggested by Statistics Canada (24.4–24.7%, as opposed to 5.4%) (Duhaime and Édouard, 2015; Statistics Canada, 2017).
References
Abbott, J. K. (2015). Fighting over a red herring: the role of economics in recreational-commercial allocation disputes. Mar. Resource Econ. 30, 1–20. doi: 10.1086/679464
Adelaja, A., Menzo, J., and McCay, B. (1998). Market power, industrial organization and tradeable quotas. Rev. Ind. Organ. 13, 589–601. doi: 10.1023/a:1007799229046
Afonso, H., LaFleur, M., and Alarcón, D. (2015). Inequality Measurement: Development Issues No. 2. New York, NY: UN.
Armstrong, C. W., and Clark, D. J. (1997). Just fishing? Equity and efficiency in fisheries management regimes. Mar. Resource Econ. 12, 203–220. doi: 10.1086/mre.12.3.42629196
Artelle, K. A., Zurba, M., Bhattacharrya, J., Chan, D. E., Brown, K., Housty, J., et al. (2019). Supporting resurgent Indigenous-led governance: a nascent mechanism for just and effective conservation. Biol. Conserv. 240:108284. doi: 10.1016/j.biocon.2019.108284
ATN. (2018). Nunatsiavut Fisheries Socio-Economic Analysis. Halifax, NS: Group ATN Consulting Inc., 19.
Barker, T. (2018). Labrador Harvesters Want to See Adjacency Explicitly Incorporated into New Regulations. Available at: https://www.saltwire.com/news/provincial/labrador-harvesters-want-to-see-adjacency-explicitly-incorporated-into-new-regulations-226567/?location=newfoundland-labrador (accessed January 30, 2020).
Bellanger, M., Macher, C., and Guyader, O. (2016). A new approach to determine the distributional effects of quota management in fisheries. Fish. Res. 181, 116–126. doi: 10.1016/j.fishres.2016.04.002
Bennett, N. J., Kaplan-Hallam, M., Augustine, G., Ban, N., Belhabib, D., Brueckner-Irwin, I., et al. (2018). Coastal and indigenous community access to marine resources and the ocean: a policy imperative for Canada. Mar. Policy 87, 186–193. doi: 10.1016/j.marpol.2017.10.023
Brice-Bennett, C. (1977). Our Footprints are Everywhere: Inuit Land Use and Occupancy in Labrador, ed. C. Brice-Bennett, (Newfoundland and Labrador: Labrador Inuit Association).
Bromley, D. W. (2009). Abdicating responsibility: the deceits of fisheries policy. Fisheries 34, 280–290. doi: 10.1577/1548-8446-34.6.280
Carothers, C. (2011). Equity and access to fishing rights: exploring the community quota program in the Gulf of Alaska. Hum. Organ. 70, 213–223. doi: 10.17730/humo.70.3.d686u2r7j2267055
Carothers, C., and Chambers, C. (2012). Fisheries privatization and the remaking of fishery systems. Environ. Soc. 3, 39–59.
CIRNAC. (2005). Labrador Inuit Land Claims Agreement Act (S.C. 2005, c. 27). Land Claims Agreement Between the Inuit of Labrador and Her Majesty the Queen in Right of Newfoundland and Labrador and Her Majesty the Queen in Right of Canada. Gatineau, QC: CIRNAC.
CIRNAC. (2016). United Nations Declaration on the Rights of Indigenous Peoples. Gatineau, QC: CIRNAC.
Connor, R. (2000). Trends in fishing capacity and aggregation of fishing rights in New Zealand under individual transferable quotas. FAO Fish. Techn. Paper 2, 267–278.
Coombs, R., Coffey, J., Dale, A., and Snook, J. (2010). Northern Shrimp Policy Paper: An Analysis of the Development and Management of the Nunatsiavut Pandalus Borealis Fishery. Torngat Wildlife, Plants & Fisheries Secretariat Series 2010/03. Happy Valley-Goose Bay, NL: Torngat Wildlife, Plants & Fisheries Secretariat.
Coombs, R., Dale, A., and Snook, J. (2011). A Socio-Economic Analysis of the Nunatsiavut Snow Crab Fishery. Happy Valley-Goose Bay, NL: Torngat Wildlife, Plants & Fisheries Secretariat, 43.
De Silva, A. (1999). Wage discrimination against natives. Can. Publ. Policy 25, 65–85. doi: 10.2307/3551402
Denny, S., and Fanning, L. M. (2016a). A Mi’kmaw perspective on advancing Salmon Governance in Nova Scotia, Canada: setting the stage for collaborative co-existence. Int. Indig. Policy J. 7:4.
Denny, S., and Fanning, L. (2016b). Balancing community autonomy with collective identity: Mi’kmaq decision-making in Nova Scotia. Can. J. Native Stud. 36, 81–106.
Department of Justice (2009). Aboriginal Communal Fishing Licences Regulations (SOR/93-332). Ottawa, ON: Department of Justice.
Department of Justice (2017). Constitution Acts 1867 to 1982. Part II, Rights of the Aboriginal peoples of Canada. Ottawa, ON: Department of Justice.
Department of Justice. (2018). Principles Respecting the Government of Canada’s Relationship With Indigenous Peoples. Ottawa, ON: Department of Justice.
DFO. (2018). Northern Shrimp and Striped Shrimp – Shrimp Fishing Areas 0, 1, 4-7, The Eastern and Western Assessment Zones and North Atlantic Fisheries Organization (NAFO) Division 3M. Ottawa, ON: Fisheries and Oceans Canada.
DFO. (2019a). Aboriginal Communal Licenses/Conditions, Nunatsiavut Government, Commercial Shrimp (prawn) (Pandalus borealis). Ottawa, ON: Fisheries and Oceans Canada.
DFO. (2019b). Integrated Fisheries Management Plan - Groundfish Newfoundland and Labrador Region NAFO Subarea 2 + Divisions 3KLMNO. Ottawa, ON: Fisheries and Oceans Canada.
DFO. (2019c). Integrated Fisheries Management Plan. Scallop - Newfoundland and Labrador Region. Ottawa, ON: Fisheries and Oceans Canada.
DFO. (2019d). Integrated Fisheries Management Plan - Snow Crab, Newfoundland and Labrador Region. Ottawa, ON: Fisheries and Oceans Canada.
Duhaime, G., and Édouard, R. (2015). Monetary poverty in inuit Nunangat. Arctic 68, 223–232. doi: 10.14430/arctic4481
Dupont, D. P., and Phipps, S. A. (1991). Distributional consequences of fisheries regulations. Can. J. Econ. 24, 206–220. doi: 10.2307/135487
Dyck, A. J., and Sumaila, U. R. (2010). Economic impact of ocean fish populations in the global fishery. J. Bioecon. 12, 227–243. doi: 10.1007/s10818-010-9088-3
Edwards, S. F. (1990). An Economics Guide to Allocation of Fish Stocks Between Commercial and Recreational Fisheries. NOAA Technical Report NMFS 94. Washington, DC: NOAA.
Eythórsson, E. (2000). A decade of ITQ-management in Icelandic fisheries: consolidation without consensus. Mar. Policy 24, 483–492. doi: 10.1016/s0308-597x(00)00021-x
FAO. (2012). Voluntary Guidelines on the Responsible Governance of Tenure of Land, Fisheries and Forests in the Context of National Food Security. Rome: FAO.
Farrow, S. (2011). Incorporating equity in regulatory and benefit-cost analysis using risk-based preferences. Risk Anal. Int. J. 31, 902–907. doi: 10.1111/j.1539-6924.2010.01474.x
Felt, L., Procter, A. H., and Natcher, D. C. (2012). Settlement, Subsistence, and Change Among The Labrador Inuit: The Nunatsiavummiut Experience, Vol. 2. Winnipeg: University of Manitoba Press.
Foley, P., and Mather, C. (2016). Making space for community use rights: insights from “community economies” in Newfoundland and Labrador. Soc. Nat. Resources 29, 965–980. doi: 10.1080/08941920.2015.1089611
Foley, P., Mather, C., Dawe, N., and Snook, J. (2019). “Creative and constrained hybridisations in subarctic Inuit communities: Communal fishery development in Nunatsiavut, Canada,” in Towards Coastal Resilience and Sustainability, eds C. P. Heidkamp and J. Morrissey, (Abingdon: Routledge), 309–326. doi: 10.4324/9780429463723-19
Foley, P., Mather, C., Morris, R., and Snook, J. (2017). Shrimp Allocation Policies and Regional Development Under Conditions of Environmental Change: Insights for Nunatsiavutimmuit. St. John’s, NL: Memorial University of Newfoundland.
Gastwirth, J. L. (2017). Is the Gini index of inequality overly sensitive to changes in the middle of the income distribution? Stat. Publ. Policy 4, 1–11. doi: 10.1080/2330443x.2017.1360813
Government of Canada (2020). Report on Trends in Inuit Communities, 1981 to 2016. Available online at: https://www.sac-isc.gc.ca/eng/1421175988866/1557322849888
Gray, T., Korda, R. C., Stead, S., and Jones, E. (2011). Quota discarding and distributive justice: the case of the under-10 m fishing fleet in Sussex, England. Mar. Policy 35, 122–129. doi: 10.1016/j.marpol.2010.08.010
Gutiérrez, M.-J., and Inguanzo, B. (2019). Contributing to fisheries sustainability: inequality analysis in the high seas catches of countries. Sustainability 11:3133. doi: 10.3390/su11113133
Guyader, O., and Thebaud, O. (2001). Distributional issues in the operation of rights-based fisheries management systems. Mar. Policy 25, 103–112. doi: 10.1016/s0308-597x(00)00041-5
Hamon, K. G., Thébaud, O., Frusher, S., and Little, L. R. (2009). A retrospective analysis of the effects of adopting individual transferable quotas in the Tasmanian red rock lobster, Jasus edwardsii, fishery. Aqu. Living Resources 22, 549–558. doi: 10.1051/alr/2009039
Hoagland, P., Dalton, T. M., Jin, D., and Dwyer, J. B. (2015). An approach for analyzing the spatial welfare and distributional effects of ocean wind power siting: the Rhode Island/Massachusetts area of mutual interest. Mar. Policy 58, 51–59. doi: 10.1016/j.marpol.2015.04.010
Hoagland, P., Jin, D., Thunberg, E., and Steinback, S. (2005). Economic activity associated with the Northeast Shelf large marine ecosystem: application of an input-output approach. Large Mar. Ecosyst. 13, 157–179. doi: 10.1016/s1570-0461(05)80031-x
Kawachi, I., and Kennedy, B. P. (1997). The relationship of income inequality to mortality: does the choice of indicator matter? Soc. Sci. Med. 45, 1121–1127. doi: 10.1016/s0277-9536(97)00044-0
Keenan, E., Fanning, L. M., and Milley, C. (2018). Mobilizing inuit qaujimajatuqangit in narwhal management through community empowerment: a case study in Naujaat, Nunavut. Arctic 71, 27–39.
Kirkley, J., McConnell, K. E., and Ryan, W. (2000). Economic Aspects of Allocating Striped Bass Among Competing User Groups in Virginia. Gloucester Point, VA: Virginia Institute of Marine Science.
Kourantidou, M., Hoover, C., and Bailey, M. (2020). Conceptualizing indicators as boundary objects in integrating Inuit knowledge and western science for marine resource management. Arctic Sci. 6, 279–306. doi: 10.1139/as-2019-0013
Lapointe, S. (2019). Household Incomes in Canada and the United States: Who is Better Off?. Ottawa, ON: Centre for the Study of Living Standards.
Leung, P., and Pooley, S. (2001). Regional economic impacts of reductions in fisheries production: a supply-driven approach. Mar. Resource Econ. 16, 251–262. doi: 10.1086/mre.16.4.42629336
Loveridge, S. (2004). A typology and assessment of multi-sector regional economic impact models. Reg. Stud. 38, 305–317. doi: 10.1080/003434042000211051
Maguire, K., and Sheriff, G. (2011). Comparing distributions of environmental outcomes for regulatory environmental justice analysis. Int. J. Environ. Res. Publ. Health 8, 1707–1726. doi: 10.3390/ijerph8051707
Mathias, J., Ayles, B., Blakney, S., Charles, T., Fast, H., and Irniq, P. (2008). Arctic change and coastal communities. Arctic 61, 3–11.
Matthiasson, T. (1992). Principles for distribution of rent from a ‘Commons.’. Mar. Policy 16, 210–231. doi: 10.1016/0308-597x(92)90082-z
Maxim, P. S., White, J. E., Beavon, D., and Whitehead, P. C. (2001). Dispersion and polarization of income among aboriginal and non-aboriginal canadians. Can. Rev. Sociol. 38, 465–476. doi: 10.1111/j.1755-618x.2001.tb00982.x
Milich, L. (1999). Resource mismanagement versus sustainable livelihoods: the collapse of the Newfoundland cod fishery. Soc. Nat. Resources 12, 625–642. doi: 10.1080/089419299279353
MSC. (2019). MSC Sustainable Fisheries Certification. Canada 0AB 2+3KLMNO Greenland Halibut Bottom Trawl and Gillnet Fishery. Public Certification Report. Geneva: MSC.
NCC. (2019). NunatuKavut Calls on Government of Canada for Fairness and Equity in Fisheries Management Decisions. Available at: https://nunatukavut.ca/article/nunatukavut-calls-on-government-of-canada-for-fairness-and-equity-in-fisheries-management-decisions/ (accessed March 1, 2020).
NG. (n.d.). Fisheries. Harvesting Our Waters. Available at: https://www.nunatsiavut.com/beneficiary-information/fisheries/ (accessed on 7 January 2020)
OAG. (2015). Office of the Auditor General of Canada. Report 3, Implementing the Labrador Inuit Land Claims Agreement. Reports of the Auditor General of Canada. Luton: OAG.
Parliament of Canada (2019). Statutes of Canada 2019 Chapter 14. An Act to Amend the Fisheries Act and Other Acts in Consequence. Bill C-68 (Royal Assent). June 21, 2019. Ottawa, ON: Parliament of Canada.
Patrinos, H. A., and Sakellariou, C. N. (1992). North American Indians in the Canadian labour market: a decomposition of wage differentials. Econ. Educ. Rev. 11, 257–266. doi: 10.1016/0272-7757(92)90056-9
Richmond, L. (2013). Incorporating indigenous rights and environmental justice into fishery management: comparing policy challenges and potentials from Alaska and Hawai′i. Environ. Manag. 52, 1071–1084. doi: 10.1007/s00267-013-0021-0
Schott, S. (2004). “New fishery management in Atlantic Canada: communities, governments, and alternative targets,” in How Ottawa Spends, 2004-2005: Mandate Change and Continuity in the Paul Martin Era, Vol. 25, ed. G. B. Doern, (Montreal, QC: McGill-Queen’s Press-MQUP).
Seung, C. K., and Waters, E. C. (2006). A review of regional economic models for fisheries management in the US. Mar. Resource Econ. 21, 101–124. doi: 10.1086/mre.21.1.42629497
Snook, J., Cunsolo, A., and Morris, R. (2018). “A half century in the making: governing commercial fisheries through Indigenous marine co-management and the Torngat Joint Fisheries Board,” in Arctic Marine Resource Governance and Development, eds N. Vestergaard, B. A. Kaiser, L. M. Fernandez, and J. N. Larsen, (Switzerland: Springer Polar Sciences), 53–73. doi: 10.1007/978-3-319-67365-3_4
Squires, D., Jeon, Y., Grafton, R. Q., and Kirkley, J. (2010). Controlling excess capacity in common-pool resource industries: the transition from input to output controls. Austr. J. Agric. Resource Econ. 54, 361–377. doi: 10.1111/j.1467-8489.2010.00497.x
Statistics Canada. (2005). The Input-Output Structure of the Canadian Economy 2000-2001. Ottawa, ON: Statistics Canada.
Statistics Canada. (2017). Income. Division No. 11, Census division (CD) - Newfoundland and Labrador. Focus on Geography Series, 2016 Census. Ottawa, ON: Statistics Canada.
Statistics Canada. (2019a). Aboriginal Population Profile, 2016 Census Division No. 11, Census division [Census division], Newfoundland and Labrador. Ottawa, ON: Statistics Canada.
Statistics Canada. (2019b). Income. Province of Newfoundland and Labrador. Focus on Geography Series, 2016 Census. Ottawa, ON: Statistics Canada.
Statistics Canada (2020). 2016 Input-Output Multipliers, Provincial and Territorial, Summary Level. Table: 36-10-0113-01. Ottawa, ON: Statistics Canada.
Sumaila, R., Zeller, D., Hood, L., Palomares, M., Li, Y., and Pauly, D. (2020). Illicit trade in marine fish catch and its effects on ecosystems and people worldwide. Sci. Adv. 6:eaaz3801. doi: 10.1126/sciadv.aaz3801
Sumaila, U., and Armstrong, C. W. (2006). Distributional and efficiency effects of marine protected areas: a study of the Northeast Atlantic cod fishery. Land Econ. 82, 321–332.
Teh, L., and Sumaila, R. (2019). Economic and Social Benefits of Fisheries Rebuilding: Six Canadian Case Studies. Toronto, ON: OCEANA.
TJFB. (2017a). Northern Shrimp Co-Management in Shrimp Fishing Area 4 and 5. Letter From the Torngat Joint Fisheries Board to the Minister of Fisheries and Oceans. 29 September 2017. Happy Valley-Goose Bay, NL: Torngat Joint Fisheries Board.
TJFB. (2017b). Turbot Co-Management in and Adjacent to the Labrador Inuit Settlement Area. Happy Valley-Goose Bay, NL: Torngat Joint Fisheries Board.
TJFB. (2019). Turbot Co-management in and Adjacent to Nunatsiavut. Happy Valley-Goose Bay, NL: Torngat Joint Fisheries Board.
Torngat Wildlife Plants and Fisheries Secretariat [TWPFS] (2017). Shrimp Co-Management in the Eastern Assessment Zone (EAZ). Happy Valley-Goose Bay, NL: Torngat Wildlife, Plants & Fisheries Secretariat.
Torngat Wildlife Plants and Fisheries Secretariat [TWPFS] (2018). 10th Annual Fisheries Workshop. 20 - 21 November 2018, Nain. Happy Valley-Goose Bay, NL: Torngat Wildlife, Plants & Fisheries Secretariat.
Torngat Wildlife Plants and Fisheries Secretariat [TWPFS] (2019). 11th Annual Fisheries Workshop. 5 - 6 November 2019, Happy Valley Goose Bay. Happy Valley-Goose Bay, NL: Torngat Wildlife, Plants & Fisheries Secretariat.
United Nations (2007). United Nations Declaration on the Rights of Indigenous Peoples. Available at: https://www.un.org/development/desa/indigenouspeoples/declaration-on-the-rights-of-indigenous-peoples.html (accessed May 21, 2019).
Weich, S., Lewis, G., and Jenkins, S. P. (2002). Income inequality and self rated health in Britain. J. Epidemiol. Commun. Health 56, 436–441.
Wen, M., Browning, C. R., and Cagney, K. A. (2003). Poverty, affluence, and income inequality: neighborhood economic structure and its implications for health. Soc. Sci. Med. 57, 843–860.
Withers, P. (2018). The Trudeau Government, Surf Clams and a Brewing Battle in Another Fishery. Available at: https://www.cbc.ca/news/canada/nova-scotia/analysis-surf-clam-quota-decision-1.4820416 (accessed May 15, 2019).
Keywords: fisheries, allocations, equity, indigenous rights, access
Citation: Kourantidou M, Hoagland P, Dale A and Bailey M (2021) Equitable Allocations in Northern Fisheries: Bridging the Divide for Labrador Inuit. Front. Mar. Sci. 8:590213. doi: 10.3389/fmars.2021.590213
Received: 31 July 2020; Accepted: 25 January 2021;
Published: 18 February 2021.
Edited by:
Sebastian Villasante, University of Santiago de Compostela, SpainReviewed by:
Christian T. K.-H. Stadtlander, Independent Researcher, St. Paul, MN, United StatesCharles Mather, Memorial University of Newfoundland, Canada
Copyright © 2021 Kourantidou, Hoagland, Dale and Bailey. This is an open-access article distributed under the terms of the Creative Commons Attribution License (CC BY). The use, distribution or reproduction in other forums is permitted, provided the original author(s) and the copyright owner(s) are credited and that the original publication in this journal is cited, in accordance with accepted academic practice. No use, distribution or reproduction is permitted which does not comply with these terms.
*Correspondence: Melina Kourantidou, mkour@dal.ca; mkourantidou@whoi.edu