
Abstract
Fiber-optic thermometry has the potential to provide rapid and reliable quench detection for emerging large-scale, high-field superconducting magnets fabricated with high-temperature-superconductor (HTS) cables. Developing non-voltage-based quench detection schemes, such as fiber Bragg grating (FBG) technology, are particularly important for applications such as magnetic fusion devices where a high degree of induced electromagnetic noise impose significant challenges on traditional voltage-based quench detection methods. To this end, two fiber optic quench detection techniques—FBG and ultra-long FBG (ULFBG)—were incorporated into two vacuum pressure impregnated, insulated, partially transposed, extruded, and roll-formed (VIPER) high-current HTS cables and tested in the SULTAN facility, which provides high-fidelity operating conditions to large-scale superconducting magnets. During surface heater induced quench-like events under a variety of operating conditions, FBG and ULFBG demonstrated strong signal-to-noise ratios (SNRs) ranging from 4 to 32 and measured single-digit temperature excursions; both the SNR and temperature sensitivity increase with temperature. Fiber thermal response times ranged between effectively instantaneous to a few seconds depending on the operating temperature. Strain sensitivity dominates the thermal sensitivity in the conditions achievable at SULTAN; however, measurements at higher quench evolution temperatures, coupled to future work to increase the thermal-to-strain signal, show promise for quench detection capability in full-scale magnets where temperature and strain may occur simultaneously. Overall, FBG and ULFBG were proven capable to quickly and reliably detect small temperature disturbances which induced quench initiation events for high current VIPER HTS conductors in realistic operating conditions, motivating further work to develop FBG and ULFGB quench detection systems for full-scale HTS magnets.
Export citation and abstract BibTeX RIS

Content from this work may be used under the terms of the Creative Commons Attribution 4.0 licence. Any further distribution of this work must maintain attribution to the author(s) and the title of the work, journal citation and DOI.
1. Introduction
A rapid and reliable quench detection is vital for high current superconducting magnet systems to prevent irreversible damage to a magnet following a quench event, which is an abrupt, localized transition from the superconducting state during an off-normal event. This is particularly important for superconducting magnets with large stored magnetic energy that operate in complex environments, where off-normal events can trigger a magnet to quench and release the stored energy. Magnetic fusion energy devices, such as tokamaks, represent one of the most challenging environments for quench detection due to high electromechanical stresses, strong inductive coupling among uncorrelated magnet voltages, plasma disruptions, and both steady-state and transient heat loads from AC losses and nuclear heating. A superconducting magnet should be designed to withstand all of the anticipated environmental loads; however, if a quench does occur and is not rapidly detected, all of the magnetic stored energy will dissipate into the quenched region and overwhelm the cooling capacity leading to quench propagation, strong temperature rises, and thermally induced stress gradients that can damage or destroy the magnet, rendering the entire device inoperable until coil repair or replacement is implemented [1, 2].
Fiber optic thermometry is an alternative approach to quench detection that is immune to the electromagnetic noise present in all voltage-based schemes. Although voltage balancing schemes are designed to cancel out inductive voltage noise, there are still operational scenarios within a fusion environment where voltage balancing schemes cannot effectively cancel out the inductive signals and complicate quench detection [3–6]. In contrast to voltage-based quench detection methods, fiber-based quench detection methods work by measuring the strain and temperature response of optical fibers embedded within a superconducting cable or magnet. A fiber-based Mach-Zehnder interferometer was successfully tested on a large-scale low temperature superconducting (LTS) magnet for fusion applications near operating conditions in the mid-1990s during the QUELL experiments [7–9]. Although the technology proved successful for quench detection, a few implementation and operation concerns were observed. Extracting optical fibers through the super critical helium boundary for cable-in-conduit superconductor cables was viewed as challenging in conventional coil manufacturing settings due to the fragility of the fiber. In addition, temperature sensitivity for fiber thermometry was also very low near the 4.5 K operating temperatures of LTS like NbTi and Nb3Sn making it difficult to measure small temperature changes [10].
With the introduction of high temperature superconductor (HTS) materials, such as rare earth barium copper oxide conductors, superconducting magnets can operate with higher cryostability and increased performance metrics such as higher critical current densities, operating temperatures, and magnetic fields. Next generation high-field magnetic confinement fusion devices and high energy physics particle accelerators are capitalizing on these advantages and incorporating HTS magnets to improve device performance [11, 12]. An open issue with the use of HTS is the challenge of quench detection due to normal zone propagation velocities (NZPV) that are slower by many orders of magnitude compared to LTS and depending on the operating temperature [13, 14]. Designing a voltage-based quench detection system in HTS magnets with low NZPV becomes challenging, especially in environments with inductively coupled electromagnetic noise. With fast thermal response times and insensitivity to electromagnetic noise, fiber optic techniques represent a potential alternative to voltage tap techniques for HTS magnets.
The MIT Plasma Science & Fusion Center, in collaboration with Commonwealth Fusion Systems has developed an HTS cable that eliminates several of the manufacturing and operating obstacles that have restricted the use of fiber optic thermometry in LTS-based cables [15]. Vacuum pressure impregnated, insulated, partially transposed, extruded, and roll-formed (VIPER) cable design eliminates many of the manufacturing and operating risks previously identified during QUELL tests for fiber quench detection [7]. The fibers do not need to undergo a high temperature heat treatment during fabrication, the coolant channel in VIPER cable is separated from the HTS tapes and the fibers see greater protection and easier installation due to its solid copper former in place of twisted LTS stranded wire.
This paper has two main objectives: first, to present the experimental demonstration of fiber optic thermometry as a quench diagnostic for VIPER cable in magnet operating conditions; and second, to determine the fiber sensitivity, response times, and operational robustness for establishing the baseline for a full-scale fiber optic quench detection system for HTS magnets based on VIPER cable. To that end, a pair of VIPER cables were fabricated and instrumented with two types of fiber optic thermometry: a fiber Bragg grating (FBG) system developed by CERN; and an ultra-long FBG (ULFBG) developed by Robinson Research Institute. The cable and fiber assemblies were then integrated into a larger support structure and electrically tested at the SULTAN facility [16–18]. During testing, the fiber optic systems measured a variety of thermal events including warmup and cooldown; current sharing tests by exceeding the critical temperature and current; and quench tests induced by localized resistive heaters. The paper is structured as follows: section 2 provides a short background on the FBG and ULFBG techniques employed on the SULTAN test; section 3 gives an overview of the VIPER cable design and detailed instrumentation scheme used in the SULTAN tests; section 4 presents the experimental results from the SULTAN test campaign; section 5 includes a discussion of the results and experimental shortcomings; section 6 presents some concluding remarks on the potential future of FBG and ULFBG in high field HTS magnet systems.
2. Background: FBGs
This section provides a brief description of the physics underlying the two fiber optic thermometry sensors installed and tested on the VIPER cables during the SULTAN test: the FBG system from CERN [19]; and the ULFBG system from RRI [20].
2.1. Working principle for the standard FBGs
FBGs are sensing elements which can be photo-inscribed into a silica fiber doped with germanium by exposing the fiber to a UV laser pattern. This exposure induces a periodic modulation of the refractive index of the core of the fiber over a certain length. When broadband light is emitted to a Bragg grating, it only reflects the specific wavelength component λB. The reflected Bragg wavelength is given by:

where neff (−) is the effective refractive index of the core and Λ (nm) is the grating period. The FBG is sensitive to both temperature (T) and strain ( ). A change in these parameters leads to a shift in the Bragg wavelength due to the effect they induce on both the refractive index neff (Τ,) and the grating period Λ(Τ,) (see figure 1). Multiple FBG, each with a unique grating period, can be inscribed at regular intervals along a single fiber to facilitate position-dependent temperature monitoring along the fiber's length.
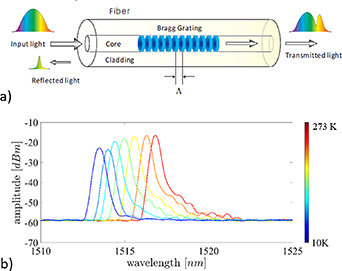
Figure 1. (a) Conceptualization of FBG technology (b) FBG wavelength shift with temperature. This figure shows how the wavelength peaks decreases as the temperature drops.
Download figure:
Standard image High-resolution image2.2. Working principle for the ULFBG
The ULFBGs used in this experiment are a series of 9 mm long FBGs, with the same grating period, spaced with a 1 mm gap between gratings and essentially behave as one long FBG. The physics is the same as that of FBGs, however, the combined grating length can be meters long instead of millimeters long. While conventional FBGs are able to monitor temperature changes at a very small localized point in space, ULFBGs can monitor temperature changes over a much larger length.
While the reflected spectrum for each FBG exhibits a single peak, this is not true with ULFBGs. Figure 2 illustrates how the shape of a ULFBG reflected spectrum arises. A portion of the light incident to the first segment of the ULFBG is reflected. The reflection is of a specific wavelength  and the rest of the light is transmitted to the next segment. The temperature at segment 2 is elevated so this segment reflects a specific wavelength
  and transmits the rest of the light to the next segment, which has a slightly lower temperature, making this third segment reflect yet another wavelength
  . The result is that several wavelengths are reflected at, possibly, different amplitudes. Changes in temperature result in at least two effects: (a) a change in the dominant reflected wavelength, which is a property of conventional FBG's, and (b) a change in the overall shape in the reflected spectrum.
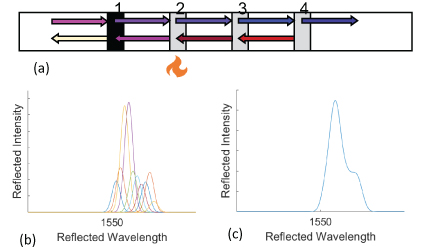
Figure 2. (a) Each FBG segment of the ULFBG reflects some wavelength that may not be the same as those reflected by other FBG segments. (b) Sharp peaked reflections from individual FBG segments can combine to form (c) a broadly peaked reflected spectrum of the ULFBG.
Download figure:
Standard image High-resolution imageThe individual reflections, as graphically illustrated in figure 2(b), will exhibit distinct peaks similarly to regular FBGs but the sum of these reflections will resemble a combined peak as shown in figure 2(c). This is because the reflected spectrum of a ULFBG responds to all simultaneously occurring changes in temperature and strain along its length and results in rapid detection of temperature variation, irrespective of the location of the heat source along the sensor. A consequence of this technique is that spatial information of a hot spot is obscured. This means that the ULFBG technology works very well in systems where time resolution is of utmost importance even at the expense of spatial resolution.
2.3. Signal analysis for FBG and ULFBG
A single FBG shows a well-defined spectral peak, which shifts to longer wavelength when the temperature rises (as shown in figure 1(B)). This shift is due to thermal expansion of the grating period and the change of the index of refraction due to temperature. Conventional FBG-based sensing uses this change in this peak position to determine the temperature at the sensor. Following from equation (1), the following relation holds.

SFBG, in units of picometers (pm), denotes the single channel signal monitored from the FBG. By contrast, the signal obtained from the ULFBG is more complex (figure 2(c)). The spectrum shows a multi-peaked profile, which is a result of minor changes in strain along the fiber. These effects are all significantly more marked than for the single grating, as the long length provides greater scope for variation along the grating length. Despite this, a marked change in the reflected signal is observed once a hot spot is generated in the ULFBG. Specifically, a new set of peaks emerge at longer wavelengths. If the ULFBG was heated uniformly then the whole reflected spectrum would shift uniformly.
The total change in signal from the ULFBG is complicated further by the presence of both temperature and strain gradients throughout the hotspot region. However, the increasing number of peaks also causes a change in the total reflected intensity. This provides a simple means to detect transient excursions from the uniform temperature condition via integrating the overall reflected intensity as follows.
SULFBG denotes the single channel signal monitored from the ULFBG. In practice, when the limits of integration are fixed and the wavelength divisions are uniform, the computation reduces to a sum of intensities in units of dB. Another variation of equation (3) is taking the weighted average of wavelengths (in units of picometers) with intensity values as the weights.
3. Experimental equipment
This section provides an overview of the design of VIPER cable, particularly the aspects making it suitable for using fiber optic quench detection systems. The cable pair designed and fabricated for the SULTAN fiber optic quench detection tests—along with the fiber optic installation and detailed instrumentation map—are presented.
3.1. Design of VIPER cable
VIPER cable is based on the high-temperature superconductor cable architecture known as twisted stacked tape conductor first proposed by Takayasu et al [21–24]. A cut-away schematic of a VIPER cable and cable-to-cable electrical joint developed specifically for superconducting tests at the SULTAN facility is shown in figure 3. The cable comprises a central leak-tight channel carrying cryogenic coolant in a copper core. Rectangular channels on the perimeter helically twist around the central channel at a twist pitch of 20 cm and support the HTS stacks. A copper jacket extending axially over the cable and joint regions is compacted around the central assembly, providing mechanical support for the internal HTS stacks, an electrically conductive shell for current transfer, and a vacuum tight seal for a vacuum pressure impregnation (VPI) solder process. To achieve additional mechanical support against I × B Lorentz loads (also known as Laplace loads), the copper-jacketed cable can either be inserted directly into a steel radial plate or can have a steel jacket compacted around the copper jacket as shown in figure 3. Strong, low resistance termination joints or cable-to-cable joints are easily created by clamping around the copper jacket, removing a short section of stainless steel jacket if necessary. An overview of fabrication, cryostability testing, cycling, and general quench behavior of VIPER cable is discussed in the 'VIPER: An industrially mature high-current high temperature superconductor cable' paper [15].

Figure 3. (Reproduced with permission [15]). Left: a cutaway showing the VIPER cables and cable-to-cable joint configured for testing at the SULTAN facility; right: a cross section showing the configuration of helical rectangular channels enclosing the HTS stacks, copper jacket and steel jackets. Note how the VPI solder process create a monolithic metal cable with the HTS in good mechanical, electrical, and thermal contact with the copper form and jackets. The external support assembly is not shown.
Download figure:
Standard image High-resolution image3.2. VIPER cable assemblies for SULTAN tests
VIPER cables were fabricated with stainless steel jackets as shown in figure 3 and enclosed in a custom assembly to support the cables during testing in SULTAN as shown in figure 4. The assembly included a joint design to electrically connect the cables to the SULTAN superconducting transformer, a second joint between the cable pairs, supercritical helium piping to route the supercritical helium coolant to the central cooling channels, and a suite of diagnostic instrumentation that varied based on the test campaign objectives for each cable pair.
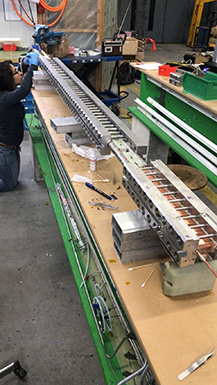
Figure 4. The Delta cable assembly at the SULTAN facility. The two cables are oriented in parallel and are structurally supported by large stainless steel outer clamps. The cable-to-cable copper joint is visible within the clamping structure at bottom right.
Download figure:
Standard image High-resolution imageThe pair of VIPER cables fabricated for this test campaign was named 'Delta' (three other cables—Alpha, Bravo, and Charlie—were tested during previous SULTAN tests). The Delta SULTAN test campaign had two primary objectives: (a) experimental evaluation of VIPER cryostability and quench dynamics; and (b) assessing a suite of quench detection techniques including voltage taps, optical fibers, and acoustic sensor methods. This paper primarily focuses on the fiber response of the second objective of the test campaign. A schematic showing an overview of the test setup for the Delta cable pair appears in figure 5(a).

Figure 5. (a) A diagram displaying an overview of the test sample. The dashed box surrounds the high field region of the Sultan test sample. (b) A zoomed in diagram showing all of the instrumentation near the high field region. The distance between each sensor and the center of the high field region is indicated by the vertical numbering above/below each sensor. Since the ULFBG is a continuous sensor, it is represented by a solid green line. Sensors referenced in data analysis throughout paper are in bold.
Download figure:
Standard image High-resolution imageEach Delta cable contained four HTS tape stacks with each stack composed of fifty-two 4 mm wide, 87 µm thick HTS tapes. The HTS was chosen such that the tapes' critical current balanced two competing requirements: (a) to provide sufficiently high performance for evaluation of quench dynamics and detection at operating currents typically found in high-field superconducting magnets for fusion; and (b) to avoid the operational limits imposed by the SULTAN facility, including the 100 kA maximum operating current, the voltage limits on the superconducting transformer, and the resistive heating in the joint regions of the assembly that exceeds the cryogenic cooling capacity. The critical currents of the two cables measured at the beginning of the campaign were found to be 45.6 kA and 44.5 kA (B = 10.9 T; T = 10 K) and 31.5 kA and 30.75 kA (B = 10.9 T, T = 20 K). The cable critical current at the end of the Delta campaign was stable and degraded by approximately 2.4% and 2.5%, respectively. The critical current of the cable sample was determined using the 1 uV cm−1 electric field criterion.
3.3. Fiber optic systems and instrumentation package
To initiate a quench in the cable and measure the temperature rise and normal zone propagation, the cable was outfitted with a suite of instrumentation: voltage taps to measure the voltage rise along the cable; CernoxTM temperature sensors (which will be referred to as Cernox sensors) to measure the temperature at various locations; surface resistive heaters to induce a localized quench; and fiber optic sensors to test quench detection feasibility. A detailed sensor map for the Delta sample is shown in figure 5(b). Two surface quench resistive heaters (H1 to H4) were installed per cable, the primary heater was located directly at the center of the high field zone and a secondary heater was installed downstream of the primary heater for additional heating. Several Cernox sensors were installed per cable. Cernox sensors were installed at the same axial location of the primary heaters (TH5 and TH6), and directly upstream (T1 and T2) and downstream (T3 and T4) of the high field region of each cable leg. Multiple voltage taps (VH1 to VH27 and VH2 to VH28) were installed throughout the high field region of the VIPER sample to measure a high resolution of the voltage rise and propagation along the cable length as the tape twists down the cable. Lastly, two different fiber optic technologies were installed and tested on the cable. ULFBG fibers (ULFBG-A and ULFBG-B) and two FBG fibers, each with three individual gratings (A71, A72, A73, A81, A82, A83, B71, B72, B73, B81, B82, and B83) were installed on each cable leg. The 'Cable A' conductor has all instrumentation identifiers starting with an 'A' and the 'Cable B' conductor has instrumentation identifiers starting with a 'B'. The FBG gratings labelled A7× and B8× are 2 mm long and the gratings labelled A8× and B7× are 5 mm long.
The external heaters and sensors, such as voltage taps and Cernox sensors, were attached directly to the copper jacket. Holes were cut in the stainless steel jacket in order to attach each Cernox sensor and voltage tap directly onto the copper former. More sensitive sensors such as optical fibers were embedded within small grooves machined into the copper jacket (see figure 6), to prevent mechanical damage during sample handling and electromagnetic loading (I × B loading) as well as enabling good thermal connectivity along the entire length of the cable.
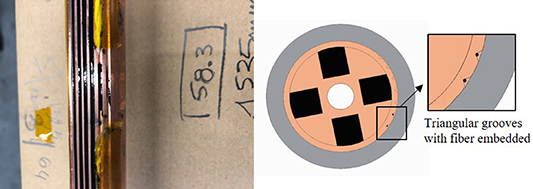
Figure 6. Left: copper jacket with fibers embedded in stycast 2850 FT (black) groove. The grooves with ULFBG fibers were completely embedded with Stycast while the FBG grooves were only partially embedded. The FBG grooves were covered with Kapton tape to prevent Stycast from the ULFBG grooves to spill onto the FBG grooves during application. Right: a cross section of the cable with fiber grooves.
Download figure:
Standard image High-resolution imageThe order of installation of the fibers and structural components were important to the operation of the test sample. Before the stainless steel jacket was installed on the manufactured cable with HTS tape, a v-notch groove was cut into the outer copper jacket along the length of each cable. The FBG and ULFBG sensors used different installation methods into the cable. The ULFBG fibers were inserted into the notched groove and then adhered into the groove with Stycast® 2850 FT (which will be referred to as Stycast). The FBG fibers with bare gratings were inserted into the groove without pre-tension and instead of embedding the entire fiber with Stycast, only the fiber segments with gratings were adhered with Stycast. After room temperature cure of the Stycast, tight-fitting, segmented stainless steel jacket pieces were installed by sliding them along the length of the sample legs. In order to prevent interference or accidental pinching on the fibers, additional sanding along the inner diameter of the stainless steel jacket was required to ensure adequate clearance between the inner surface of the stainless steel jacket and the outer diameter surface of the copper former.
4. Experimental results
The FBG, ULFBG, Cernox temperature sensors, and voltage taps were used to characterize the behavior of the VIPER cable system for different operating conditions. The thermal response of the cables was measured during the initial cooldown from room temperature, during heater pulse tests with and without current, and during the current sharing temperature (TCS) tests. Because the fibers also measure mechanical strain, we were also able to observe the mechanical response of the cables during contraction from cooldown and I × B loading from current ramp tests.
4.1. Cooldown
The first measurements taken by the fibers and Cernox temperature sensors were during the initial cable cooldown from room temperature to 4 K over approximately 60 h. The shift in the reflected spectrum of the ULFBG sensors and the shift in the FBG peaks were tracked during the entire cooldown process (see figure 7(a)). A thermal strain can be calculated from the measured wavelength shifts by the formula shown in equation (4) below, where ε = strain, K = gage factor, Δλ= wavelength shift, and λ0 = zeroth wavelength. The FBG and ULFBG fiber used a gage factor of 0.788 [25, 26]. The total calculated strain versus measured temperature can be seen in figure 7(b) below. The strain measured by the fibers is comparable with the thermal strain induced in copper since the majority of the VIPER sample is made up of the copper former. The theoretical strain of copper, computed from [27], between 240 K and 4.8 K is approximately −0.27% whereas the FBG sensor measured between −0.27% and −0.30% and the ULFBG measured approximately −0.29% (see figure 7(b)). The minimal variation of strain between the different fiber sensors may be due to the non-uniformity of the Stycast adhesion or the complex localized constraints or frictional force on the copper former by the stainless steel structural support.
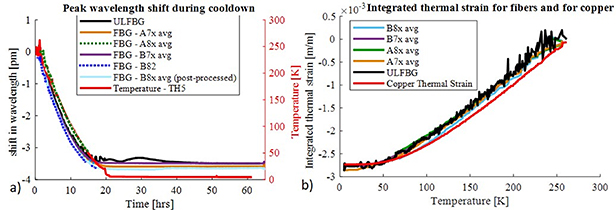
Figure 7. (a) Measured peak wavelength shift for both RRI's ULFBG and CERN's FBG's. The facility TH5 Cernox sensor is also plotted as a reference to the sample temperature. Many of the FBG signals were averaged together for simple plotting. (b) Calculated thermal strain of FBG's and ULFBG vs temperature during the cooldown. The thermal strains computed from fiber wavelength shifts are very similar to the calculated integrated thermal strain of copper which makes up the former of the VIPER cable.
Download figure:
Standard image High-resolution imageSeveral FBG sensors (A81, A82, A83, B81, B82, and B83) experienced significant attenuation during the cooldown process and even more (A73 and A83) after 42 cycles of cycling loading (10.9 T × 50 kA). Figure 8 shows the attenuation of the signal during cooldown. Because all sensors returned after warmup, no permanent damage was observed on the fibers and a simple modification of the installation method to prevent fiber slippage and jacket interference will mitigate these issues. See the discussion section for more details.

Figure 8. This plot shows how a single wavelength peak of FBG A83 slowly decreased as the temperature dropped over the cooldown cycle.
Download figure:
Standard image High-resolution image4.2. Quench tests
A sequence of short thermal disturbances were measured along the cable during the heater pulsed quench tests (see the installed surface heaters shown in figure 5(b)). Each heater pulse increased in energy by either increasing the power to the heater or increasing the pulse duration until a quench/thermal runaway is initiated in the cable at the end of the test. It should be noted that while thermal pulses induce normal zones and rapid temperature rises, a fully evolved quench cannot be achieved in the standard configuration of SULTAN because of operating limits on the superconducting transformer that supplies the electrical current to the cables.
During the quench tests, the Cernox sensors, voltage taps, FBGs, and ULFBG sensors are used to measure the quench event from the rise in temperature or voltage. For simplicity and consistency, we will restrict all analysis to Cable A. To verify the effectiveness of the fiber measurements, the FBG and ULFBG sensor measurements are compared to both the nearest Cernox sensor and voltage tap pair to match response time and temperatures. Because the grated or the active sensing region of the ULFBG is distributed throughout the high field zone of the cable and can measure any change in temperature along that region, the ULFBG signal is compared to the Cernox sensor and voltage tap pair located right on the surface heater that is creating or initiating the temperature/resistive jump. For Cable A, this corresponds to heater H1, Cernox sensor TH5 and voltage tap pair VH11–VH13. Because the working FBG sensors were not located directly on top of the heaters or Cernox sensors, the nearest sensor is used for comparison. For example, FBG sensor A72 is compared to the nearest Cernox T3 and nearest voltage pair VH25–VH27; FBG sensor A71 is also compared to Cernox T3 and the nearest voltage tap pair VT3–VT1. The instrumentation can be seen in figure 5(b).
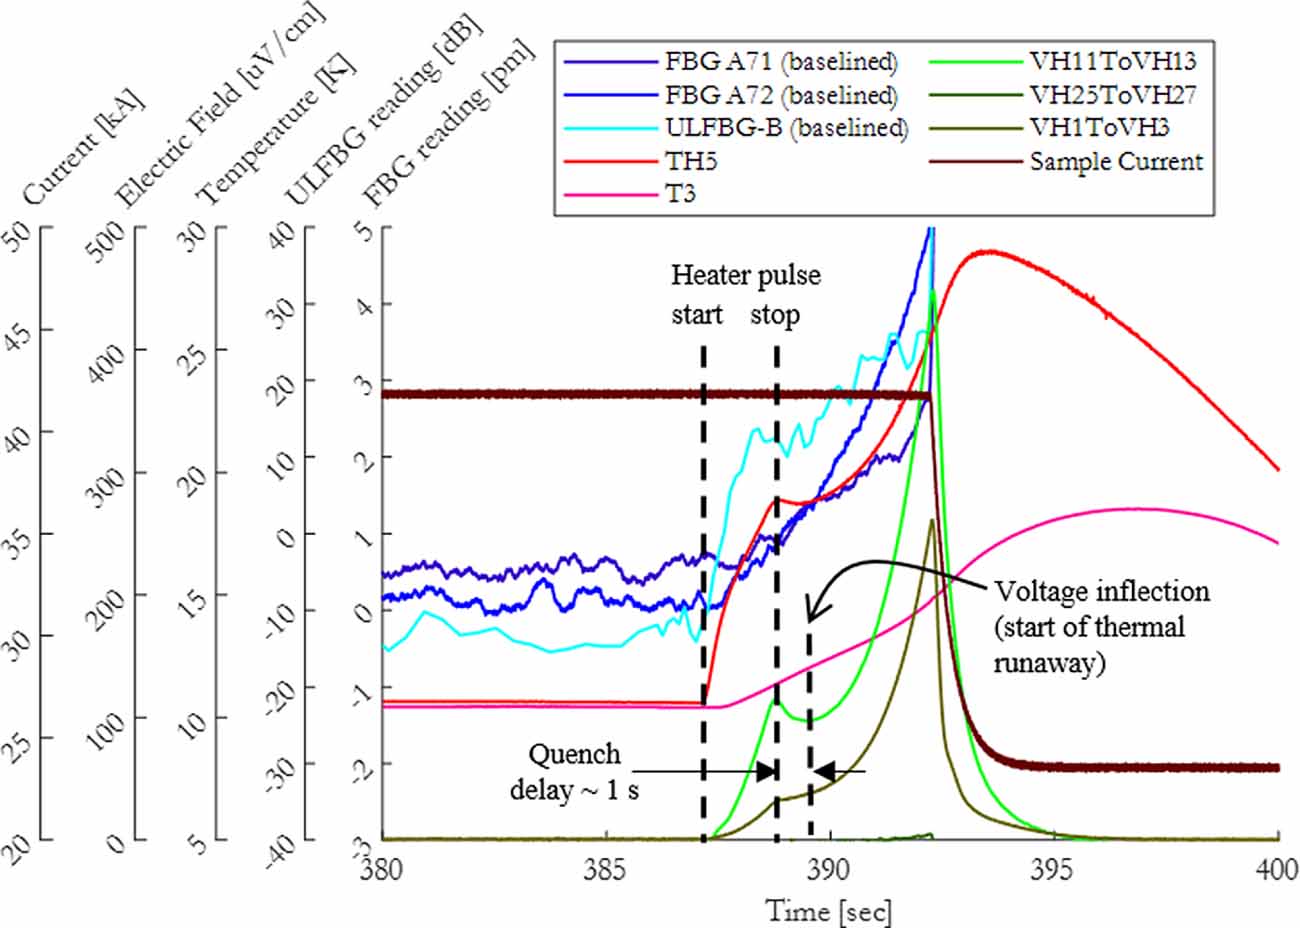
During a quench test performed at 10 K, a background field of 10.9 T, and with a transport current of 41 kA resulting in a Iop/Ic ratio of ∼0.9, both FBG and ULFBG signals show clear responses to the heater pulses preceding the quench event in addition to a strong response to the quench event at the end of the test. The signal responses are shown in figure 9. The FBG signal in figure 9 is filtered using a time averaging technique due to a noisy raw signal. With the filtered signal, a detectable FBG rise occurs with an associated 1 K temperature rise (see sensor T3 in figure 9). Whereas, the ULFBG signal does not require filtering and shows a signal rise with a differential temperature rise of 4 K (see sensor TH5 in figure 9). The response times for both fibers closely match both the temperature and voltage signals with the ULFBG response preceding all other sensors. This is most likely due to the slower response time of the Cernox sensor compared to the ULFBG fiber response. However, the FBG response will depend on how much time averaging is applied to smooth the signal and the distance between the FBG and the heater or quenched region. The time response between both sensors will be discussed in more detail later in the paper.

Figure 9. Sample current, electric field, temperature, FBG and ULFBG signals vs. elapsed time during a series of heat pulse induced thermal perturbations leading to quench at 10 K, 10.9 T, 41 kA, and 0.9 Iop/Ic. The last heat pulse led to a thermal runaway, or quench event. The current was dumped immediately after. The FBG and ULFBG signals are baselined by applying a zero-offset to each signal based off the initial signal measurement at steady state temperatures of 10 K without perturbation.
Download figure:
Standard image High-resolution imageFigure 10 shows the response of the sensors to a quench test performed at 20 K with a background of 10.9 T and a transport current of 31.5 kA corresponding to an Iop/Ic ratio of approximately 1.0. Although the cable was running at its critical current, a significant amount of heat (∼140 J = 46 W for ∼3 s) was required to push the cable into a thermal runaway quench event. The last heater pulse shows that the cable initially began to recover from the 140 J heat input (see around 570 s). However, as the localized initial quench region at the surface heater site (H1) began to recover and drop in temperature, the quench and thermal front continued to grow and propagate down the cable. The quench zone, represented by the maintained ∼30 uV cm−1 electric field across the high field region (occurring from 560–590 s), continued to grow until thermal runaway was reached (around 590 s). The Cernox and both fiber measurements show the quench rises significantly faster than the voltage taps at the thermal runaway event. The A72 FBG sensor that is closest to the initial quench region sees a rise due to the quench event (at 590 s) faster compared to the A71 FBG sensor. This is due to the quench region moving downstream closer to the A72 sensor once the thermal runaway region was met. More importantly, both fiber sensors show a continuous rise in signal whereas all voltage signals either exhibit decreased or flat responses during the slow quench propagation period. In this case, the fibers provide a stronger and more effective response to the quench propagation period prior to thermal runaway.

Figure 10. Sample current, electric field, temperature, FBG and ULFBG signals vs. elapsed time during a series of heat pulse 366 induced thermal perturbations leading to quench at 20K, 10.9T, 31.5kA, 1.0 Iop/Ic. The last heat pulse led to a thermal runaway, 367 or quench event. The current was dumped immediately after. Similar to Figure 9, the FBG and ULFBG signals are baselined by 368 applying a zero-offset.
Download figure:
Standard image High-resolution image4.3. Strain sensitivity
Although the fibers are used as a thermometry sensor in the Delta cable tests for quench measurement, they also respond to mechanical strain. Mechanical strain typically occurs within a superconducting magnet through changes in Lorentz load or large thermal expansion effects (as already seen in the cooldown portion of the test). If fibers are used to measure temperature rises in a quench detection system and significant mechanical strain is present, the fiber signal will show changes in signal even though no change in temperature has occurred. This occurrence may lead to false positives in the quench detection system. Understanding the strain sensitivity of the fibers is important for mitigating false positive in a quench detection system.
The difference in fiber sensitivity between mechanical and thermal effects are distinguishable during a current sharing temperature (Tcs) test. The Tcs tests are done by slowly increasing the temperature of the inlet helium flow while the cable maintains a constant current until a voltage criterion of 10 uV cm−1 is measured across the high field region. During this step, only thermal effects are observed in the fiber since there are no changes in mechanically induced axial strain in the fiber while there is constant current in the cable. Once our test sample has generated enough integrated voltage drop across the leads, the voltage across the secondary loop with the superconducting transformer will quickly decrease and dumps the transport current within the test loop. A rapid change in current (dI/dt) with a constant background field of 10.9 T creates a large decrease in I × B Lorentz loads as the current drops. At this time, mechanical strain is a primary component of the fiber signal.
Figures 11 and 12 show the entire sequence of the Tcs test with the transport current, temperature of the Cernox sensor (TH5) in the high field region, and either the FBG or ULFBG response (respectively). In both figures, the fibers exhibit a large response from the mechanical Lorentz loads during the current ramp up/down. In contrast, there is little to no visible fiber response during the constant current portion of the TCS test when slow thermal increases occur. When viewing the entire sequence, the fiber signals are visibly dominated by the mechanical response in comparison to the thermal response. The zoomed inset of the FBG signal in figure 11 shows a 3 pm response to the slow temperature rise whereas there is greater than a 400 pm response to the mechanical strains of the current dump. The ULFBG response to a current sharing test is shown in figure 12, however it must be noted that the temperature in this test increased until the cable reached thermal runaway (initiated a quench). With this in mind, there is a slightly stronger ULFBG response to the temperature rise compared to the FBG example in figure 11. The zoomed in inset of the ULFBG signal in figure 12 shows a 10 db response due to the quench event and a comparable response due to the current dump. For both cases, the fiber signal strain response is equal to or greater than the temperatures response. The FBG exhibited a 100:1 strain:temperature response ratio and the ULFBG exhibited a comparable 1:1 response. This is clear as the fibers are not operating at their maximum temperature sensitivity below 50 K [28].
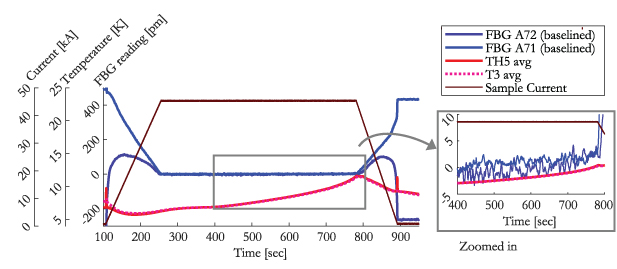
Figure 11. Fiber data is compared to temperature and transport current during a TCS test (no quench occurred during this test). The jumps in the FBG fiber response were due to the Lorentz loads on the cable from ramping current. The fiber response from temperature can only be seen if zoomed into the fiber response before the current ramp occurs.
Download figure:
Standard image High-resolution image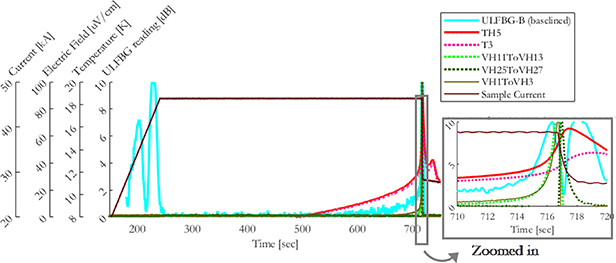
Figure 12. ULFBG data is compared to temperature and transport current during a TCS test (a quench occurred right before the current dump). Large jumps in fiber response are due to the current ramp and dump. A comparable rise in ULFBG signal is also seen right at the end (during quench) in the zoomed in inset.
Download figure:
Standard image High-resolution imageThe ULFBG strain to thermal fiber response ratio is significantly lower than the measured FBG ratio because the ULFBG test in figure 12 reached thermal runaway with temperatures up to 20 K whereas the FBG TCS test in figure 11 did not reach thermal runaway and temperatures only went up to 12 K. The differences in these temperatures correspond to a factor of 1.5 increase in temperature sensitivity, and when integrated across the 12–20 K temperature rise corresponds to a factor of 8 increase in FBG signal (see figure 13). This means that if the cable continued to increase in temperature and the FBG from the test in figure 11 reached 20 K, the strain to thermal response ratio would decrease from 100:1 to 12.5:1. Although this is nearly an order of magnitude difference, the FBG sensor still shows a high strain to temperature response. If a magnet were to experience mechanical strain while using fibers as quench detection, the mechanical strain effect will appear as a false positive quench detection—a similar false positive scenario as the high induced voltages in a voltage-based quench detection system.

Figure 13. Fiber sensitivity vs. Temperature. Cooldown data used to calculate the derivative of the wavelength shift versus temperature.
Download figure:
Standard image High-resolution image4.4. Signal to noise ratio
By analyzing various test cases, we saw that the signal to noise ratio (SNR) and response (or delay) time to a quench or thermal event, varies with the fiber technology, the baseline or operating temperature, and the magnitude of the induced temperature excursion (spike). The SNR for each temperature spike is defined as the maximum absolute value of the signal value  . during the heater pulse starting time
  and ending time
  (
( ) normalized against the mean value
  and standard deviation
  value of the signal prior to the heat spike, when temperature was roughly constant with time.
Without filtering, the FBG raw data has a very low SNR value (as low as ∼4 from figure 14 below). As shown in figure 14, filtering the FBG data increases the SNR with a cost of increasing the integrated averaging time window—hence increasing the delay time of quench detection. Figure 14 is looking at a 20 K test with the cable operating at Ic. Each colored line of the top plot corresponds to the calculated SNR at each energy pulse. The greater the energy pulse, the greater the gain in fiber signal above the mean noise distribution, or SNR.
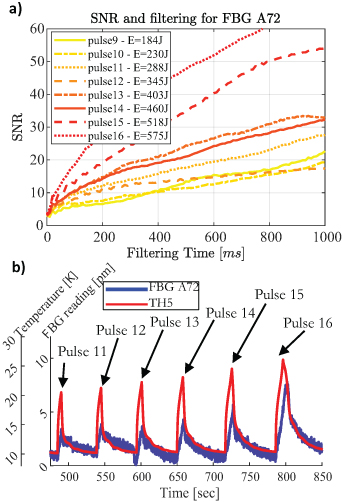
Figure 14. (a) CERN FBG SNR vs. delay time for a 20 K heater pulse test. This plot shows the relationship between SNR and filtering time for each energy pulse. (b) This plot shows how the pulses are numbered within one quench test. Only the heater pulses prior to quench are used to calculate SNR since a rapid current dump follows the quench event and is difficult to distinguish between the thermal event and the current dump event.
Download figure:
Standard image High-resolution imageThe trend between a thermal disturbance (heater energy pulse) and SNR can also be seen across different heater pulse tests for both the FBG and ULFBG fibers. Figure 15 displays these trends for two different heater pulse tests where the VIPER cable is operating at different quench stability regimes. The SNR for all cases is calculated using the heater pulses prior to a thermal runaway quench event. This indicates that the SNR for a thermal runaway quench event can be higher than 20 for low quench stability conditions and higher than 30 for high quench stability conditions. Also, the slope of the trend between energy disturbance (by the heater) vs SNR directly relates to the quench stability of the cable. The lighter blue colored data points correspond to a heater pulse test operating at 10 K, the VIPER cable carrying 90% of the critical current (41 kA), and with the supercritical helium flow at 3 g s−1. The darker blue data points correspond to a test operating at 10 K, 80% of the cable's critical current (36.4 kA), and with the supercritical helium flow at 5 g s−1. The tests with higher stability (light blue) exhibit larger slopes compared to the tests operating at lower quench stability regimes. This behavior occurs because as the stability decreases in a cable, there is an increase in current sharing (higher volumetric heating) while there is lower heat removal due to the lower helium flow. Both effects translate to larger temperature spikes and higher fiber signal gain compared to a cable with less quench stability. This behavior emulates a positive feedback control system which is advantageous for a quench detection system—the stronger the quench event, the stronger the signal.

Figure 15. SNR vs. heater pulse energy. SNR data from the heater pulses prior to quench from two different tests are shown. Test 060601 is performed at 10 K with the VIPER operating at 0.9 Ic with supercritical helium coolant flow at 3 g s−1. Test 110 605 is performed at 10 K with the VIPER cable operating at 0.8 Ic with SHE coolant flow at 5 g s−1 (high quench stability). Test 060601 data (the light blue circles and squares) is marked as 'lower quench stability tests' because this test is operating closer to Ic and requires less pulse energy to induce a quench; whereas, test 110 605 data (dark blue circles and squares) is marked as 'higher quench stability tests' because it is operating at lower Ic (0.8 Ic) and is more thermally stable against quench. The FBG data is calculated using a filtering time of 250 ms.
Download figure:
Standard image High-resolution imageIn addition to quench stability, the local temperature of the cable will also affect the SNR via changes in fiber signal sensitivity. Figure 13 highlights the increasing sensitivity of the fibers with temperature. As the operating temperature of the fiber glass material increases, the change in thermal reflectivity of the fiber and strain of the fiber embedded within the cable induces greater wavelength shifts for every increase in the temperature regimes measured in the quench tests. This also highlights that as the quench region grows and increases in temperature, the fiber signal increases in sensitivity and response, similar to a positive feedback loop, which further benefits quench detection feasibility.
SNR values up to 30 are promising for quench detection systems that did not yield a thermal runaway. For comparison, preliminary quench analysis for the Central Solenoid magnet in the China Fusion Engineering Test Reactor (CFETR) predict a SNR of around 8 for their quench detection system; and quench detection system for the Korea Superconducting Advanced Tokamak Research (KSTAR) magnets require an SNR greater than 1 for successful operation. Not only do both fiber systems achieve at least 3–30 times greater SNR values compared to co-wound voltage-based quench detection systems, greater SNR values can be reached by increasing the FBG filtering time and the SNR during a quench event will likely increase further as the quench region further develops. However, further study of fiber SNR with additional 'noise' of expected mechanical strain during magnet operation is needed for proper quench detection.
4.5. Response time of fiber sensors
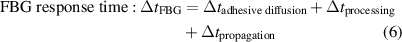
The differences between the fiber data processing, the length of their sensing region, and how they are installed or located along the cable, highly influences the response time needed to determine a rise in temperature due to a thermal disturbance, like a quench. For example, because the FBG's have a small sensing length (the sensors on the VIPER cable range from 2 to 5 mm) and may be located far away from the quench initiation location, a time delay will develop between the initiation of the quench and the measured response of the FBG sensor due to the propagation of the quench zone. However, the ULFBG has a much longer sensing region (the ULFBG on the VIPER cable was 500 mm long) and does not have a delay from propagation. It must be noted that these delay times are not the delay time to detect a quench, these are delay times in responding to an initial temperature rise from a thermal disturbance. In order to calculate quench detection delay times, further development is required to create quench detection algorithms and threshold values for the fiber systems. The expected differences in response time contributions are summarized in equations (6) and (7) below.
The response times for both fiber technologies are made up of two to three terms. Both fibers have the first two terms,  and
and  in common. The first delaying component, 'adhesive diffusion', is due to the thermal contact resistance and slower heat diffusion through the adhesive attaching the fiber to the copper former. The temperature wave from the quench region moves from the copper former with high diffusivity and fast propagation to the adhesive material with significantly lower diffusivity delaying the temperature propagation time.
In the case of the VIPER Delta cable, Stycast 2850 FT was used as the adhesive. Since the diffusivity of Stycast decreases as a function of temperature, the time delay will also increase with temperature [29]. The delay time can be roughly scaled by the following equation:
With this equation in mind, we would expect approximately a 2.5 s change between the time it takes for a temperature rise to propagate across 200 microns of Stycast at a baseline temperature of 10 K versus 20 K. In this case, the diffusivity of Stycast decreases by a factor of 0.06 when the temperature increases from 10 K to 20 K. This rough estimate can explain part of the approximate 3.5 s difference in time delay measured between two heater pulse tests performed at 10 K and 20 K (see figure 16). However, it must be noted that other factors contribute to the time delay which are not included in the calculation. These factors include the variation of Stycast thickness along the ULFBG fiber and the fact that the ULFBG reading integrates change in temperature along the entire grating which delays the ULFBG measurement inflection.
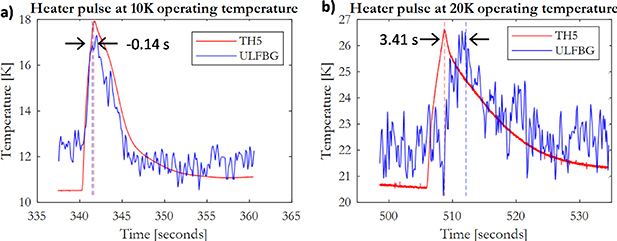
Figure 16. Left plot shows the time delay between the temperature and ULFBG inflection measurements during a heater pulse test at 10 K. The ULFBG signal preceded the temperature measurement because the Cernox temperature sensor has a slower response time than the ULFBG sensor. The right plot shows the time delay between the temperature and ULFBG inflection measurement during a 20 K test. The ULFBG signal is delayed by 3.41 s compared to the temperature. This delay is most likely due to the increased diffusion time from the Stycast with the increased operating temperature.
Download figure:
Standard image High-resolution imageThe second time delay component, the 'processing' term, refers to the time required to process the raw data and to detect if a temperature rise has occurred. To control the probability of reporting a false positive hot spot detection, a thresholding algorithm applied to the SNR can be employed. Such algorithm repeatedly checks sampled data against a pre-determined threshold SNR. This process introduces a processing time that increases with more stringent requirements on false detection probability and decreases with higher sampling rate. Assuming that noise is normally distributed, we can compute this trade-off in processing delay and accuracy. Figure 17 shows this trade-off for the accuracy requirement of a maximum of one false positive detection in one year of continuous data collection.
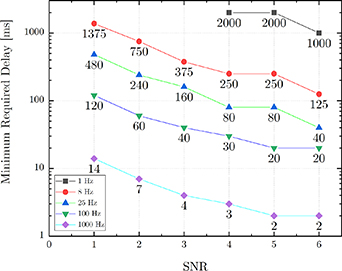
Figure 17. ULFBG Delay time vs. SNR plot. Each line represents a different sampling frequency for the fiber system. As the sampling frequency or the SNR decreases, the minimum required processing delay increases.
Download figure:
Standard image High-resolution imageIn addition to the false positive prevention delay, the FBG technology requires an additional 'processing' delay time to filter the noisy (low SNR) raw data. An averaging filter must be applied to the FBG data to increase the effective SNR. However, as the SNR increases so does the time delay. This balance between SNR and time averaging can be seen in figure 14.
The FBG delay time equation contains an additional third term. The third 'propagation' term is caused by the time required for the temperature wave to travel from the quench initiation site to the location of the FBG sensor. Note that the ULFBG sensor does not have this term since the ULFBG is made up of a nearly continuous band of FBG's. The propagation time for the FBG sensor is dependent on two main parameters: (a) the distance between the quench initiation site and the FBG sensor and (b) the normal zone propagation velocity which depends on the thermal properties of the medium (such as the operating temperature) and the amount of heat flux or current sharing (which depends on the Iop/Ic ratio). The effect of the propagation velocity can be seen when comparing the propagation of the voltage measurements to the propagation of temperature shown in figure 18 below. In the case of figure 18 below, the propagation velocity was approximately 16.4 cm s−1 when comparing an electric field of 4.4 uV cm−1 propagating from the quench initiation site in between VH11 to VH13 to the voltage measurement between VH19 to VH3. Assuming a similar velocity of 16.4 cm s−1, the maximum thermal front made up of heat diffusion and current sharing would expect to arrive at the FBG sensor located 35 cm away from the heater H1 (located by T3) in approximately 2 s. Comparing the times when 63.3% of peak value is reached for the TH5 and the FBG sensor, a delay of 3 s is observed. The discrepancy between the calculated delays from NZPV to the measured delays is most likely due to the decreasing NZPV as the current sharing diminished between voltage taps VH3 to VH27 (this is further supported by the similar profiles of the T3 temperature profile and the FBG profile which are very close to each other) and due to the change in Stycast diffusivity at these temperatures.

Figure 18. Propagation delay during 20 K test.
Download figure:
Standard image High-resolution imageGiven the contributions of all three components, we can determine the amount of time it will take each fiber to detect a temperature rise for a given set of conditions. For example, in the case of an operating temperature of 20 K, an SNR of six and a sampling frequency of 100 Hz, the ULFBG system will take an additional 20 ms to verify the occurrence of the thermal disturbance on top of the observed response time of 3.4 s (from figure 16(b)). For the same conditions but with a filtering time of 100 ms and a grating distance of 350 mm from the quench source, the FBG fiber will take an additional 120 ms to verify the occurrence of the thermal disturbance on top of the observed response time of 3 s (from figure 18). The thermal responses will change depending on the material, structure, location of the fiber, and the operating conditions of the magnet; where the dominant time component is due to the diffusion time (as is easily seen between the −0.14 s vs. 3 s delay time for ULFBG for a 10 K vs 20 K test case). In the case of our cable, a 3–4 s response time to an initial temperature rise far below temperatures that cause damage is sufficiently fast in the case of a quench initiation event (as shown in the 20 K quench test in figure 10).
5. Discussion
Based on the Sultan results, both fiber technologies have shown their ability to detect the initiation of a quench and smaller heater pulses that do not lead to quench. However, there are remaining fiber installation issues and performance shortcomings to be resolved and improved. These include: loss of FBG signal during cooldown, a high mechanical strain to thermal fiber response, and a slowing response time due to adhesive diffusivity. This section will discuss potential solutions and analysis required to resolve the identified issues.
5.1. Eliminating fiber installation issues resulting in signal loss
Monitoring the ULFBG and FBG fibers during the cooldown process revealed performance impacts resulting from different installation methods for each fiber system. No signal loss occurred with the ULFBG signal, whereas several FBG sensors experienced significant signal loss during the cooldown yet returned to normal upon complete warmup (as shown in figure 8). Because both FBG and ULFBG sensors were installed on the same cables, the signal loss is most likely due to differences in installation. The entire ULFBG fiber was embedded in the copper former groove using Stycast, whereas only the 5–8 mm grating sections of the FBG fibers used Stycast—the remaining, non-sensing regions of the FBG fiber were bare and loose within the groove. The non-adhered sections of the FBG fibers kept slipping out of the groove when sliding on the stainless steel jacket.
Signal disappearance most likely occurred due to micro-bending in the FBG fiber caused by either a pinched or bent fiber within the channel or between the copper former and steel jacket. During micro-bending, the core is pinched where light cannot transmit properly in the core of the fiber [30]. The micro-bending attenuation worsened during cooldown due to differences in thermal expansion coefficients between the glass fiber core and the copper former or steel jacket. This is evident by the slowly decreasing peak of the FBG signal as the temperature dropped—figure 8 demonstrates the light intensity slowly decreasing as the pinching stress increased on the fiber.
In order to prevent future signal loss, it is recommended to embed the entire fiber (including the non-sensing regions between gratings) in Stycast or similar adhesive material. A fully embedded fiber within the groove will mitigate microbending, create an easier stainless steel jacket installation procedure, and reduce risk of damaging loose fiber during handling.
5.2. Reducing the strain to thermal fiber response ratio
Although the strain to thermal fiber response ratios for the SULTAN facility tests are high and unfavorable, fibers with special coatings experiencing a full quench scenario will significantly reduce the ratios and will prevent false positives during quench detection since both FBG and ULFBG sensitivities will increase with temperature (figure 13). Because the SULTAN facility superconducting transformer cuts off the supplied current before a fully developed quench and temperature profile can occur, we are unable to measure the full extent of the fiber's temperature sensitivity at higher temperatures. Additionally, for dedicated studies on quench detection and quench dynamics it is highly desirable to observe a fully developed quench and normal zone to ensure that the full range of quench dynamics is captured and that the overall process is well understood.
Previously in section 4.3, we have shown that the FBG strain to thermal fiber response can decrease from 100:1 to 12.5:1 solely by allowing the sample temperature to increase from 12 K to 20 K (based on increase fiber sensitivity shown in figure 13). As the temperature continues to rise above 20 K, a further reduction in the strain to thermal ratio will be observed as the fiber sensitivity increases. In addition, selecting special fiber coatings will also increase the temperature sensitivity. Other FBG studies have shown coatings such as PMMA can increase the sensitivity of a bare or polyimide coated grating by a factor of 8 at 15 K and a factor of 25 at 50 K [31]. These increases in sensitivity translate to an integrated factor of 50 increase in fiber signal across the temperature ranges of 15–50 K. Because insulated CICC cables typically see damage at temperatures above 150 K, a factor of 50 increase in fiber signal before 50 K temperature is reached provides further confidence in quench detection feasibility before damage can occur. Additionally, these calculations show the importance of testing the fibers during a fully developed quench test with different coatings to maximize temperature sensitivity and evaluating the maximum allowable temperatures for detection.
In addition, the quench detection algorithm can be optimized to consider the difference in the fiber's transient response to mechanical strain versus thermal runaway. If the fiber responds to changes in mechanical strain on a time scale orders of magnitude different than the fiber's transient response to thermal runaway, it may be feasible to apply some sort of rate of change criterion to distinguish between the two signals. Optimization of quench detection algorithms will depend on the magnet application and environment.
5.3. Decreasing the diffusive response time
A delay time of 3–4 s was predicted based off of the experimental results of both the FBG and ULFBG response times for 20 K operating test case and a nearly instantaneous response time was observed for the ULFBG fiber during a 10 K quench test. The difference in response time are due to the change in thermal diffusivity of Stycast at the different temperatures. Although a 3–4 s delay time for the 20 K case may seem concerning, this does not necessarily mean that the quench detection is delayed by 3 s. The same thermodynamics causing slow thermal diffusion to the fiber sensor also dictate the slow propagation and development of a quench. For example, a quench onset delay of approximately one second is observed in figure 19 which only shows the last heater pulse leading to thermal runaway from figure 9. As expected, the ULFBG signal shows an immediate response soon followed by the FBG signals preceding the rise in the voltage. In contrast, a quench onset delay of approximately 18 s is observed in figure 20. Although there is a noticeable delay between the rise in ULFBG signal and when the heater pulse stopped, both fiber signals still show a significant and continuous rise in signal from the time of heater shutoff to the time of quench onset. Figure 20 clearly shows that a 3–4 s delay in fiber response is more than enough time to detect a quench (especially when it takes an additional 18 s for quench onset), if not predict the quench before thermal runaway ensues.
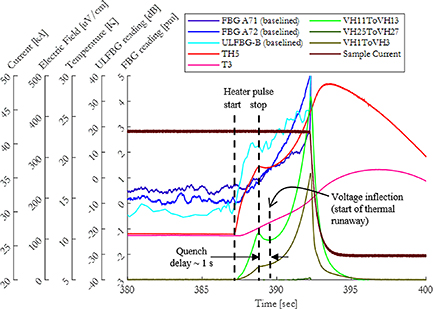
Figure 19. This plot focuses on the last heater pulse that initiates the thermal runaway (quench) at 10 K. This is the same test as shown in figure 9. The onset of thermal runaway, or quench, is defined as the voltage inflection of the electric field measurement at voltage taps VH11ToVH13 centered at the heater location. Both ULFBG and FBG signal A72 show rise before or at the same time as the voltage inflection/thermal runaway.
Download figure:
Standard image High-resolution image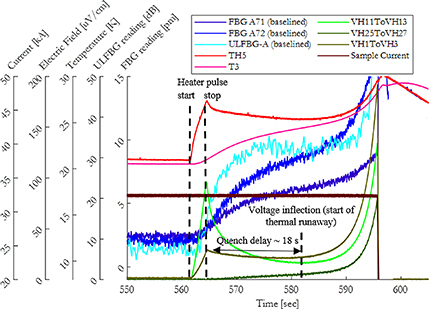
Figure 20. This plot focuses on the last heater pulse that initiates the thermal runaway (quench) at 20 K. This is the same test as shown in figure 10. Similar to figure 19, the onset of thermal runaway, or quench, is defined as the voltage inflection of the electric field measurement at voltage taps VH11ToVH13. Both ULFBG and FBG signals show rise before the voltage inflection/thermal runaway.
Download figure:
Standard image High-resolution image
Although the thermal responses are sufficiently fast for the quench measurement of the VIPER cable tests and can detect a thermal runaway prior to voltage signals, further reduction in delay time is possible. For both fiber technologies, the dominant delay term is the delay due to adhesive diffusion or due to the thermal propagation between gratings for the FBG only. Fortunately, these terms can be controlled by either choosing an adhesive material with higher diffusivity or by decreasing the space between FBG sensors to minimize propagation time. For example, Cry-Con grease, a copper-filled thermal grease, has a significantly higher diffusivity at 4 K when compared to the Stycast, ∼0.5 mm2 s−1 and 0.04 mm2 s−1, respectively [29, 32]. When applying the diffusion equation (equation (8)) and assuming 20 μm thickness of each material at 4 K conditions, the Cry-Con diffusion time is 0.08 s for Cry-Con and 1 s for Stycast, yielding an order of magnitude reduction of time when using Cry-Con. Additionally, other adhesives such as an epoxy mix with 46.5 vol% of SiO2 have been proven to show low stresses due to low thermal expansion while exhibiting high conductivities during cryogenic testing of Roebel cables [33]. With the optimization of materials and installation methods yielding sub-second diffusion times, the fiber technologies can detect early indications of a quench event significantly faster than other methods.
6. Conclusion
In experimental tests at SULTAN on high current HTS VIPER cables, FBG and ULFBG fiber technologies demonstrated several characteristics necessary for detecting quench in HTS cables: first, they demonstrated better performance in identifying an early-stage quench growth before thermal runaway occurred compared to voltage taps; second, SNR increases with larger quench energies, accelerates when the conductor is operating in lower quench stability regimes, and are at least 2–3 times higher than co-wound voltage tap systems designed for large fusion magnets; third, the temperature sensitivity for both fibers increase with temperatures (as the quench region grows); and fourth, the fiber response time is tunable for both fibers and often times precedes a voltage tap when responding to a thermal disturbance (for ULFBG) and can precede voltage taps in detecting a quench event by tens of seconds. Based on all of these factors, using fiber optic technologies for HTS magnets quench detection or as a dual verification method with voltage show great promise.
Furthermore, the base technologies—manufacturability, fiber lengths, optical interrogators, data acquisition—scale with minimal technological risk to lengths as large as 100 m or more, making them suitable for quench detection systems required in full-scale magnets for fusion energy and other large-scale magnet applications. Increasing passive fiber length (length of fiber that is not grated—not used for thermometry) can occur with negligible signal attenuation (for light wavelengths of 1460–1620 nm, attenuation is expected in the range from 0.2 to 0.3 db km−1) [34]. Although the FBG and ULFBG technologies show promise, there is still significant research and development that is needed to translate this technology into a working quench detection system. As discussed in the strain sensitivity section, both fiber technologies show significantly higher sensitivity to mechanical strain. At present, the fiber signal cannot distinguish between non-quench mechanical strain and strictly thermal strain. Future research includes selecting fiber coatings that enhance the temperature sensitivity, optimizing the installation process to mitigate mechanical strain effects, and incorporating a fiber balanced bridge circuit (to cancel out the mechanical component by utilizing an active and dummy FBG). Further development work includes optimization of bonding conditions between the fiber and the conductor to reduce thermal response and prevent signal loss. This includes determining the optimum fiber location within the conductor, the method of installation to prevent signal attenuation during cooldown, and bonding agents to minimize strain effects and response time of the fibers. Lastly, the fibers must be tested on long lengths of conductor to experimentally verify that longer lengths of fiber, ULFBG in particular, still function as expected.
The installation of the FBG and the ULFBG fiber system within the new HTS VIPER cable structure was simple and eliminated many existing concerns with incorporating fibers into large scale fusion magnets such as high temperature heat treatment and helium channel extraction issues. The fiber responses exhibit great promise as a quench detection system when compared to voltage and Cernox temperature sensor signals. In particular, the fibers succeeded in measuring a slowly propagating wave and intensified its signal as the quench region grew while the voltage taps did not measure the same growth in signal. However, a few shortcomings from the experimental work bred identifiable solutions for future development work such as de-risking the fiber installation process via embedding the entire fiber in adhesive, decreasing the strain to thermal response ratio by using selected coatings, and increasing the fiber response time by testing different adhesives. With future development, FBG and ULFBG fiber quench detection has the potential to introduce a reliable and effective method of quench detection for HTS magnets with known slow propagation velocities and operating in complex environments such as tokamak fusion devices.
Acknowledgments
This work was sponsored by Commonwealth Fusion Systems. The implementation of the test would not be possible without the hard work and efforts of the SULTAN team at PSI. The authors greatly appreciate the support by Pierluigi Bruzzone, Boris Stepanov, Kamil Sedlak, Christoph Muller, Markus Jenni, and Manuel Holenstein. Additionally, the authors thank the MIT personnel who worked on designing and manufacturing the VIPER cable: Mike Rowell, Pete Stahle, Makoto Takayasu, Alexey Radovinsky, and the rest of the technical and engineering staff. The authors also thank Brandon Sorbom from Commonwealth Fusion Systems.
In the preparation and development work required for their contributions to this work, CERN was funded by the European Union's Horizon 2020 Research and Innovation programme under Grant Agreement No 730871.
The financial support for some of the RRI work was provided by the New Zealand Ministry of Business, Innovation and Employment (MBIE) 'Endeavour Fund' Grant No. RTVU1707.