


Abstract
The objective of this study was to investigate the 'lift-off effect' in zinc open cells, where an anomalously large change in temperature is observed when the standard platinum resistance thermometer (SPRT) is lifted off the bottom of the re-entrant tube during an immersion profile measurement. The goal was to determine the most important influences and hence what measures could be taken to mitigate it. The influences investigated were the filling gas, re-entrant tube material, re-entrant tube exterior surface condition, and the SPRT design. For each of these influence variables, three options were chosen. Since testing all combinations of different configurations arising would be extremely time consuming, the authors employed the optimal 'design of experiments' method using orthogonal arrays described by the Taguchi method, which is commonly used in manufacturing to optimise processes. Nine test configurations were identified, giving the necessary information on the interrelation between all influence variables. According to these results, the ideal configuration that yields the optimum immersion profile is a borosilicate tube, with full sandblasting and using nitrogen as filling gas for the cell. In addition, one particular SPRT design was found to be the least sensitive to the lift-off effect.
Export citation and abstract BibTeX RIS
1. Introduction
The International Temperature Scale of 1990 (ITS-90) [1] provides a scheme for approximating the SI unit of temperature, the kelvin, by prescribing a series of reference temperatures, typically melting or freezing points of pure elements [2], for calibration of standard platinum resistance thermometers (SPRTs), and a scheme for interpolating between them. It is supplemented by more detailed guidance on realisation of the scale, in particular how to implement the reference, or 'fixed' points [3]. Over the temperature range from the triple point of equilibrium hydrogen (13.8033 K) to the freezing point of silver (961.78 °C), the defined interpolating thermometer for realisation of the ITS-90 is the SPRT.
For the metal freezing points, the fixed-point assembly generally consists of a cylindrical graphite crucible containing the metal ingot, with a graphite tube penetrating the ingot along its axis to enable insertion of a thermometer so that the sensing element at its end is almost completely surrounded by the ingot. This is then placed in a furnace which has been carefully optimised to maximise the temperature uniformity in the vicinity. The ITS-90 specifies that melting and freezing points apply at a pressure of 101 325 Pa, and an inert gas is used to achieve this (note that the inert gas also has a bearing on the thermal performance of the system, as will be described in this study).
An important factor in the performance of fixed-points is the extent to which the SPRT measurement is affected by thermal perturbations, e.g. stem conduction and furnace effects. This is indicated by an immersion test, where the SPRT is used to measure the temperature as a function of vertical position within the fixed-point re-entrant tube. If the measurement is free of spurious thermal effects, the SPRT should track the hydrostatic-head correction, at least over a few tens of millimetres, to indicate that it is reliably measuring the temperature of the ingot [3].
Immersion characteristics strongly depend on the design of the cell and its assembly, maintenance system, SPRT, realisation method, the rate of freezing and the elapsed duration of plateau [4]. There are two key types of fixed-point cell [3], namely sealed cells, whereby the cell is hermetically sealed within a gas-tight envelope (usually quartz) and 'open cells', whereby the gas pressure within the cell can be measured and controlled by an external gas handling system.
An increasingly commonly observed effect, particularly with the metal fixed-point cells zinc and aluminium, is the so-called 'lift-off' effect, whereby a jump in measured temperature is seen during an immersion profile measurement as the SPRT is lifted off the bottom of the re-entrant tube. This was originally extensively studied by McLaren and Murdock [5]. Tavener and Blundell [6] observed a relationship between immersion 'lift-off' effect and the condition of the re-entrant tube of open cells of zinc and aluminium, which was also observed by McLaren and Murdock [5], Rudtsch et al [7], and Evans and Wood [8].
Some authors have hypothesised that a cause may be related to the conditions within the cell, due to, for example, 'bridges' of solid in the ingot due to sub-optimal initiation of the freeze and/or thermal conditions [9–12] or the appearance of macroscopic convex solid formations [13]. Local variations in temperature distribution arising from the immersion test itself were also investigated [14]. Pearce et al [15] found a strong dependence of the effect on the type of SPRT construction, and on the condition and nature of the re-entrant tube in open cells. Interestingly, the lift-off effect has not been observed in any sealed cells at NPL; it is worth noting in this respect that the sealed cell differs from the open cell chiefly in that there is a complete physical break of the guide tube leading to the top of the furnace.
The aim of the current study is to assess the impact of a number of key aspects of the fixed-point realisation system on the lift-off effect; specifically, the influence of SPRT guide tube material and exterior surface condition, filling gas, and SPRT construction. To investigate all possible combinations of conditions is not feasible, so the Taguchi method was employed [16–19].
The Taguchi method [19] is based on the concept of 'factorial design' of experiments. Factorial design was originally developed by Fisher to optimise agricultural land use [17], and then further developed for industrial manufacturing applications by Taguchi [18, 19]. A full factorial design identifies all possible combinations for a given set of factors. As there are generally a large number of factors, a full factorial design will involve a large number of experiments. The goal here is to select a limited number of configurations, from the full set, which produces the most possible information. Taguchi constructed a generally applicable set of guidelines for factorial experiments. By using so-called 'orthogonal arrays' comprising the influence variables and their potential values and a 'performance parameter' to be optimised (in this case, the magnitude of the immersion lift-off effect) it is possible to specify the smallest number of trials, and which ones, that give full information on how the factors influence the performance parameter.
The paper is laid out as follows: section 2 describes the open zinc cell and the details of its set-up. Section 3 contains a description of the measurements performed, and section 4 introduces the Taguchi 'design of experiments' method. Section 5 presents the results, and section 6 describes the analysis procedure. Finally, section 7 gives some conclusions.
2. Zinc freezing point cell and initial set up
2.1. Open zinc cell description
The zinc cell, which is at the centre of this study, was constructed according to an NPL design and protocol. The metal employed in the cell was nominally 99.9999% pure (supplied by Alfa Aesar) and the graphite components were stated by manufacturer, SGL Carbon, to be 99.9995% pure. The gases employed in this investigation were BIP® grade (99.9999% pure, supplied by Air Products) and contained in dedicated 10 l cylinders.
The zinc ingot was contained in a graphite crucible, with a graphite re-entrant well into which a quartz or borosilicate tube was inserted to give access for the SPRT. Above this an array of graphite felt discs was interspersed with graphite heat-shunt discs for a total height of 15 cm. The assembly was enclosed in a quartz tube with a metal cap and seal at the top, which also provided a seal for the axial re-entrant guide tube. The top-cap allowed connection of the volume to an external gas handling system for pumping and backfilling the cell with the gases tested, and for measuring the pressure in the cell by means of a digital gauge. The zinc cell assembly is illustrated in figure 1.
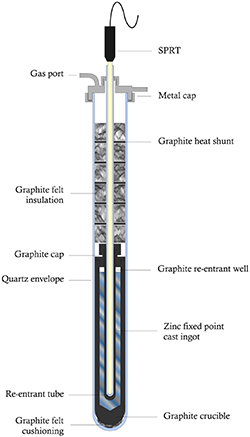
Figure 1. Schematic of the open (re-sealable) zinc cell.
Download figure:
Standard image High-resolution image2.2. Furnace optimisation
The cell was set up in a three-zone tube furnace. Prior to the immersion tests, the furnace was optimised at 410 °C in order to achieve the best temperature homogeneity along that part of the length where the zinc ingot would be positioned.
The cell ingot allowed for 174 mm of immersion depth for SPRTs. The furnace was optimised with respect to the temperature profile inside the re-entrant tube of the cell. The sensing element of the SPRT used for the tests was 40 mm long, positioned 10 mm away from the tip of the thermometer. The tests were performed by taking readings of the SPRT positioned at full immersion and subsequently at every 2 cm up to a total of 14 cm, where the sensing element of the thermometer would be averaging the temperature approximately at the level of the surface of the zinc ingot when molten. Various settings for the top and bottom end zone controllers were trialled following this protocol. With the best adjustment it was possible to achieve a homogeneity of less than 5 mK along a length of 12 cm from near the bottom of the re-entrant well of the cell. The stability of the furnace was also tested and optimised to a maximum variation of less than 6 mK (peak-to-peak) for a period of 15 h. This is adequate when it is considered that the immersion tests were carried out for a maximum of 8 h of plateau.
2.3. Phase transition conditions
Throughout all measurements, the furnace was held at the same set point temperatures for melting and freezing the cell respectively in order to ensure the reproducibility of the curves (especially the distribution of impurities during the freezing plateaus). The cell was melted at approximately 5.5 °C above the melting temperature (at which it would be kept for at least 12 h prior to freezing). Freezing curves were initiated at 1.5 °C (and subsequently maintained at 0.5 °C) below the freezing point to obtain plateaux lasting for 18 h. Once these settings were defined, several freezing curves were measured to verify the repeatability of the curves with respect to the onset of the freeze after initiation, so that no noticeable changes in temperature were detected in the freezing plateau over the timescales needed to collect representative immersion profiles (see figure 2). This was required because depending on the set-up to maintain the freezing curve, it was observed that after between 30 min and 60 min the temperature would still ramp up by 0.2 mK in relation to the beginning of the freeze, i.e. a settling time of at least an hour is needed to achieve the required reproducibility of the immersion profiles. To avoid the influence of this effect, the immersion tests were only started around 90 min after the onset of freeze was observed.
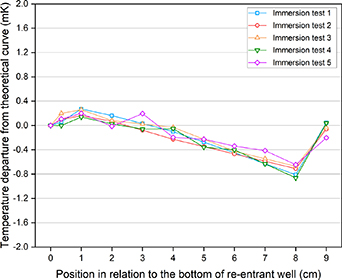
Figure 2. Measurements of the immersion profile, in terms of deviation from the theoretical value, performed with SPRT design 'C' to evaluate the repeatability of the measurements. The cell was set up with a quartz re-entrant tube, partially sandblasted, and the gas used was argon. It shows overall good repeatability of the measurements.
Download figure:
Standard image High-resolution imageFearing that the cell could leak slightly (especially when operated with helium), the cell was operated with a slight over-pressurisation in relation to atmospheric pressure, and its pressure was constantly monitored with a pressure indicator set up next to the furnace. Pressure in the cell was monitored throughout the measurements and the corresponding corrections were applied at each immersion.
3. Measurements
3.1. Initial tests and measurement protocol
A series of initial tests were done to determine the suitability of the measurement protocol set. The protocol consisted of measurements at 0 cm, 0.1 cm, 1 cm, 2 cm, 3 cm, 4 cm, 5 cm, 6 cm, 7 cm, 8 cm and a check back at full immersion. These measurements included numerous stable readings at each of the currents 1 mA and  that allowed for calculations of the thermometers' self-heating effect and extrapolations to 0 mA. The standard deviations of the mean did not exceed 1 µΩ (equivalent to 12 µK) for the vast majority of cases. Other tests verified the repeatability of the measurements, to enable a single immersion test per trial to be taken as an adequate representation of the effects investigated in them. This is shown in figure 2, which shows the deviation from the theoretical immersion profile (i.e. the measured profile added to the hydrostatic correction) [3].
3.2. Equipment
The other equipment used in this study consisted of an ASL F900 bridge with a calibrated 100 Ω standard resistor, a three-zone furnace (Fluke model 9114), a digital pressure indicator, GE Druck model DPI 145 (for atmospheric pressure) and a gas handling system connected to a turbo pump, Pfeiffer model HiCube Eco 80 with a digital pressure gauge GE Druck model DPI 104.
3.2.1. SPRTs.
The SPRT designs were chosen because they represent some of the most common designs available. They randomly share similarities with each other. Their sensing elements were mounted either on a silica cross that was fixed inside the sheath or on a twisted silica plate which was just hanging unsupported inside the sheath [3]. These details can be found in table 1. One of these designs was chosen also particularly for its anomalous performance in immersion tests during previous measurements in open zinc cells [15] (its temperature increases as the SPRT is lifted from the cell).
Table 1. Characteristics of the SPRTs used in the study.
| Design 'A' Silica cross | Design 'B' Silica cross | Design 'C' Twisted silica plate | |
|---|---|---|---|
| Diameter | 7.1 mm | 6.9 mm | 7.4 mm |
| Total length of sheath | 517 mm | 601 mm | 481 mm |
| Sensing element | |||
| Distance from tip (outer) Coil length 4-wire connections at Full mounting Mid-sensor point | 3 mm 33 mm 37 mm 47 mm 21.5 mm | 13 mm 36 mm 38 mm 48 mm 32 mm | 11 mm 36 mm 43 mm 41 mm 32.5 mm |
| Sandblasted area | |||
| Length Distance from the tip | 203 mm 42 mm | 531 mm 70 mm | 375 mm 45 mm |
| Radiation baffles | |||
| Quantity Thickness Position of 1st baffle Spacing in between | 9 1 mm 50 mm 31 mm (×4), then 61 mm (×2), then 102 mm (×2) | 25 1 mm 59 mm 21 mm | 8 1 mm 41 mm 51 mm (4th and 5th baffles are 133 mm apart) |
4. Design of experiments
In previous work on this subject [15], the nature of the glass components, sandblasting configuration, and radiation baffle arrangement (in other words radiative heat transfer effects) was identified as one potential influence variable, which is why the glass type, sandblasting configuration, and SPRT construction type was included as influencing variables in the current work. The fixed-point fill gas was included as another variable as it was suspected that this might be important.
The aim of this study is to investigate the influence of different factors on the measured immersion profiles (in particular the 'lift-off effect' which is the magnitude of the initial rise as the SPRT is lifted off the bottom of the re-entrant tube). They are:
- (a)the fill gas, whose thermal conductivity is expected to be important: the gases chosen are argon, helium and nitrogen.
- (b)the material used in the glass re-entrant tube, which influences the transmission of radiative heat transfer from the cell interior: the materials chosen are quartz, borosilicate and translucent quartz.
- (c)the type of sandblasting on the re-entrant tube, which influences the radiative transmission by reflection: these are 'partial', where the whole tube exterior is sandblasted except for a short section in the vicinity of the sensing element; 'full', where the whole tube exterior is sandblasted; and 'none', where none of the tube exterior is sandblasted.
- (d)the type of SPRT used: these are summarised in table 1.
If each of the four configurations above has three different options, this represents far too many different configurations to test, so a means of simplification of the experiments is needed.
For experiments involving the investigation of the effect of several independent parameters on some outcome, Fisher [17] proposed the factorial design of experiments. This involves the identification of all possible combinations for a given set of factors. Since experiments like this generally involve a large number of parameters, a full factorial design yields a very large number of possible trials. To make the exercise tractable, the number of experiments must be reduced to a small subset of trials. Taguchi [15, 16] constructed a rigorous framework for minimising the number of experiments to be performed while retaining the key information required of them.
The method uses a set of arrays called 'orthogonal arrays', which stipulate the smallest set of measurements needed to give comprehensive information on all the factors that independently affect the performance parameter.
4.1. The orthogonal array
Each array is meant for a specific number of independent design variables and levels. In our case, if an experiment will be performed to characterise the influence of four different independent variables with each variable having three particular values (level values), then a so-called L9 orthogonal array would be the right choice. In table 2 it can be seen that a total of nine trials are needed, each trial having a particular set of combinations of level values.
Table 2. Layout of the L9 orthogonal array. The numbers in each variable column indicate the level of that variable.
| L9 orthogonal array | |||||
|---|---|---|---|---|---|
| Trial # | Independent variables | Performance parameter value | |||
| Variable 1 | Variable 2 | Variable 3 | Variable 4 | ||
| 1 | 1 | 1 | 1 | 1 | P1 |
| 2 | 1 | 2 | 2 | 2 | P2 |
| 3 | 1 | 3 | 3 | 3 | P3 |
| 4 | 2 | 1 | 2 | 3 | P4 |
| 5 | 2 | 2 | 3 | 1 | P5 |
| 6 | 2 | 3 | 1 | 2 | P6 |
| 7 | 3 | 1 | 3 | 2 | P7 |
| 8 | 3 | 2 | 1 | 3 | P8 |
| 9 | 3 | 3 | 2 | 1 | P9 |
The performance parameter value is chosen to be the magnitude of the resistance change on moving the SPRT from a height of 0 cm to 1 cm, taken from the complete immersion curves performed.
Table 3 shows the variables and levels for this study. For the re-entrant tubes that were sandblasted, their sandblasting was done either over a length of 370 mm from the closed end (designated here as 'full' sandblasting) or over a length of 300 mm starting at 70 mm away from the closed end. In the latter case, this leaves a clear path for radiative heat transfer in the region where the sensing element would be located when resting at the bottom of the well. This is denoted as 'partial' sandblasting.
Table 3. The variables ('Factors') and their values ('Levels').
| Level | ||||
|---|---|---|---|---|
| Variable | 1 | 2 | 3 | |
| 1 | Fill gas | Argon | Nitrogen | Helium |
| 2 | Guide tube | (clear) Quartz | Borosilicate | Translucent quartz |
| 3 | Sandblasting | Partial | Full | None |
| 4 | SPRT | design 'A' | design 'B' | design 'C' |
4.2. Properties of the orthogonal array
The orthogonal array has the following special properties that reduces the number of experiments to be conducted.
- (a)The column under each independent variable (table 2) has a particular combination of level settings. All the level settings appear an equal number of times. For each variable, the L9 array levels 1, 2 and 3 appear three times. This is called the balancing property of orthogonal arrays.
- (b)All the level values of independent variables are used for conducting the experiment.
4.3. Minimum number of experiments to be conducted
The minimum number of experiments needed, N, for M variables each having Li levels is given by:
In our case, there are four independent variables each having three levels which yields nine experiments.
5. Results
Resistance values (extrapolated to 0 mA) were corrected for any pressure deviations in the cell from the standard atmosphere (101 325 Pa). The variation of resistance yielded by changing the immersion of the SPRTs were calculated and subsequently expressed in terms of temperature departures from the theoretical hydrostatic head effect, as stated in the ITS-90 guides [3]. The coefficients used for these calculations were 0.37 µΩ mbar−1 and 2.35 µΩ cm−1. Conversions of resistance to temperature used the sensitivity coefficient (dR/dT) of 0.087 Ω K−1.
The results of the nine experiments are given in figure 3 (note that here and later, 'sb' refers to sand-blasting). They are plotted as temperature departures in relation to the theoretical curve, meaning that the ideal measured curve would be at 0 mK along the abscissa. These values are also tabulated in table 4.
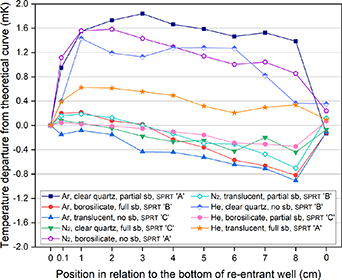
Figure 3. The immersion curves from the nine experiments plotted as temperature departures from the theoretical hydrostatic curve.
Download figure:
Standard image High-resolution imageTable 4. Results of the experiment. Values in bold denote the largest deviation (in modulus) in each trial. 'Position' denotes the height of the SPRT above the bottom of the re-entrant tube.
| Departures from the theoretical immersion curve | |||||||||
|---|---|---|---|---|---|---|---|---|---|
| Position cm | Trial 1 mK | Trial 2 mK | Trial 3 mK | Trial 4 mK | Trial 5 mK | Trial 6 mK | Trial 7 mK | Trial 8 mK | Trial 9 mK |
| 0 | 0.00 | 0.00 | 0.00 | 0.00 | 0.00 | 0.00 | 0.00 | 0.00 | 0.00 |
| 0.1 | 0.95 | 0.20 | −0.15 | 0.08 | 1.12 | 0.16 | 0.40 | 0.05 | 0.39 |
| 1 | 1.55 | 0.22 | −0.08 | 0.04 | 1.56 | 0.19 | 1.43 | 0.02 | 0.63 |
| 2 | 1.73 | 0.08 | −0.15 | −0.05 | 1.58 | 0.13 | 1.19 | −0.01 | 0.61 |
| 3 | 1.84 | 0.02 | −0.43 | −0.18 | 1.43 | 0.00 | 1.13 | −0.05 | 0.56 |
| 4 | 1.66 | −0.23 | −0.44 | −0.27 | 1.29 | −0.14 | 1.28 | −0.10 | 0.49 |
| 5 | 1.59 | −0.36 | −0.52 | −0.25 | 1.14 | −0.29 | 1.28 | −0.16 | 0.32 |
| 6 | 1.46 | −0.57 | −0.64 | −0.42 | 1.00 | −0.30 | 1.27 | −0.29 | 0.21 |
| 7 | 1.53 | −0.66 | −0.71 | −0.20 | 1.04 | −0.47 | 0.82 | −0.31 | 0.30 |
| 8 | 1.39 | −0.82 | −0.91 | −0.44 | 0.85 | −0.70 | 0.37 | −0.35 | 0.34 |
| 0 | −0.13 | −0.12 | −0.11 | −0.07 | 0.24 | 0.12 | 0.35 | 0.07 | 0.10 |
The minimum number of trials was performed so there is no redundancy in the measurements. However, some clear findings emerge. From these results, it can be seen that the behaviour of SPRT design 'A' (used in trials 1, 5 and 9) was considerably improved when the thermal conditions of the cell were changed to a particular set (Trial 9, using a translucent tube, sandblasted for 370 mm from the closed end and using helium as a fill gas for the cell). On the other hand, it can also be observed that the opposite occurred for SPRT design 'B' (trial 7), when the cell was set up using a quartz tube without any sandblasting and helium as a fill gas. This could be a premature indication that in this case the fill gas had little or no influence in the results, the difference in performance being due to the type of material and/or surface treatment (sandblasting). In order to check for consistency, this experiment (trial 7) was also measured with the other SPRTs and similar anomalous results were observed (for SPRT design 'A' deviations from the theoretical curve were in excess of 4 mK).
Apart from the three curves measured with the design 'A' thermometer and the anomalous curve obtained with design 'B' (trial 7), the largest deviations from the theoretical curve were always found at the position where the thermometers were placed the furthest from the bottom of the re-entrant well (8 cm). These are also followed by positions 7 (except for trial 4) and 6 in these cases, which reinforces the fact that the further from the bottom the SPRT is, the larger the heat loss it is subjected to. Interestingly, this seems to occur irrespectively of construction characteristics, namely the number and position of radiation baffles (as seen in table 1), since for approximately 34 cm of immersion in the cell assembly (the SPRT being lifted 8 cm), SPRT design 'B' had a total of 14 radiation baffles compared with only 5 in the SPRT design 'C' positioned inside the assembly. Given the number and spacing of baffles, design 'B' should be considerably less sensitive to these heat losses, which are presumed to be due to radiative heat transfer, but the experimental results do not support this assumption.
Previous measurements performed during regular calibrations suggest that there is an effect when the SPRT tip is just (i.e. a few millimetres or less) decoupled from the bottom of the re-entrant well. With a view to observing this effect, the same results were also plotted being offset at 0.1 cm (figure 4) and 1 cm (figure 5), and tabulated in tables 5 and 6, respectively. By 'offset', we mean that the deviation from the theoretical curve is now expressed as deviation from the value at 0.1 cm and 1 cm respectively, rather than the deviation from the value at full immersion (i.e. SPRT touching the bottom).
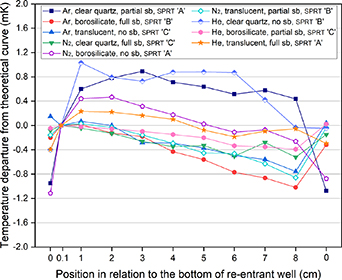
Figure 4. Immersion curves for the trials, offset at 0.1 cm.
Download figure:
Standard image High-resolution image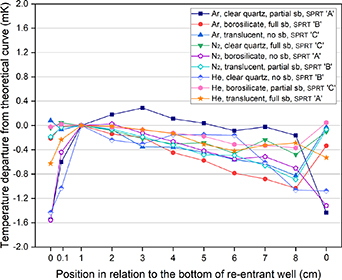
Figure 5. Immersion curves for the trials, offset at 1 cm.
Download figure:
Standard image High-resolution imageTable 5. Results of the experiments offset at 0.1 cm. Values in bold denote the largest deviation (in modulus) in each trial.
| Departure from theoretical curve—as per the list of experiments | |||||||||
|---|---|---|---|---|---|---|---|---|---|
| Position cm | Trial 1 mK | Trial 2 mK | Trial 3 mK | Trial 4 mK | Trial 5 mK | Trial 6 mK | Trial 7 mK | Trial 8 mK | Trial 9 mK |
| 0 | −0.95 | −0.20 | 0.15 | −0.08 | −1.12 | −0.16 | −0.40 | −0.05 | −0.39 |
| 0.1 | 0.00 | 0.00 | 0.00 | 0.00 | 0.00 | 0.00 | 0.00 | 0.00 | 0.00 |
| 1 | 0.60 | 0.02 | 0.07 | −0.04 | 0.44 | 0.03 | 1.03 | −0.02 | 0.23 |
| 2 | 0.78 | −0.13 | 0.00 | −0.13 | 0.47 | −0.03 | 0.79 | −0.05 | 0.22 |
| 3 | 0.89 | −0.18 | −0.28 | −0.26 | 0.31 | −0.16 | 0.73 | −0.10 | 0.16 |
| 4 | 0.71 | −0.43 | −0.29 | −0.35 | 0.18 | −0.29 | 0.88 | −0.15 | 0.10 |
| 5 | 0.64 | −0.56 | −0.37 | −0.33 | 0.02 | −0.45 | 0.88 | −0.20 | −0.08 |
| 6 | 0.52 | −0.77 | −0.49 | −0.50 | −0.11 | −0.46 | 0.87 | −0.33 | −0.19 |
| 7 | 0.58 | −0.86 | −0.56 | −0.28 | −0.07 | −0.63 | 0.42 | −0.35 | −0.09 |
| 8 | 0.44 | −1.02 | −0.76 | −0.52 | −0.26 | −0.86 | −0.03 | −0.39 | −0.06 |
Table 6. Results of the experiments offset at 1 cm. Values in bold denote the largest deviation (in modulus) in each trial.
| Departure from theoretical curve—as per the list of experiments | |||||||||
|---|---|---|---|---|---|---|---|---|---|
| Position cm | Trial 1 mK | Trial 2 mK | Trial 3 mK | Trial 4 mK | Trial 5 mK | Trial 6 mK | Trial 7 mK | Trial 8 mK | Trial 9 mK |
| 0 | −1.55 | −0.22 | 0.08 | −0.04 | −1.56 | −0.19 | −1.43 | −0.02 | −0.63 |
| 0.1 | −0.60 | −0.02 | −0.07 | 0.04 | −0.44 | −0.03 | −1.03 | 0.02 | −0.23 |
| 1 | 0.00 | 0.00 | 0.00 | 0.00 | 0.00 | 0.00 | 0.00 | 0.00 | 0.00 |
| 2 | 0.18 | −0.14 | −0.07 | −0.08 | 0.03 | −0.06 | −0.24 | −0.03 | −0.01 |
| 3 | 0.29 | −0.20 | −0.35 | −0.22 | −0.13 | −0.19 | −0.30 | −0.07 | −0.07 |
| 4 | 0.11 | −0.45 | −0.36 | −0.30 | −0.27 | −0.32 | −0.15 | −0.13 | −0.13 |
| 5 | 0.04 | −0.58 | −0.44 | −0.28 | −0.42 | −0.48 | −0.15 | −0.18 | −0.31 |
| 6 | −0.09 | −0.79 | −0.56 | −0.46 | −0.55 | −0.49 | −0.16 | −0.31 | −0.42 |
| 7 | −0.02 | −0.88 | −0.63 | −0.24 | −0.51 | −0.66 | −0.61 | −0.33 | −0.33 |
| 8 | −0.16 | −1.03 | −0.83 | −0.48 | −0.70 | −0.89 | −1.06 | −0.37 | −0.29 |
Note that changing the offset does not seem to affect the results significantly. The curves in figure 5 are bunched more closely together, especially for trials 1, 5, 7 and 9, but the largest differences are still found at the same SPRT positions as in the absence of any offsets: i.e. in four cases a residual 'lift-off' effect is still evident.
With the offset at 1 cm, above the lift-off zone except for results from trial 1, the largest deviations moved, as expected, to the least immersed position or close to it (for trial 9). This could mean that the SPRTs either behave in such a manner inherently (as the thermometer is moved up in the re-entrant well it initially shows increments in temperature and then when it is positioned 1 cm above the bottom it then starts behaving more in accordance with theory) and that this behaviour is due to their construction, or that the behaviour is due to other factors, such as the use of a clear quartz lining tube with partial or no sand-blasting.
Since offsetting the results at 1 cm proved to bring SPRT design 'A' curves to expected levels (i.e. more in line with the theoretical behaviour due to the hydrostatic effect), these results could suggest that there is a relation between the anomalous behaviour of this SPRT in the immersion tests and the proximity of its sensing element to its tip (there is only a 3 mm gap). This is especially true if this feature (together with the length of the platinum coil and the position of the 4-wire connection) for the other two designs is taken into account: the sensor mid-point for the other two designs is located approximately 10 mm further away from the tip in relation to design 'A' (around 32 mm instead of 21.5 mm). This could be due to other design features but coincidentally the other two SPRT models do not show the anomalous behaviour seen with design 'A'.
6. Taguchi analysis procedure
In this analysis the object is to minimise the performance parameter (here, the magnitude of the lift-off effect), and following the Taguchi method [18, 19], this is characterised by the so-called 'signal to noise ratio' (η) is given by
where yi is the ith performance parameter of a set measured for each configuration (i.e. each trial in table 2). If only one performance parameter is available for the configuration this reduces to
The overall signal to noise ratios S for the individual variables can be expressed as shown in table 7. The average signal to noise ratio is given by S/3.
Table 7. Signal to noise ratio S for the individual variables. ηk is the signal to noise ratio corresponding to trial k of table 2.

|

|

|

|

|

|

|

|

|

|

|

|
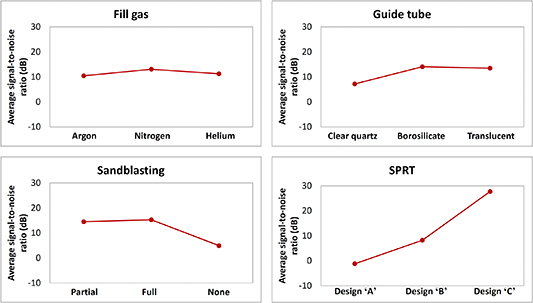
The variable levels corresponding to the highest average signal to noise ratio can then be chosen to optimise the conditions. This is most conveniently done by tabulating the average signal to noise ratio for each variable, as shown in table 8, and plotted, as shown in figure 6.
Figure 6. Average signal to noise ratio for each variable.
Download figure:
Standard image High-resolution image
Table 8. Average signal to noise ratio for each variable.
| Average signal to noise ratio/dB | ||||
|---|---|---|---|---|
| Level | Fill gas | Guide tube | Sandblasting | SPRT |
| 1 | 10.4 | 7.2 | 14.5 | −1.2 |
| 2 | 13.1 | 14.1 | 15.3 | 8.2 |
| 3 | 11.2 | 13.5 | 5.0 | 27.7 |
These results indicate that the ideal set of variables that could significantly improve the performance of SPRTs with respect to the lift-off effect would be: a borosilicate tube (sandblasted up to the round end), with nitrogen used as the fill gas for the cell. The results clearly indicate that some sand-blasting is necessary, and that the SPRT design 'C' is the least sensitive to the lift-off effect.
7. Conclusions
The objective of this study was to investigate the 'lift-off effect' in zinc open cells, where an anomalously large change in temperature is observed when the SPRT is lifted off the bottom of the re-entrant tube during an immersion profile measurement. The goal was to determine the most important influences and hence what measures could be taken to mitigate it. The influences investigated were the filling gas, re-entrant tube material, re-entrant tube exterior surface condition and the SPRT design. For each of these influence variables, three options were chosen. Since testing all the combinations of different set-ups arising would be extremely time-consuming, the authors employed the optimal 'design of experiments' method using orthogonal arrays described by the Taguchi method [19].
The measurements were performed following a meticulous protocol, determined under optimal furnace homogeneity and strict conditions to ensure the reproducibility of the freezing curves. Tests of reproducibility carried out at the beginning of the study allow the authors to advocate that a single immersion test per configuration would be an adequate representation of the effects investigated in them. The immersion tests were performed by measuring the SPRT resistance at two different currents (1 mA and  ), firstly at the bottom of the re-entrant tube, then by lifting the thermometer 1 mm from the bottom of the re-entrant tube and then at every centimetre up to 8 cm.
It was observed that the thermal conditions of the cell brought about by changing the influence variables was reflected in the performance of the SPRTs as exhibited by the immersion profiles: a fully sandblasted translucent quartz tube improved the behaviour of SPRT design 'A' with respect to the theoretical immersion profile, while a clear quartz tube without sandblasting caused all three SPRTs to behave anomalously. This latter configuration (using helium as a filling gas) changed the direction of the immersion profile of SPRT designs 'B' and 'C' (and worsened even further the behaviour of design 'A').
To evaluate the results, the authors elected the magnitude of the resistance change on moving the SPRT from a height of 0 cm to 1 cm (where overall no further lift-off effect was observed in the curves) to be the key performance parameter. According to these results, the set of variables that yields the best performance of SPRTs, as demonstrated by the immersion profile, is a borosilicate tube, with full sandblasting and using nitrogen as filling gas for the cell. In addition, the SPRT design 'C' was the least sensitive to the lift-off effect.
Taking into account the limited number of measurements, the noise, and the magnitude of the changes seen in figure 6, overall:
- (a)The user can convincingly rule out using a quartz tube with no sand-blasting
- (b)The advantage of borosilicate glass over translucent quartz is less clear-cut
- (c)The effect of filling gas is small
Acknowledgments
The authors would like to thank their colleagues Jayne Gray, Radka Veltcheva and Richard Rusby for very helpful discussions.