
Abstract
We experimentally study Stochastic Resonance in an artificial neuron and demonstrate that pink noise amplifies the input signal considerably—up to twenty times more—compared to white noise. The experimental results are consistent with biological observations and theoretical calculations. Possible applications include the design of electro-optical devices.
Export citation and abstract BibTeX RIS
1. Introduction
Classically, noise has been regarded as an interfering factor in the control and design of physical or mechanical systems. In the last decades, however, the concept of Stochastic Resonance (SR), i.e., the random search for resonances, which can lead to a beneficial modification of feeble input signals due to noise, became an interesting and promising research direction. There are numerous works of how SR can improve the performance of nonlinear systems, see, e.g., [1].
The concept of SR, as first introduced theoretically in [2] and experimentally in [3], was later analyzed in more detail by [4]. One of the key applications of SR lies in the amplification of sub-threshold input signals. For details on this remarkable property we refer to, e.g., [5].
On the other hand, SR can be used to detect weak input signals. Generally, if the noise amplitude is optimal, the period of the input signal can be recovered from the output signal—even (an especially) in the presence of noise, see, e.g., [1].
The concept of SR potentially plays an important role in a wide range of physical and biological systems, such as lasers, and superconducting quantum interference devices (SQUIDs), see [6, 7]. The physical conditions to set up the phenomenon in these devices is an ongoing research, please contact the author in case of further interest.
One of the most prominent applications of SR models lies in the enhancement of input data for electro-optical devices, which are derived from noisy, weak signals, see [8]. Another application of SR is the amplification of neural signals, see [1], where it is shown that SR models are able to replicate properties of biological neurons.
A biological example of the application of SR is the nervous system—a highly nonlinear system—which is embedded in a noisy biological environment dependent on multiple interactions. The persistent state of the brain is a constant background noise, due to a very large number of parallel processes, while the neuronal pulse is a source of coherence for the synchronization of noisy sub-threshold signal transmission. As a consequence, fluctuations in the neuronal membrane serve as a modulator for the increase of the noise amplitude [9]. This source of noise is expected to be responsible for small amplitude periodic signal amplification by SR.
It is also know that SR can play a role in the detection of signals from the external environment, which are strongly immersed in noise. Indeed, the brain acts as an encoder and adecoder of noisy input signals through enhancement and amplification of feeble and noisy fluctuations. Therefore, SR could serve as a promising candidate in the explanation of perception, see [10]. The author is working in further research regarding the required assumptions for the validation of this argument, for further questions please contact the author.
In the present paper, we experimentally study the effect of SR in neural circuits. Based on the action potential of a biological neuron (see figure 4), we design an artificial neuron mimicking its firing behavior, given that a certain threshold is surpassed. As an input signal, we consider a weak periodic excitation together with either white noise or pink noise.
This choice of noise is motivated by the importance of the background noise of the brain, exhibiting a pink-noise-like power spectrum. Apart from the brain, pink noise is ubiquitous in physical and biological systems, see, e.g., [9]. The importance of pink noise in the amplification of input signals has been observed experimentally for biological systems, see [11], as well as theoretically, see [12]. Hence, the current study is focused on the comparison of the impact of pink noise and white noise.
For further studies on the impact of pink noise in the context of stochastic resonance, we refer to [13, 14].
Once the output signal is generated, we first perform a combination of Inter-Spike Interval Histogram (ISIH) analysis and Signal to Noise Ratio (SNR) analysis, see also [15–18]. Given the outcome of the spectral analysis, we can show that pink noise amplifies the weak input signal up to twenty times more than white noise.
The paper is organized as follows. In section 2, we briefly comment on the theoretical background of the SR model relevant for our work. In section 3, we describe the experimental set up, while in section 4 we analyze the output signal of the experiment. Section 5 comprises conclusions and further perspectives.
2. Theoretical background
In this section, we give a simple theoretical illustration of SR in the context of a switching device. The key component of our experiment is a Schmitt Trigger device, which can be modeled as a bi-stable potential together with weak periodic fording plus stochastic forcing, cf [4, 19],

where F(t) is the periodic force,  is a small parameter, ξ(t) is the noise signal, a, b are real parameters specifying the shape of the potential and c is a linear damping coefficient. The Parameters a and b condense the potential dynamic of above and below the membrane capacity. In particular, the parameter b represents the resistance towards increasing the potential of the membrane (amplifier U3), while the parameter a is in direct proportion to the voltage formation (amplifier U2). For details, we refer to figure 3 For further information on the system (1), we also refer to [8].
The dynamic behavior of system (1) strongly depends on the amplitude of the stochastic forcing ξ(t). For small noise amplitudes, as in figure 1(a), the solution oscillates around one of the equilibria of V and occasionally jumps from one equilibrium to the other, see figure 1(b). On the other hand, when the noise amplitude is high, as in figure 1(e), the solution jumps from one side to the other frequently and irregularly, see figure 1(f). For a certain, optimal noise amplitude, however, as depicted in figure 1(c), the switching from equilibrium to equilibrium is synchronized with the weak periodic signal as shown in figure 1(d).
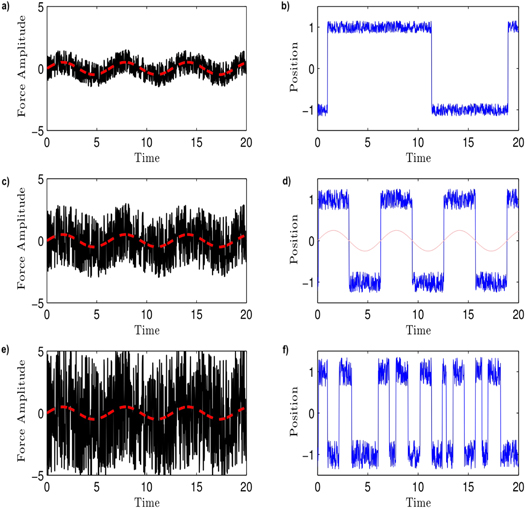
Figure 1. Response of system (1) in dependence on the noise amplitude: (a) Small noise amplitude (b) rare transitions from one equilibrium to the other (c) Optimal noise amplitude (d) synchronization with the weak periodic input signal (e) Large noise amplitude (f) frequent changes of equilibrium.
Download figure:
Standard image High-resolution image3. Experimental setup
The circuit of an artificial neuron is shown in figure 3. A coherent signal generator is used to generate the (weak) periodic input signal, then noise (either pink or white) is added by adjusting frequency filters in the noise generator, see figure 2 for details. In our experiment, the key component of the artificial neuron is based on a Schmitt Trigger monostable, generating a spike if the input signal surpasses a certain threshold. The output port is connected to an oscilloscope which saves the signal for later processing.
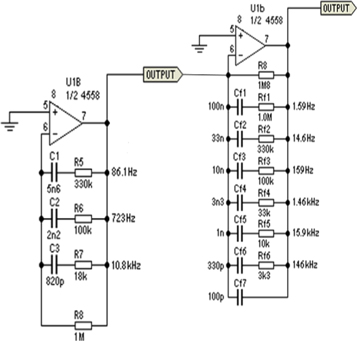
Figure 2. Structure of the filter used to generate pink noise.
Download figure:
Standard image High-resolution imageThe neural circuit depicted in figure 3 imitates the wave front of an action potential as observed in the biological cell membrane, see figure 4. In the artificial neuron, U1 (see figure (3)) sets the threshold value depolarization and hyperpolarization form as depicted in figure 4. In the same way, U2 sets the action potential spiky shape and U3 sets the time and value of repolarization (resting state).

Figure 3. Artificial neuron circuit based on the monostable Schmitt Trigger.
Download figure:
Standard image High-resolution image
Figure 4. The waveform of an action potential. Whenever the membrane potential overcomes a certain threshold value, the neuron generates an action potential [20].
Download figure:
Standard image High-resolution imageIn addition to the Schmitt trigger device, there are operational amplifiers U1, U2 and U3. Unit U1 is an operational amplifier which receives the input signal and amplifies it in order to feed the first monostable through pin 1B. Whenever the input signal surpasses its intrinsic threshold, Unit U2 generates a pulse with a duration of T1, where the value of T1 is determined based on the resistance and the capacitance values. The output of unit U2 through pin 1Q simulates the output of the neuron. Whenever the pulse generated by unit U2 enters in the descendant flank, the second monostable, i.e., unit U3 fires. It generates a pulse with duration T2. The output of pin  of U3 works as the clear signal of the first monostable, i.e., unit U2 does not generate a new action potential in the descendant flank of the spikes, simulating the refractory period of the neuron. This cycle is repeated indefinitely until the stimulation signal is fed into the system.
4. Power spectrum analysis
We analyze the output signal via a combination of the Inter-Spike Interval Histogram (ISIH), see [15] and the Signal-to-Noise Ratio (SNR) method, see [4].
Then, the derived values are plotted with respect to the noise amplitude to obtain the optimum intensity of the noise signal for the SR model.
Figures 5 and 6 show the power spectra of the output signal for white and pink noise, respectively. The number of peaks in dependence on frequency is arguably higher for pink noise as compared to white noise.
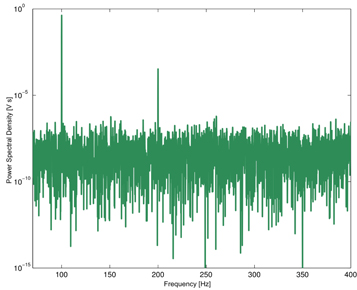
Figure 5. Power spectrum of the output signal in the presence of a white noise with 2500 mV amplitude.
Download figure:
Standard image High-resolution image
Figure 6. Power spectrum of the output signal in the presence of a pink noise with 2900 mV amplitude.
Download figure:
Standard image High-resolution imageWe repeated the spectral analysis for various different noise amplitudes (voltages) and record the first integral peak of the output (spike train). The inactivity intervals between spikes are recorded and saved as a histogram, see [9]. Variations of the noise signal modify the histogram. When the noise amplitude is low, the inactivity intervals are too long and the majority of intervals are longer than the signal's period. On the other hand, when the intensity of noise signal is high, the inactivity intervals are too short and the majority of intervals are shorter than the signal's period. However, when the amplitude of the noise signal is optimal, the inactivity intervals are equivalent to the times corresponding to the multiples of the input signal period. We record the peak of the histogram with respect to noise amplitude, corresponding to the optimal intensity of the noise signal in the SR model.
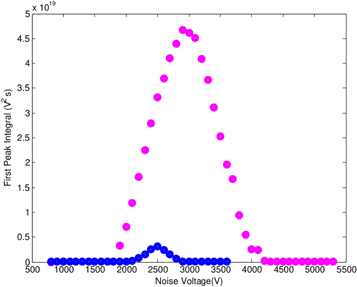
For smaller voltages, the first SNR-peak of the output signal increases as the voltage of the noise becomes larger—until it reaches a maximum. Then, it decreases again. Figure 7 shows a comparison of the SNR for pink noise (upper dotted curve) and white noise (lower dotted curve). Even though the amplitude (voltage) is the same for both input signals, the output signals differ by an amplification factor of up to twenty. We further note that the maximum SNR peak for pink noise is shifted to the right, while exhibiting a wider distribution against noise voltages (about 2000–4000 V), as compared to white noise, where maximal values are attained between around 2200–2700 V.
Figure 7. Comparison of the SNR for white noise (blue, lower curve) to pink noise (pink, upper curve) added to a periodic input signal of 50 mV amplitude. Although the contribution of pink noise is 100-times smaller than white noise, the amplification of the output signal is 20-times larger as compared to white noise. For small noise voltage values, the two graphics are indistinguishably close to each other.
Download figure:
Standard image High-resolution image
5. Conclusion and further perspectives
We showed experimentally that pink noise amplifies the output signal in an artificial neuron up to twenty times more than white noise. The spread of optimal values in dependence on frequency is considerably broader for pink noise as compared to white noise.
The amplification effect is due to spontaneous coupling between signals, which are limited by the harmonics of the input noise signal and its matching with the main frequency of the periodic forcing. The fact that pink noise has a scale-free frequency content enhances the coupling effect with low frequencies as compared to the constant frequency interactions found with white noise.
These observations could be of relevance for systems in electrical engineering, admitting a threshold value, as the detection of weak signals can be facilitated through SR analysis.
On the other hand, regarding biological systems, it could be argued tentatively that (artificial) neurons are more sensitive to pink noise as compared to white noise, which is consistent with observations regarding the spectral distribution of background noise in the brain, cf [9].
Furthermore, it would be interesting to compare a more diverse range of noise flavors, such as brown noise (1/f2-noise), to each other.
Acknowledgments
This research was done as a part of the author thesis for her graduation in Physics. Thank you Juan Gabriel Ramirez for helping in the experimental setup, Marco Gonzalez for access to his laboratory, Rodolfo Llinas Riascos for helpful remarks and Andres Reyes Lega for useful comments. It was a great experience to share and learn with all of you. Thank you so much for the inspiring and thoughtful conversations.
Funding and Conflict of Interest
No funding was received for this research.