Temporal Variability of Planktonic Ciliates in a Coastal Oligotrophic Environment: Mixotrophy, Size Classes and Vertical Distribution
 Filomena Romano
 Katerina Symiakaki
 Paraskevi Pitta
- 1Institute of Oceanography, Hellenic Centre for Marine Research, Heraklion, Greece
- 2Department of Biology, University of Copenhagen, Helsingør, Denmark
The temporal variability of planktonic ciliates was studied in an extreme oligotrophic environment with special focus on trophic modes and size classes. Abundance, biomass, size classes, mixotrophy vs. heterotrophy, and species composition of planktonic ciliates were investigated focusing on temporal (samples collected on a monthly basis during 2019) and vertical (7 depth layers in the euphotic zone, from surface to 120 m) distribution at a coastal station in the oligotrophic Eastern Mediterranean. Abundance was in general very low (20 to 1150 cells L–1), except for September, which presented the highest abundance and biomass. Aloricate species dominated the ciliate community in all months and depths (% contribution from 77% in September to 99% in April). In general, oligotrichs presented maximum abundance at 2–10 m (except for June, July, and November: 100–120 m) whereas choreotrichs were more homogeneously distributed [and showed maxima at deep chlorophyll maximum (DCM)]. Small heterotrophs dominated the ciliate community at all depths and months, on average by 76% (they were 3 times more abundant than mixotrophs in terms of abundance and 2.5 times in terms of biomass). They were equally distributed both vertically and seasonally (and also in terms of size classes). In contrast, mixotrophs were found mainly at the surface layer to 20 m throughout the year, except for June and July (max at 100, 50 m). On average, 63% of integrated aloricate abundance was species <30 μm, of which 25% were mixotrophs. During the stratification period of May to November, the very small (<18 μm) and small (18–30 μm) mixotrophic species were distributed throughout the water column whereas the >50 μm mixotrophic species were found only above the DCM. In contrast, during the mixing period of December to May, mixotrophic ciliates were very few and were dominated by small and medium-sized species. It seems that mixotrophic and heterotrophic ciliates, on one hand, and the four size classes, on the other, are very distinct groups characterized by different distributions both vertically and seasonally. This may have important consequences for the structure and function of the microbial food web of which they are part, as well as for the carbon flow to the higher trophic levels of this oligotrophic environment in which ciliates are the main grazers.
Introduction
Ciliated protozoa are an important part of the microbial food web (Lynn and Montagnes, 1991; Pierce and Turner, 1992). They are traditionally considered to be microzooplanktonic, i.e., 20–200 μm heterotrophic organisms; however, they are also known to comprise mixotrophic forms (Blackbourn et al., 1973; Laval-Peuto, 1986; McManus and Fuhrman, 1986; Stoecker and Silver, 1987; Stoecker et al., 1987; Laval-Peuto and Rassoulzadegan, 1988). Mixotrophic ciliate species are found only in the aloricate sub-group (Stoecker et al., 1987), more specifically in the Oligotrichida order. According to the group division by Flynn et al. (2019), mixotrophic ciliates are part of non-constitutive mixotrophs (NCMs), a group represented by grazers capable of keeping the chloroplasts of their prey and using them to perform photosynthesis. On the other hand, constitutive mixotrophs (CMs) are represented by organisms that perform photosynthesis but are also able to take up carbon from their ingested prey.
Mixotrophic ciliates provide only modest contributions to chlorophyll crops (Putt, 1990; Stoecker and Michaels, 1991). However, in oligotrophic environments, which are characterized by very low nutrient concentrations, photosynthetic (mixotrophic) ciliates may become very important in terms of carbon flux to higher trophic levels (Dolan and Marrasé, 1995). Studies conducted in oligotrophic marine environments report that in the neritic zone, about 40% of the microplanktonic ciliate fauna contains chloroplasts (Stoecker et al., 1987).
Information on the contribution of mixotrophic species to ciliate assemblages is fragmented. Most studies focus on spatial or vertical distributions; among them, the majority of studies have been performed either during very restricted time periods, e.g., a single season or several days within a month, or at best some months (Jonsson, 1987; Prog et al., 1989; Suzuki and Taniguchi, 1998; Pitta and Giannakourou, 2000; Pérez et al., 2000; Bojanić et al., 2001; Rekik et al., 2015). Very little is known about the temporal/seasonal/annual distribution and dynamics of mixotrophic ciliates in oligotrophic marine systems. In order to understand the role of these organisms in the pelagic food web, it is crucial to study their temporal and vertical distributions concurrently. Only three such studies report on full annual cycles of mixotrophic ciliates based on weekly samples collected for time periods of more than a year – two from the NW Mediterranean, one in the Ligurian (Bernard and Rassouladegan, 1994) and the second in the Tyrrhenian Sea (Modigh, 2001), and the third from Greenland (Levinsen et al., 2000). However, even these studies are based only on surface samples or surface plus deep chlorophyll maximum (DCM); in this case, the vertical distribution is missing.
In their study on temporal variations of planktonic ciliates in the NW Mediterranean, as well as most other studies on different aspects of the ecology of planktonic ciliates, Vaqué et al. (1997) reported on samples fixed with acid Lugol’s solution, which causes minimal cell loss compared to live counting (Sime-Ngando et al., 1990) and is therefore the most effective fixative for abundance estimates (Revelante and Gilmartin, 1983; Leakey et al., 1992). However, the coloration of cells caused by the iodide contained in this fixative prevents identification of the fluorescence of the kleptochloroplasts found in the mixotrophic cells. As a result, in several studies, all ciliates are counted as heterotrophic species (Smetacek, 1981; Revelante and Gilmartin, 1983; Leakey et al., 1992), with the few exceptions being the mixotrophic species Mesodinium rubrum, Laboea strobila and some Tontonia spp. This approach results in a severe underestimation of the numeric abundance and biomass of mixotrophic ciliates, especially of the smaller species (nanociliates), which are not easily recognizable in samples fixed with Lugol’s solution but are an important part of the natural ciliate assemblages (Revelante and Gilmartin, 1983; Lynn et al., 1991).
Especially in oligotrophic environments, in which, due to nutrient scarcity, photosynthetic biomass and productivity are dominated not by micro-phytoplankton (diatoms) but by pico- and nano-sized photosynthetic groups, it is reasonable to think that grazers will comply with the prey size. Therefore, they will be dominated not by mesozooplankton (copepods) but by micro- and nano-sized groups. Indeed, it has been found that ciliates are the main grazers in the oligotrophic Eastern Mediterranean (Pitta and Giannakourou, 2000; Pitta et al., 2001). The Mediterranean Sea is known to be one of the most oligotrophic environments of the world (Krom et al., 2004; Powley et al., 2017) and is characterized by a gradient of increasing oligotrophy from west to east (Turley, 1999; Barale et al., 2008; D’Ortenzio and D’Alcalà, 2009). The west basin is less oligotrophic while the Eastern Mediterranean is considered as ultra-oligotrophic and demonstrates qualities such as high transparency, low nutrient levels, and low productivity (Azov, 1986; Yacobi et al., 1995). The first report on mixotrophic ciliates from the Mediterranean Sea (Laval-Peuto and Rassoulzadegan, 1988) was carried out during the fall-winter period in the Bay of Villefranche-sur-Mer in South France. Other studies were conducted later in the Aegean Sea (Pitta and Giannakourou, 2000) and the Tyrrhenian Sea (Modigh, 2001).
The present paper assesses the temporal and vertical variability and dynamics of mixotrophic and heterotrophic ciliates in the ultra-oligotrophic Eastern Mediterranean Sea, with a focus on ciliate groups, trophic strategies and size classes. A coastal station was sampled during 2019 on a monthly basis and vertical profiles from the surface to 120 m are provided. Two parallel series of samples were examined. One series was fixed with acid Lugol’s solution in order to ensure the minimum loss of specimens and therefore obtain a better estimation of the ciliate numerical abundance and biomass; the second series of samples was fixed with buffered formaldehyde, which allows the capture and identification of mixotrophic species, both micro- and nano-sized. A considerable microscopic effort was put into the assignment of ciliate specimens to different categories in terms of groups (oligotrichs, choreotrichs, tintinnids), trophic modes (mixotrophic, heterotrophic), size classes (from <18 μm to >50 μm), and taxonomic level (genus or species, when possible). With the assistance of an image analysis system, biomass was also estimated for all the above-mentioned categories. This approach, applied to a complete series of vertical (surface to 120 m) and monthly, over a year, samples resulted in a unique data set. Based on this data set, we tried to find answers to the following questions: (1) What is the vertical distribution of mixotrophic vs. heterotrophic ciliates in this oligotrophic environment? (2) What is the vertical distribution of the different size classes of planktonic ciliates? (3) Do the previous two features change with time? If so, how? (4) What is the contribution of mixotrophic ciliates and nanociliates to the total ciliate community in terms of abundance and biomass? Does this change with time and depth, and how? (5) Do mixotrophs/nanociliates behave differently from the heterotrophs/larger species in the water column? Because the Eastern Mediterranean is among the most oligotrophic areas of the world, the findings of our study also apply for the open ocean.
Materials and Methods
Sampling took place on a monthly basis from January to December 2019 at the coastal station POSEIDON-HCB (Heraklion Coastal Buoy, 35.426°N - 25.072°E, max depth 180 m), Heraklion Bay, Cretan Sea, Greece (Figure 1). Profiles of water column structure (temperature, salinity) and Chla were performed with a Seabird CTD profiler equipped with a fluorescence sensor. Water samples were collected at seven depths in the euphotic zone (2, 10, 20, 50, 75, 100, and 120 m) using 5 L Niskin bottles. Sampling was not performed in February and August due to bad weather at sea. Dissolved nutrient concentrations were assessed following Ivancic and Degobbis (1984) and Strickland and Parsons (1972) using a UV/VIS spectrophotometer with the detection limits for phosphate, ammonium, nitrate, nitrite and silicate being 0.018, 0.019, 0.017, 0.010, and 0.025 μM, respectively. For the enumeration and identification of ciliates, 250 ml of water were fixed with borax-buffered formalin (formaldehyde final concentration 2%) and stored at 4°C in the dark. According to Stoecker et al. (1994), formaldehyde fixation may underestimate the total ciliate abundance by up to 65%. Acid Lugol’s solution can give a higher estimation of cell abundance (Gifford, 1985) but does not allow the observation of the autofluorescence of chloroplasts. For this reason, the present study, focusing on trophic modes of ciliates (mixotrophy vs. heterotrophy), reports results from samples fixed with formaldehyde. A parallel series of samples was fixed with 2% of acid Lugol’s in order to estimate the percentage of cell loss and the correlation between abundances.
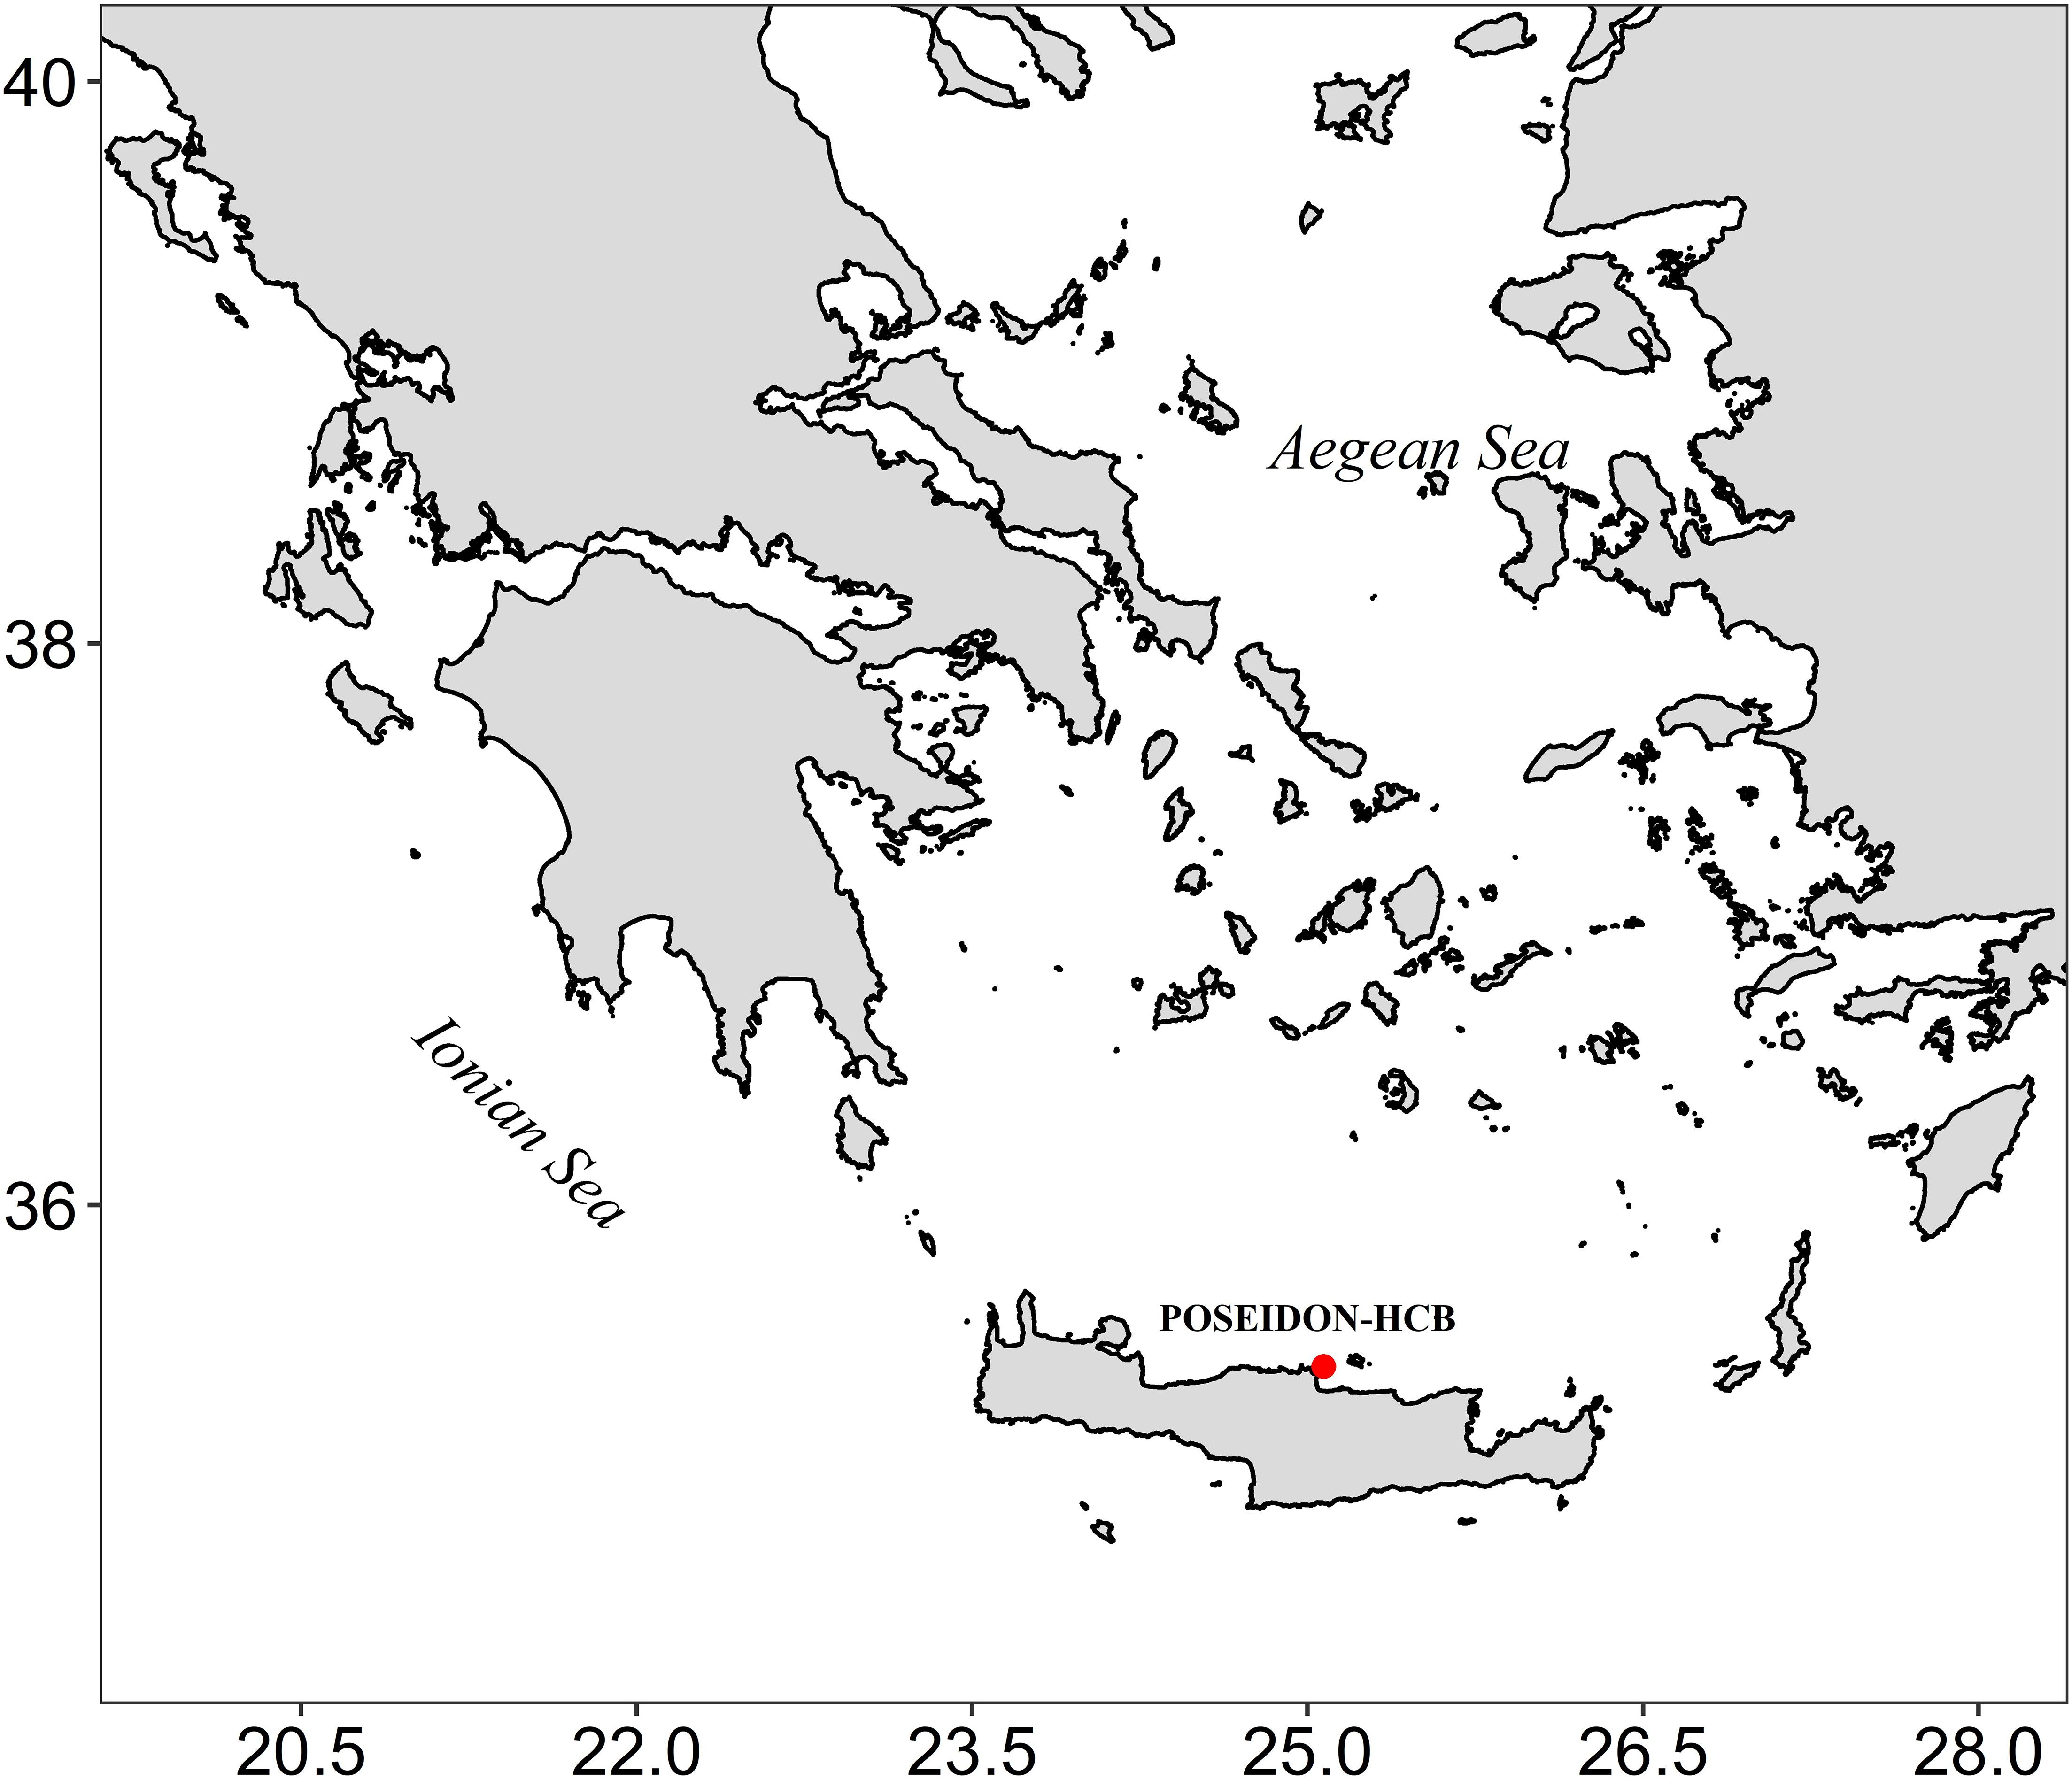
Figure 1. Sampling station POSEIDON-HCB in the Cretan Sea (Eastern Mediterranean Sea).
One hundred ml of the sub-sample were concentrated using sedimentation chambers (Utermöhl, 1931) and cells were counted with an Olympus IX-70 inverted microscope equipped for transmitted light, phase-contrast and epifluorescence (blue light: DM 500 nm dichroic mirror, BP 420 to 480 nm exciter filter, BA 515 nm barrier filter and a 100 W mercury burner) at 150X magnification.
Oligotrichs and choreotrichs (both comprising aloricate species) were identified down to genus level in most of the cases and down to species level when possible, following Laval-Peuto and Rassoulzadegan, 1988; Lynn et al., 1988; Montagnes et al., 1988; Lynn and Montagnes, 1991). Those ciliates showing a homogeneous fluorescence were considered mixotrophic, while ciliates that did not show any fluorescence or specimens in which fluorescence was located in a specific part of the cell (probably food vacuole) were considered as heterotrophic. Tintinnids were identified based on the lorica shape and dimensions, after Jörgensen (1924) and Balech (1959). The dimensions of each individual cell were measured using an image analysis software (Image-Pro Plus 6.1). Aloricate ciliates were divided into four size classes based on their cell length. More specifically, the groups were identified as very small, small, medium, and large, referring, respectively, to cell length <18, 18–30, 30–50, and >50 μm. The biovolume was calculated using geometric shapes according to Peuto-Moreau (1991) and biomass by multiplying the biovolume with the conversion C factor of 0.14 pg C μm–3 used for samples fixed with 2% formaldehyde (Putt and Stoecker, 1989). For samples from January, we only report of total ciliate abundance due to a temporary malfunction of the image analysis system.
The two series of samples fixed with Lugol and formaldehyde were correlated by means of Pearson correlation coefficient. Two-way ANOVA (water column structure by depth) was used in order to reveal significant differences among samples grouped according to certain criteria (mixing/intermediate/stratification period and depth layers 2–120 m). This analysis was performed on four mixotrophic size classes (very small, small, medium, and large). In addition, two-way ANOVA (water column structure by month) was performed to test whether significant differences existed among samples grouped according to the mixing/intermediate/stratification period or certain months of the year; this analysis was performed on the mixotrophic ciliate genera. The post hoc Tukey test was performed for multiple comparisons among groups of samples assembled according to the significant factors. Multivariate analysis was performed on the species abundance data, using non-metric multidimensional scaling (NMDS) in the R language. Similarities among samples were calculated using the Bray-Curtis distance, and square root transformation was applied on the abundance data.
Results
Hydrology, Nutrients and Chl-a
Over the year, average temperature at the water column 0–120 m depth was 20 ± 5.6°C. The coldest month was March (15 ± 0.14°C) and the hottest was July (20.21 ± 3.40°C). The water column was entirely mixed from January to May, when the beginning of the stratification construction was observed (intermediate); and thermally stratified during the summer period until November (intermediate), when the stratification destruction started Average salinity at the water column was 39.23 ± 0.09. The lowest salinity value was found in March (39.14 ± 0.14) and the highest one in May (39.30 ± 0.03) (Figure 2).
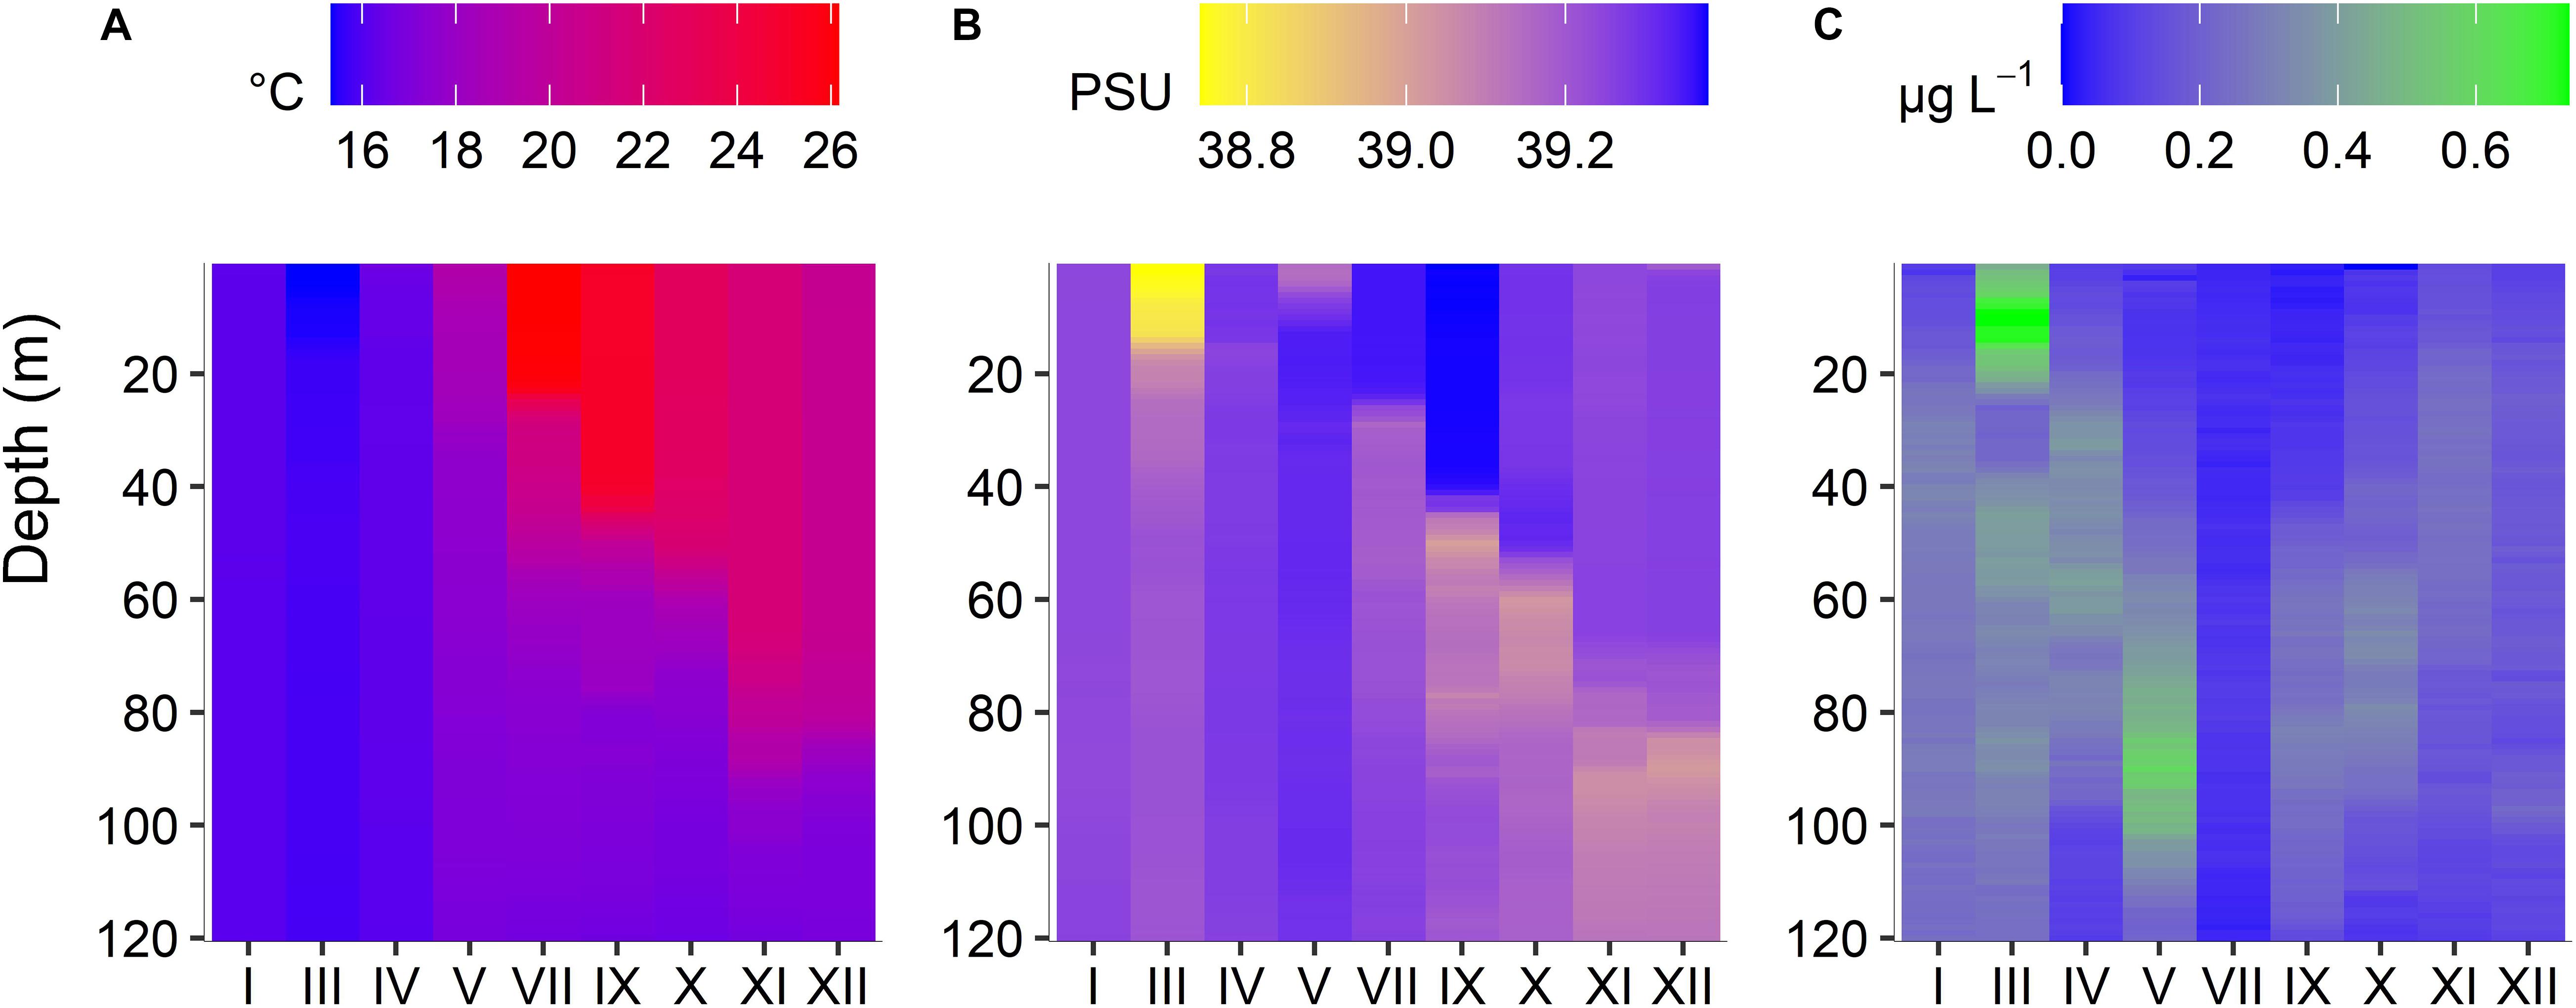
Figure 2. Seasonal (January to December 2019) changes of temperature (A), salinity (B), and Chlorophyll a (C) at different depths (surface to 120 m), at the sampling station POSEIDON-HCB.
During the mixing period, chlorophyll-a concentration was high; in March, the maximum chlorophyll-a value of the entire year (0.73 μg L–1) was observed at the subsurface layer of 10 m while it decreased but stayed at relatively high levels down to the bottom. During the following months, a DCM progressively formed; it was best established at 100 m in May. Later in the year it was less intense but always between 40 and 100 m. In July, a very low chlorophyll-a concentration was measured in the whole water column. PO4 concentration ranged from 0.00 μM in January to 0.21 μM in July, while dissolved inorganic nitrogen (DIN) ranged between 0.06 μM in March and 3.60 μM in July (Supplementary Table 1).
Temporal and Vertical Variability of Ciliates: Total and Group Abundance and Biomass
From January to December, from the surface down to 120 m, total ciliate abundance ranged between 20 and 1150 cells L–1. The lowest value was found in December at 120 m depth, while the highest one in September at 2 m depth.
Ciliates presented maximum abundance between 2–10 m depth, except for March, April and June, when maximum abundance was found at 75, 75, and 100 m, respectively (below DCM, Figure 3 and Table 1). During December, a constant decrease in biomass with depth was observed while in March and June, abundance and biomass were mostly uniform down to 120 m. In November and March, biomass was much higher at 10 and 20 m depth, respectively, compared to the rest of the depth layers, although this was not the case for abundance. A second abundance maximum was deeper in April (75 m), May (100 m), and July (50 m). September showed the highest abundance and biomass values at the surface, followed by a decrease with depth.
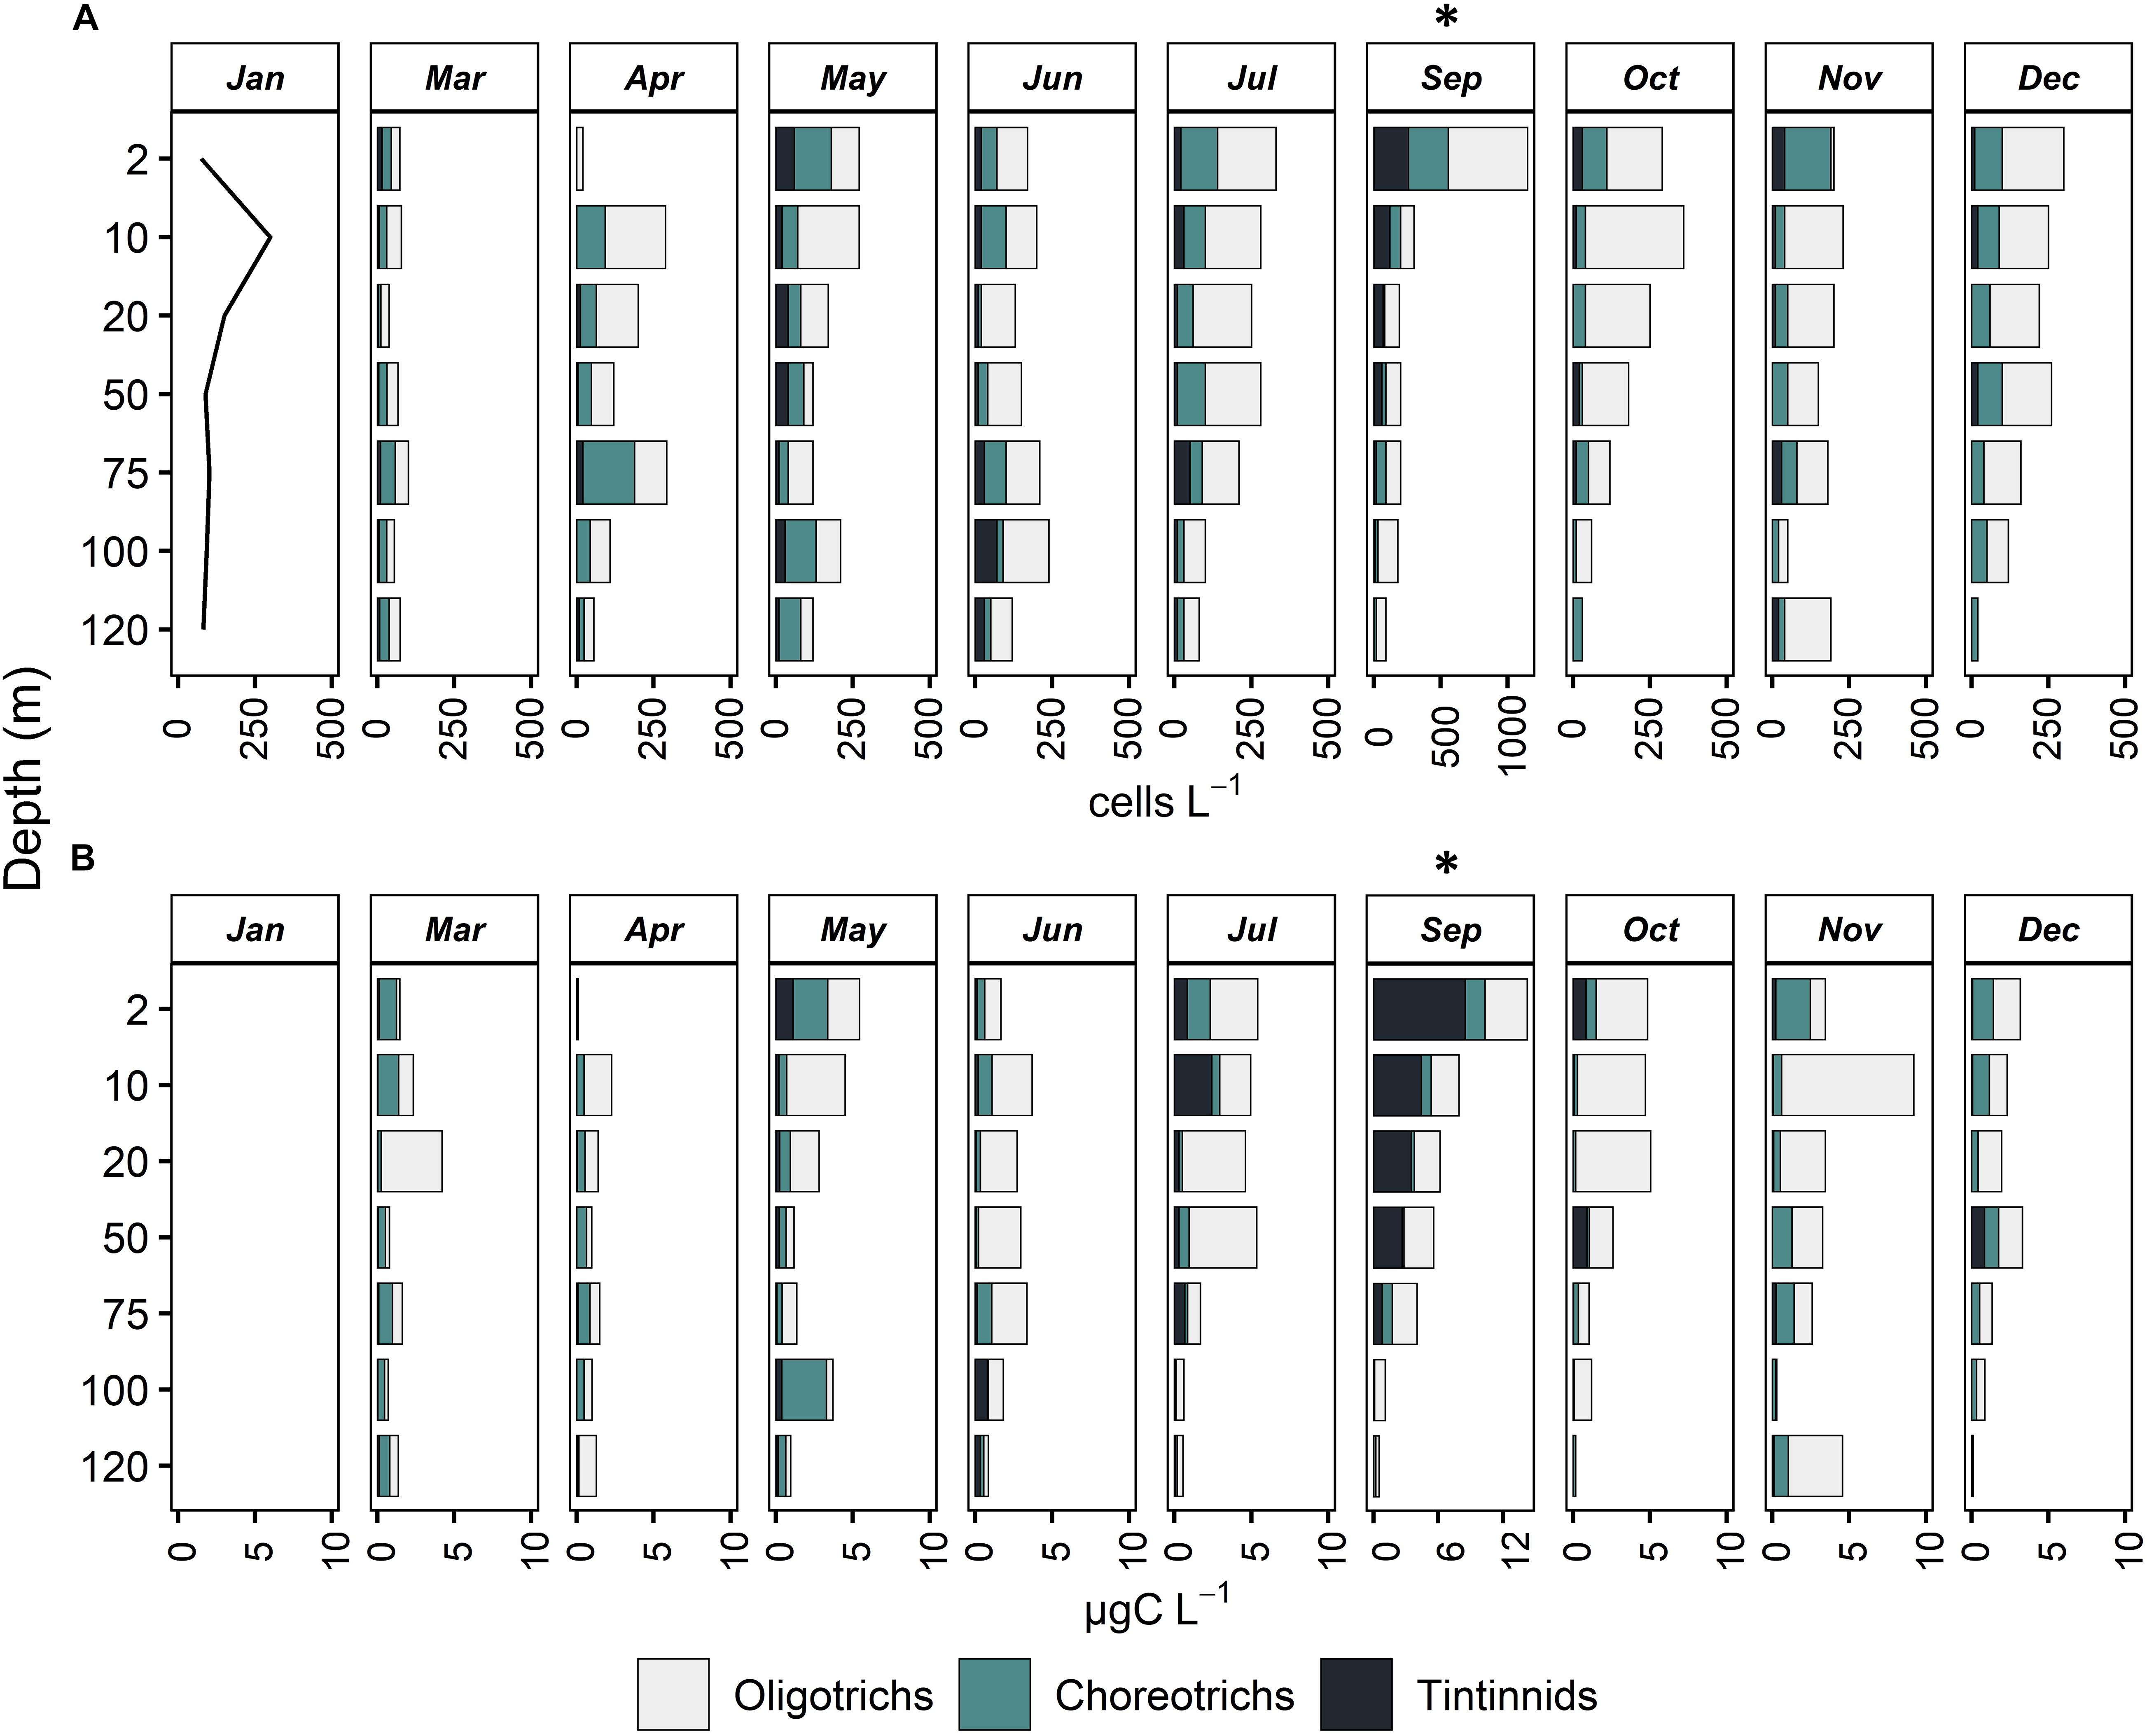
Figure 3. Vertical distribution of abundance, cells L–1 (A) and biomass, μg C L–1 (B) of Oligotrichs, Choreotrichs, and Tintinnids at all months sampled. For January, only total ciliate abundance is presented (line) and values for Oligotrichs, Choreotrichs, and Tintinnids are missing. Note that in September, the x axis has a different scale compared to all other months.
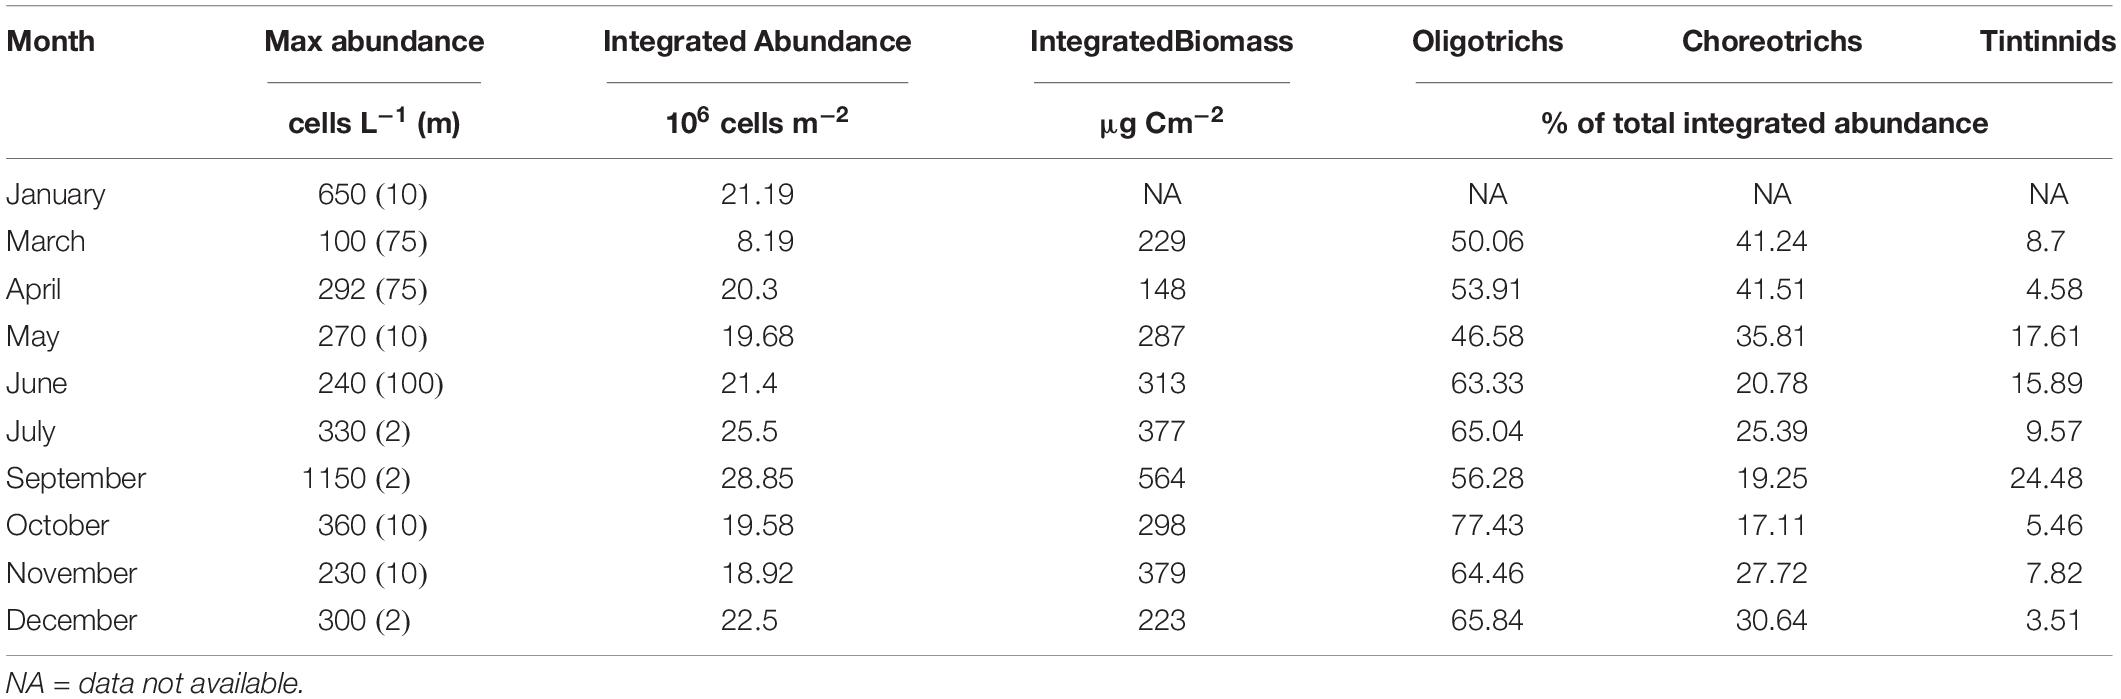
Table 1. Maximal abundance of total ciliates reached at each month and the corresponding depth (m, in parentheses); Integrated abundance and biomass (2 to 120 m) of total ciliates; Percentage contribution of Oligotrichs, Choreotrichs, and Tintinnids to integrated abundance of total ciliates, at each month.
Integrated ciliate abundance (surface-120 m) varied from 8.19 × 10⁶ in March to 28.86 × 10⁶ cells m–2 in September, while integrated biomass from 148 μg C m–2 in April to 564 μg C m–2 in September (Table 1). Aloricate ciliates (oligotrichs and choreotrichs) dominated the ciliate community in terms of abundance and biomass in all months and depths; their contribution to the total abundance ranged between 75.52% in September and 96.49% in December (Table 1). More specifically, oligotrichs contributed more than choreotrichs to total integrated ciliate abundance; on average 62.7% were oligotrichs and 26.7% were choreotrichs. In terms of vertical distribution, the highest oligotrich abundance was found, in most cases, between 2 to 20 m (Figure 3). Only during June, July and November was the highest abundance of oligotrichs found at the bottom layer (100–120 m). Choreotrichs, instead, were more homogeneously distributed and their highest abundance was found especially at the DCM. Tintinnids represented the lowest percentage of the total community (Table 1) and were found mostly at the surface (2 m) and the DCM (Figure 3). During April and June, the highest tintinnid abundance was found between 100 and 120 m, while during July they were very abundant at the DCM. The percentage ranged between 3.51% in December and 24.48% in September (Table 1).
Trophic Modes (Mixotrophy and Heterotrophy)
Throughout the water column, heterotrophic ciliates numerically dominated the aloricate community by 75 ± 8.6%, leaving the remaining 24 ± 8.6% to mixotrophic ciliates (data not shown). The only exception was, again, at the pycnocline where the contribution of mixotrophic to total aloricate abundance ranged between 30 to 60%.
In terms of vertical distribution, mixotrophic ciliates were abundant between 2 and 20 m depth; below this layer, their abundance decreased with depth (Figure 4). This was true throughout the year, the only exception being June and July, which presented maxima at 100 and 50 m, respectively. In contrast to mixotrophic, heterotrophic ciliates were present at all depths, their vertical distributions presented no obvious pattern, and maximum abundances were found at different depths during different months. In March and April, the two months with maximal chlorophyll-a, heterotrophic ciliates were abundant below DCM, detected at around 50 m depth for both months (Figure 4). After the seasonal chlorophyll-a maxima, heterotrophic ciliates were found at the subsurface layer (at 2 m), except for June, when maximum abundance was at 100 m depth.
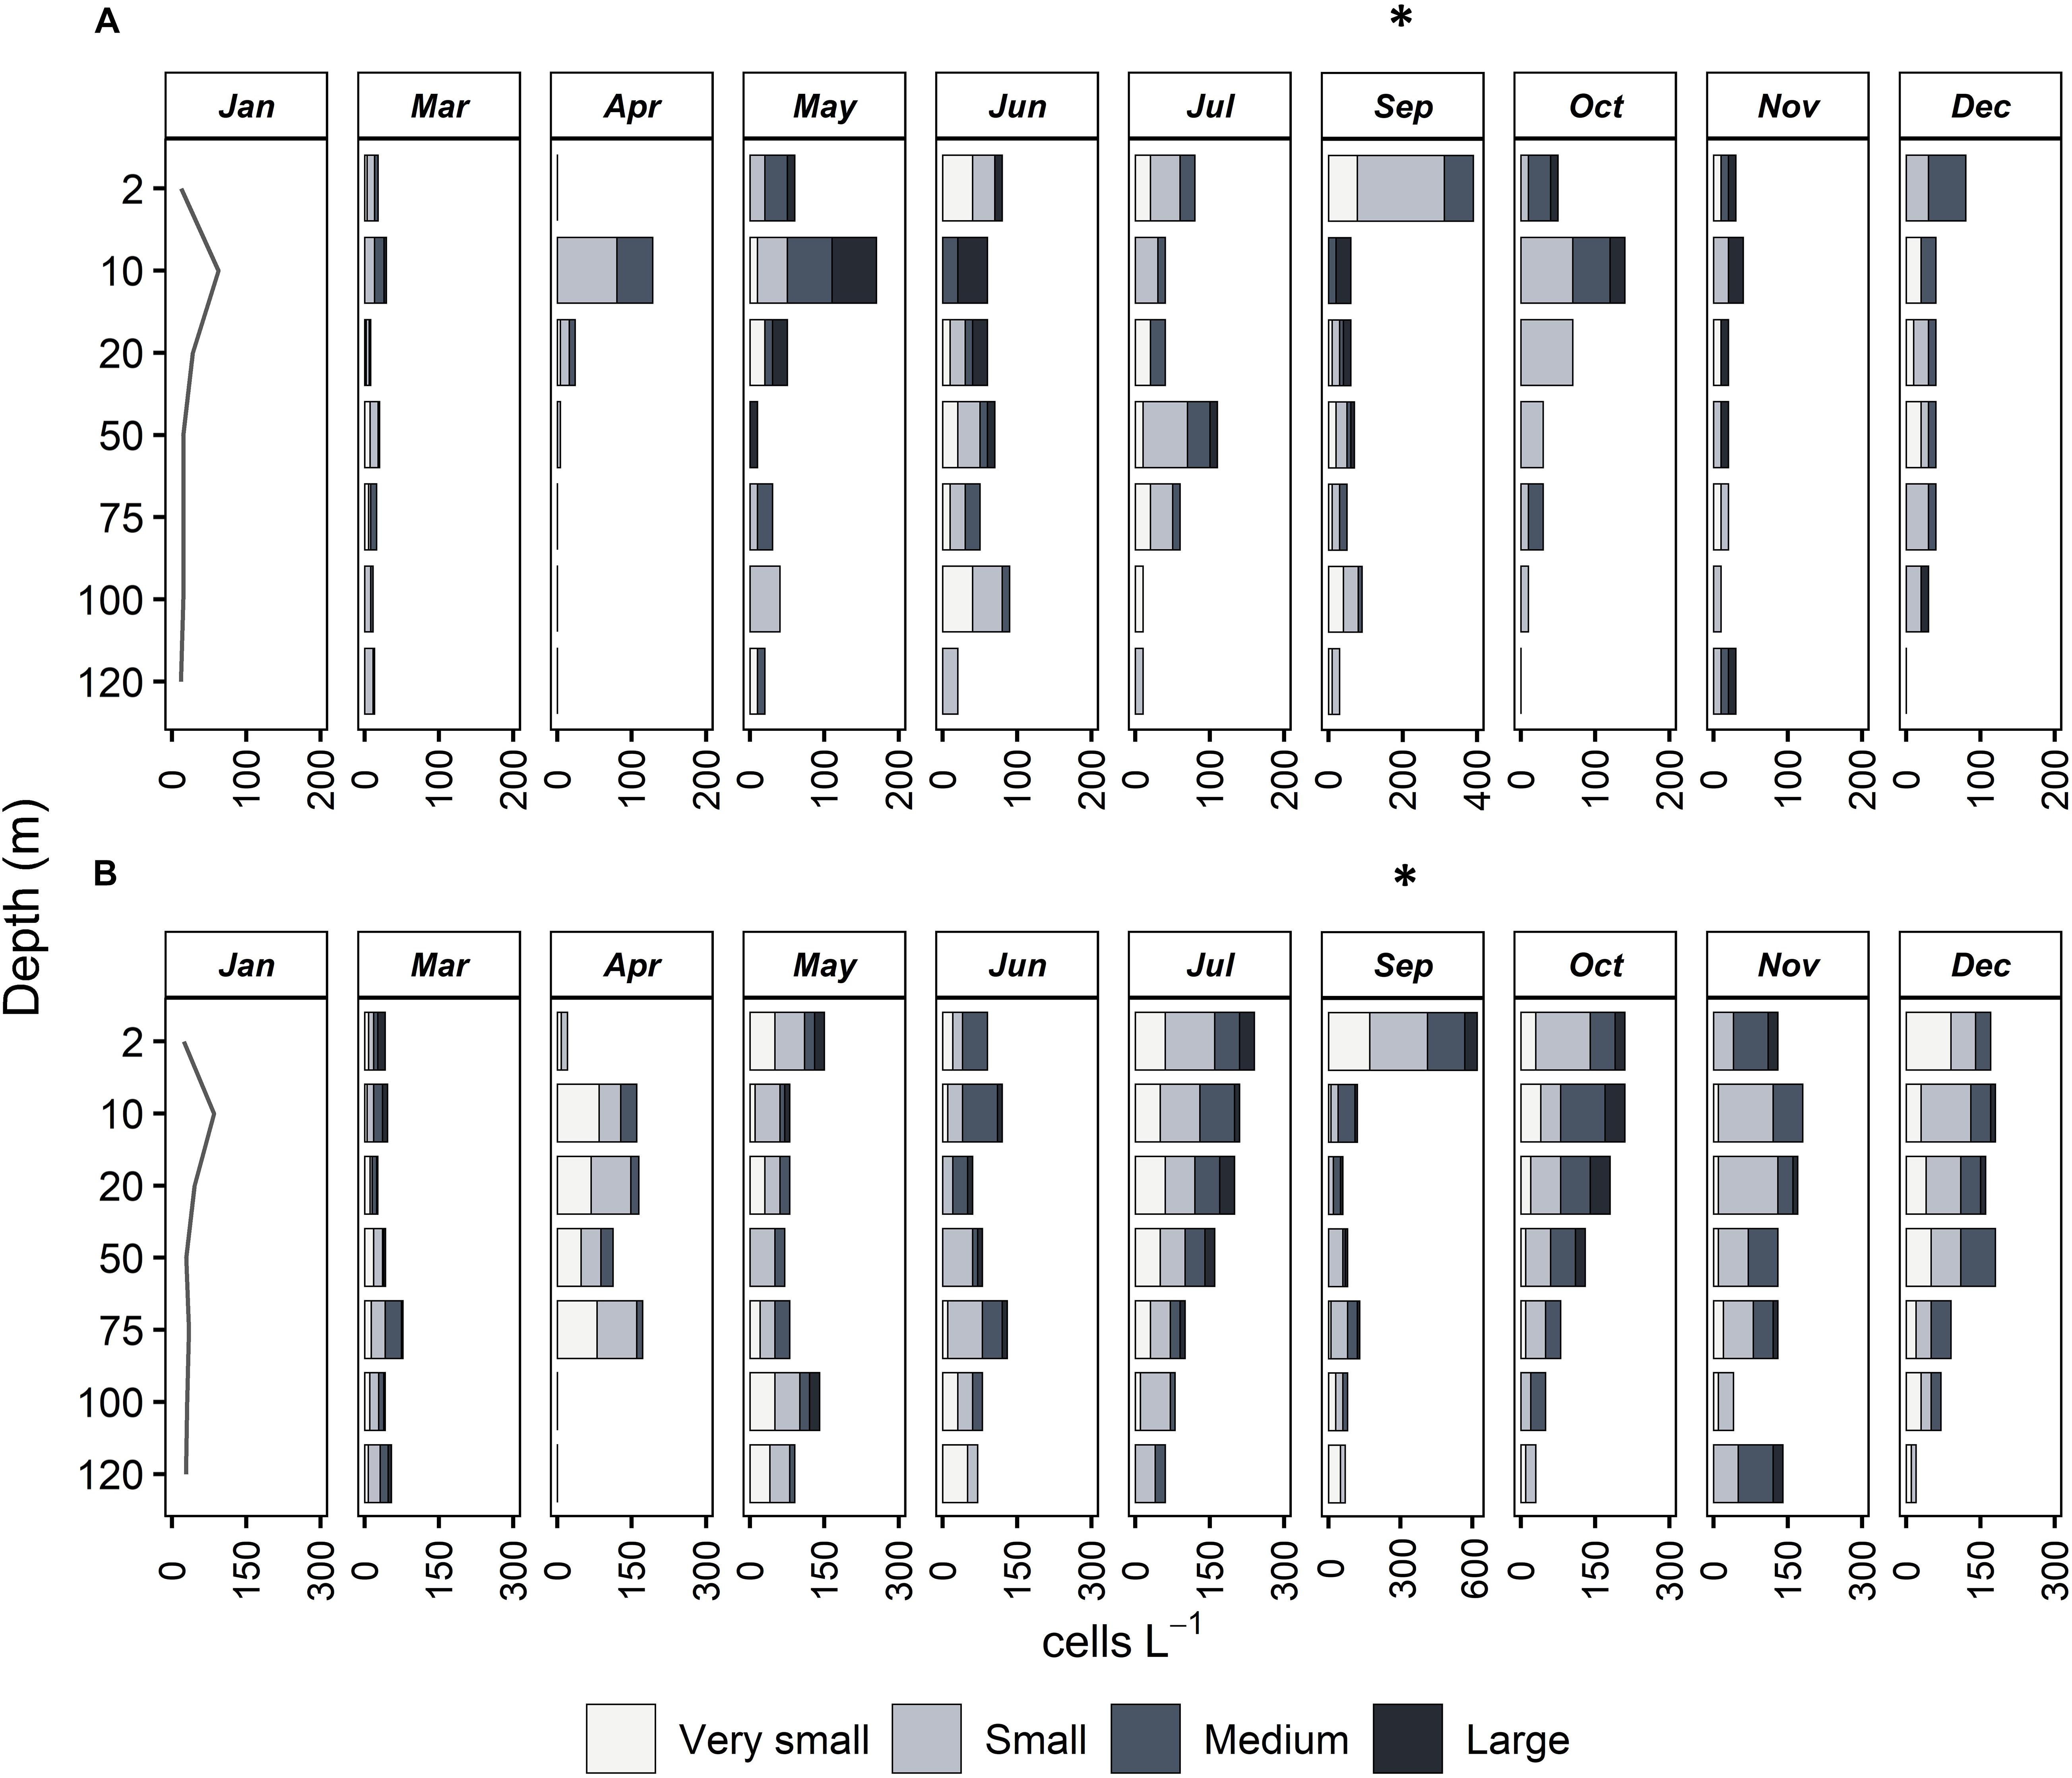
Figure 4. Vertical distribution of abundance (cells L–1) of four size classes of mixotrophic (A) and heterotrophic ciliates (B) at all months sampled. Very small: <18 μm, Small: 18–30 μm, Medium: 30–50 μm, Large: >50 μm. Note that in September, the x axis has a different scale compared to all other months.
Mixotrophic contribution to total ciliate community varied from 9.02% (April) to 40.40% (January) for integrated abundance, and from 9.27% (April) to 38.59% (March) for integrated biomass (Supplementary Table 2). In terms of integrated values (surface to 120 m), the abundance of mixotrophic ciliates ranged from 1.81 × 10⁶ to 9.21 × 10⁶ cells m–2; and from 6.38 × 10⁶ to 19.65 × 10⁶ cells m–2 for heterotrophic ones (Table 2). Integrated biomass ranged from 14 to 118 μg C m–2 for mixotrophic ciliates and from 131 to 257 μg C m–2 for heterotrophic aloricate species. Integrated biomass of tintinnids ranged from 6 to 255 μg C m–2 and they contributed with the highest value of biomass during September.
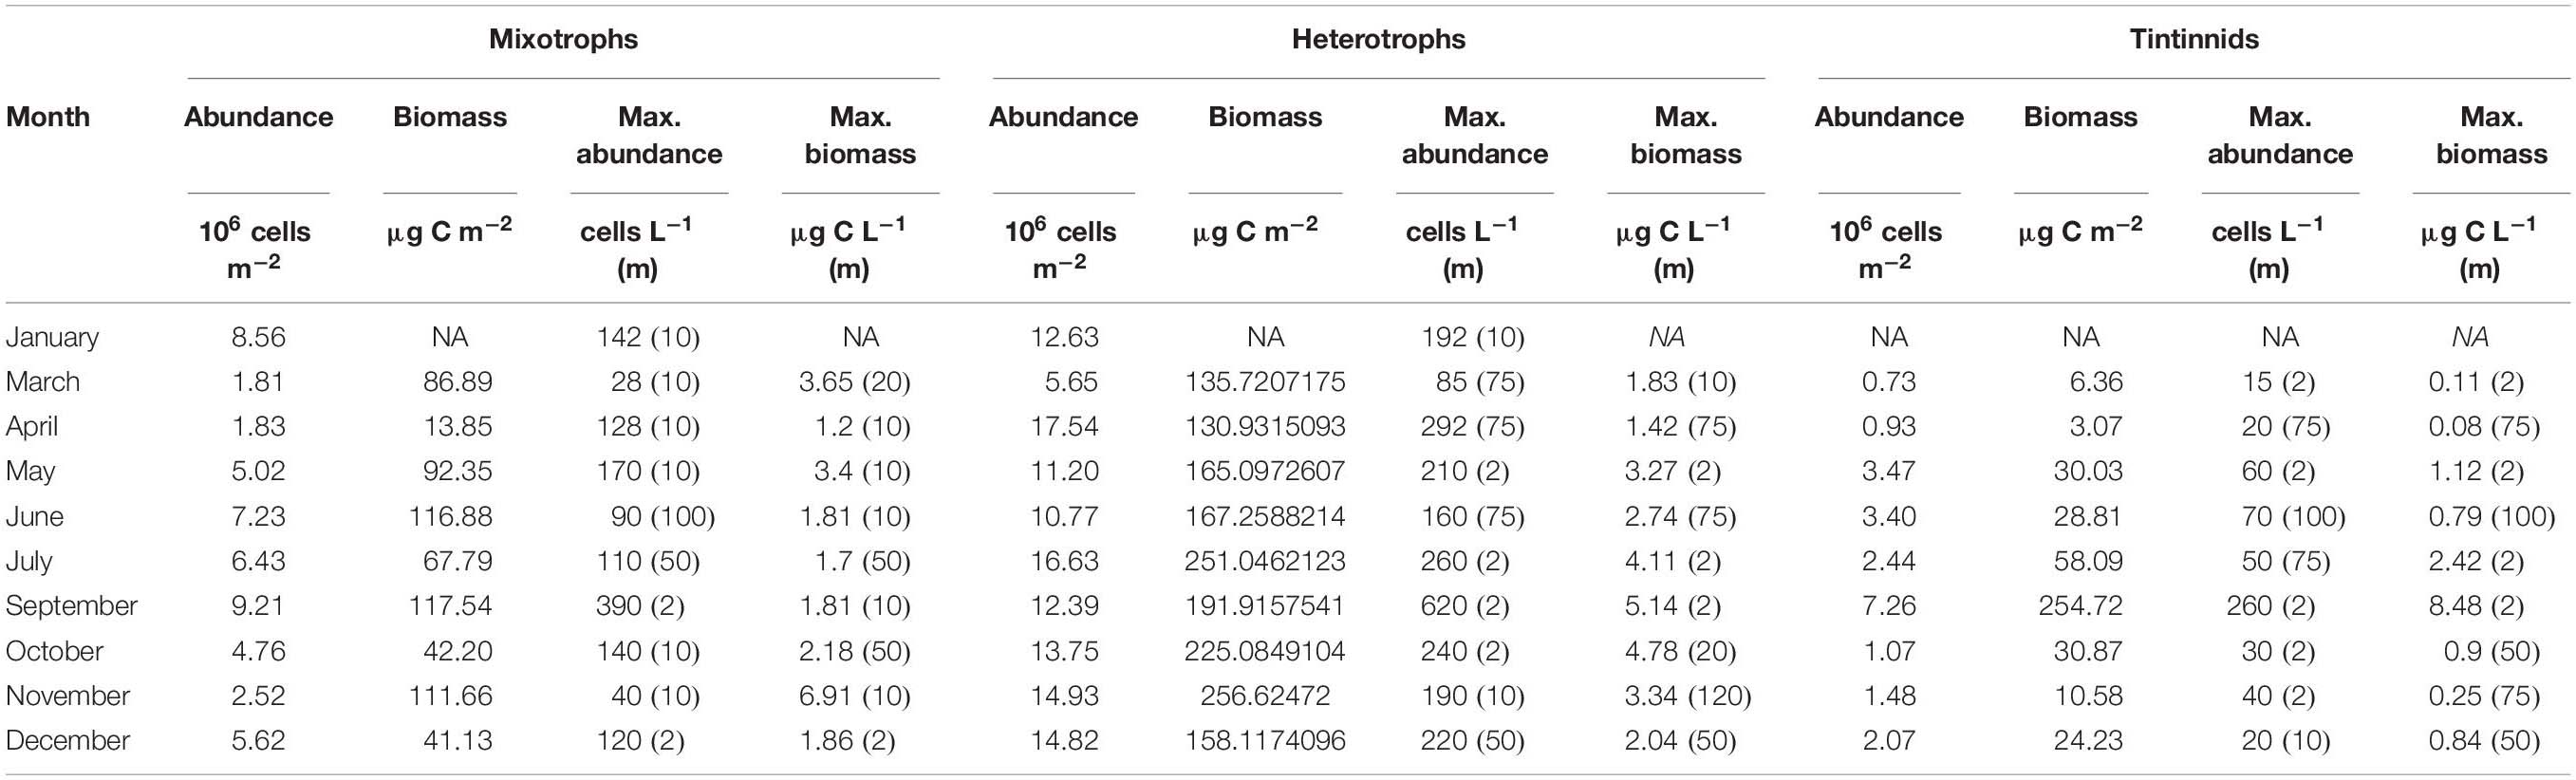
Table 2. Integrated abundance and biomass of mixotrophic and heterotrophic ciliates and tintinnids together with maximal abundance and biomass at each month and the corresponding depths (m, in parentheses).
For both mixotrophic and heterotrophic species the lowest abundance was found in March and the highest in September and July, respectively (Table 2).
Size Classes
The contribution of smaller species to the integrated abundance of total ciliates was very important throughout the year; specifically, species <30 μm made up 71.22 ± 3.58% while species >30 μm 55.73 ± 6.89% (data not shown) of total integrated ciliate abundance. In terms of total integrated ciliate biomass, their contribution was minor; 26.68% for ciliates <30 μm and 73.32% for ciliates >30 μm.
Specifically, and in terms of size classes and trophic modes, 16.27 ± 11.20% of heterotrophic aloricate abundance was attributed to <18 μm and 31.81 ± 6.72% to 18–30 μm aloricates, whereas 22.09 ± 6.28% was made up of 30–50 μm and for very large species >50 μm, the average was 6.25 ± 3.43% (data not shown). In terms of biomass, values were 3.28%, 18.71%, 33.08%, and 21.79% for <18 μm, 18–30 μm, 30–50 μm, and >50 μm, respectively. On the other hand, for mixotrophic aloricate abundance, the respective values for four size classes were 4.26 ± 3.05%, 10.55 ± 3.52%, 5.79 ± 2.20%, and 2.99 ± 2.43%, while for biomass 0.67%, 4.02%, 7.03%, and 11.42%.
During the stratification period (May to November), large (>50 μm) mixotrophic cells were observed only above the DCM (at 50 m), while the deeper layers were populated by very small (<18 μm) and small (18–30 μm) mixotrophic ciliates (Figure 4). During the mixing period (December to May), mixotrophic species were very few, and the community was dominated especially by small and medium (18–30 μm, 30–50 μm) species. In contrast to mixotrophic ciliates, four size classes of heterotrophic ciliates were, more or less, equally distributed vertically but also seasonally (Figure 4).
The integrated abundance of mixotrophic aloricates varied between 0 and 2.96 × 10⁶ cells m–2 for very small, and between 0.91 and 3.41 × 10⁶ cells m–2 for small species (Table 3). Respective values were much higher in the case of heterotrophic aloricates and varied between 1.29 to 8.08 × 10⁶ cells m–2 for very small, and between 2.08 and 7.96 × 10⁶ cells m–2 for small species. When considering the integrated abundance of medium and large cells (30–50 and >50 μm), mixotrophic ciliates were much lower numerically and varied between 0.16 and 1.80 × 10⁶ cells m–2 for medium species and between 0.00 and 1.28 × 10⁶ cells m–2 for large species.
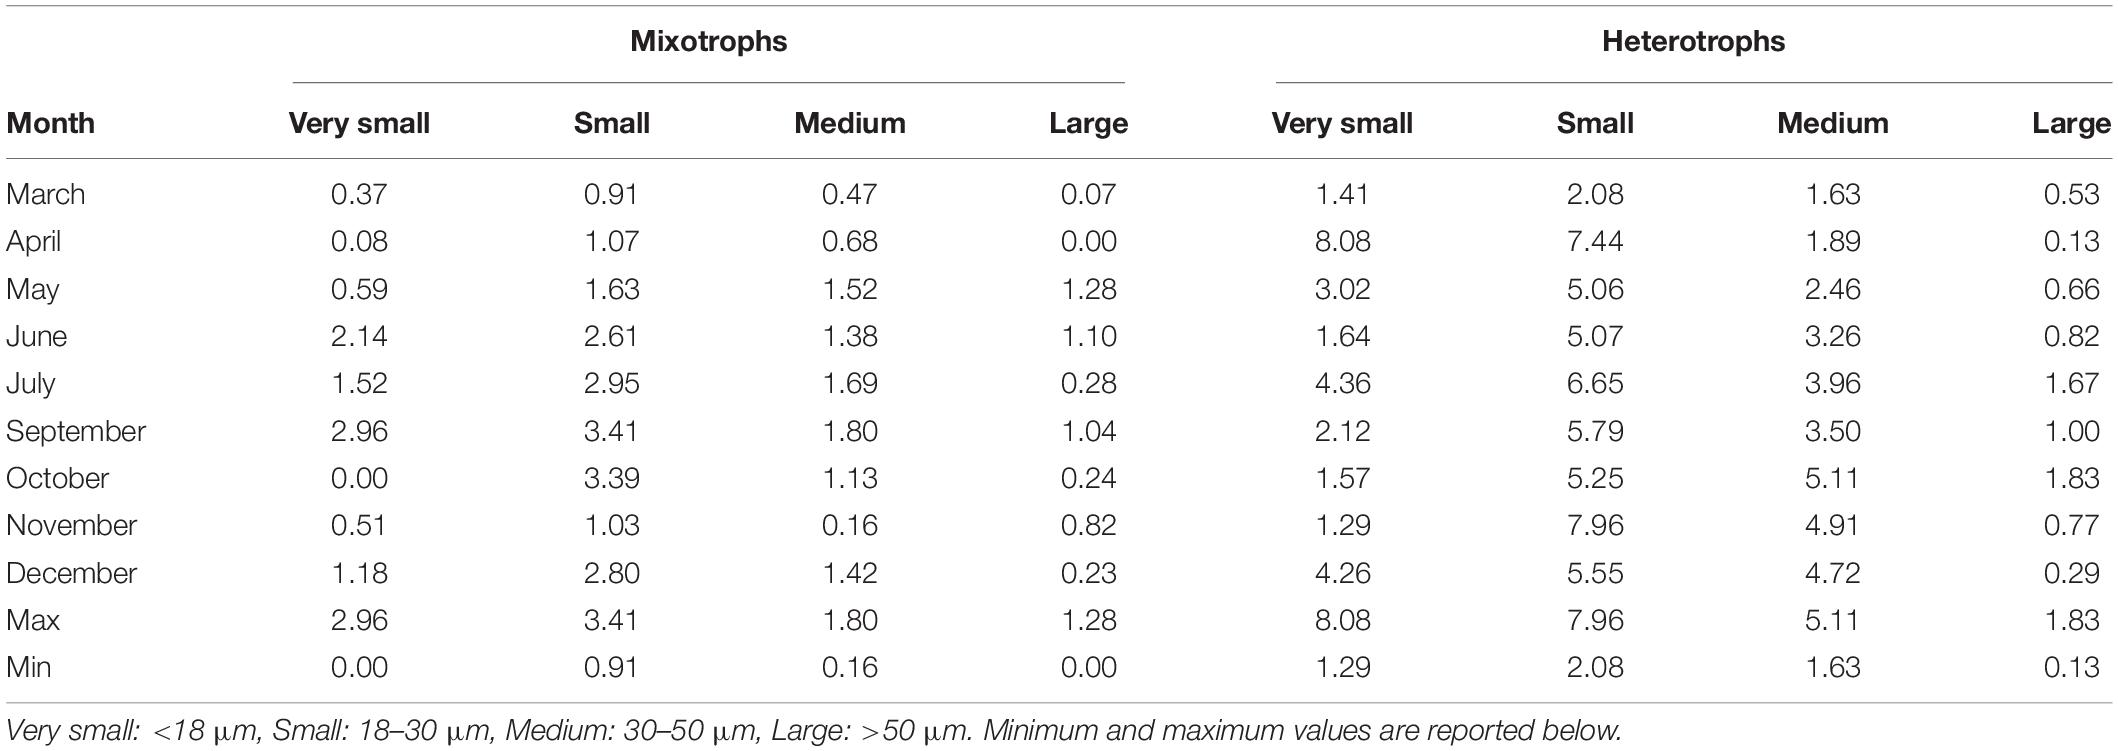
Table 3. Integrated abundance (106 cells m–2) of four size classes of aloricate mixotrophic and heterotrophic ciliates at each month.
The integrated abundances of mixotrophic ciliates were very low during autumn and spring, more specifically in October for very small species and November for medium cells, while the lowest number of small and large species was found in March and April, respectively (Table 3). The highest abundance for all four mixotrophic size classes was found in June, October, July and May respectively. Regarding heterotrophic ciliates, very small and small cells were very few during November and March, respectively, while the lowest abundance of medium and large heterotrophic ciliates was found in April, when the highest number of very small heterotrophic species was found. The maximum abundance of medium and large heterotrophic cells was found in October, together with the bloom of the small mixotrophic species (Table 3). The comparison of abundances between the two series of samples (Supplementary Table S3) showed lower cell loss in March, April, and May. On the other hand, a higher percentage of cell loss was evident in June, July and October. Pearson correlations showed a positive significant correlation between formaldehyde and Lugol total counts (R2 = 0.34, p < 0.0001∗∗∗) and a positive significant correlation for the large ciliates (R2 = 0.38, p < 0.0001∗∗∗) whereas a non-significant correlation (R2 = 0.02, p = ns) for nanociliates (Supplementary Figure 1).
Ciliate Taxa
During this study, based on samples fixed with formaldehyde, a total of 12,589 specimens were observed and counted, belonging to 57 ciliate taxa. Formaldehyde fixation does not allow for the identification of ciliates to the species level; for this reason, ciliates were identified to the genus level or as morphotypes. Aloricates were divided into mixotrophs and heterotrophs (by means of the recognition of presence/absence of fluorescent chloroplasts inside every single specimen observed). Regarding mixotrophic ciliates, species/morphotypes of four genera were observed (Strombidium, Tontonia, Laboea, and the species Mesodinium rubrum), while the most abundant heterotrophic genera were Strombidium, Strobilidium, Leegardiella, Lohmanniella, Strombidinopsis, Balanion, Tiarina, and the species Mesodinium pulex. The species Mesodinium rubrum was recognized by the shape and the characteristic position of the cilia situated around the body, typical of this genus. The species Mesodinium pulex was recognized by the shape and the presence of a “tail” characteristic of this species. Ciliate cell length ranged from as low as 10 μm up to 300 μm. The most abundant genus of the entire community was Strombidium, which made up more than 50% of total abundance, while other genera, such as Lohmanniella and Strobilidium, accounted for more than 30% of total abundance. Plastidic specialist non-constitutive mixotrophs (pSNCMs) as Mesodinium rubrum were abundant only in April (Figure 5).
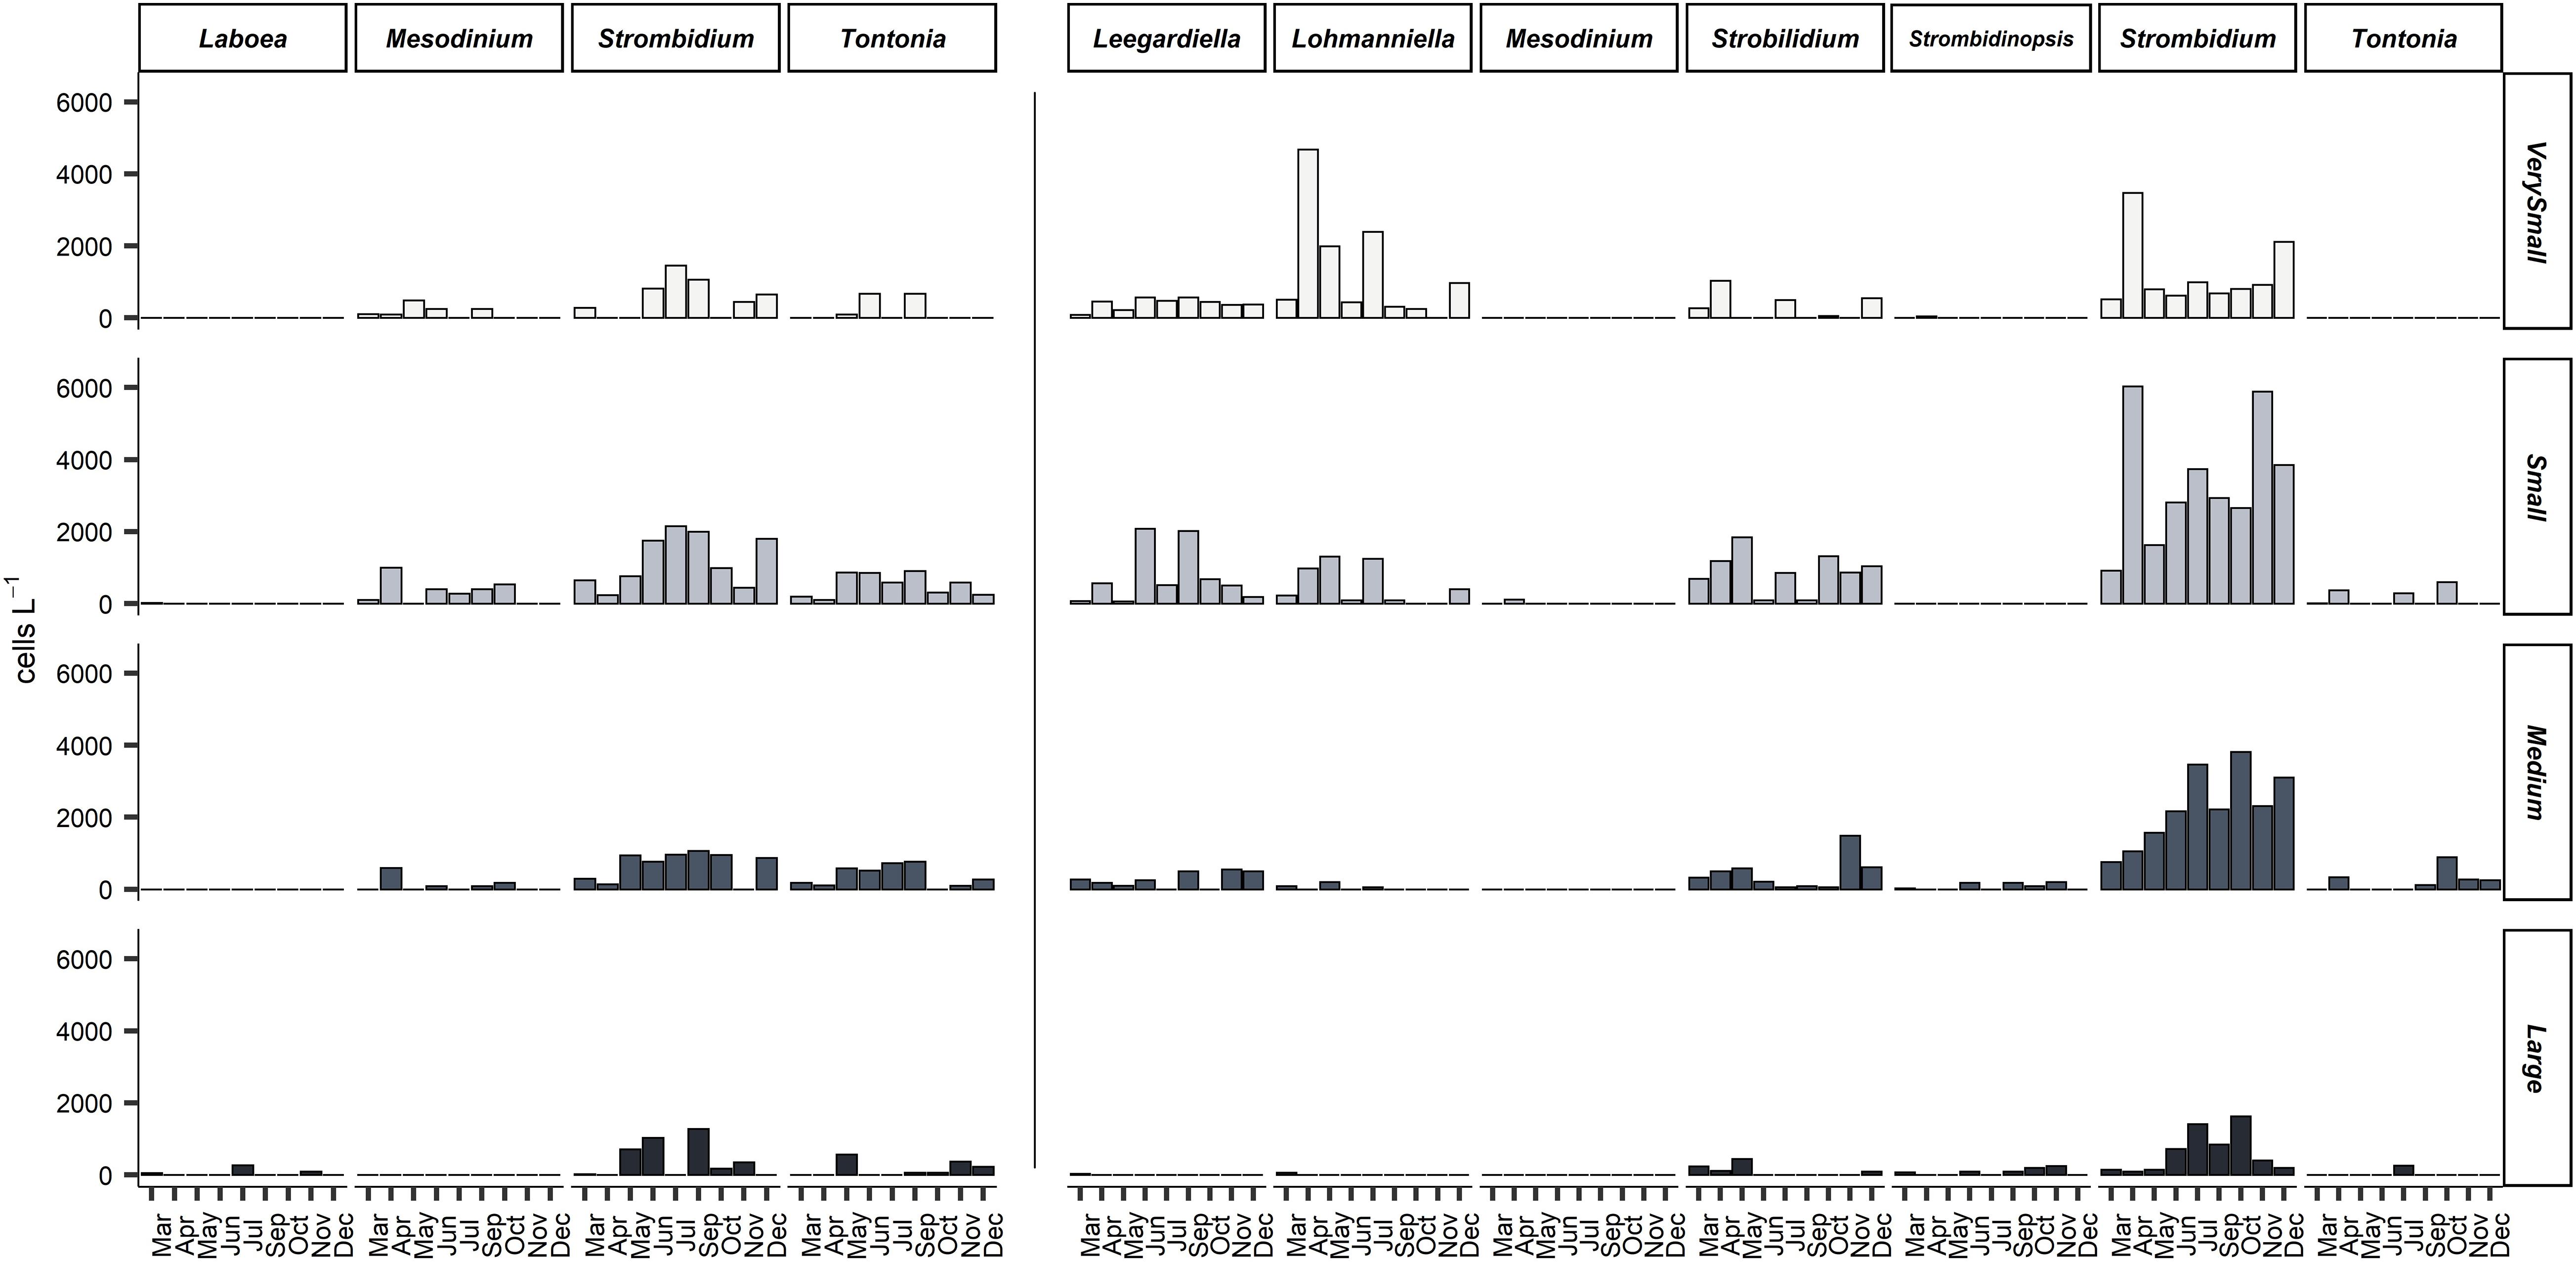
Figure 5. Integrated abundance (cells m– 2) of four size classes of mixotrophic (left) and heterotrophic (right) genera of planktonic ciliates at all months sampled. Very small: <18 μm, Small: 18–30 μm, Medium: 30–50 μm, Large: >50 μm.
Mixotrophic species belonging to Strombidium and Tontonia genera were very abundant during June, July, and September when the stratification was well formed (Figure 5). Mixotrophic Strombidium species that were abundant during the stratification period belonged to the very small and small size classes. Heterotrophic Strombidium species were abundant all year round.
Statistical Analysis
According to the two-way ANOVA (Table 4), abundances of the very small (<18 μm) together with the large (>50 μm) mixotrophs were significantly different (p < 0.05, p < 0.01, respectively) between the stratification and mixing and between the mixing and intermediate periods, respectively (Tukey test, Table 4). On the other hand, the medium and large (30–50 μm and >50 μm) mixotrophic ciliates significantly differed numerically among depths (p < 0.01). The Tukey test showed that this occurred at the very surface compared to the very deep layer for both medium and large cells (p < 0.05 and p < 0.01, respectively). Very small and small mixotrophic ciliates did not differ among depths (Table 4).
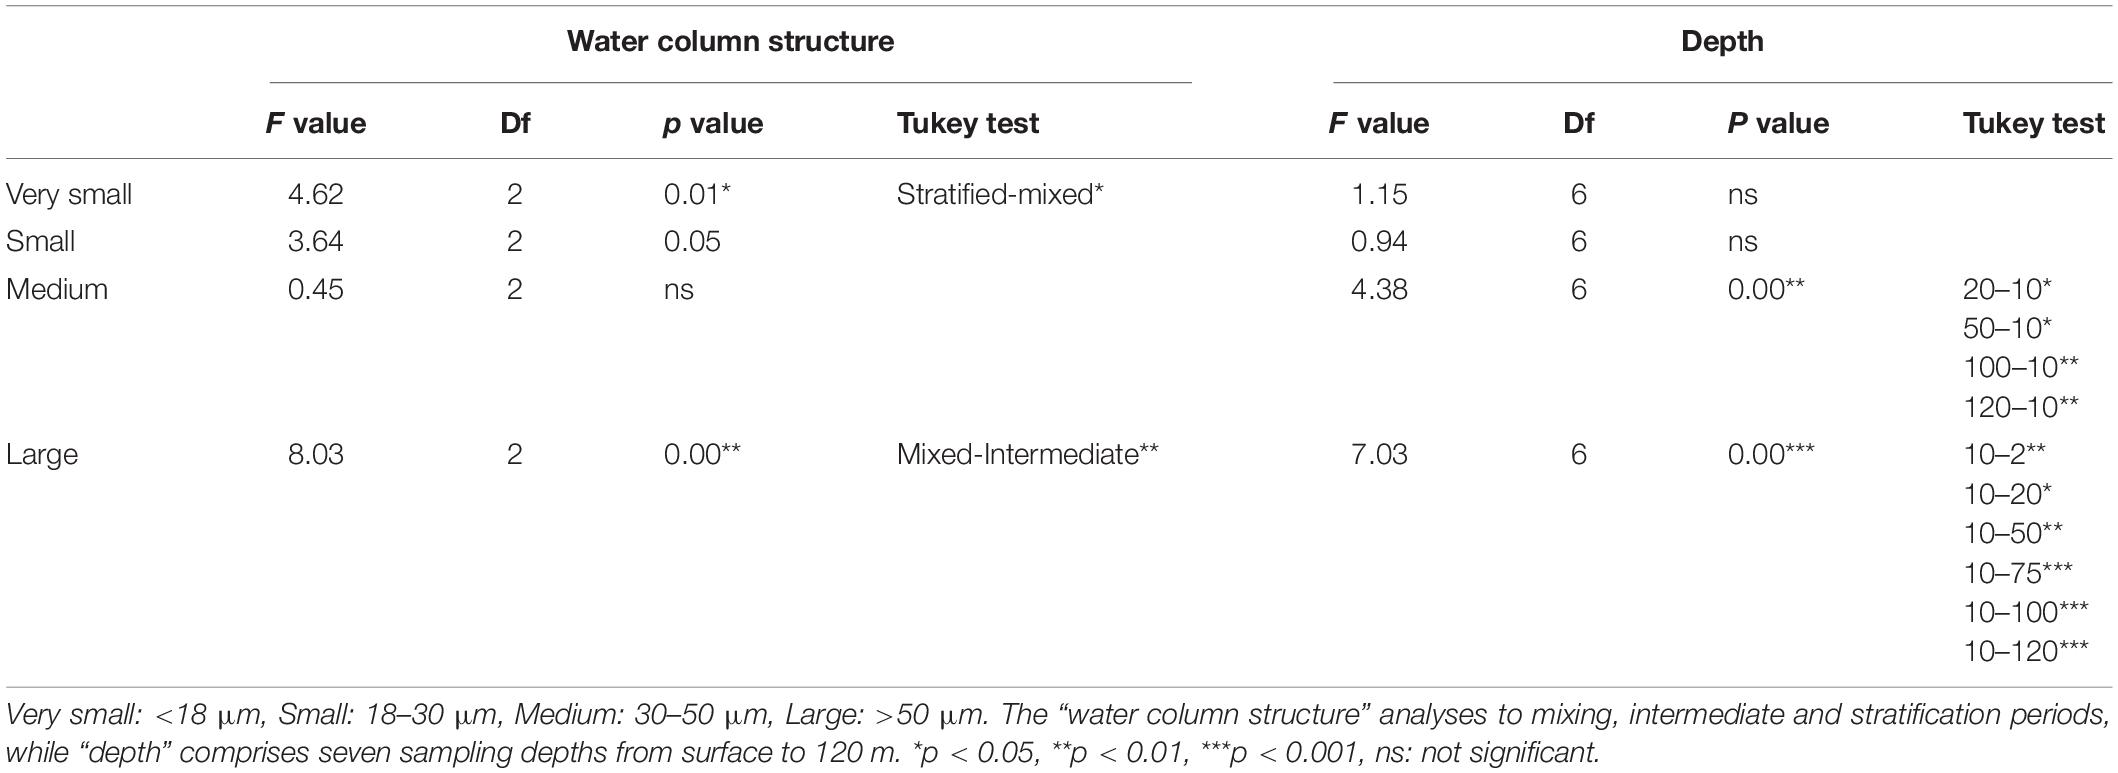
Table 4. Results of 2-way ANOVA (water column structure by depth) for abundance of different size classes of mixotrophic ciliates.
The two-way ANOVA (performed for abundance differences among mixotrophic genera according to the water column structure vs. months (Table 5) revealed significant differences related to the water column structure only for abundances of the mixotrophic species of the genera Strombidium and Tontonia. More specifically, according to the Tukey test results (Table 5), the abundance of mixotrophic Strombidium species significantly differed during the stratification period compared to the other two, while the mixotrophic Tontonia species significantly differed only between the mixing and intermediate periods of the water column.
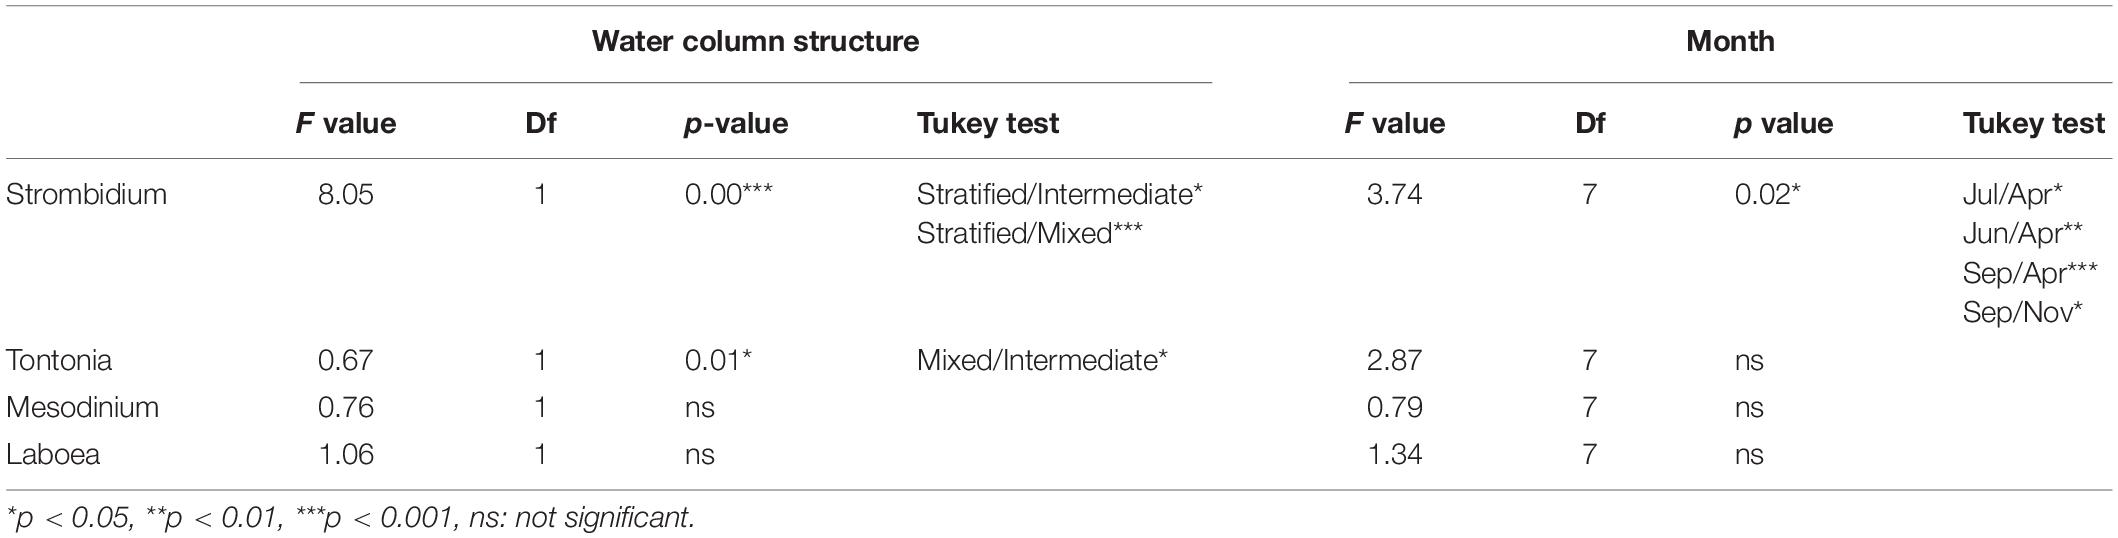
Table 5. Results of 2-way ANOVA (water column structure by months) for abundance of different genera of mixotrophic ciliates.
Regarding months, significant differences were found only for abundances of mixotrophic Strombidium species (two-way ANOVA, p < 0.001) (Table 5). The Tukey test performed to check for differences among months revealed differences of mixotrophic species between June, July and September (i.e., during stratification), on one hand, and April and November (i.e., when the stratification, respectively, started and finished), on the other (Table 5).
A non-metric multidimensional scaling analysis (NMDS) of species abundance data showed that samples taken during the mixing period clustered together; this was also the case for samples taken during the stratification period (Figure 6). Samples from the intermediate period were placed between the two others; this is an indication that the intermediate water column period is closely connected to the other two periods.
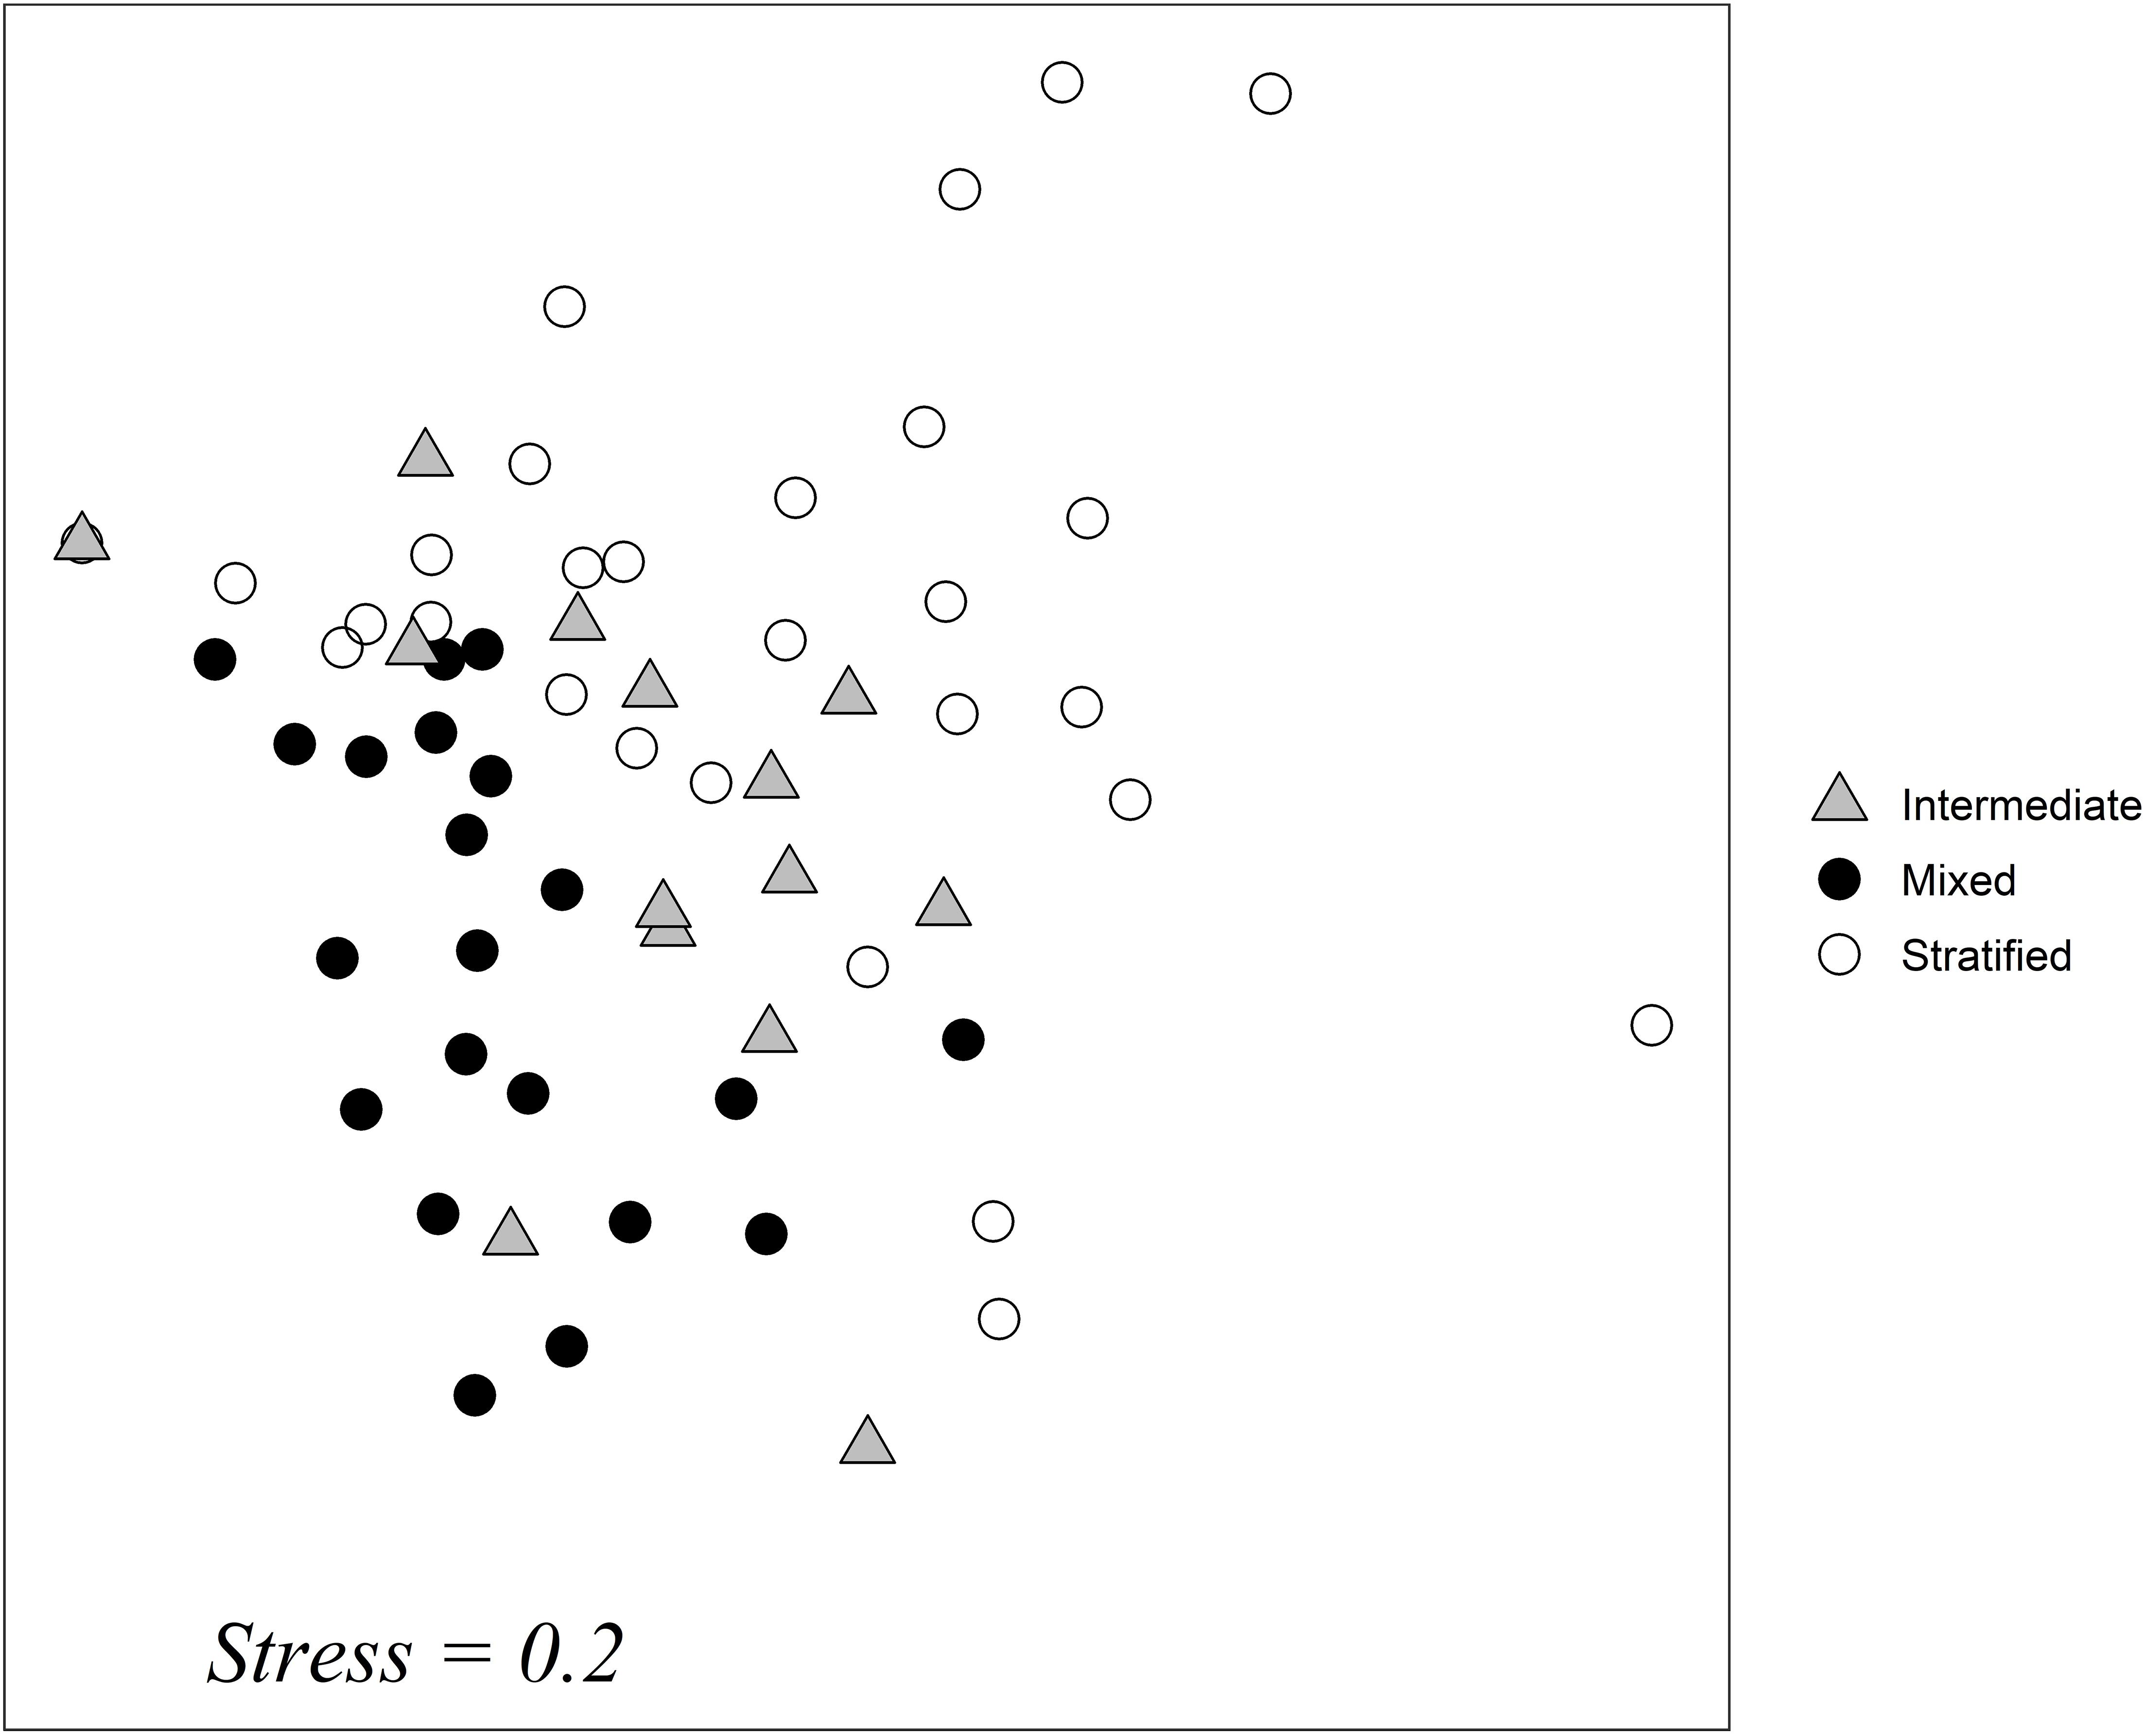
Figure 6. NMDS ordination plot of samples taken at all months and in all depths. Different shapes represent the differentiation of samples based on the structure of the water column: gray triangle: intermediate period of stratification construction and destruction, black circle: mixed water column, empty circle: stratified water column. Stress = 0.2.
Discussion
Few studies on planktonic ciliates have been conducted in oligotrophic marine environments, and most of them do not report on mixotrophs. The abundance of planktonic ciliates in the present study in the oligotrophic Eastern Mediterranean was lower or similar to the open ocean waters of the north-western Indian Ocean (31 cells L–1), the more productive waters of the equatorial northern Arabian Sea and Gulf of Oman (823 cells‘L–1, Leakey et al., 1996), and other coastal waters comprising the West Coast of South Island and New Zealand (114-1139 cells L–1 James and Hall, 1995). It was considerably lower than records from the Subarctic Pacific (500-28000 cells L–1, Booth et al., 1993; Strom et al., 1993), the North Atlantic Ocean (1011-4220 cells L–1 Stoecker et al., 1994), and the Red Sea (max 3534 cells L–1 Claessens et al., 2008). Our values were slightly lower than previous records from the same area of the South Aegean, the Eastern Mediterranean Sea, and the North Aegean (max 1280 cells L–1 Pitta and Giannakourou, 2000), and considerably lower compared to the Ligurian Sea (Pérez et al., 2000) and the Gulf of Naples (Modigh, 2001), both in the Western Mediterranean.
Larger mixotrophic species, like Laboea strobila, were observed in early spring and Tontonia spp. in summer; this was also reported by Bernard and Rassouladegan (1994) in Villefranche-sur-Mer, South France and Modigh (2001) in the Gulf of Naples. In the present study, mixotrophic species were more abundant during the warm summer period, more specifically from June to October, while heterotrophs did not show any correlation with seasons. This may be explained by the potential connection between mixotrophic ciliates and light, as previously reported by Bernard and Rassouladegan (1994). More specifically, the presence of the photosynthetic system of the marine mixotrophic oligotrichs could explain the fact that mixotrophic species are more abundant during the months with the lightest. Another interesting result was the “deepening” of mixotrophic species during June and July; high surface temperatures together with a strong light intensity during these months could have affected the photosynthetic apparatus of mixotrophic ciliates that moved to the DCM layer.
Fixation Method and How It May Affect the Results
The differences of ciliate abundance or biomass reported in different areas or environments could be attributed to the different fixatives used. According to Stoecker et al. (1994), the use of formaldehyde may cause a loss of up to 65% of the aloricate ciliate abundance. Although Lugol’s solution is considered the most effective fixative in terms of cell loss (Revelante and Gilmartin, 1983; Prog et al., 1989; Sime-Ngando et al., 1990; Leakey et al., 1996), it masks chlorophyll fluorescence; for this reason, the use of formaldehyde is mandatory in order to check the trophic regime of ciliates. Since both fixatives have advantages and disadvantages, Karayanni et al. (2004) recommended counting duplicate samples fixed with both solutions.
During the present study, a parallel series of samples fixed with acid Lugol’s solution was also examined. The results showed that the lower percentage of cell loss was measured in months where species like Laboea strobila occurred, while the highest value occurred during months where the ciliate community was dominated by very small species. Moreover, the Pearson correlation between the counts of formaldehyde and Lugol samples was not significant regarding very small cells but it was significantly positive regarding larger species. For this reason, we suspect that in this study, formaldehyde fixation affected the very small sized ciliates more, resulting in a higher loss percentage of the small (<30 μm) compared to the larger species (>30 μm).
Based on the present and previous studies, we may conclude that Lugol’s solution is an adequate fixative for assessments of planktonic abundance as well as the size distribution of species in the ciliate community. However, if we need to report on trophic modes of ciliates (heterotrophy vs. mixotrophy), it is mandatory to use formaldehyde as a fixative, keeping in mind the specific effect this fixative has on small species. To date, in most of the studies on planktonic ciliates, samples are fixed with Lugol; in these studies, only the species well known as mixotrophic, like Laboea strobila, Tontonia appendiculariformis, and Tontonia gracillima, are measured as the mixotrophic component of the ciliate community. This is the case in reports from the Catalan Sea (Dolan and Marrasé, 1995), Blanes Bay (Vaqué et al., 1997), the Tyrrhennian Sea and the Levantine Basin (Dolan et al., 1999), and in all the other studies mentioned above, conducted in the Pacific, Arctic, and Atlantic Oceans. In other words, small mixotrophic ciliates belonging to nanoplankton are totally missing from the above-mentioned studies. Moreover, if we consider the higher loss of small compared to larger ciliate species in formaldehyde-fixed samples, we may assume that the importance of small mixotrophic ciliates could be even greater than currently accepted; and, therefore, their role even more crucial in a food web generally dominated by small pico-sized photosynthetic organisms prevailing in oligotrophic environments.
Mixotrophy: Seasonal and Vertical Dynamics
In late spring and summer, mixotrophic oligotrichs may account for >50% of ciliate abundance or biomass in surface waters (Stoecker et al., 1987; Bernard and Rassouladegan, 1994; Dolan and Marrasé, 1995; Christaki et al., 2008). Stratification of the water column also occurs in arctic and sub-arctic areas where mixotrophic ciliates were found to be particularly important as components of the microplankton. More specifically, mixotrophic oligotrichs ranged between 58 and 64% of total ciliate abundance in the surface waters of Barents Sea (Putt, 1990) and for 13% and 30% of the total abundance and biomass, respectively, in Greenland surface waters (Levinsen et al., 2000). In the Western Bering Sea, Cobb Sea and Subarctic Pacific, mixotrophic ciliate biomass contributed 40% to the total ciliate biomass in late spring and summer (Sime-Ngando et al., 1992; Sorokin et al., 1996; Suzuki and Taniguchi, 1998). The present study demonstrated the importance of mixotrophic ciliates in summer also for the Mediterranean Sea, where mixotrophic ciliates contributed 37% to the total integrated abundance during May, June, July, and September, while heterotrophs did not show any specific seasonal pattern. Mitra et al. (2014) hypothesized that autotrophic and heterotrophic organisms dominate during the developmental phase of the ecosystems, while mixotrophs dominate in mature systems, benefiting from a flexible nutrition. Our study showed that the mixotrophic strategy was increasingly important at the decline of the spring bloom and during summer, when the system shifts from net autotrophy to net heterotrophy.
All the above-mentioned studies conducted in oligotrophic systems showed the importance of mixotrophic ciliates during the warm stratification period of the water column, without considering, however, the role of nanociliates. Since it is known that oligotrophic conditions favor nanoplankton feeding on pico-bacterioplankton in tropical and temperate areas (Zubkov and Tarran, 2008), if we report on trophic relationships from oligotrophic environments, nanociliates (very small <18 μm) should also be considered because they represent an important grazer (except for nano-flagellates) for picoplankton. This is one of few studies reporting on the annual dynamics and vertical distribution of size classes of mixotrophic vs. heterotrophic ciliates through the water column (2–120 m), taking into account the contribution of the very small and small (<30 μm) mixotrophic ciliates that were found to comprise up to 50% of the total ciliate community during June, July, and September (a significantly different abundance between the stratification and mixing periods), most probably grazing on bacterioplankton and pico-phytoplankton that flourish during the stratification compared to the mixing period. Larger mixotrophs, like Laboea strobila and Tontonia appendiculariformis, were found only during the construction and destruction of the water column stratification (May and November, respectively; a significantly different abundance was found between the mixing and intermediate periods).
Based on these results, we may conclude that the four size classes of mixotrophs (very small, small, medium, and large) have distinct vertical distributions throughout the water column, reflecting different ecological strategies. Due to their limited size (<18 μm), very small ciliates feed only on picoplankton (bacteria, cyanobacteria, and flagellates) so they could be considered generalists since those groups are present through the whole water column. Larger mixotrophs (>50 μm) are probably more specialists since they can feed only on some groups belonging to phytoplankton. This could explain the differences in the vertical distribution of the four size classes of mixotrophic ciliates. A two-way ANOVA (Supplementary Table 4) to compare the distribution of the four size classes of heterotrophic ciliates showed that only the medium-size class significantly differed between the mixed and stratified water column as well as between depths; especially between the surface (2, 10, and 20 m) and the layer below DCM (100 and 120 m). In contrast with the mixotrophic, larger heterotrophic species did not show any difference through depths. This is a major difference of the larger heterotrophs compared to the large mixotrophs, which were present only above the DCM.
Conclusion
Mixotrophic ciliates were found to widely populate this oligotrophic environment, which is poor in nutrients but with plenty of light. The data presented here showed that planktonic ciliates of different types of trophic strategies displayed different vertical and temporal distributions, relative to the season. Heterotrophic ciliate abundance and biomass did not show any seasonality but were closely linked to chla concentration. In contrast, mixotrophic forms were largely restricted to the months with high temperatures and light. In the near-surface samples, mixotrophs formed an important part of total ciliate abundance and biomass, and likely moved to deeper layers during June and July. If we consider size classes, large mixotrophic species were found only above DCM, while small and very small mixotrophs were present throughout the water column. Based on this difference, we may conclude that large and small mixotrophs could be considered as two different groups following different distribution patterns and driven by different factors.
Data Availability Statement
The original contributions presented in the study are included in the manuscript/Supplementary Material, further inquiries can be directed to the corresponding author/s.
Author Contributions
FR contributed to data acquisition and analysis, data interpretation, preparation of figures, and drafting of the manuscript. KS contributed to data analysis and figure preparation. PP contributed to design and conception of the sampling, data analysis and interpretation, and drafting of the manuscript. All authors reviewed the manuscript.
Conflict of Interest
The authors declare that the research was conducted in the absence of any commercial or financial relationships that could be construed as a potential conflict of interest.
Acknowledgments
This research was supported by EC MSCA-ITN 2019 funding to the project MixITiN (Grant Number 766327). We thank M. Pettas and A. Kalampokis for assistance during sampling as well as E. Dafnomili and S. Zivanovic for assistance with chemical analyses.
Supplementary Material
The Supplementary Material for this article can be found online at: https://www.frontiersin.org/articles/10.3389/fmars.2021.641589/full#supplementary-material
References
Azov, Y. (1986). Seasonal patterns of phytoplankton productivity and abundance in nearshore oligotrophic waters of the Levant Basin (Mediterranean). J. Plankton Res. 8, 41–53. doi: 10.1093/plankt/8.1.41
Barale, V., Jaquet, J. M., and Ndiaye, M. (2008). Algal blooming patterns and anomalies in the Mediterranean Sea as derived from the SeaWiFS data set (1998-2003). Remote Sens. Environ. 112, 3300–3313. doi: 10.1016/j.rse.2007.10.014
Bernard, C., and Rassouladegan, F. (1994). Seasonal variations of mixotrophic ciliates in the northwest Mediterranean Sea. Mar. Ecol. Prog. Ser. 108, 295–302. doi: 10.3354/meps108295
Blackbourn, D. J., Taylor, F. J. R., and Blackbourn, J. (1973). Foreign organelle retention by ciliates. J. Protozool. 20, 286–288. doi: 10.1111/j.1550-7408.1973.tb00877.x
Bojanić, N., Šolić, M., Krstulović, N., Marasović, I., and Ninčević, Ž, and Vidjak, O. (2001). Seasonal and vertical distribution of the ciliated protozoa and micrometazoa in Kaštela Bay (Central Adriatic). Helgoland Mar. Res. 55, 150–159. doi: 10.1007/s101520000067
Booth, B. C., Lewin, J., and Postel, J. R. (1993). Temporal variation in the structure of autotrophic and heterotrophic communities in the subarctic Pacific. Prog. Oceanogr. 32, 57–99. doi: 10.1016/0079-6611(93)90009-3
Christaki, U., Obernosterer, I., Van Wambeke, F., Veldhuis, M., Garcia, N., and Catala, P. (2008). Microbial food web structure in a naturally iron-fertilized area in the Southern Ocean (Kerguelen Plateau). Deep Sea Res. Part II Top. Stud. Oceanogr. 55, 706–719. doi: 10.1016/j.dsr2.2007.12.009
Claessens, M., Wickham, S. A., Post, A. F., and Reuter, M. (2008). Ciliate community in the oligotrophic Gulf of Aqaba, Red Sea. Aquat. Microb. Ecol. 53, 181–190. doi: 10.3354/ame01243
Dolan, J. R., and Marrasé, C. (1995). Planktonic ciliate distribution relative to a deep chlorophyll maximum: Catalan Sea, N.W. Mediterranean, June 1993. Deep Sea Res. Part I 42, 1965–1987. doi: 10.1016/0967-0637(95)00092-5
Dolan, J. R., Vidussi, F., and Claustre, H. (1999). Planktonic ciliates in the Mediterranean Sea: longitudinal trends. Deep Sea Res. Part I Oceanogr. Res. Pap. 46, 2025–2039. doi: 10.1016/S0967-0637(99)00043-6
D’Ortenzio, F., and D’Alcalà, M. R. (2009). On the trophic regimes of the Mediterranean Sea: a satellite analysis. Biogeosciences 6, 139–148. doi: 10.5194/bg-6-139-2009
Flynn, K. J., Mitra, A., Anestis, K., Anschütz, A. A., Calbet, A., Ferreira, G. D., et al. (2019). Mixotrophic protists and a new paradigm for marine ecology: where does plankton research go now? J. Plankton Res. 41, 375–391. doi: 10.1093/plankt/fbz026
Gifford, D. (1985). Laboratory culture of marine planktonic oligotrichs (Ciliophora, Oligotrichida). Mar. Ecol. Prog. Ser. 23, 257–267. doi: 10.3354/meps023257
Ivancic, I., and Degobbis, D. (1984). An optimal manual procedure for ammonia analysis in natural waters by the indophenol blue method. Water Res. 18, 1143–1147. doi: 10.1016/0043-1354(84)90230-6
James, M. R., and Hall, J. A. (1995). Planktonic ciliated protozoa: their distribution and relationship to environmental variables in a marine coastal ecosystem. J. Plankton Res. 17, 659–683. doi: 10.1093/plankt/17.4.659
Jonsson, P. (1987). Photosynthetic assimilation of inorganic carbon in marine oligotrich ciliates (Ciliophora, Oligotrichina). Mar. Microb. Food Webs 2, 55–68.
Jörgensen, E. G. (1924). Mediterranean Tintinnidae. Report on the Danish Oceanographical Expeditions 1908-1910 to the Mediterranean and adjacent Seas, 2. Biology (J.3). (Copenhagen: Andr. Fred. Høst & Søn), 109.
Karayanni, H., Christaki, U., Van Wambeke, F., and Dalby, A. P. (2004). Evaluation of double formalin - Lugol’s fixation in assessing number and biomass of ciliates: an example of estimations at mesoscale in NE Atlantic. J. Microbiol. Methods 56, 349–358. doi: 10.1016/j.mimet.2003.11.002
Krom, M. D., Herut, B., and Mantoura, R. F. C. (2004). Nutrient budget for the Eastern Mediterranean: implications for phosphorus limitation. Limnol. Oceanogr. 49, 1582–1592. doi: 10.4319/lo.2004.49.5.1582
Laval-Peuto, M. (1986). On plastid symbiosis in Tontonia appendiculariformis (Ciliophora, Oligotrichina). Biosystems 19, 137–158. doi: 10.1016/0303-2647(86)90026-2
Laval-Peuto, M., and Rassoulzadegan, F. (1988). Autofluorescence of marine planktonic Oligotrichina and other ciliates. Hydrobiologia 159, 99–110. doi: 10.1007/BF00007371
Leakey, R. J. G., Burkill, P. H., and Sleigh, M. A. (1992). Planktonic ciliates in Southampton Water: abundance, biomass, production, and role in pelagic carbon flow. Mar. Biol. 114, 67–83. doi: 10.1007/BF00350857
Leakey, R. J. G., Burkill, P. H., and Sleigh, M. A. (1996). Planktonic ciliates in the northwestern Indian Ocean: their abundance and biomass in waters of contrasting productivity. J. Plankton Res. 18, 1063–1071. doi: 10.1093/plankt/18.6.1063
Levinsen, H., Turner, J. T., Nielsen, T. G., and Hansen, B. W. (2000). On the trophic coupling between protists and copepods in arctic marine ecosystems. Mar. Eco. Prog. Ser. 204, 65–77. doi: 10.3354/meps204065
Lynn and Montagnes (1991). “Global production of heterotrophic marine planktonic ciliates. NATO ASSeries,” Protozoa and Their Role in Marine Processes, Vol. 25, eds P. C. Reid et al. (Heidelberg: o Springer-Verlag), 281–307.
Lynn, D. H., Montagnes, D. J. S., Dale, T., Gilron, G. L., and Strom, S. L. (1991). A reassessment of the genus strombidinopsis (ciliophora, choreotrichida) with descriptions of four new planktonic species and remarks on its taxonomy and phylogeny. J. Mar. Biol. Assoc. U.K. 71, 597–612. doi: 10.1017/S0025315400053170
Lynn, D. H., Montagnes, D. J. S., and Small, E. B. (1988). Taxonomic descriptions of some conspicuous species in the family strombidiidae (Ciliophora: Oligotrichida) from the isles of shoals, gulf of maine. J. Mar. Biol. Assoc. U.K. 68, 259–276. doi: 10.1017/S0025315400052176
McManus, G. B., and Fuhrman, J. A. (1986). Photosynthetic pigments in the ciliate Laboea strobila from Long Island Sound, USA. J. Plankton Res. 8, 317–327. doi: 10.1093/plankt/8.2.317
Mitra, A., Flynn, K. J., Burkholder, J. M., Berge, T., Calbet, A., Raven, J. A., et al. (2014). The role of mixotrophic protists in the biological carbon pump. Biogeosciences 11, 995–1005. doi: 10.5194/bg-11-995-2014
Modigh, M. (2001). Seasonal variations of photosynthetic ciliates at a Mediterranean coastal site. Aquat. Microb. Ecol. 23, 163–175. doi: 10.3354/ame023163
Montagnes, D. J. S., Lynn, D. H., Stoecker, D. K., and Small, E. B. (1988). Taxonomic descriptions of one new species and Redescription of four species in the Family Strombidiidae (Ciliophora, Oligotrichida). J. Protozool. 35, 189–197. doi: 10.1111/j.1550-7408.1988.tb04322.x
Pérez, M. T., Dolan, J. R., Vidussi, F., and Fukai, E. (2000). Diel vertical distribution of planktonic ciliates within the surface layer of the NW Mediterranean (May 1995). Deep Sea Res. Part I Oceanogr. Res. Pap. 47, 479–503. doi: 10.1016/S0967-0637(99)00099-0
Peuto-Moreau, M. (1991). Symbiose Plastidiale et Mixotrophie des Ciliés Planctoniques Marins Oligotrichina (Ciliophora). Thèse de doctorat d’ état, Université de Nice-Sophia Antipolis, Nice.
Pierce, R. W., and Turner, J. T. (1992). Ecology of planktonic ciliates in marine food webs. Rev. Aquat. Sci. 6, 139–181.
Pitta, P., and Giannakourou, A. (2000). Planktonic ciliates in the oligotrophic Eastern Mediterranean: vertical, spatial distribution and mixotrophy. Mar. Ecol. Prog. Ser. 194, 269–282. doi: 10.3354/meps194269
Pitta, P., Giannakourou, A., and Christaki, U. (2001). Planktonic ciliates in the oligotrophic Mediterranean Sea: longitudinal trends of standing stocks, distributions and analysis of food vacuole contents. Aquat. Microb. Ecol. 24, 297–311. doi: 10.3354/ame024297
Powley, H. R., Krom, M. D., and Van Cappellen, P. (2017). Understanding the unique biogeochemistry of the Mediterranean Sea: insights from a coupled phosphorus and nitrogen model. Glob. Biogeochem. Cycles 31, 1010–1031. doi: 10.1002/2017GB005648
Prog, S., Stoecker, D. K., Taniguchi, A., and Michaels, A. E. (1989). Abundance of autotrophic, mixotrophic and heterotrophic planktonic ciliates in shelf and slope waters. Mar. Ecol. Prog. Ser. 50, 241–254. doi: 10.3354/meps050241
Putt, M. (1990). Abundance, chlorophyll content and photosynthetic rates of ciliates in the Nordic Seas during summer. Deep Sea Res. Part A Oceanogr. Res. Pap. 37, 1713–1731. doi: 10.1016/0198-0149(90)90073-5
Putt, M., and Stoecker, D. K. (1989). An experimentally determined carbon: volume ratio for marine “oligotrichous” ciliates from estuarine and coastal waters. Limnol. Oceanogr. 34, 1097–1103. doi: 10.4319/lo.1989.34.6.1097
Rekik, A., Denis, M., Dugenne, M., Maalej, S., and Ayadi, H. (2015). Planktonic ciliates in relation to abiotic variables on the north coast of Sfax after environmental restoration: species composition, and abundance-biomass seasonal variation. J. Oceanogr. Res. Data 8, 1–16.
Revelante, N., and Gilmartin, M. (1983). Microzooplankton distribution in the Northern Adriatic Sea with emphasis on the relative abundance of ciliated protozoans. Oceanol. Acta 6, 407–415.
Sime-Ngando, T., Hartmann, H. J., and Groliere, C. A. (1990). Rapid quantification of planktonic ciliates: comparison of improved live counting with other methods. Appl. Environ. Microbiol. 56, 2234–2242. doi: 10.1128/aem.56.7.2234-2242.1990
Sime-Ngando, T., Juniper, K., and Vezina, A. (1992). Ciliated protozoan communities over cobb Seamount: increase in biomass and spatial patchiness. Mar. Ecol. Prog. Ser. 89, 37–51. doi: 10.3354/meps089037
Smetacek, V. (1981). The annual cycle of protozooplankton in the Kiel Bight. Mar. Biol. 63, 1–11. doi: 10.1007/BF00394657
Sorokin, Y. I., Sorokin, P. Y., and Mamaeva, T. I. (1996). Density and distribution of bacterioplankton and planktonic ciliates in the Bering Sea and North Pacific. J. Plankton Res. 18, 1–16. doi: 10.1093/plankt/18.1.1
Stoecker, D. K., Gifford, D. J., and Putt, M. (1994). Preservation of marine planktonic ciliates - Losses and cell shrinkage during fixation. Mar. Ecol. Prog. Ser. 110, 293–299. doi: 10.3354/meps110293
Stoecker, D. K., and Michaels, A. E. (1991). Respiration, photosynthesis and carbon metabolism in planktonic ciliates. Mar. Biol. 108, 441–447. doi: 10.1007/BF01313654
Stoecker, D. K., Michaels, A. E., and Davis, L. H. (1987). Large proportion of marine planktonic ciliates found to contain functional chloroplasts. Nature 326, 790–792. doi: 10.1038/326790a0
Stoecker, D. K., and Silver, M. W. (1987). Chloroplast retention by marine planktonic ciliates. Ann. N.Y. Acad. Sci. 503, 562–565. doi: 10.1111/j.1749-6632.1987.tb40646.x
Strickland, J., and Parsons, T. (1972). A Practical Handbook of Sewater Analysis. Ottawa: Fisheries Research Board of Canada.
Strom, S. L., Postel, J. R., and Booth, B. C. (1993). Abundance, variability, and potential grazing impact of planktonic ciliates in the open subaratic Pacific Ocean. Prog. Oceanogr. 32, 185–203. doi: 10.1016/0079-6611(93)90013-4
Suzuki, T., and Taniguchi, A. (1998). Standing crops and vertical distribution of four groups of marine planktonic ciliates in relation to phytoplankton chlorophyll a. Mar. Biol. 132, 375–382. doi: 10.1007/s002270050404
Turley, C. M. (1999). The changing Mediterranean Sea - A sensitive ecosystem? Prog. Oceanogr. 44, 387–400. doi: 10.1016/S0079-6611(99)00033-6
Utermöhl, H. (1931). Neue Wege in der quantitativen erfassung des Plankton (Mit besonderer Berücksichtigung des Ultraplanktons). SIL Proc. 5, 567–596. doi: 10.1080/03680770.1931.11898492
Vaqué, D., Blough, H. A., and Duarte, C. M. (1997). Dynamics of ciliate abundance, biomass and community composition in an oligotrophic coastal environment (NW Mediterranean). Aquat. Microb. Ecol. 12, 71–83. doi: 10.3354/ame012071
Yacobi, Y. Z., Zohary, T., Kress, N., Hecht, A., Robarts, R. D., Waiser, M., et al. (1995). Chlorophyll distribution throughout the southeastern Mediterranean in relation to the physical structure of the water mass. J. Mar. Syst. 6, 179–190. doi: 10.1016/0924-7963(94)00028-A
Keywords: planktonic ciliates, mixotrophy, size classes, seasonal variability, vertical distribution, oligotrophic environment
Citation: Romano F, Symiakaki K and Pitta P (2021) Temporal Variability of Planktonic Ciliates in a Coastal Oligotrophic Environment: Mixotrophy, Size Classes and Vertical Distribution. Front. Mar. Sci. 8:641589. doi: 10.3389/fmars.2021.641589
Received: 14 December 2020; Accepted: 28 January 2021;
Published: 17 February 2021.
Edited by:
Dongyan LIU, East China Normal University, ChinaReviewed by:
Wuchang Zhang, Institute of Oceanology (CAS), ChinaHongbin Liu, The Hong Kong University of Science and Technology, Hong Kong
Copyright © 2021 Romano, Symiakaki and Pitta. This is an open-access article distributed under the terms of the Creative Commons Attribution License (CC BY). The use, distribution or reproduction in other forums is permitted, provided the original author(s) and the copyright owner(s) are credited and that the original publication in this journal is cited, in accordance with accepted academic practice. No use, distribution or reproduction is permitted which does not comply with these terms.
*Correspondence: Paraskevi Pitta, vpitta@hcmr.gr