
Scoping review of distribution models for selected Amblyomma ticks and rickettsial group pathogens
- Published
- Accepted
- Received
- Academic Editor
- Timothy Driscoll
- Subject Areas
- Ecology, Entomology, Zoology, Infectious Diseases, Spatial and Geographic Information Science
- Keywords
- Amblyomma, Rickettsia, Species distribution models, PRISMA
- Copyright
- © 2021 Lippi et al.
- Licence
- This is an open access article distributed under the terms of the Creative Commons Attribution License, which permits using, remixing, and building upon the work non-commercially, as long as it is properly attributed. For attribution, the original author(s), title, publication source (PeerJ) and either DOI or URL of the article must be cited.
- Cite this article
- 2021. Scoping review of distribution models for selected Amblyomma ticks and rickettsial group pathogens. PeerJ 9:e10596 https://doi.org/10.7717/peerj.10596
Abstract
The rising prevalence of tick-borne diseases in humans in recent decades has called attention to the need for more information on geographic risk for public health planning. Species distribution models (SDMs) are an increasingly utilized method of constructing potential geographic ranges. There are many knowledge gaps in our understanding of risk of exposure to tick-borne pathogens, particularly for those in the rickettsial group. Here, we conducted a systematic scoping review of the SDM literature for rickettsial pathogens and tick vectors in the genus Amblyomma. Of the 174 reviewed articles, only 24 studies used SDMs to estimate the potential extent of vector and/or pathogen ranges. The majority of studies (79%) estimated only tick distributions using vector presence as a proxy for pathogen exposure. Studies were conducted at different scales and across multiple continents. Few studies undertook original data collection, and SDMs were mostly built with presence-only datasets from public database or surveillance sources. The reliance on existing data sources, using ticks as a proxy for disease risk, may simply reflect a lag in new data acquisition and a thorough understanding of the tick-pathogen ecology involved.
Introduction
Tick-borne diseases are a global threat to public health, posing risks to both humans and domesticated animals. In recent years there have been documented increases in tick-borne diseases both in the United States and around the world. Much of this burden can be attributed to Lyme disease in the United States, Europe, and northern Asia. However, in the past 20 years, identification of previously unrecognized pathogens has revealed a great diversity in tick-borne viruses and bacteria (Paddock et al., 2016). Increases in tick-borne pathogen transmission and case detection have garnered a great deal of attention, triggering greater funding, resources, and agency responses (CDC, 2018; Couzin-Frankel, 2019). Nevertheless, the expanding burden of tick-borne disease has also highlighted crucial gaps in knowledge, particularly with regards to geographic risk mapping, an area of great interest to public health agencies. This is particularly evident in the case of rickettsial pathogens, comprising the ehrlichiosis, anaplasmosis, and spotted fever rickettsioses, which compared to Lyme disease remain understudied. Rickettsial pathogens of medical importance may be encountered worldwide, and ticks from the Amblyomma genus are competent vectors for many of these pathogens (Levin, Schumacher & Snellgrove, 2018). Although numbers of documented cases have been increasing in recent years, the true extent of geographic risk for rickettsial pathogens is challenging to delineate due to a lack of consistent, long-term, and widespread surveillance data, and regionally low case detection.
Tick-borne rickettsial diseases are considered an emerging health problem in many areas of the world (Parola, Paddock & Raoult, 2005). Diseases such as human ehrlichiosis (Ehrlichia spp.), human anaplasmosis (Anaplasma spp.), and Rocky Mountain Spotted Fever (RMSF) caused by R. rickettsii have shown generally increasing trends in recent decades. In the United States alone, spotted fever group rickettsioses, caused by Rickettsia spp., rose from over 400 reported cases in the year 2000, to over 6,000 cases in 2017 (CDC, 2020). Ricksettsial diseases typically present with nonspecific clinical symptoms, including headache, fever, nausea, and muscle aches, though rashes are often present in symptomatic cases of spotted fever group rickettsioses (Nicholson & Paddock, 2019). Severe cases can quickly become life threatening, particularly when appropriate medical treatment is delayed. Mapped distributions of the pathogens that cause tick-borne diseases can be invaluable to public health agencies in communicating potential risk of exposure, especially where emerging or understudied pathogens are concerned.
Species distributions models (SDMs), also commonly referred to as ecological niche models (ENMs), are becoming routinely used in vector-borne disease systems to model the potential geographic distribution of risk (Baak-Baak et al., 2017; Carvalho et al., 2015; Lippi et al., 2019; Peterson et al., 2002; Thomas & Beierkuhnlein, 2013). Broadly, this is accomplished by correlating locations where a species of interest is known to occur with the underlying environmental characteristics (e.g., climate, elevation, land cover). The resulting model can then be projected to unsampled areas on the landscape, providing a spatial prediction of areas that are ecologically suitable for species presence. In addition to predicting contemporary species distributions, SDMs are also employed to estimate the extent of potentially suitable habitat for invasive species, and potential shifts in geographic distributions due to climate change (Lippi et al., 2019; Carvalho, Rangel & Vale, 2017). There are many methodological approaches to estimating species distributions, and some of the more commonly encountered approaches include Maximum Entropy (MaxEnt), Generalized Additive Models (GAM), Boosted Regression Trees (BRT), and Random Forests (RF) (Elith, Leathwick & Hastie, 2008; Elith & Leathwick, 2009; Evans et al., 2011; Phillips, Anderson & Schapire, 2006). Although SDMs are a commonly used tool in estimating species ranges, the diversity in modeling approaches and applications makes it challenging to compare results across models.
For vector-borne disease SDMs, records of vector or pathogen presence (either the vector, the pathogen, the vector and pathogen, or even simply human case data) are often used as proxies for risk of exposure, and therefore transmission. Species distribution models have been used in a risk mapping capacity for many vector-borne disease systems, spanning a range of pathogens vectored by arthropods including mosquitoes, gnats, phlebotomine flies, fleas, triatomine bugs, and ticks (Carvalho et al., 2015; Lippi et al., 2019; Peterson et al., 2002; Crkvencic & Šlapeta, 2019; Sloyer et al., 2019). This framework is particularly useful in determining species limits for vectored transmission owing to the very close relationships between ectotherm life histories, pathogen replication, and environmental drivers such a temperature. Underlying distributions of reservoir hosts, another requisite component of zoonotic transmission cycles, are also influenced by land cover and environmental conditions (Gholamrezaei et al., 2016).
This work provides a comprehensive review of the published, peer-reviewed literature of studies that estimated species distribution, or ecological niche, of selected Amblyomma ticks, the rickettsial pathogens of potential public health concern they vector, or their combined distributions. Following Preferred Reporting Items for Systematic Reviews and Meta-analyses (PRISMA) guidelines, we identified and compiled studies that used occurrence records and environmental predictors to estimate the geographic range of target organisms (Moher et al., 2009). Additionally, we provide a synthesis of current knowledge in the field, identifying the range of regions, spatial scales, and environmental determinants used to define risk in these systems. Given the focus on vectors and pathogens that pose a risk to human populations, this review is relevant not only to disease ecologists and medical geographers who study vector-borne disease risk in a spatial context, but also public health professionals who may use the types of studies reviewed here in an advisory capacity. This work serves as a baseline for identifying knowledge gaps and guiding new studies of geographic risk mapping in understudied tick-borne disease systems.
Survey methodology
Literature searches were conducted following the guidelines in the PRISMA Statement, a checklist and flow diagram to ensure transparency and reproducibility in systematic reviews and meta-analyses (Moher et al., 2009; Liberati et al., 2009). Initial searches for peer-reviewed studies were conducted through September 2019. Five online databases were searched including Web of Science (Web of Science Core Collection, MEDLINE, BIOSIS Citation Index, Zoological Record) and Google Scholar. Searches were performed with combinations of key terms including “Amblyomma”, “Rickettsia*”, “niche model”, “ecological niche model”, and “species distribution model”. No restrictions were placed on geographic region of study or date of publication. Additional novel records for screening were identified via literature cited sections in records identified via database searches.
Duplicate records from the initial database searches were removed, and the remaining abstracts were screened for relevance. Records were excluded in this initial screening based on publication type (i.e., literature reviews, opinion pieces, and synthesis articles were excluded), methodology (i.e., studies that did not examine geographic distributions or risk were excluded), and selected taxonomic focus (i.e., vectors and pathogens other than the Amblyomma and rickettsial pathogens (Ehrlichia spp. and Rickettsia spp.) were excluded).
The remaining articles were then assessed in full for eligibility, where information on vectors, pathogens, modeling methods, geographic region, geographic scale of study, time period of study, data sources, and major findings were extracted from the text. Full-text articles in this final screening were flagged for exclusion based on focus of the study (e.g., modeling tick distributions as an exercise to compare modeling logistics and methodologies), mismatch in target organisms (e.g., the distribution of a target pathogen in a vector species of a non-target genus), or status as gray literature (e.g., unpublished theses). Studies that focused solely on rickettsial pathogens of veterinary or wildlife concern, including Anaplasma spp. transmitted by Amblyomma ticks, were not included in this analysis. The focus of this review was on species-level pathogens, and serology studies that only resolved pathogens to genus were also excluded.
Overview of reviewed studies
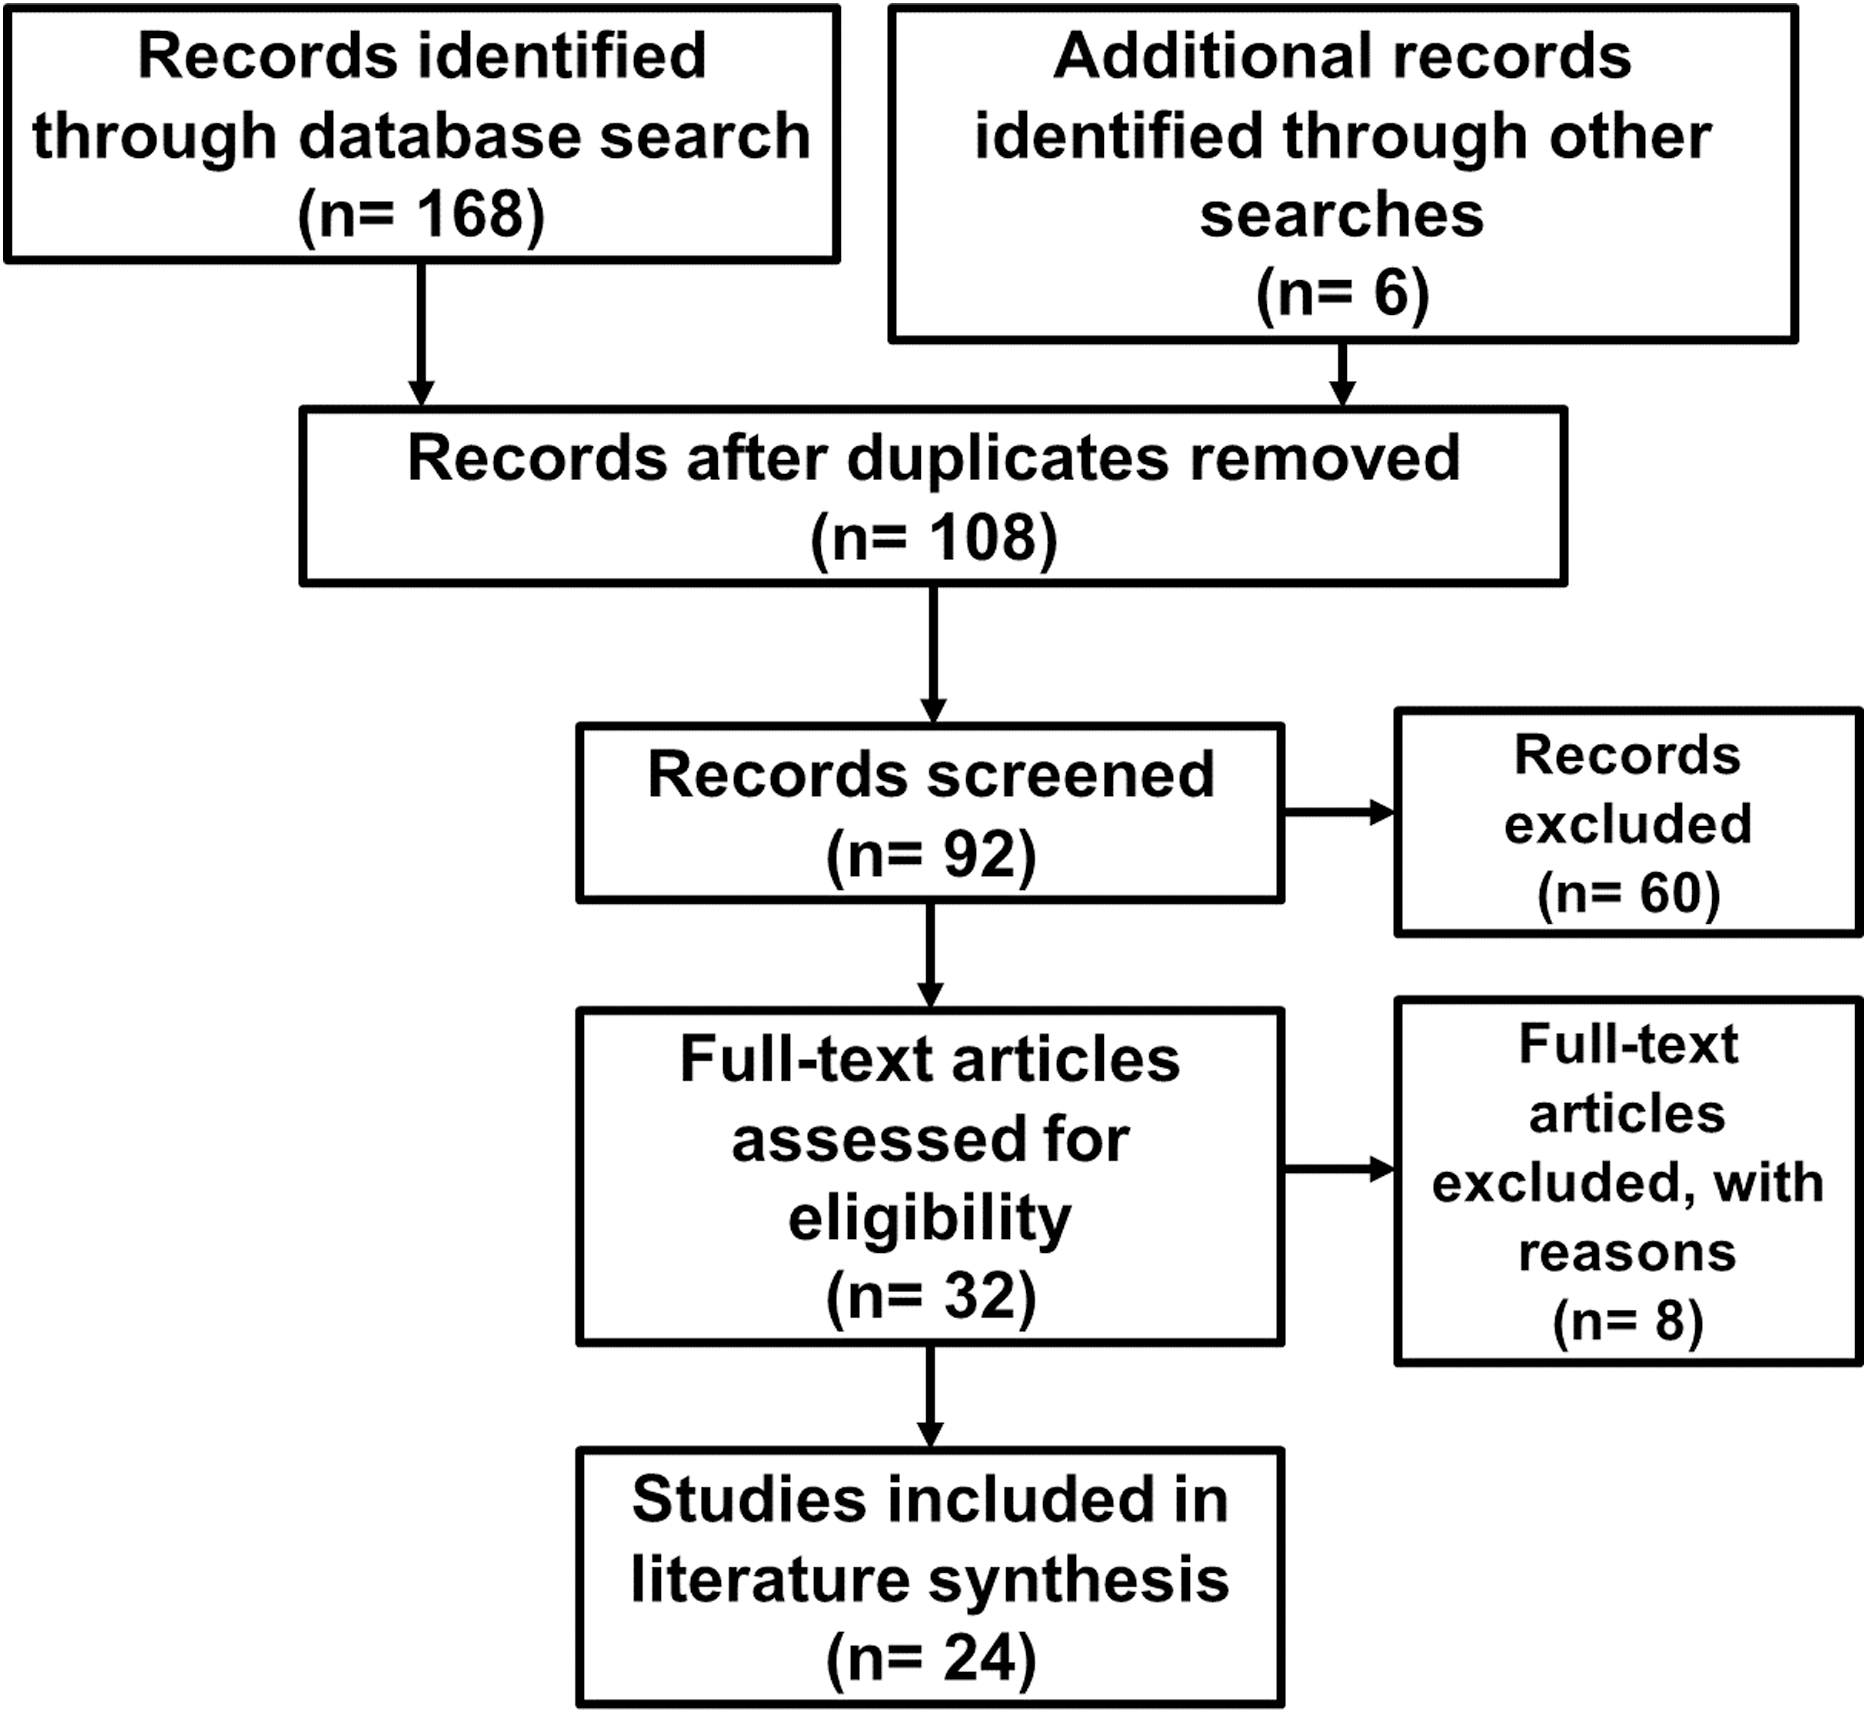
The initial search of the peer-reviewed literature yielded 174 studies published between 1994 and 2019. After removal of duplicate search results, 108 unique studies remained. Studies were screened for topic relevance and abstract content, after which 32 studies remained. These publications were then assessed in full, resulting in 24 studies on species distribution models for Amblyomma ticks or rickettsial pathogens that were included in the literature synthesis (Table 1). The PRISMA flow diagram outlining our literature search and screening process is shown in Fig. 1.
| Vector | Pathogen | Modeling Method | Location | Environmental Data | Major Factors | Reference |
|---|---|---|---|---|---|---|
| A. americanum | Rickettsia spp. | GAM, Splines, LR | USA | N/A | Expanding range of vector correlates with increased incidence | Behravesh et al. (2016) |
| A. americanum | N/A | LR,BRT,RF,MaxEnt,MARS | USA (FL) | DEM, STATSGO soil and hydrology database, FL Coop Land Cover, Daymet | Annual precipitation, Mean temperature of driest quarter, Minimum temperature of coldest month, Mean NDVI | Kessler, Ganser & Glass (2019) |
| A. americanum | N/A | LR | USA (FL) | WorldClim, FGDL, FL CLC, DEM | Forested areas, Precipitation seasonality | Kessler et al. (2019) |
| A. americanum | N/A | MaxEnt | USA (KS) | CliMond | Soil moisture, Temperature, Precipitation | Raghavan et al. (2016) |
| A. americanum | N/A | MaxEnt | North America | WorldClim | Annual precipitation, Precipitation seasonality, Mean diurnal range, Maximum temperature of warmest month | Raghavan et al. (2019) |
| A. americanum | N/A | LR | USA (MO) | University of Missouri Land-use Classification Map, Landsat5, NDVI, DEM, The Climate Source | Forested areas, Elevated relative humidity in June | Reese et al. (2011) |
| A. americanum | N/A | BRT, GLM, MARS, MaxEnt, RF | USA | WorldClim, Daymet | Mean diurnal temperature range, Annual precipitation, Mean vapor pressure in July | Springer et al. (2015) |
| A. americanum, A. maculatum, A. cajennense, A. mixtum | N/A | MaxEnt | USA (CA) | WorldClim, PRISM | Minimum temperature of coldest month | Pascoe et al. (2019) |
| A. hebraeum | N/A | DOMAIN | South Africa | NOAA AVHRR | Mean yearly temperature, Mean monthly max temperature, NDVI, Water vapor pressure deficit | Estrada-Peña (2003) |
| A. variegatum | N/A | MaxEnt, Gower distance | Africa, projected to New World | BioGeo Berkeley climate data | NDVI in June-August | Estrada-Peña et al. (2007) |
| A. hebraeum, A. variegatum | N/A | MaxEnt | Zimbabwe | Climate Research Unit Time Series (CRU TS) 2.0 | Temperature, Total annual rainfall, Rainfall seasonality | Estrada-Peña, Horak & Petney (2008) |
| A. hebraeum, A. variegatum | N/A | CLIMEX | Zimbabwe | Climate data from published literature | N/A | Norval et al. (1994) |
| A. variegatum, A. gemma, A. lepidum | N/A | WofE, ENFA | Tanzania | NOAA LandSat5 | Cattle density, Rainfall, Drought period (varied by species) | Lynen et al. (2007) |
| A. cajennense | N/A | MaxEnt | Mexico and USA (TX) | WordClim, USGS DEM | Elevation, NDVI, Mean temperature (13-16 ˚C), Seasonal rainfall | Illoldi-Rangel et al. (2012) |
| A. cajennense | N/A | ENFA, MaxEnt, GARP | Colombia | WorldClim, NDVI | Isothermality, Precipitation of driest quarter | Acevedo-Gutierrez et al. (2018) |
| A. cajennense, A. sculptum | N/A | MaxEnt | Brazil | WorldClim | Seven variables selected from literature: Annual mean temperature, Mean diurnal temperature range, Max temperature in warmest month, Min temperature in coldest month, Annual precipitation, Precipitation in wettest and driest months | De Oliveira et al. (2017) |
| A. mixtum, A. cajennense, A. tonelliae, A. sculptum | N/A | MaxEnt | Central and South America | MODIS NDVI and LST | Regional differences in vegetation and temperature align with tick species | Estrada-Peña et al. (2014) |
| A. mixtum, A. ovale |
R. rickettsii, R. amblyommii |
MaxEnt | Panama | WorldClim | Mean temperature of driest quarter, Elevation, Coastal shrub landcover, Forested areas, Rural areas | Bermúdez et al. (2016) |
| 10+ species of Amblyomma ticks in mainland Africa | N/A | LR | Mainland Africa | CRES climate, NDVI | Latitudinal gradient | Cumming (2000) |
| 10+ species of Amblyomma ticks in mainland Africa | N/A | LR | Mainland Africa | CRES climate, NDVI | Climate better predictor than NDVI, Minimum temperature, Maximum temperature, Rainfall | Cumming (2002) |
| 10+ species of Amblyomma ticks | N/A | Multiple Regression | Global | IMAGE 2.2 climate change models | All scenarios of climate change drove increases in tick habitat | Cumming & Van Vuuren (2006) |
| N/A | R. rickettsii | BHM | USA (KS, MO, OK, AR) | National Landcover Dataset, MODIS, NASA POWER, US Census | Poverty, Average humidity, Average land surface temperature | Raghavan et al. (2016) |
| N/A | E. chaffeensis | LR | USA (MS) | MLCD, MODIS NDVI | Soil moisture, Flooding, Forest cover, NDVI | Manangan et al. (2007) |
| N/A | E. chaffeensis | GWR | South-central and Southeastern USA | NLCD, Daymet, white-tailed deer density | Temperature, Humidity, Precipitation, Forest cover | Wimberly et al. (2008) |
Note:
BHM, Bayesian Hierarchical Model; BRT, Boosted Regression Trees; ENFA, Ecological Niche Factor Analysis; GARP, Genetic Algorithm for Rule-Set Production; GLM, Generalized Linear Model; GWR, Geographically Weighted Regression; LR, Linear Regression; MARS, Multivariate Adaptive Regression Splines; RF, Random Forests.
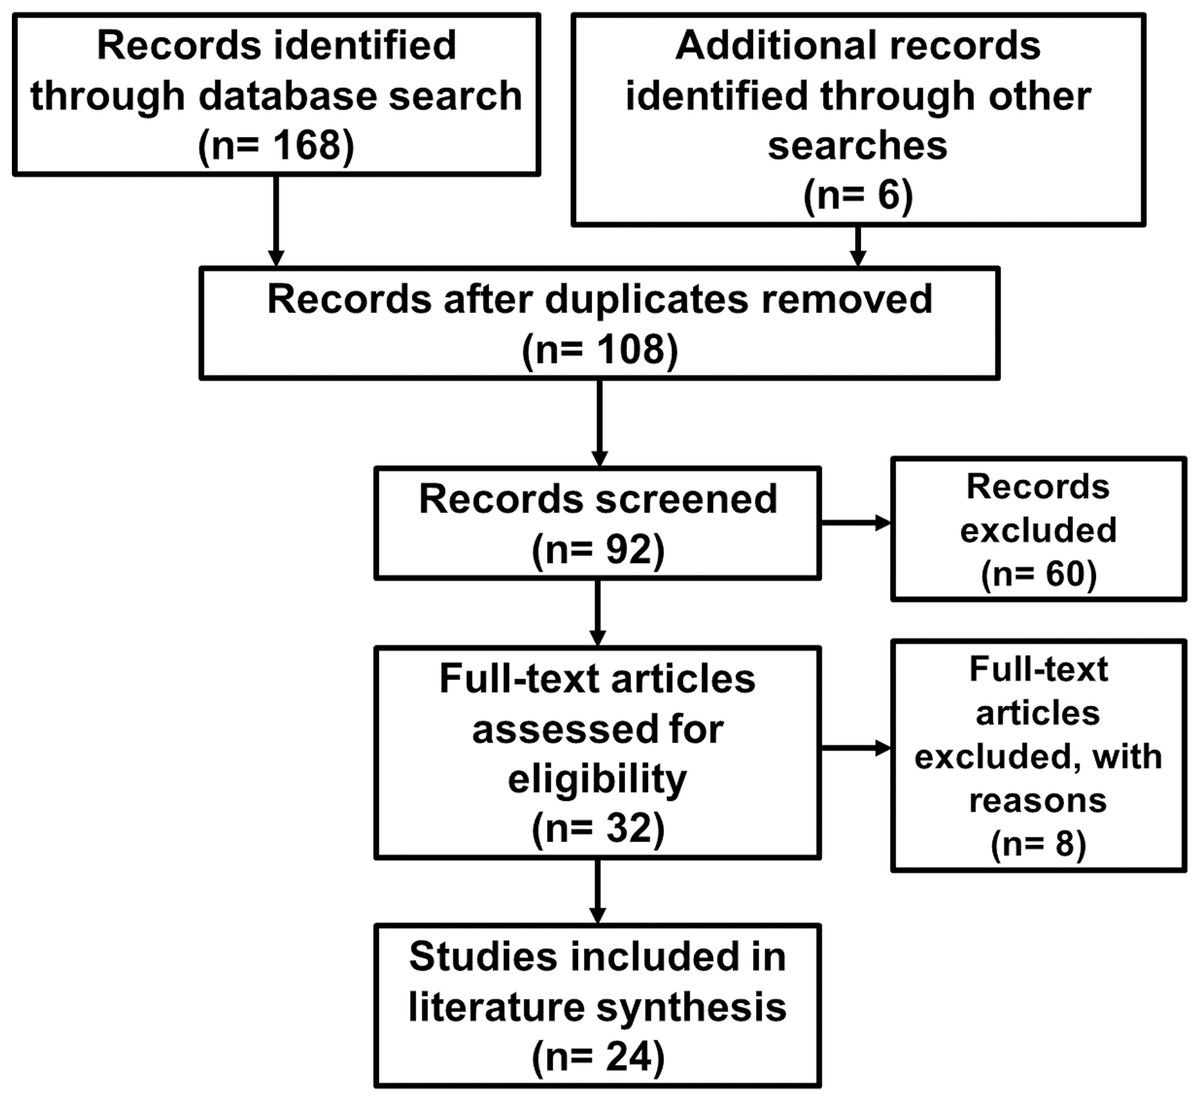
Figure 1: PRISMA flow diagram outlining the literature search and screening process.
The geographic extent of suitability models varied with study focus and stated research goals, ranging from local and regional foci (e.g., county and state-level) to national and global species distributions. Studies were primarily conducted for the United States (46%), often limited to a single state or regional boundary. Other common geographic foci included Africa (29%) and Latin America (21%). The majority of studies (83%) reported the spatial scales of predicted distributions, which varied considerably across studies ranging from fine-scale (1 km) to coarse resolution (50 km) gridded models.
Species occurrence data
The majority of reviewed studies (79%) modeled geographic distributions only for Amblyomma ticks, using vector presence as a proxy for pathogen transmission and disease risk. Amblyomma americanum was featured in 33% of articles, making it the most commonly studied vector, followed by Amblyomma variegatum (29%) and Amblyomma hebraeum (25%). Studies that estimated pathogen distributions, using health department data or wildlife blood samples to determine presence, accounted for 20% of the reviewed literature. Only 8% of studies used both tick occurrence and pathogen presence to model geographic risk of transmission.
A majority of studies (63%) obtained positive records of species occurrence from previously published literature. The time period of sample collections from previously published sources typically ranged from the 1950s through the early 2000s, though one study incorporated historical records dating back to the 1900s. In contrast, 29% of studies primarily obtained georeferenced data points from public databases or entomological collections. While using pre-existing databases of tick records yields higher occurrence frequencies that span greater periods of time, few details are typically provided regarding the nature of sample collections (e.g., active vs passive surveillance, transects vs convenience sampling, etc.). Only 21% of studies collected occurrence records solely through field sampling, with field collections spanning one to 13 years. Few studies (13%) used true absence data collected via field sampling, instead opting to use modeling approaches that take advantage of presence-only datasets.
Environmental data
Environmental predictor datasets used to build SDMs were generally chosen in accordance with the specified geographic extent, scale, and goals of a given study. Many of the data products used for localized studies are only available for a given region or country (e.g., Daymet climate data for North America, USGS National Land Cover Database with coverage for the United States, etc.). Despite the wide range of environmental inputs across studies, the WorldClim dataset of long-term climate averages, and derived bioclimatic variables, were the most commonly utilized source of climatological data, featured as input data in 36% of reviewed articles (Hijmans et al., 2005). Six articles estimated potential shifts in vector ranges driven by future climate change and required modeled climate data at given time horizons, with half of these studies using WorldClim scenarios of future climatic conditions.
Modeling approaches and output
The reviewed literature primarily consisted of studies that used presence-only, correlative modeling approaches. A variety of SDM methods were used to estimate tick distributions, including logistic regression (LR), geographically weighted regression (GWR), ecological niche factor analysis (ENFA), and generalized additive models (GAM) (Table 1). However, the MaxEnt algorithm was the most commonly used method, with 50% of studies using MaxEnt to estimate species distributions. Regression analyses were also frequently included in SDM studies (42%), even when more advanced statistical models were also used.
Environmental factors that were most influential in published SDMs were reported in 80% of reviewed studies. Generally, studies included some measure of temperature, precipitation, soil moisture, or land cover in models of tick distributions. The temporal scale of environmental predictors varied considerably between studies, ranging from daily temperature estimates and monthly ranges to annual and long-term climate averages. Covariates that contributed most prominently to distribution estimates were often reported in the reviewed literature, yet actual values and ranges for environmental predictors were seldom reported. Indicators of seasonality for precipitation (66% of studies) and temperature (50% of studies) were among the most consistent covariates included in final SDMs. Common bioclimatic variables used in final models for tick habitat suitability, regardless of taxon or location, included annual mean temperature, annual mean precipitation, and indicators of seasonality and extremes in temperature and precipitation, such as maximum temperature in the warmest month, minimum temperature in the coldest month, and precipitation in the wettest and driest months. The Normalized Difference Vegetation Index (NDVI), an index derived from remote sensing data to measure green vegetation cover, was used as an environmental predictor in 25% of studies. Despite the prevalence of NDVI in these studies, compared to climate variables there was little consensus regarding the reliability of this predictor in defining vector niches across studies. Only one study incorporated tick host density as an environmental predictor of habitat suitability.
Discussion
Species distribution modeling has become a widely used tool for estimating ranges of organisms, or in the case of pathogens and their vectors, the geographic risk of disease exposure. However, the potential geographic distributions of rickettsial pathogens transmitted by Amblyomma spp. are still relatively understudied, compared to other vector-borne disease systems. In contrast with the 174 candidate publications identified for screening in this literature review, similar search terminology applied to other vector-borne disease systems yielded raw publication counts of 1,126 for Aedes spp. and dengue fever, 728 for Anopheles spp. and malaria, and 366 for Ixodes spp. and Lyme disease. This lag is likely due, in part, to more recent recognition of the presence of these disease transmission systems for the spotted fever rickettsioses and ehrlichiosis tick-borne diseases (Childs & Paddock, 2003).
The studies included in the final list of screened articles predominantly focused on establishing the distribution of the lone star tick (A. americanum) in the United States. The body of work here perhaps reflects this species’ relatively recent implication in the transmission of rickettsial pathogens, in addition to the connection to emerging alpha-gal allergy, given that the majority of this literature was published within the past five years (Levin et al., 2017; Crispell et al., 2019). Nevertheless, lone star ticks have long been included in tick surveillance and outreach programs in the United States, due to their aggressive feeding behavior and previously suspected medical importance. As such, established surveillance protocols and reliable collection records for this species in North America may be more accessible than for other Amblyomma species in other locations, facilitating the production of presence-only models. Other geographic foci identified in this review were driven by the relative interest in, or importance of, vector species: the medically important Cayenne tick (A. cajennense) in Latin America, and bont ticks (A. variegatum and A. hebraeum) in Africa, which are primarily known as important pests of livestock.
Few studies directly estimated the geographic range of the pathogens, either in human hosts or animal reservoirs, and the majority of SDM articles used tick presence as a proxy for potential exposure to the pathogens they transmit. This may be, in part, due to the logistical challenges and constraints of collecting serological data for rickettsial pathogens. Until very recently, reliable diagnostic testing for rickettsial pathogens was not available, and even now access to those tests is not ubiquitous (Parola, Paddock & Raoult, 2005). Detection of cases by point-of-care health practitioners can also be problematic, due to the nonspecific clinical presentation of rickettsial diseases. Despite updates in our taxonomic knowledge of these pathogens, the Centers for Disease Control recently changed case definitions to reflect cross-reactivity in diagnostic tests, and thus, cases of spotted fever group rickettsioses are reported in aggregate (CDC, 2020; Centers for Disease Control and Prevention, 2010). Collecting serological data from wildlife reservoirs presents its own set of challenges, and there are many instances in which the ecology of transmission is poorly understood, and the full range of vertebrate hosts is unknown (Eremeeva & Dasch, 2015). In cases where transmission cycles are known, conducting field surveys to assess seroprevalence in wildlife hosts is often time consuming, labor intensive, and requires specialized expertise. In the context of building SDMs, this can result in datasets that are geographically limited in extent, and may not represent the full range of suitable ecological conditions, driving inaccuracies in resulting models.
Species distribution models call for spatially continuous environmental variables as data inputs for model building, and the availability of appropriate, georeferenced data products varies with region. For example, the Daymet (daymet.ornl.gov) dataset offers freely available, high resolution weather parameters, but is limited to North America. Remotely sensed data, such as land surface temperature and NDVI, can also be used in this capacity, but may require extensive geoprocessing before use; the quality of remote sensing imagery may also vary considerably, depending on study area (Barsi et al., 2019). In contrast, bioclimatic variables derived from WorldClim (WorldClim.org) data offer accessible datasets of long-term climate trends, in a product with interpolated global coverage. The open accessibility of global climate variables, at a variety of spatial resolutions, is perhaps why the use of WorldClim data is so pervasive in the SDM literature, not limited to vector-borne disease studies. Yet, despite the prevalence of WorldClim data products used in the capacity of model building, there are a range of variables selected as top predictors of species presence, even within species found in the same geographic region. Differences in environmental drivers across studies may reflect real biological differences in environmental suitability for ticks, or their host organisms, but may also arise for a number of other reasons, including differences in variable selection methodology and spatial resolution used in the studies (Elith & Graham, 2009; Farashi & Alizadeh-Noughani, 2018). Other factors that perhaps more closely reflect the physical habitat requirements of ticks, such as soil moisture or vegetative land cover, were more commonly included as predictors in studies conducted on finer spatial scales, using regionally available environmental datasets.
A difficulty presents itself when estimating species distributions for ticks based on environmental conditions. Other arthropod vectors, such as mosquitoes, are extremely sensitive to fluctuations in climatic conditions, which in turn dictate the suitability of an area for survival and reproduction. In many instances, the physiological responses and environmental limits of insect vectors are well understood, via both laboratory experiments and empirical field studies (Mordecai et al., 2019; Paaijmans et al., 2013; Reuss et al., 2018). In contrast with insect vectors, ticks are resilient to many of the climatic factors that would limit other species. In other words, broad-scale patterns in temperature and precipitation are not necessarily primary drivers of tick presence on the landscape. This conflicts with many of the studies found in this review, which rely heavily on long-term climatic data layers, such as bioclimatic variables, as the main predictors of tick suitability. Further to this point, reliance on climate data may contribute to the relatively low agreement in niche-defining environmental parameters across the reviewed studies. With the exception of indicators of seasonality, the major climatic and land cover predictors in the literature vary greatly with species and geographic extent. Given the close association between ticks and their vertebrate hosts, this may indicate that it is not the vector’s niche that is being modeled, but rather the niche of the host organisms that support tick populations. Yet, data on host density were included as a variable in just one of the studies reviewed here, likely due to the difficulty of obtaining continuous, coincident, georeferenced datasets on wildlife population densities.
Reaching consensus across SDMs is notoriously problematic, owing largely to the abundance of methodological approaches and lack of standardized reporting practices in presence data and final models (Mordecai et al., 2019; Carlson et al., 2018; Hao et al., 2019; Merow, Smith & Silander, 2013; Rund et al., 2019). We find similar issues when comparing published SDMs for Amblyomma ticks and rickettsial pathogens, where there is considerable diversity in methods and primary findings despite the small number of studies performed. While major environmental predictors are typically reported for SDMs, most studies do not report values or numerical ranges for suitability, making the assessment of these relationships in a biological context difficult. We also expect differences in projected distributions to arise as an artifact of methodology, and for this reason, modeling algorithms and user-specified parameters should be chosen to align with data limitations and study aims. The methods in the literature reviewed here predominantly comprised two methods of estimating species ranges, MaxEnt and spatial regressions. Additional studies that incorporate other commonly implemented modeling algorithms, for example random forests (RF) and boosted regression trees (BRT), may help determine the impact that methodology on predicted distributions for tick-borne diseases.
Geographic risk mapping of pathogens is not limited to species distribution modeling. Other methods of estimating geographic distributions, such as mechanistic and simulation approaches, also exist for estimating the range and expansion of Amblyomma ticks and rickettsial pathogens, often using tick abundance and human case data (Dahlgren et al., 2016; Springer et al., 2014; Parola et al., 2013; Sagurova et al., 2019). Correlative models, such as SDMs, are nevertheless useful in estimating potential species limits, particularly when data for mechanistic or process-driven models are lacking. This is the case for many tick species, where physiological mechanisms and limits are often poorly understood. For Amblyomma spp. only a few articles address the effects of temperature and humidity in a controlled setting (Guglielmone, 1992; Koch, 1983; Yoder, Selim & Needham, 1997; Needham & Teel, 1991; Strey et al., 1996). At extreme temperatures where insect vectors may die, ticks will become quiescent until conditions are more favorable. Thresholds that are known to cause instantaneous tick mortality are prohibitive to life such as −22 °C (Burks et al., 1996). Presence-only modeling approaches, which predominated in the reviewed literature, are also convenient when studying organisms that are difficult to extensively sample throughout their range. These methods are attractive in that they allow us to take advantage of pre-existing collection datasets, seemingly obviating the need for labor and resource intensive field sampling. However, with the exception of studies which explicitly conducted surveys for ticks, the full methods for originally obtaining presence points (e.g., the original collection strategies) are not always clearly defined. Biases introduced via sampling protocol (e.g., convenience sampling, or targeting a single life stage or behavior) may not adequately represent the true realized niche for species, dramatically influencing SDM predictions. In many tick models, data are collected through dragging or flagging which only samples questing ticks that have not found hosts. The number of successful host-seeking ticks is not known and for ticks that are not possible to collect on drags/flags the surveillance method may drastically underrepresent this life stage (Gaff et al., 2020). If the purpose of the model is to measure disease risk, questing data may be appropriate, but for tick control a greater understanding of the species life history would be needed. While these limitations may be logistically unavoidable, we recommend more detailed reporting of sampling methods and their associated limitations in future studies.
Additional field studies and ground-truthing are needed to fully assess the accuracy and predictive power of many current estimated tick distributions, using independently collected data to validate mapped predictions. Further, novel collection efforts that explicitly target nymphal ticks, or ticks that have successfully found hosts, will allow for models that more closely reflect environmental suitability across life stages. Indeed, the general dearth of novel georeferenced occurrence datasets represents a major limitation for the establishment of spatial risk of tick-borne diseases. This is particularly evident when attempting to directly assess the distribution of rickettsial pathogens, rather than relying on tick distributions as a proxy of risk. Future work to identify all components of transmission cycles will also help us create more refined spatial predictions for tick-borne diseases, where data on reservoir hosts could also serve as informative data layers in an SDM framework, or as alternate proxies of pathogen distributions.
Conclusions
Species distribution modeling of Amblyomma ticks and the rickettsial group pathogens they vector is underrepresented in the literature compared to other vector-borne disease systems. Even among a limited number of published studies, there is considerable variation in the methods and reported environmental influences for these models. This scoping literature review highlights a knowledge gap in our understanding of potential geographic risk for this transmission system. Given the recent public health interest in tick-borne diseases, the dearth of studies may result from lags in new data acquisition and limitations in our knowledge of the tick-pathogen ecology involved.