

Abstract
A serial flexible humidity sensor based on graphene oxide (GO) fiber and quartz crystal resonator (QCR) was proposed. The serial sensing structure was formed by electrically connecting the QCR with GO fiber embedded in textile in series. This structure became more adjustable by separating the transducing part and sensing part. The feasibility of the serial sensing structure was verified by simulation and experiment. Fabrication of GO fiber was introduced and the electrical properties of GO fiber responding to the relative humidity were measured. The QCR was excited at a frequency of 5.003 MHz. The total frequency shift of the sensor was 91 Hz from 10%RH to 90%RH with a hysteresis of 6.58%. The sensitivity was 2.98 Hz/%RH at 80%RH. The response time was 130 s and the recovery time was 36 s from 20%RH to 80%RH. The sensor has good stability with about 1% variation. This serial sensing structure has the potential to realize a humidity sensor with higher performance.
Export citation and abstract BibTeX RIS
1. Introduction
Humidity is one of the most frequently measured physical quantities. Humidity sensing is widely used in various areas including agriculture, medicine, meteorology and precision manufacturing. Increasing requirements for high sensitivity, accuracy, fast response, stability, flexibility and wireless have facilitated the development of humidity sensors [1–3]. Sensing materials and transducing devices are two major parts of humidity sensors. The sensing materials absorb water molecules and greatly determine the performance of the humidity sensors. Many materials were investigated including metallic oxide (such as Al2O3 [4], ZnO [5] and SnO2 [6]), polymers (such as polymethyl methacrylate (PMMA) [7] and polyaniline (PANI) [8]) and 2D materials (such as MoS2 [9], WS2 [10] and graphene-based materials [11]). Among these materials, graphene oxide (GO) is popular because of its large surface to volume ratio and large amount of hydrophilic functional groups including hydroxyl, epoxy and carboxyl [12]. Besides, the electrical property of GO is tunable and highly affected by water adsorptions and the honeycomb lattice arrangement of carbon atoms of GO benefits its stability [13, 14]. Thus, GO is very suitable in humidity sensing applications due to its high mass effect and electrical property effect of humidity. Generally, GO is prepared as a thin film and coated on the surface of the device to become a humidity sensor [15]. GO fiber, as another formation type, has attracted wide interest as a new material platform [16]. Compared with GO thin film, the GO fiber has higher mechanical strength, flexibility and environmental stability, while maintaining excellent properties of humidity sensing.
Humidity sensors based on different principles including resistive [17–19], capacitive [4, 7, 20], optical [21], piezoresistive [22] and piezoelectric resonant [23–25] were investigated. The resistive and capacitive types were collectively called impedance type. Among them, impedance type and piezoelectric resonant type sensors are used more frequently for their unique advantages. Impedance type humidity sensors are commonly based on an interdigital electrode (IDE) coated with sensing material film. This simple structure benefits batch fabrication, cost efficiency and flexibility realization. Meanwhile, piezoelectric resonant type humidity sensors detect humidity according to frequency shift, and are based on piezoelectric resonators such as quartz crystal microbalance (QCM), surface acoustic wave (SAW) and microcantilever. The compact structure and the digital signal output bring advantages of high sensitivity, high resolution, small size, low power consumption and wireless applications. However, both impedance and piezoelectric resonant types have some limitations. Impedance type humidity sensors are subject to low sensitivity, low resolution and difficulty for a system to handle analog signal. As for the piezoelectric resonant type humidity sensors, the size of the sensing material film is limited by the area of the device. When the resonator gets smaller for higher performance, the sensing area also becomes smaller, bringing the difficulty of coating sensing material film and weakening of target analyte adsorption. Besides, the coating process is complex, hard to control and unrepeatable. Moreover, corrosion would happen between the resonator and sensing film or high humidity atmosphere when the sensor is exposed in the environment to be detected, which would shorten the sensor's lifespan and reduce its stability.
A serial sensing structure is employed to solve the problems mentioned above, typically for the following two limitations: (a) the film-coating process is difficult when the resonator is small or the substrate is hydrophobic or hollow; and (b) the resonator is difficult to reuse after film-coating and degenerates fast when exposed in an environment with high humidity. The serial sensing structure is formed by electrically connecting the sensing material and piezoelectric resonator in series. In this way, the problems can be addressed. Yao et al proposed a serial structure to detect solution conductivity by connecting a piezoelectric quartz crystal and the solution to be detected in series [26]. A similar structure was used as a biochemical sensor by connecting a piezoelectric quartz crystal and an IDE coated with sensing film in series [27–29]. Lei et al proposed a humidity sensor based on a SAW resonator in a serial sensing structure [30]. The sensor was operated at a high frequency of 433 MHz, so the parasitic impedance was high and the circuit system was complex. However, none of these sensors was flexible.
The advantages of both impedance type and piezoelectric resonant type sensors are combined in the serial sensing structure. Compared to the traditional impedance type sensors, the serial sensing structure changes the output signal from impedance to frequency, which is helpful to simplify the detecting system and enhance the sensor's sensitivity, resolution and feasibility to wireless applications. By separating the sensing part and transducing part, the serial sensing structure brings some advantages over the traditional film-coated piezoelectric resonant type sensors. First, the thin-film coating process is replaced by an electrical connection, which reduces cost and makes batch fabrication possible. Second, the resonator can be encapsulated to prevent corrosion and disturbance, achieving a longer lifespan and higher stability. Third, by designing the device and sensing material separately, the serial sensing structure provides an opportunity to enhance a set of favorable characteristics such as low temperature coefficient of frequency, fast response and high linearity at the same time. For example, as shown in figure 1, the film-coated sensor is rigid and hard to apply on a curved surface such as human skin, but for the serial sensor, the flexible sensing material can be placed on the curved surface, while the rigid resonator is put aside. The serial sensing structure is more adjustable than the film-coated sensing structure.

Figure 1. Comparison between film-coated structure and serial sensing structure.
Download figure:
Standard image High-resolution imageIn this paper, GO fiber is used as a humidity sensing material and is connected to a QCR in series to form a serial flexible humidity sensor. The model of the serial sensing structure is built and verified. Fabrication of GO fiber is introduced and the electric properties of GO fiber at different humidity are measured. The sensitivity, hysteresis, stability, response and recovery time of the sensor are investigated.
2. Model and simulation
The proposed design of the serial flexible sensor is shown in figure 2. In the structure, the GO fiber is embedded in a textile substrate and electrically connected to a QCR in series. The sensor has high flexibility because the size of the rigid resonator is smaller than the flexible textile and the resonator is put aside.
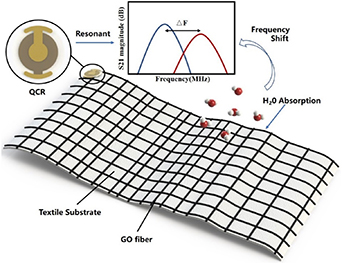
Figure 2. Schematic of the serial flexible sensor.
Download figure:
Standard image High-resolution imageThe structure of this serial sensor can be described as an equivalent circuit, as shown in figure 3(a). The left part is the equivalent circuit (BVD model [31]) of the piezoelectric resonator, where C0 is the static capacitance and Cm, Lm, and Rm are the motional capacitance, inductance and resistance, respectively. The right part is the equivalent circuit of GO fiber, where Re and Ce are the parallel resistance and parallel capacitance of GO fiber respectively.
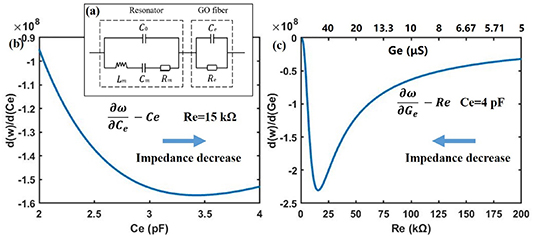
Figure 3. (a) Equivalent circuit of the serial sensor including a piezoelectric resonator and GO fiber. (b) Sensitivity varied with Ce when Re = 15 kΩ. (c) Sensitivity varied with Re when Ce = 4 pF.
Download figure:
Standard image High-resolution imageThe sensing principle of the serial sensor can be analyzed quantitatively. When humidity increases, the electrical properties of the GO fiber change after adsorbing water vapor. Therefore, Ce and Re change and lead to a shift of resonant frequency of the system. In this model, the complex impedance Z expressed by resistance R and reactance X is
Because Rm is neglectable, with  , we get R and X
Note  , where
  is the phase angle of the external circuit. When oscillation occurs, we have

With the fundamental frequency of the resonator  , we obtain
Using the first order Taylor series, we can solve this complex function and get the resonant frequency 
Commonly we use a circuit that Y = 0, so
The influence of Ce and Ge can be calculated as
The above equations show the relationship between the output frequency and electrical parameters. Because the resonator is encapsulated to avoid being affected by humidity, the four parameters C0, Cm, Lm and Rm remain unchanged and the frequency shift is affected only by Ce and Ge.  and
and  represent the sensitivity and can be calculated by equations (7) and (8). Figures 3(b) and (c)show how Ce and Re affect the sensitivity respectively when other parameters are set constant as explained in the next paragraph. The absolute value of the sensitivity first increases then decreases when the impedance decreases. Thus, optimizations of the Ce and Ge can improve sensitivity.
A QCR was used as the transducer, as shown in figure 4(a). The radius of the QCR and its top electrode is 7.5 mm and 4.35 mm, respectively, and the thickness of the quartz crystal is 0.33 mm. The forward transmission scatter parameter (S21) curve of the QCR was measured by a network analyzer and a 5.003 MHz resonant frequency was observed. As shown in figure 4(b), the S21 curve was fitted with the BVD model by the least square method, and C0, Cm, Lm and Rm of the QCR were obtained. The performance of the serial sensing structure was studied by simulation in COMSOL software. The QCR in the simulation was simplified as a cylinder of quartz crystal with 4.35 mm in radius and 0.33 mm in height. Figure 5(a) shows the simulation result of the displacement of the QCR at the resonant frequency. The frequency domain analyses of QCR in series with Ce and Re of the set values were carried out and the response curves of displacement were shown in figures 5(b) and (c). Every response curve has two peaks which represent parallel resonant and serial resonant respectively. The shifts of curves verified the feasibility of the serial sensing structure.

Figure 4. (a) Schematics of QCR. (b) Testing and fitting S21 curves of the resonator in 5.003 MHz resonant frequency.
Download figure:
Standard image High-resolution image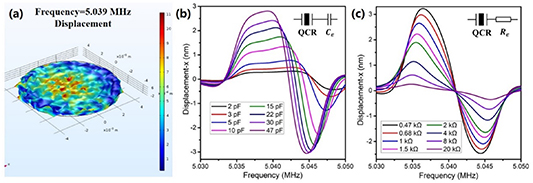
Figure 5. (a) Displacement graph of QCR simulated in COMSOL. (b) Displacement curve of QCR in series to Ce simulated in COMSOL. (c) Displacement curve of QCR in series to Re simulated in COMSOL.
Download figure:
Standard image High-resolution image3. Experiments
3.1. Fabrication of GO fiber
The GO fiber was used as the humidity sensing material in the proposed humidity sensor. Compared to the GO thin film, the GO fiber is easier to combine with the textile substrate as a flexible device without downgrading performance. The GO fiber was fabricated by the method introduced in the previous work [32]. The fabrication process started with giant graphene oxide (GGO) sheet preparation. First, a mixture of natural graphite flakes, 98% sulfuric acid and fuming nitric acid was stirred at room temperature for 24 h. Then, the mixture was dissolved in water and filtrated to collect the solid. After washing, drying and thermally expanding the solid, expanded graphite (EG) was obtained. Second, a mixture of EG powder, sulfuric acid, K2S2O8 and P2O5 was successively treated through heating, diluting, vacuum-filtering, washing and drying process to get preoxidized EG. Third, the preoxidized EG was added into concentrated H2SO4, and then KMnO4 was slowly added under continuous stirring. The mixture was subsequently heated, diluted and treated by H2O2. Finally, the mixture was undisturbed for 2 d and the clear supernatant was decanted. After repeatedly washing the precipitate with water, HCl solution and water successively, and gentle stirring, we obtained GGO aqueous dispersions.
The GGO fibers were prepared by a wet-spinning process. As shown in figure 6, the GGO dispersions were formed as liquid crystal (LC) spinning dopes and injected into the rotating coagulation baths, which were ethanol/water (1:3 v/v) solutions of 5 wt% KOH, 1 wt% CaCl2, 5 wt% CaCl2 and 5 wt% CuSO4. After 30 min immersion, the GGO spinning dopes were coagulated as GGO gel fibers. Then, the fibers were washed by water and collected onto the bracket. Both mechanical and electrical properties of GO fibers can be changed by adjusting the location of the nozzle and the degree of chemical reduction.

Figure 6. (a) Schematic apparatus for spinning GGO fibers. (b) A long GGO fiber wound on a reel.
Download figure:
Standard image High-resolution imageGO fibers with diameters of 20, 30 and 50  were fabricated and tested, as shown in figure 7(a). The diameter of each type of GO fiber was measured at 12 points and shown in figure 7(b). The results of fibers 1 and 2 deviated from the set values. Thus, the GO fiber with diameter of 50
  was used for testing because of its good uniformity. Besides, the impedance of a single 5 mm GO fiber was more than 6 MΩ in our test. To get better electrical and mechanical properties, a robust GO fiber was obtained by twisting several GO fibers. Figure 7(c) shows a robust GO fiber twisted from 100 GO fibers used in this work.

Figure 7. (a) Optical microscope images of the three types of GO fiber. (b) Diameter of 12 points of GO fiber of three types respectively. (c) Photo of the robust GO fiber.
Download figure:
Standard image High-resolution image3.2. Electrical properties of GO fiber
Previous works [33] reported the mechanism of humidity effect on the electrical properties of GO film. Similarly, the GO fiber has a multilayered structure because of the stack of GO sheets. When humidity increases, GO fiber adsorbs water vapor and the water molecules go into gaps between the GO sheets, resulting in enhancement of conductivity and dielectric constant. Therefore, Ge and Ce increase as humidity increases.
Electrical properties of the GO fiber responding to humidity were measured to find out whether the GO fiber has the same mechanism of humidity effect as the GO film. The experimental setup consisted of a humidity calibration system and an LCR meter for electrical property measurement, as shown in figure 8. Alternating current (AC) complex impedance spectroscopy of GO fiber was measured in different humidity levels.
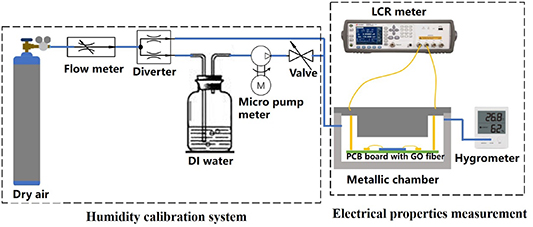
Figure 8. Experiment setup of humidity calibration system and electrical property measurement.
Download figure:
Standard image High-resolution imageGO fiber was fixed on a PCB board by a flexible electrode. Then, the board with GO fiber was fixed in a sealed metallic chamber. By adjusting the tunable valve to control the flow rates of the wet and dry air, the relative humidity in the chamber can be manually regulated from 5%RH to 95%RH. A commercial hygrometer was used for reference. AC impedance was measured by an LCR meter. All the experiments were carried out under a room temperature of 24 °C.
To further improve the electrical properties, the flexible electrode was cut as IDE and embedded with the GO fiber on the textile substrate, as shown in figure 9(a). A 5 mm GO fiber and an IDE with GO fiber were tested respectively. Figure 9(b) shows their impedance responding to humidity at 2 MHz. The impedance reduced when relative humidity increased, the impedance value of the 5 mm GO fiber ranged from 200 kΩ to 1100 kΩ, while that of the GO fiber in IDE ranged from 12 kΩ to 35 kΩ. According to the serial sensing model discussed in section 2, in the high range of impedance, smaller impedance causes higher sensitivity. Thus, the GO fiber in IDE is more suitable for use.
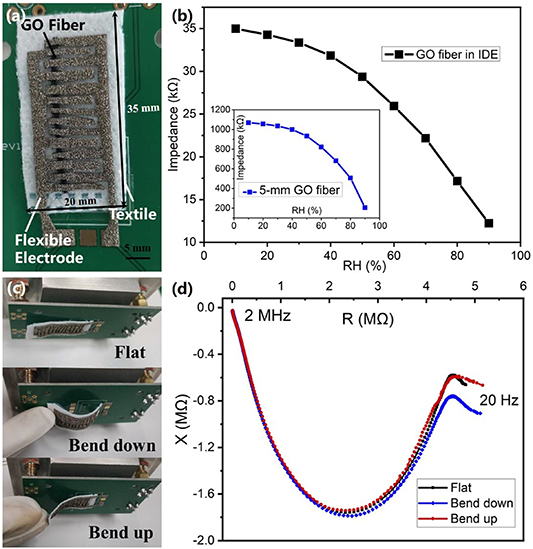
Figure 9. (a) Photo of GO fiber in IDE. (b) Impedance responded to the humidity of 5 mm GO fiber and GO fiber in IDE. (c) Flexibility of GO fiber in IDE. (d) AC complex impedance spectroscopies of GO fiber in different bend conditions.
Download figure:
Standard image High-resolution imageThe GO fiber has high flexibility and can be freely bent up and down, as shown in figure 9(c). The AC complex impedance spectroscopies (Nyquist plot of impedance) in three bending conditions were measured from 20 Hz to 2 MHz at a room temperature of 24 °C and humidity of 65%RH, as shown in figure 9(d). Compared with the curve of the flat condition, the deviation of bending down is larger than that of bending up. But the deviations reduce and the three curves are closer at a higher frequency. In the proposed serial sensing structure, the QCR works at a high frequency (5.003 MHz), so the deviation at a low frequency can be ignored.
3.3. Experiment setup for calibration of the humidity sensor
The proposed serial flexible humidity sensor consists of a GO fiber in IDE as the humidity sensing part and a QCR. The frequency shift of the humidity sensor was measured with the S21 curve. As shown in figure 10, the experiment setup used the same humidity calibration system as the measurement of GO fiber. The GO fiber in IDE was placed on a PCB board and the board was fixed in the sealed metallic chamber. The QCR was placed on another board and kept static outside the chamber to avoid interference. A network analyzer was used to measure the S21 curve of the sensor and a LABVIEW program was used to record the resonant frequency in real time.

Figure 10. Experiment setup for calibration of the humidity sensor.
Download figure:
Standard image High-resolution image4. Result and discussion
4.1. Sensitivity
The resonant frequency shift of the humidity sensor was measured three times and averaged when the relative humidity changed from 10%RH to 90%RH and back to 10%RH with an interval of 10%RH at room temperature of 24 °C. The output frequency decreased as relative humidity increased. Figure 11 shows the sensitivity and the hysteresis of the sensor. The sensitivity of the sensor was obtained by exponential fitting and the absolute value of that was 2.98 Hz/%RH at 80%RH. The sensitivity got larger while the humidity increased because the GO fiber dissociated more free ions at high relative humidity and cause a larger impedance change. The total frequency shift ΔF from 10%RH to 90%RH was 91 Hz. Besides, the hysteresis can be expressed by Hys = Δfmax/ΔF, where Δfmax is the maximum value of frequency deviation between adsorption and desorption process at the same relative humidity. The value of hysteresis was 6.58%. The total relative sensitivity of this work was 91 Hz/5 MHz = 18.2 ppm, which was larger than the data of 5 kHz/433 MHz = 11.5 ppm reported by another humidity sensor in serial structure[30].

Figure 11. Sensitivity and hysteresis of the proposed serial flexible humidity sensor.
Download figure:
Standard image High-resolution image4.2. Short term repeatability, response and recovery time
The repeatability of the proposed sensor was investigated by cyclically changing the humidity between 20%RH and 80%RH while the temperature was maintained at 24 °C. The resonant frequency was recorded by a LABVIEW program with the network analyzer and the sampling interval was 1 s. The response and recovery times are defined as the time interval when the frequency shift reaches 90% of the total frequency shift value. The average responding time is 130 s from 20%RH to 80%RH, while the average recovery time is 36 s, as shown in figure 12. The recovery time was shorter than the responding time, because the water vapor faced more obstruction to permeate into the interior of GO fiber in the adsorption process than dissociate in the desorption process. Besides, the variation of the sensor output, which represented the noise degree of the sensor, can be expressed as Var = fRMSD/ΔF× 100%, where fRMSD is the root-mean-square deviation (RMSD) of the recorded frequency. Obtained from the stable part after the responding and recovery process finishing of the curve in figure 12, the variations were 1.002% and 1.016% at 20%RH and 80%RH, respectively. The intrinsic noise was caused by the non-uniform dimension of GO fiber and the external noise coming from the airflow in the experiment setup, which can be reduced by improving the fabrication process of the GO fiber and optimizing the experiment setup.

Figure 12. Response time of the proposed serial flexible humidity sensor.
Download figure:
Standard image High-resolution image4.3. Stability
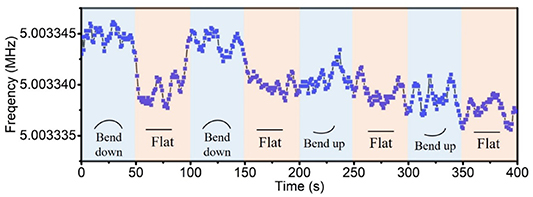
The stability of the sensor in bending conditions was measured. As shown in figure 13, the sensor was bent down and bent up twice under room temperature of 24 °C and humidity of 65%RH. Compared with the average frequency value in flat condition, a 5.2 Hz deviation occurred in the bending down condition, while the deviation in the bending up condition was 0.9 Hz. The main reason for the larger deviation in the bending down condition than the bending up condition was the air gap between the GO fiber and the textile substrate, which was more likely to be generated in the bending down condition than in the flat or bending up condition. The air gap changed the resistance and capacitance of the interface of the GO fiber and textile substrate, resulting in a larger deviation of the output. The deviation can be reduced by improving the embedded method of GO fiber into the textile substrate. Besides, the variations were 1.011%, 1.604%, 1.198% in the bending down, bending up and flat conditions respectively. The noise consisted of intrinsic noise of material and external noise from the manual operation of bending. The variations were similar to that in section 4.2; thus, the noise degree of the sensor was about 1%.
Figure 13. Response of the proposed serial flexible humidity sensor in bending conditions.
Download figure:
Standard image High-resolution image
5. Conclusion
In summary, we had employed GO fiber as a humidity sensing material and proposed a serial and flexible humidity sensor. Electrical properties of GO fiber responding to humidity were measured. A QCR was added in series with GO fiber embedded in textile as a flexible humidity sensor. The humidity sensor has high flexibility, good repeatability and stability. This serial sensing structure combined resonator and GO fiber, which traditional film-coated structure cannot realize. The sensor combined advantages including flexibility of GO fiber and high solution, accuracy and compatibility of the resonator. This sensing structure has the potential to employ novel sensing material in different assembly types and enhance characteristics of the sensor by designing the sensing part and transducer part respectively. The simplicity and controllability of the serial sensing structure allow it to be employed in variable fields not limited to humidity, such as gas detection and biological detection.
Acknowledgments
This work is supported by the National Natural Science Foundation of China (Grant No. 51875521), the Zhejiang Provincial Natural Science Foundation of China (Grant No. LZ19E050002), and the Science Fund for Creative Research Groups of National Natural Science Foundation of China (Grant No. 51821093).