the Creative Commons Attribution 4.0 License.
the Creative Commons Attribution 4.0 License.
 | 16 Feb 2021
A new view on the risk of typhoon occurrence in the western North Pacific
Gregor C. Leckebusch
To study high-impact tropical cyclones (TCs) is of crucial importance due to their extraordinary destructive potential that leads to major losses in many coastal areas in the western North Pacific (WNP). Nevertheless, because of the rarity of high-impact TCs, it is difficult to construct a robust hazard assessment based on the historical best track records. This paper aims to address this issue by introducing a computationally simple and efficient approach to build a physically consistent high-impact TC event set with non-realised TC events in the THORPEX Interactive Grand Global Ensemble (TIGGE) archive. This event set contains more than 10 000 years of TC events. The temporal and spatial characteristics of the new event set are consistent with the historical TC climatology in the WNP. It is shown that this TC event set contains ∼100 and ∼77 times more very severe typhoons and violent typhoons than the historical records, respectively. Furthermore, this approach can be used to improve the return-period estimation of TC-associated extreme wind. Consequently, a robust extreme TC hazard assessment, reflective of the current long-term climate variability phase, can be achieved using this approach.


The increasing frequency and intensity of extreme meteorological events in recent decades (IPCC, 2012) and the increasing human population and assets located in risk-prone regions (Desai et al., 2015) lead to an increase in risk to humans and economic loss potentials from natural hazards, e.g. tropical cyclones, with potentially disastrous consequences. For example, in the period between 1 January and 18 October 2018, total typhoon-related direct economic losses in China is evaluated to exceed RMB 67 billion (roughly EUR 8.3 billion) (China Meteorological Administration, CMA, 2018). While natural hazards have an impact on all society stakeholders, governments are crucial in disaster risk reduction (DRR) because of their ability to implement necessary DRR-related policy and to allocate resources to appropriate parties (Shi, 2012). Governments have various options for DRR investments, for example, post-disaster relief and risk financing. Using cost-benefit analysis for a case study of typhoon disasters in China, Ye et al. (2016) showed insurance premium subsidies have the highest benefit-cost ratio. This is because premium subsidies increase the penetration rate of an insurance programme, i.e. more protection is offered by the private sector and the risk is transferred to the private sector (Glauber, 2004). Thus, the development and application of effective financial instruments for risk transfer is important.
Other than classical (re-)insurance solutions, parametric insurance solutions have been developed for test cases in areas of corn yield (Sun et al., 2014) and livestock (Ye et al., 2017) for South East Asia and China in recent years. Swiss Reinsurance Company Ltd. (Swiss Re) insured several municipal governments in Guangdong Province, China, through a parametric insurance solution (Lemcke, 2017). Parametric insurance requires no physical damage assessment after an event. As soon as a certain threshold (i.e. trigger point) is exceeded, the insured party receives the agreed compensation from the insurer. Thus it has low administrative cost and quick disbursement. However, it is a challenge to determine a robust trigger point. It is because it would require a reliable typhoon hazard assessment for the region of interest. A current common approach is to generate a large typhoon event set (e.g. equivalent to 7000 years of real-world data) based on historical track data using a stochastic approach (e.g. Vickery et al., 2000; Emanuel, 2006; Emanuel et al., 2006; Rumpf et al., 2007, 2009; Lee et al., 2018; Jing and Lin, 2020). There are two potential downsides with the stochastic approach: (i) such a typhoon event set would be biased toward the past events, and the frequency–intensity distribution of the event set might not be the same as the underlying frequency–intensity distribution, and (ii) the storms in the typhoon event set which are created by the stochastic approach are not necessarily physically consistent. As just surface footprints are stochastically modelled from existing tracks, there is no check whether those stochastically modelled events are physically possible and how they could be realised in a fully dynamical consistent view, i.e. fulfilling all known physical relations and derived constraints by the means of physical laws. Consequently, the amount of unrealistic physical properties due to the oversimplified stochastic simulation is unknown, and laws of physical interactions are potentially ignored. As a result, the trigger point derived from the common approach may not be optimal. This means insurees could be either over- or under-compensated by the insurer.
A method to increase the number of extreme weather events is to make use of an ensemble prediction system (EPS). Osinski et al. (2016) used the European Centre for Medium-range Weather Forecasts (ECMWF) EPS to build an event set of European windstorms. Osinski et al. (2016) pointed out there are two types of storm events produced by an EPS: (i) modified EPS storm (MEPS) and (ii) pure EPS storm (PEPS). MEPSs are storms with modifications in the EPS which have a real-world counterpart. PEPSs are storms in the EPS which have no real-world counterpart, i.e. unrealised. PEPSs are independent events, and the number of PEPSs increases as the lead time increases until the model has no memory of the initial conditions. Thus one can form an event set of extreme weather events by using TC-related PEPSs. Osinski et al. (2016) demonstrated that reliable statistics of storms under the observed climate conditions can be produced based on EPS forecasts.
Building upon the results of Osinski et al. (2016), a new approach to construct a large data volume and physically consistent TC event set is presented in this study. This event set is constructed by applying an impact-oriented windstorm tracking algorithm (WiTRACK; e.g. Leckebusch et al., 2008) to a multi-model global operational ensemble forecast data archive, the THORPEX Interactive Grand Global Ensemble (TIGGE) (Bougeault et al., 2010; Swinbank et al., 2015). The data volume of TIGGE is about 40 000 to 50 000 years. The event set consists of all non-realised TC events which were forecasted by the EPS of different centres; this event set is referred to as the TIGGE PEPS (TPEPS) event set. In this study, we show the TPEPS event set has a much higher information content: more TC events and more extremely high-impact TC events than historical- or reanalysis-based TC event sets. The TPEPS event set can be used to produce a robust TC hazard assessment and to determine a robust trigger point for parametric typhoon insurance.
In this paper, we first present a computationally simple, inexpensive, and efficient method to construct a physically consistent, high-information-content TC event set using only the 6-hourly surface wind speed field of EPS forecast model outputs. Then we analyse the characteristics of the TPEPS event set. Validation of the new method is done by comparing it with the event set which is constructed using reanalysis data. The added values of this new approach are also discussed and presented. The paper is organised as follows. Data sets which are used in this study are described in Sect. 2. Section 3 outlined the method that has been used to construct the TPEPS event set. Results and discussions including validation and the investigation of the characteristics of the TPEPS event set are presented in Sect. 4. A summary and conclusions can be found in Sect. 5.
The 6-hourly instantaneous 10 m wind speed data in different data archives mentioned below are used in this study because they is highly related to TC wind damage. The domain of this study covers the western North Pacific (WNP), East and South East Asia, spanning from 0 to 70∘ N and 90 to 180∘ E. The Japanese 55-year Reanalysis (JRA-55) (Kobayashi et al., 2015) from 1979 until 2017 (resolution of ) is used for the validation of the TPEPS event set. JRA-55 (1979–2014) is also used in parameter selection in the TC identification algorithm and the construction of the logistic regression classifier (LRC) (Sect. 3.2.2), and the data in 2015–2017 are used for the validation of the LRC. ERA-Interim (ERA-I) (Dee et al., 2011) is also used in the construction of the LRC.
Table 1Information of selected data sources from TIGGE archive.
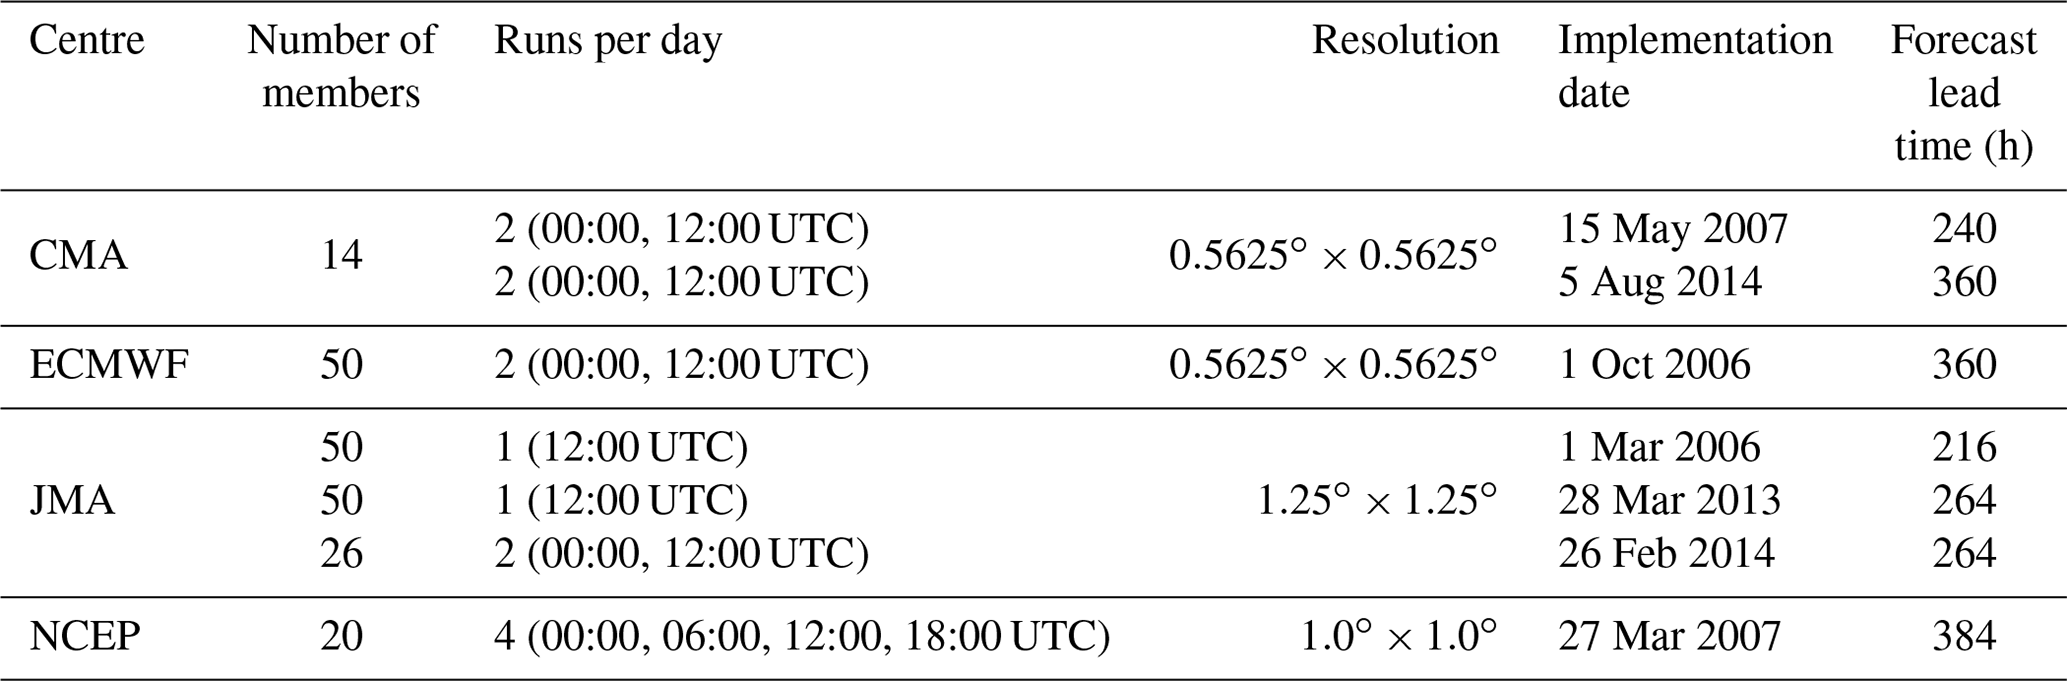
The TIGGE data archive (Bougeault et al., 2010; Swinbank et al., 2015) is used in the construction of the PEPS TC event set. The TIGGE data archive has been used extensively in the study of TC activity forecast (e.g. Vitart et al., 2012; Belanger et al., 2012; Halperin et al., 2013; Majumdar and Torn, 2014; Leonardo and Colle, 2017; Luitel et al., 2018). The TIGGE data archive consists of ∼8–15 d ensemble forecast data from 10 numerical weather prediction (NWP) centres with about 11–50 members each. In this study, only perturbed forecast outputs of the EPS from selected centres are used, and they are the CMA, ECMWF, Japan Meteorological Agency (JMA), and National Centers for Environmental Prediction (NCEP) (cf. Table 1). These four data sets are chosen because they are the state-of-the-art NWP models which are used by four leading synoptic weather forecast centres, and they are the most complete data sets in the archive for the study period 2008–2017. Model configurations and model updates are documented online at https://confluence.ecmwf.int/display/TIGGE/Models (last access: 19 August 2019). ECMWF EPS is a variable resolution EPS, i.e. days 1–10 were run at a higher resolution than days 11–15. For computational efficiency, ECMWF EPS outputs are regridded onto a lower-resolution grid of . The resolution of the selected data sets ranges from to . The forecast lead time of each forecast outputs ranges from 216 to 384 h. Only forecast outputs, which are initialised during the main typhoon season, i.e. 15 May–30 November, are considered. The resultant TPEPS TC event set has data equivalent to more than 10 000 years of TC model data of the current climate state.
Many studies have evaluated the performance of these EPSs in forecasting TC activities in various ocean basins. In general, EPSs underestimate TC intensity especially for coarse resolution models (Hamill et al., 2010; Magnusson et al., 2014). TC track and genesis forecast errors exist in EPSs, and these errors increase as lead time increases (Buckingham et al., 2010; Yamaguchi et al., 2015; Zhang et al., 2015; Xu et al., 2016). While ECMWF EPS forecasts would occasionally have abnormal TC track forecast errors (i.e. track forecast error that is extremely large) and might struggle with developing a warm core in the short-range forecast (Majumdar and Torn, 2014; Xu et al., 2016), ECMWF EPS appears to have better performance in TC track forecasts than other EPSs (Yamaguchi et al., 2015; Zhang et al., 2015; Xu et al., 2016). Yet, a full assessment of the respective skill in models is not in the scope of this study. For the dedicated purpose of this study, an examination for biases in the underlying climatological features as provided by a time- and ensemble-aggregated view of the data set is presented in Sect. 4.1.
The International Best Track Archive for Climate Stewardship (IBTrACS) v03r10 (Knapp et al., 2010) is used for validation and identification of TC events in reanalysis and the TIGGE data archive. It contains all of the available best track records from different centres around the globe up to the year 2017. Since only part of the best track records of the year 2017 are archived in this version of IBTrACS, best track data from the Joint Typhoon Warning Center (JTWC) are used for the year 2017.
3.1 Identification and characterisation of TC-related windstorms
For identification and characterisation of TC-related windstorms, an impact-oriented tracking algorithm is used: WiTRACK (Leckebusch et al., 2008; Kruschke, 2015). Befort et al. (2020) adapted the algorithm to TCs and showed WiTRACK is very capable of identifying high-impact TC events in the WNP using coarse resolution reanalysis product with comparable quality to more data-intensive algorithms. A brief description of the general procedure to track a windstorm using WiTRACK is as follows: (i) clusters with wind speed above the local threshold are identified for each of the 6-hourly time steps of the input data set, (ii) clusters with a size smaller than a predefined threshold (minarea) are excluded, (iii) clusters identified in each 6-hourly time step are connected to a track using a nearest-neighbour criterion with consideration of the size of the cluster, and (iv) events with a lifetime less than eight 6-hourly time steps are removed. A majority of the settings of WiTRACK are identical to Befort et al. (2020), including the use of local 98th percentile wind speed as local wind threshold, except in this study minarea is chosen to be 15 000 km2. The 98th percentile wind speed is chosen because over 90 % of loss events with losses above RMB 3000 million can be identified by WiTRACK, as demonstrated by Befort et al. (2020). The value for minarea is chosen based on a series of sensitivity studies for parameter selection. The output of WiTRACK contains information about the characteristics of all identified windstorm events, including size of the windstorm at any given 6-hourly time step, the overall footprint of extreme wind associated with the windstorm events, and storm severity index (SSI; Leckebusch et al., 2008). This information is used in the identification of TC-related pure EPS windstorm events (Sect. 3.2). As discussed in Sect. 2, TC intensity is generally underestimated by EPSs, and model resolution is known to be a limiting factor (Bengtsson et al., 2007; Hamill et al., 2010; Magnusson et al., 2014). One of the advantages of using WiTRACK is that it does not use raw wind speeds; instead, it uses the 98th percentile relative exceedance for tracking. This means that even if the simulation wind speed of TC is systematically weaker than historical observations, the 98th percentile climatological wind in the models should also be lower than the observed 98th percentile climatological wind. A TC will still be tracked by WiTRACK as long as a 98th percentile exceedance wind cluster exists. Consequently, a bias due to resolution does not have a significant impact on WiTRACK as the tracking algorithm serves as a bias correction in this sense (detailed discussion on the impact of weaker wind speed in model outputs on WiTRACK can be found in Osinski et al., 2016). Furthermore, it can be shown that, within the study area, the 98th percentile relative exceedance of the four models which we used to construct the TPEPS TC event set has similar behaviour (i.e. similar to Fig. 2 of Osinski et al., 2016). Consequently, individual PEPS TC event sets can be combined to form a large PEPS TC event set, i.e. TPEPS TC event set.
3.2 Identifying TC-related pure EPS windstorm events
WiTRACK identifies windstorm events of all kinds, including MEPS TCs, PEPS TCs, MEPS extratropical cyclones, and PEPS extratropical cyclones. Therefore, additional requirements are needed to identify typhoon-related PEPS TC events. Four post-processing procedures are used: (i) geographic filter (GF), (ii) logistic regression classifier (LRC), (iii) MEPS TC identifier (MTI), and (iv) detection at initialisation filter (DIF).
3.2.1 Geographic filter (GF)
GF was first introduced by Befort et al. (2020). It aims to remove non-TC-related windstorms, e.g. extratropical cyclones, cold surge outbreaks during the winter monsoon, and equatorial disturbances, from the event set by excluding windstorm events which are solely identified north of 26∘ N and east of 100∘ E and whose latitudinal position is exclusively south of 10∘ N. Befort et al. (2020) found this filter can reduce the false alarm rate (i.e. the ratio between number of identified non-TC-related windstorms and total number of detected windstorms) of TC identification in JRA-55.
3.2.2 Logistic regression classifier (LRC)
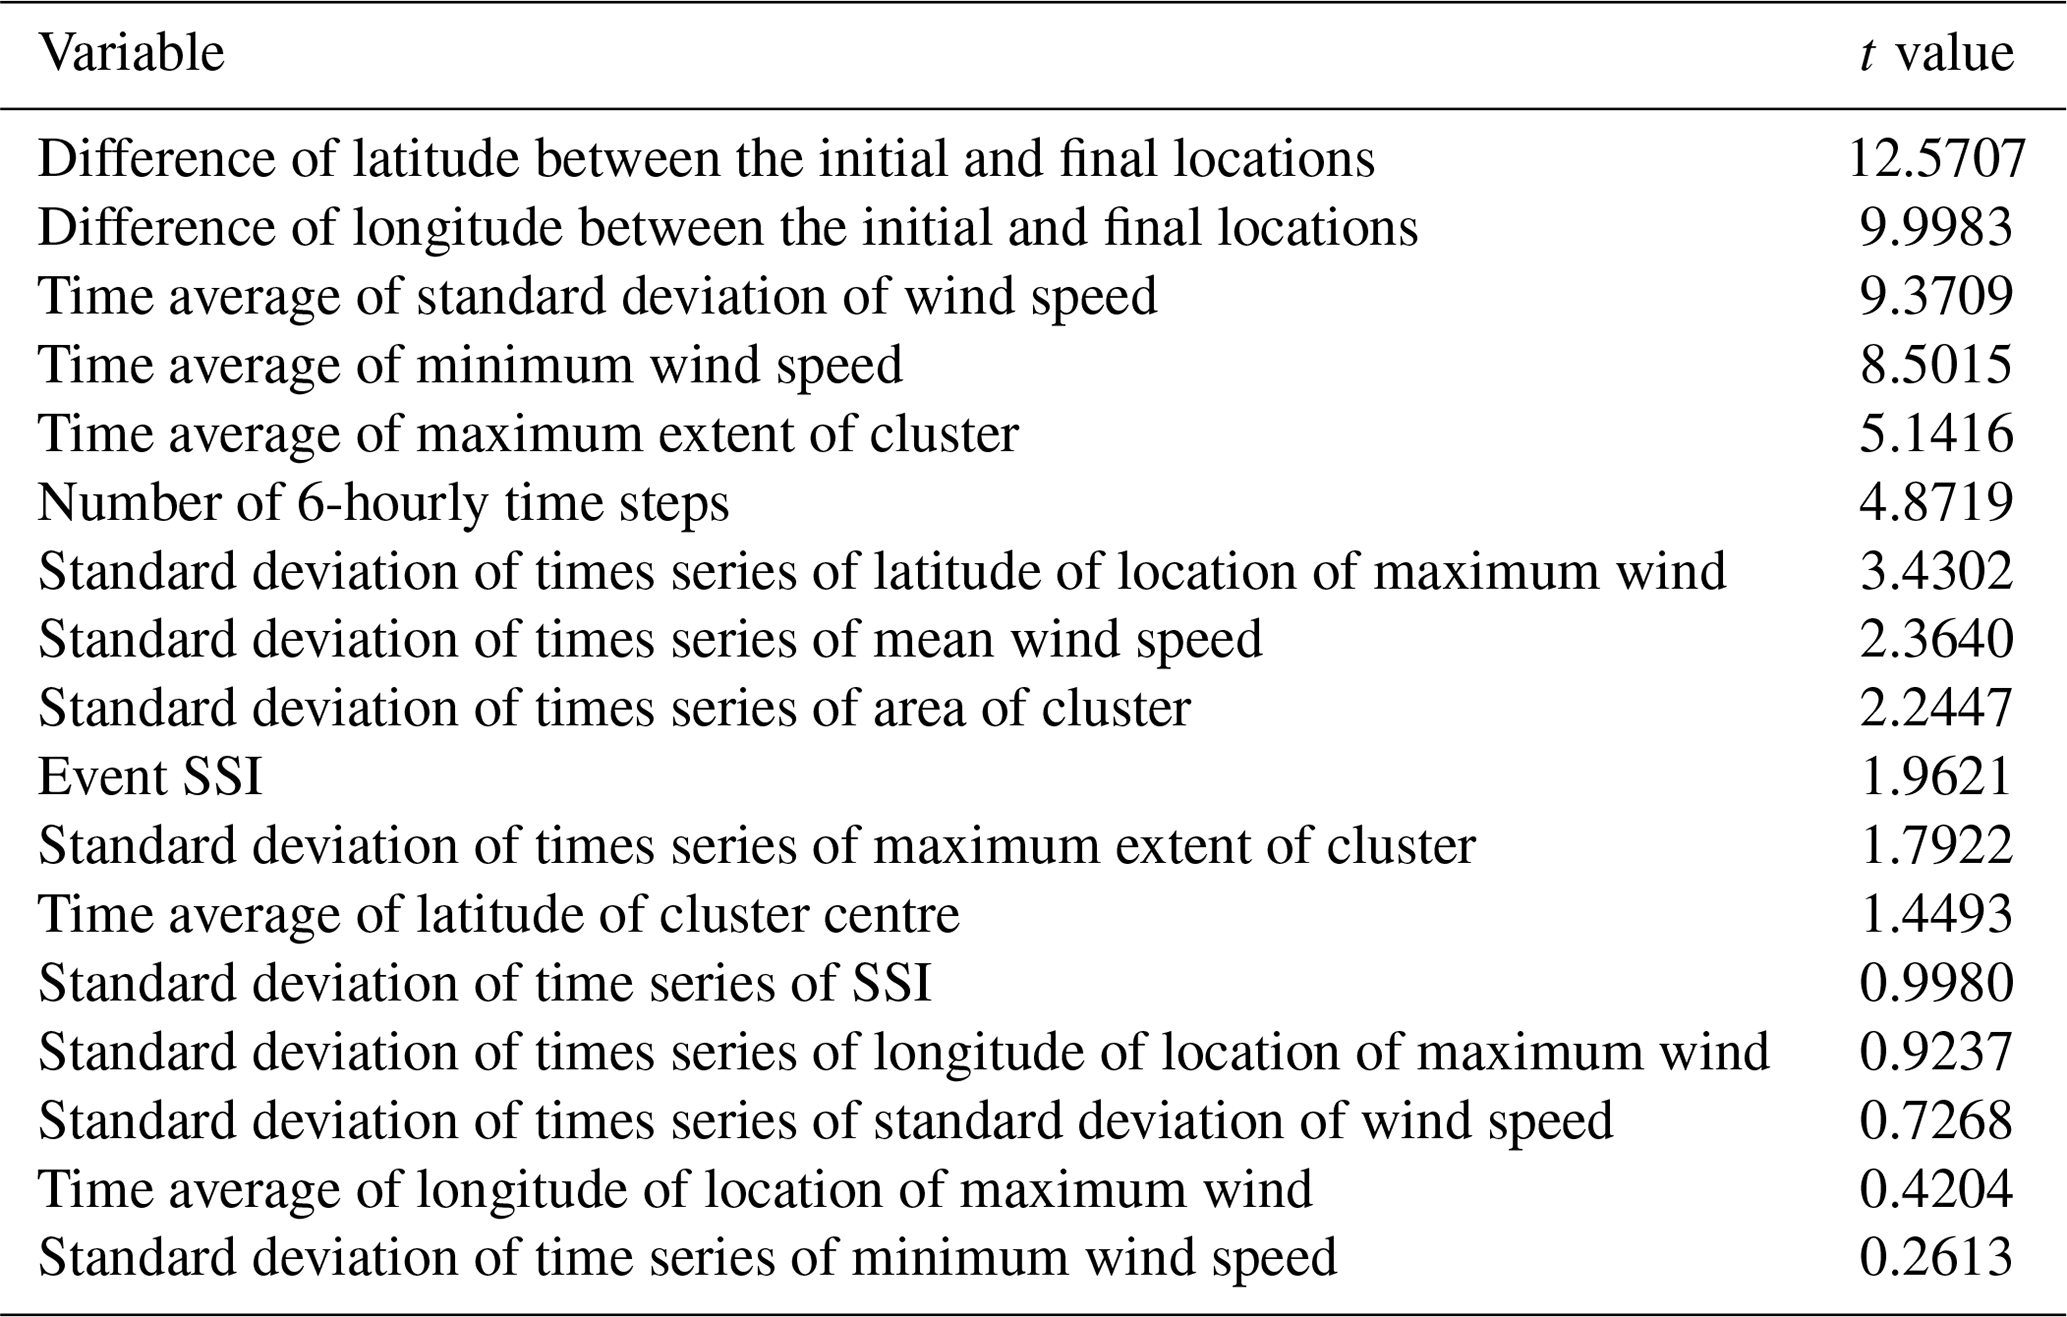
In order to reduce computational cost and increase computational efficiency, the classical methods to determine whether the atmospheric disturbance is a TC or non-TC via cold/warm core determination (e.g. Hart, 2003; Strachan et al., 2013) are not used because these methods require multiple variable fields which increase computational cost significantly. Instead, a statistical learning approach, a logistic regression classifier (LRC), is used to determine whether the windstorm event is related to a TC or not. Details and background information of the LRC can be found in Hastie et al. (2009), and the caret package in R is used for LRC training (Kuhn et al., 2018). The LRC is trained using the track characteristics of the event in the JRA-55 and ERA-Interim event set (1979–2014) as explanatory variables (Table 2). This combination of training sets is chosen based on preliminary studies of constructing an optimal classifier using different combinations of training sets. In order to avoid issues that are associated with collinearity, a stepwise variance inflation factor (VIF) selection method is used to identify independent variables. Variables with VIF values larger than 5 are excluded. A total of 17 variables have been chosen to be used in the construction of the LRC (Table 3). Variables that relate to changes in storm position, lifetime of a storm, and mean wind field structure appear to be the most important variables in the LRC. This is expected as the typical trajectory, duration, and structure of TCs and other windstorms are very different. Validation using the JRA-55 event set (2015–2017), which has 49 TC events and 47 non-TC events, has shown that the accuracy of the LRC is about 90 % with a low rate of false positives and false negatives.
Table 2List of explanatory variables which are initially considered in the LRC model.
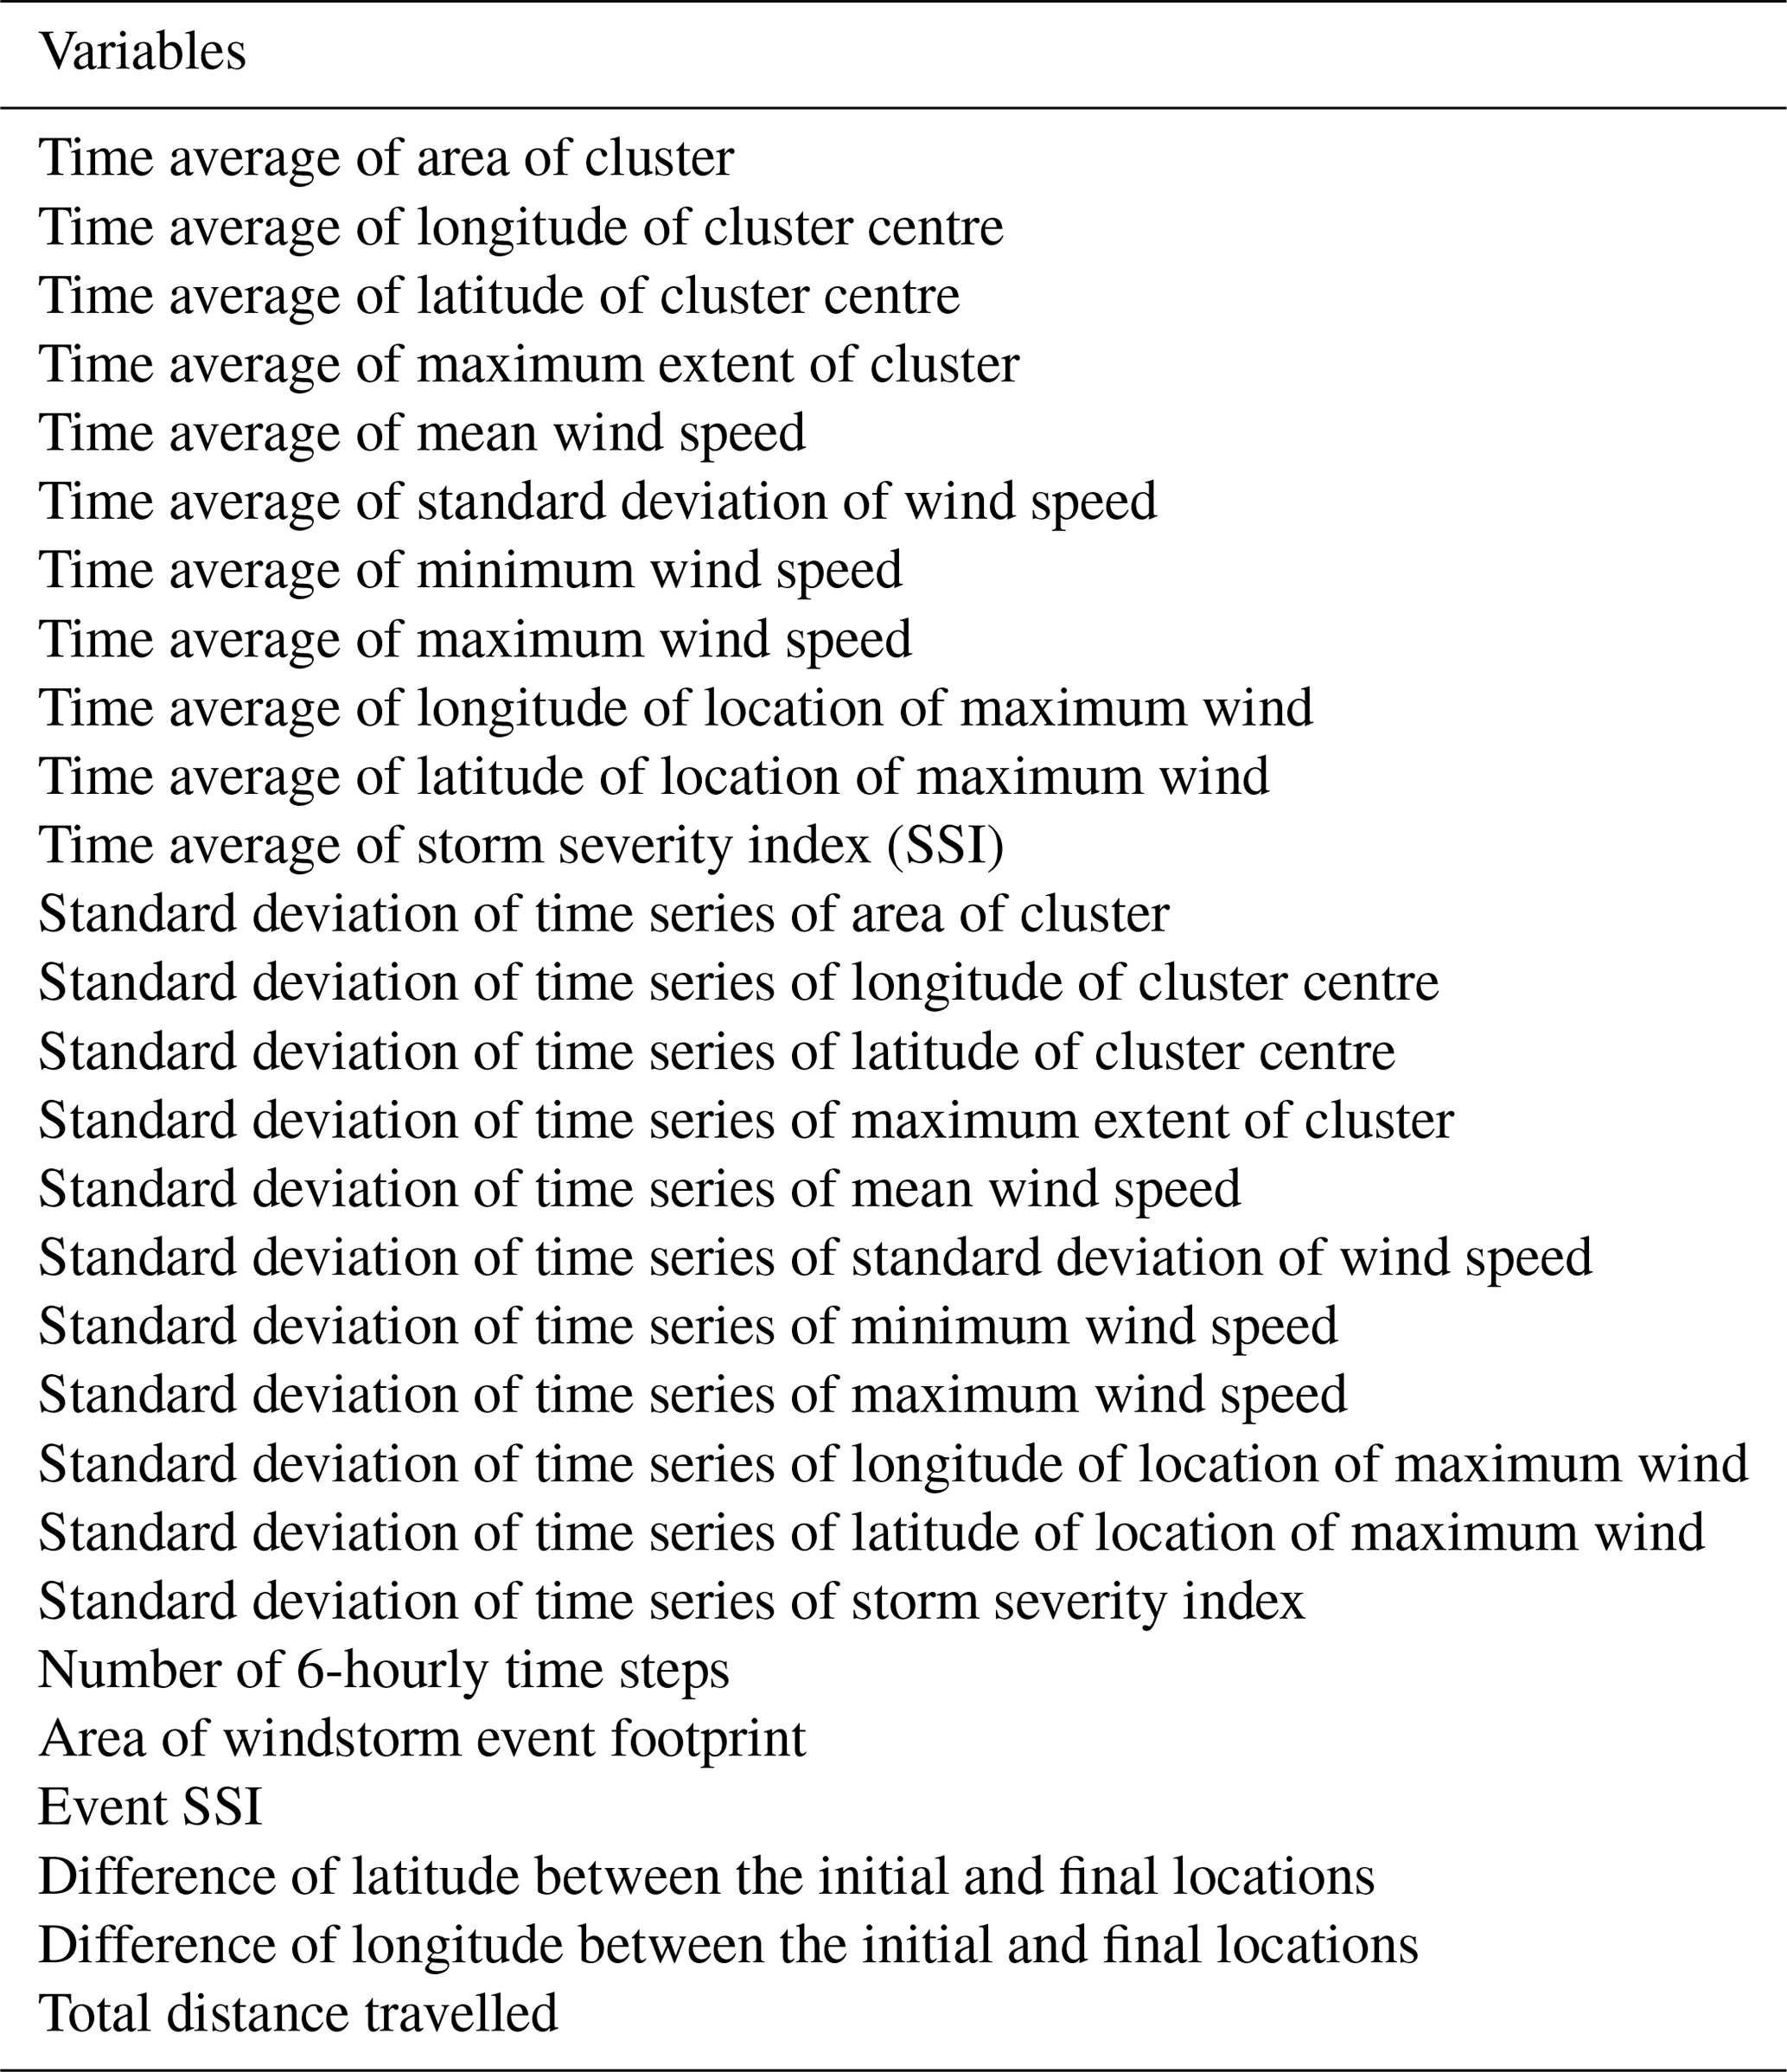
Table 3List of explanatory variables and their associated t values which are used in the construction of the LRC.
3.2.3 MEPS TC identifier (MTI)
Since there are many replicated events of forecasted historical TCs (i.e. MEPS) in the operational forecast archive, it is necessary to remove these events from our event set to avoid biases toward historical events. Instead of using the criteria suggested by Osinski et al. (2016), a set of strict criteria (MTI) is used in this study. This can ensure the statistics and climatology of the TPEPS event set are not biased toward historical events. The MTI eliminates forecasts of MEPS TC events in which the forecasts of those MEPS TCs were initialised (i) before and (ii) after the time of MEPS TC genesis (hereinafter type 1 and type 2 forecast events, respectively). A similarity index (SI) (Eq. 1) is used to eliminate type 1 forecast events:
where d is the great circle distance between position of historical TC and position of TIGGE TC at the overlap time step i, dthres is the maximum tolerance of d, toverlap is the number of overlap time steps in which both historical TC and TIGGE TC existed and which must be larger than 4. Events with an SI larger than SIthres are considered as MEPS TC events. A series of sensitivity studies have been done for determining the optimal choice of parameters (not shown), and the most optimal setting is dthres=900 km and SIthres=0.1. Type 2 forecast events are found if the separation distance between the position of historical TC and the TIGGE TC at any point of their overlap time is less than 400 km. This threshold is determined by the minimum separation between historical TCs and TC in the JRA-55 event set.
3.2.4 Detection at initialisation filter (DIF)
Any events that are detected at the time of model initialisation are removed following Osinski et al. (2016). It is because these events are likely to be related to pre-existing disturbances or structures that lead to their development. The removal of these events ensures the TPEPS event set is independent of any pre-existing weather patterns.
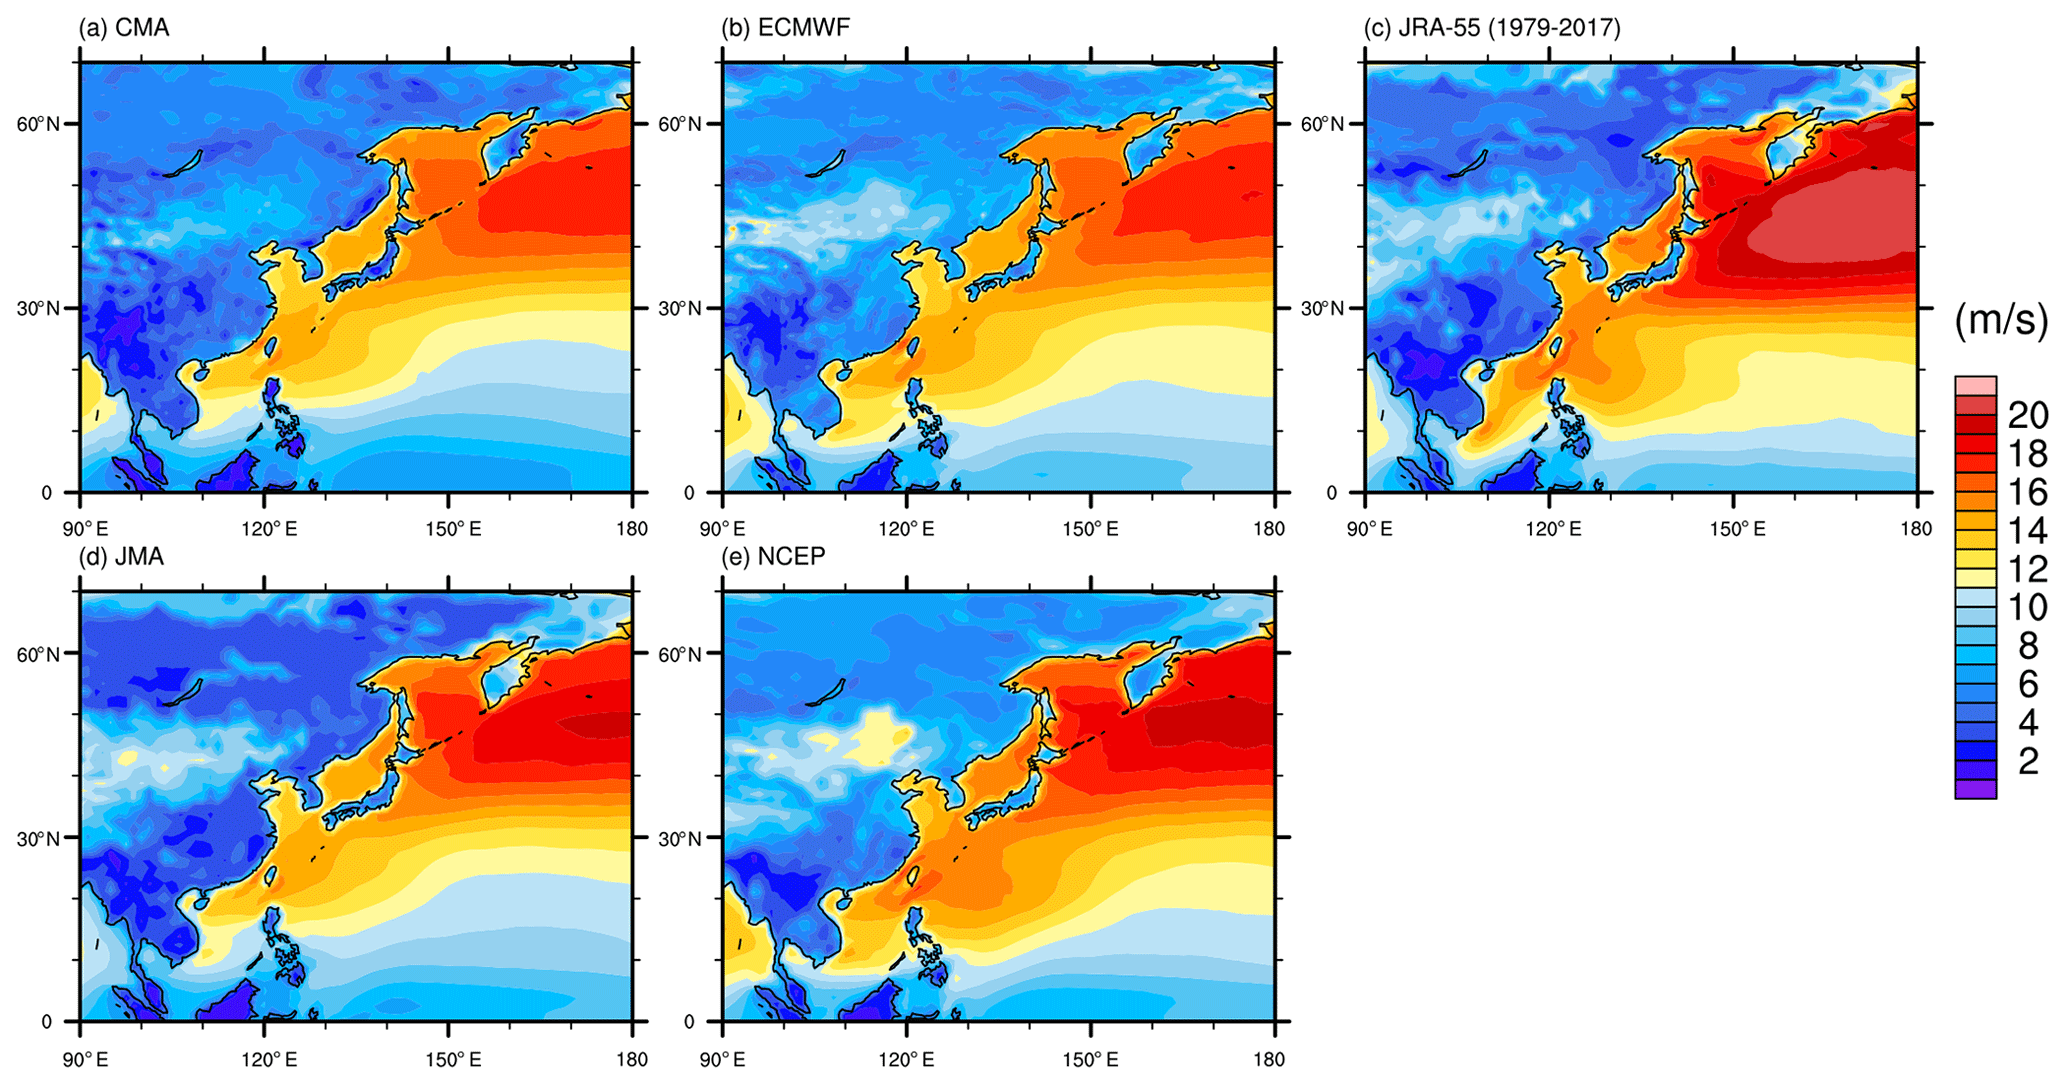
Figure 1Local 98th percentile wind speed for each grid box in the region for TIGGE: (a) CMA, (b) ECMWF, (d) JMA, (e) NCEP, and (c) JRA-55.
3.3 Adjustment procedure
More than one windstorm event could be found within close proximity of another over the WNP. Since the clustering algorithm in WiTRACK does not have a maximum size restriction on the cluster, multiple windstorm events in close proximity could be identified as one windstorm event by WiTRACK. An additional procedure is used to separate these merged windstorm events. This is an iterative procedure which would check whether all of the grid boxes at each 6-hourly time step of the windstorm are within a 1000 km radius from the centre of the windstorm cluster. If any of the event grid boxes are outside the 1000 km radius, it will first remove these grid boxes and recalculate the centre of the event cluster. This procedure is repeated until there is no change in the centre of the cluster. This procedure addresses windstorm events with an unrealistically large impact area and event SSI (ESSI). The event SSI is defined as
where vk,t is the wind speed at grid box k and time step t, v98,k is the climatological 98th percentile wind speed at grid box k, and Ak is the area-dependent weight. Summation is done over all time steps and all grid boxes affected by the windstorm. The threshold radius is chosen to be 1000 km because the typical size of a TC wind field is smaller than a circle of 1000 km radius (Lee et al., 2010; Chan and Chan, 2011).
4.1 Statistics and validations
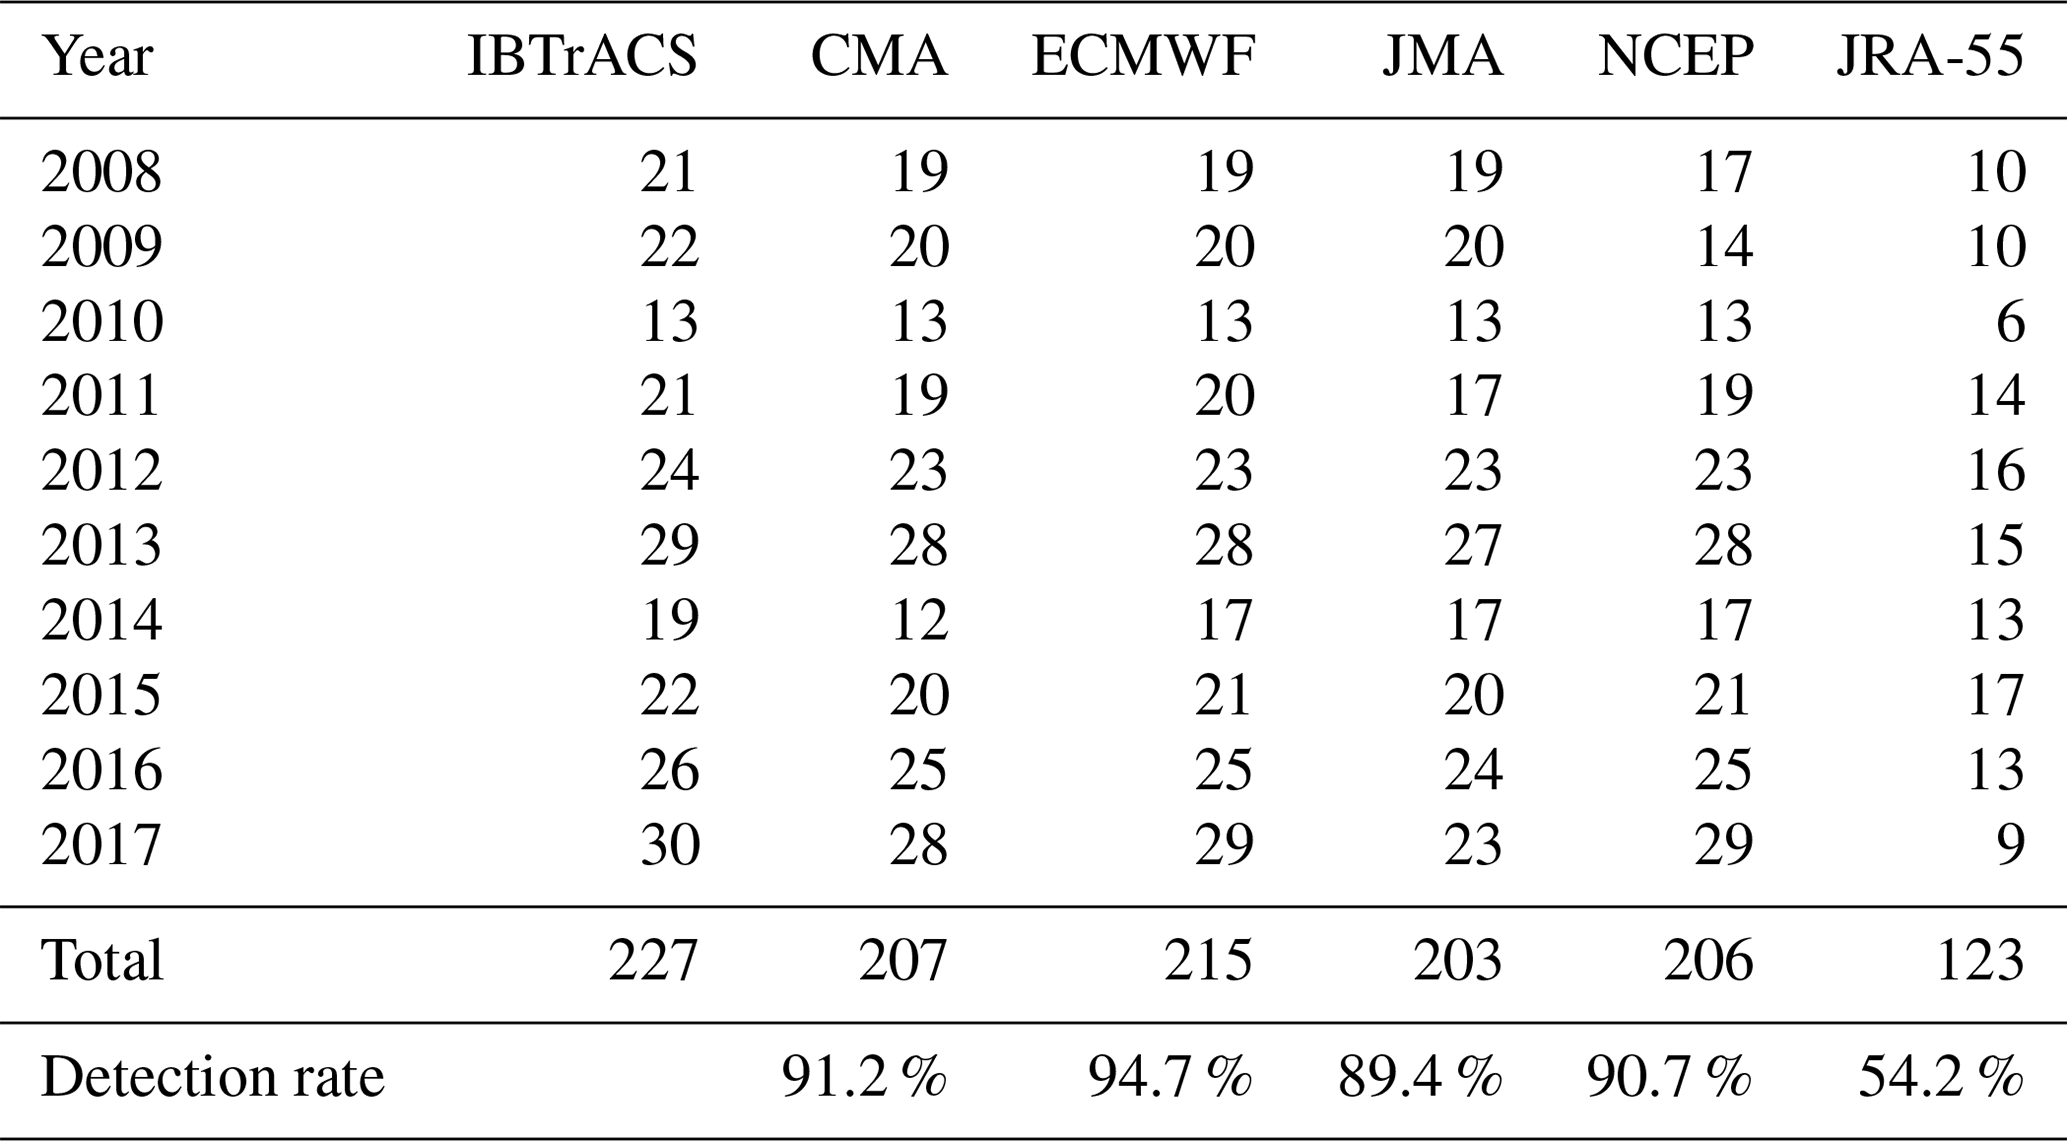
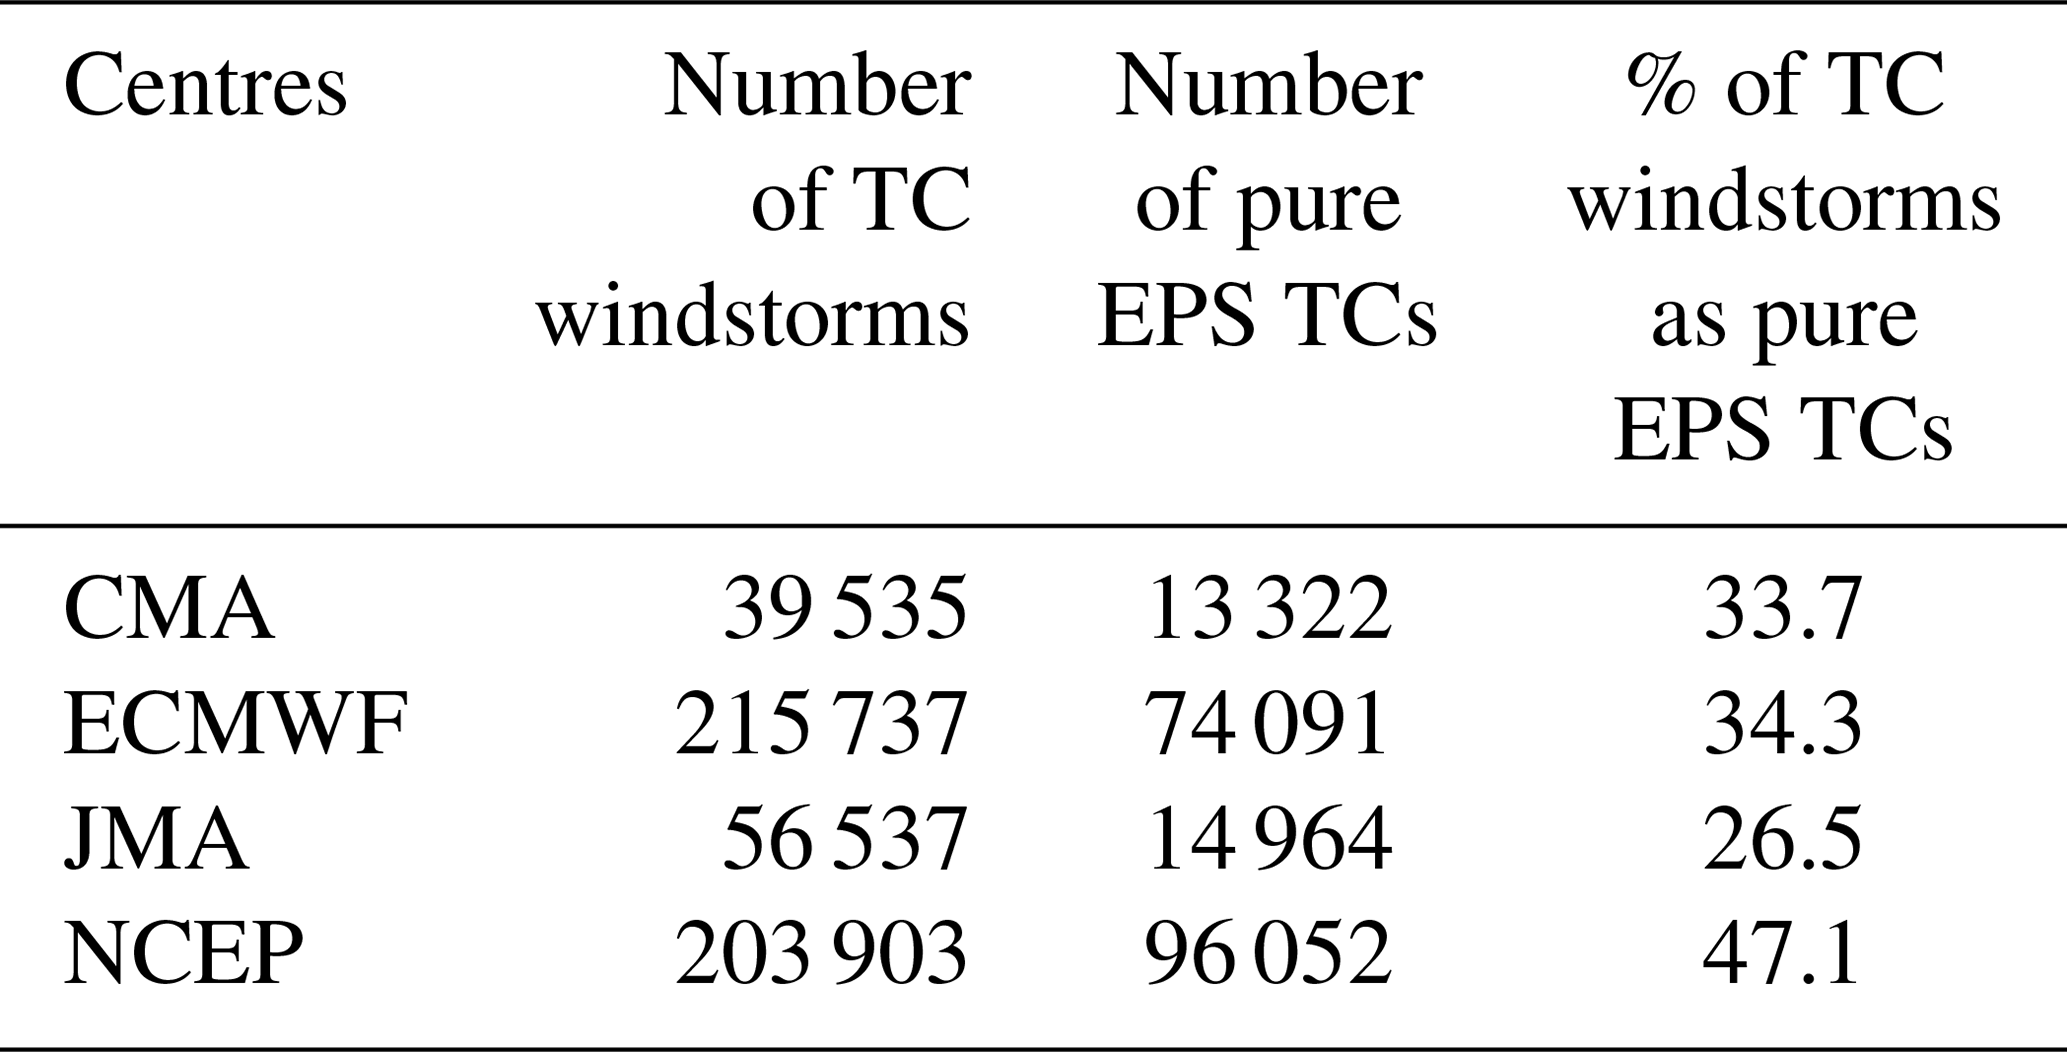
In this section, we present validation of our TPEPS TC event set by comparing the climatological features as provided by a time- and ensemble-aggregated view of the TPEPS TC event set to the historical- and/or reanalysis-based event set. A historical TC is said to be detected in a forecast model if a TC counterpart in the forecast model exists, which is similar to the historical TC as identified by the MTI (cf. Sect. 3.2.3). The detection rates of historical TCs which are detected in different forecast outputs, i.e. CMA, ECMWF, JMA, and NCEP, are 91.2 %, 94.7 %, 89.4 %, and 90.7 %, respectively, whereas only 54.2 % of historical TCs in the period of 2008–2017 are detected in JRA-55 (Table 4). Since WiTRACK is a wind-threshold-exceedance-based detection scheme and the 98th percentile wind speed value of JRA-55 within the tropical WNP is similar to these selected TIGGE data (Fig. 1), this implies JRA-55 underestimates the wind speed of wind field of TCs, which is in agreement with Murakami (2014). This also shows these selected TIGGE outputs provide a better representation of the atmosphere. A total of 515 712 TC-related windstorm events are detected in the selected TIGGE data set. A total of ∼38.5 % of the all TPEPS events are PEPS TC events (Table 5). The percentage of total TC windstorms as PEPS TCs can be treated as a proxy to quantify the forecast skill of the model. For example, NCEP has 47.1 % of TC windstorms as PEPS TCs, whereas JMA has 26.5 %. This indicates the NCEP model generates more “incorrect” forecasts than JMA; however, these incorrect forecasts are physically possible. Yet, examining the forecast skill of models is not the focus of this study, and the rest of the discussion focuses on the TPEPS TC event set.

Figure 2Ranked feature scaled track density (%) of different data sets: (a) CMA, (b) ECMWF, (c) JRA-55, (d) JMA, (e) NCEP, and (f) TIGGE total. The number of TCs in the corresponding event set is stated on the top right of each panel.
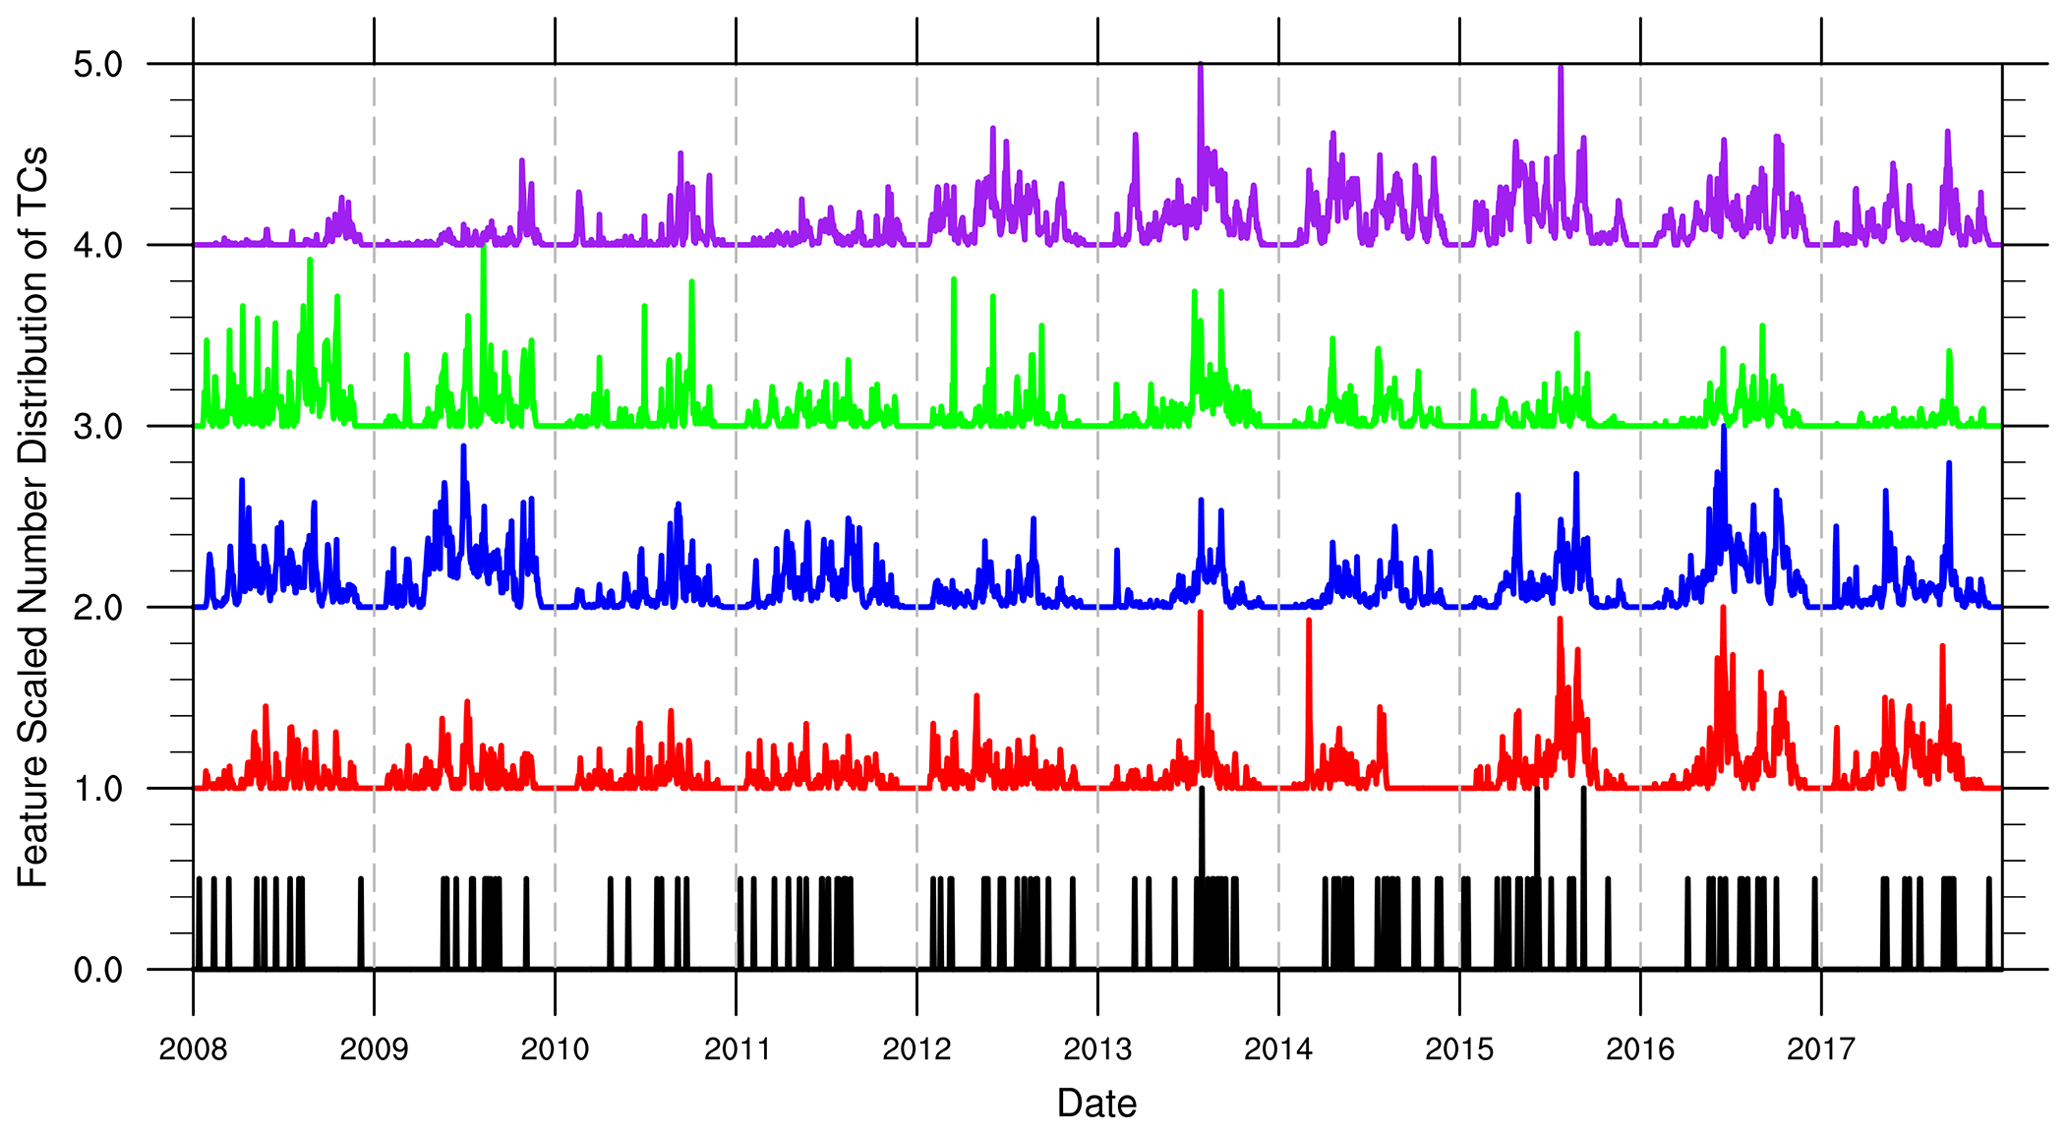
Figure 3Feature scaled time series of the number of TCs which are first identified in each day in the TPEPS TC event set (CMA: red, ECMWF: blue, JMA: green, NCEP: purple) and the JRA-55 event set (black). For visual convenience, the time series of CMA, ECMWF, JMA, and NCEP are shifted by 1, 2, 3, and 4, respectively.
Table 4From the left: annual number of historical TCs in IBTrACS (second column), annual number of historical TCs detected in the respective forecast models (third to sixth columns), and annual number of historical TCs detected in JRA-55 (seventh column).
Figures 2 and 3 show the spatial pattern of and temporal variability in the number of TCs which are first detected for each day, respectively, of the TPEPS and JRA-55 event sets. While individual models might have biases in certain spatial and temporal domains – for example the region with the highest track density of JMA is in the eastern WNP in Fig. 2d in comparison to other models – and NCEP failed to capture the peak activity prior to 2012 in Fig. 3, the overall patterns of the TPEPS event set match the JRA-55 event set. This is expected because firstly, TC formation depends on the environmental conditions and initial disturbance (Gray, 1977; Ritchie and Holland, 1997; Nolan, 2007). During the period of active TC season, environmental conditions over the WNP are usually favourable for TC formation, but often there is no suitable disturbance in the region. Since EPSs simulate the chaotic behaviour of the atmosphere, they would forecast disturbances which would be possible to form but are not realised in the real atmosphere. Hence, PEPS TCs can be formed in those periods of time over the WNP. Secondly, the trajectory of TCs depends mainly on the large-scale environmental flow of the region (Chan, 2010). This implies PEPS TCs would also follow the typical trajectory of real TCs given that the large-scale flow is correctly represented in the forecast models. Thus, in general the spatial and temporal patterns of the TPEPS event set match the patterns of the JRA-55 event set. There are several possible reasons which lead to the differences in spatial patterns between the TPEPS event set and the JRA-55 event set. The eastward bias in the track density appears to be a common feature in many general circulation models (GCMs; e.g. Camargo et al., 2005; Bell et al., 2013; Roberts et al., 2020); this has also been observed in seasonal forecast outputs (Camp et al., 2015). Finite simulation time has also contributed to this bias as TCs that form in the region east of 150∘ E would not have sufficient time to move into the western part of the WNP before the end of the simulation time. Differences in the number of tracks could also contribute to the differences in spatial patterns as more diverse tracks would be captured in larger event sets.
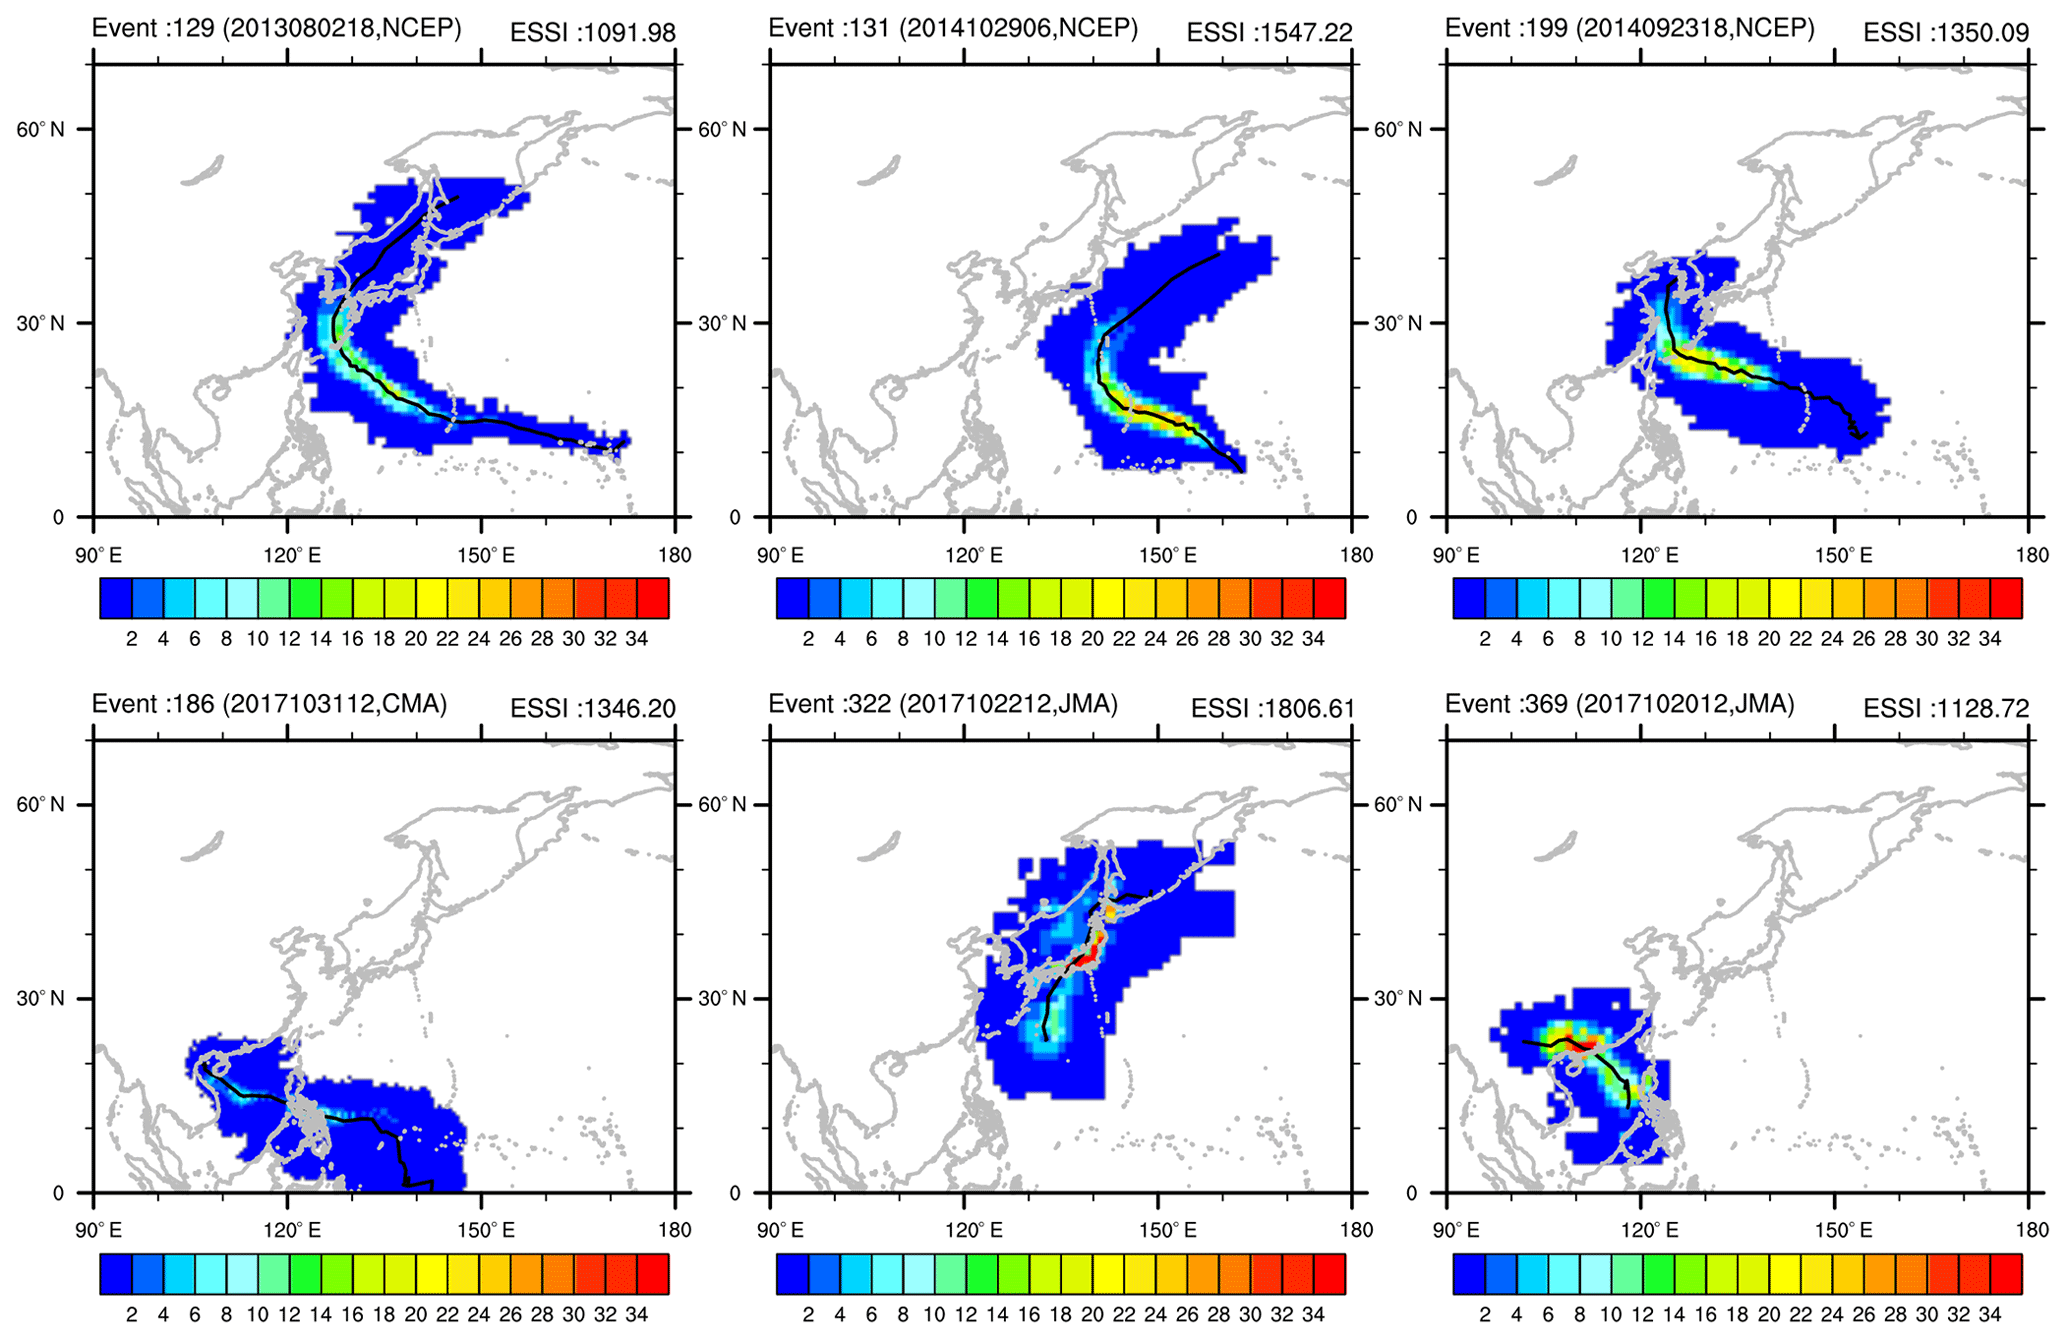
Figure 4Some of the PEPS TC impact footprints (colour contours) and tracks (black line within the colour contours) of the TPEPS TC event sets. The colour contours show the cumulative SSI of the PEPS TCs over their respective lifetime at individual grid boxes. ESSI of each PEPS TC is shown in the top right of each panel.
Some TPEPS events appear in locations where no historical TC event is observed (Fig. 2c and f). While there is no historical TC event in some locations, this does not imply TCs cannot occur in those regions. The historical data, which cover 39 years of observations, may not have enough samples to construct a distribution that can correctly represent the basic population (i.e. all possible TCs in the given climate). For example, the occurrence of Tropical Storm Vamei that formed close to the Equator (∼1.4∘ N) does not satisfy the classical “necessary but insufficient” conditions of TC formation which are identified by Gray (1977) based on historical observations. This shows TCs can appear in historically “TC-free” regions. Furthermore, from the statistical perspective, the JRA-55 event set can be viewed as a subset which is randomly selected from the TPEPS event set. To provide more evidence to support this view, we have conducted bootstrap resampling on the TPEPS event set to obtain 10 000 sets of subsamples. Each set of subsamples has 668 events to mimic the number of events in the JRA-55 event set. The uncentred pattern correlation between the track density of the JRA-55 event set and the track density of each set of subsamples is calculated. In order to focus on the relevant entries, if the values of the track density of a grid box for a resampling set and the JRA-55 event set are both less than 1, such a grid box is neglected in the pattern correlation calculation. The mean, standard deviation, and minimum and maximum of the uncentred pattern correlation of the 10 000 set of subsamples are 0.9380, 0.0107, 0.8961, and 0.9697, respectively. This suggests the spatial pattern of the JRA-55 event set is highly similar to some small random subsets of the TPEPS event set. Thus, the JRA-55 event set can be seen as a subset which is randomly selected from the TPEPS event set. On the other hand, it is not be possible to deduce the basic population (e.g. the TPEPS event set) from a small sample set (e.g. the JRA-55 event set). Although the spatial distribution of the small set sample is similar to the subsamples of the basic population and thus usable as one possible realisation of the basic population, the small sample set does not contain all of the information of the underlying population. Furthermore, the statistical estimate of extremes would also be different for the small sample set and the basic population.
Some of the examples of TPEPS TC tracks and impact footprints are shown in Fig. 4. The trajectory of these TPEPS TC tracks is indistinguishable from historical TC trajectories in the WNP. This shows these TPEPS TC events are realistic and physically possible events. Figure 5 shows the climatological daily number distributions of TC first detection for the TPEPS TC event set and the JRA-55 event set. Although the peak activity periods of JMA are slightly lagged behind and the over- and under-estimations of the peak of activity for CMA and NCEP, respectively, are observed, the seasonal cycle of the TPEPS TC event set is captured well, and this matches the seasonal cycle of the JRA-55 event set. This shows our new approach is capable of producing spatially and temporally realistic events.
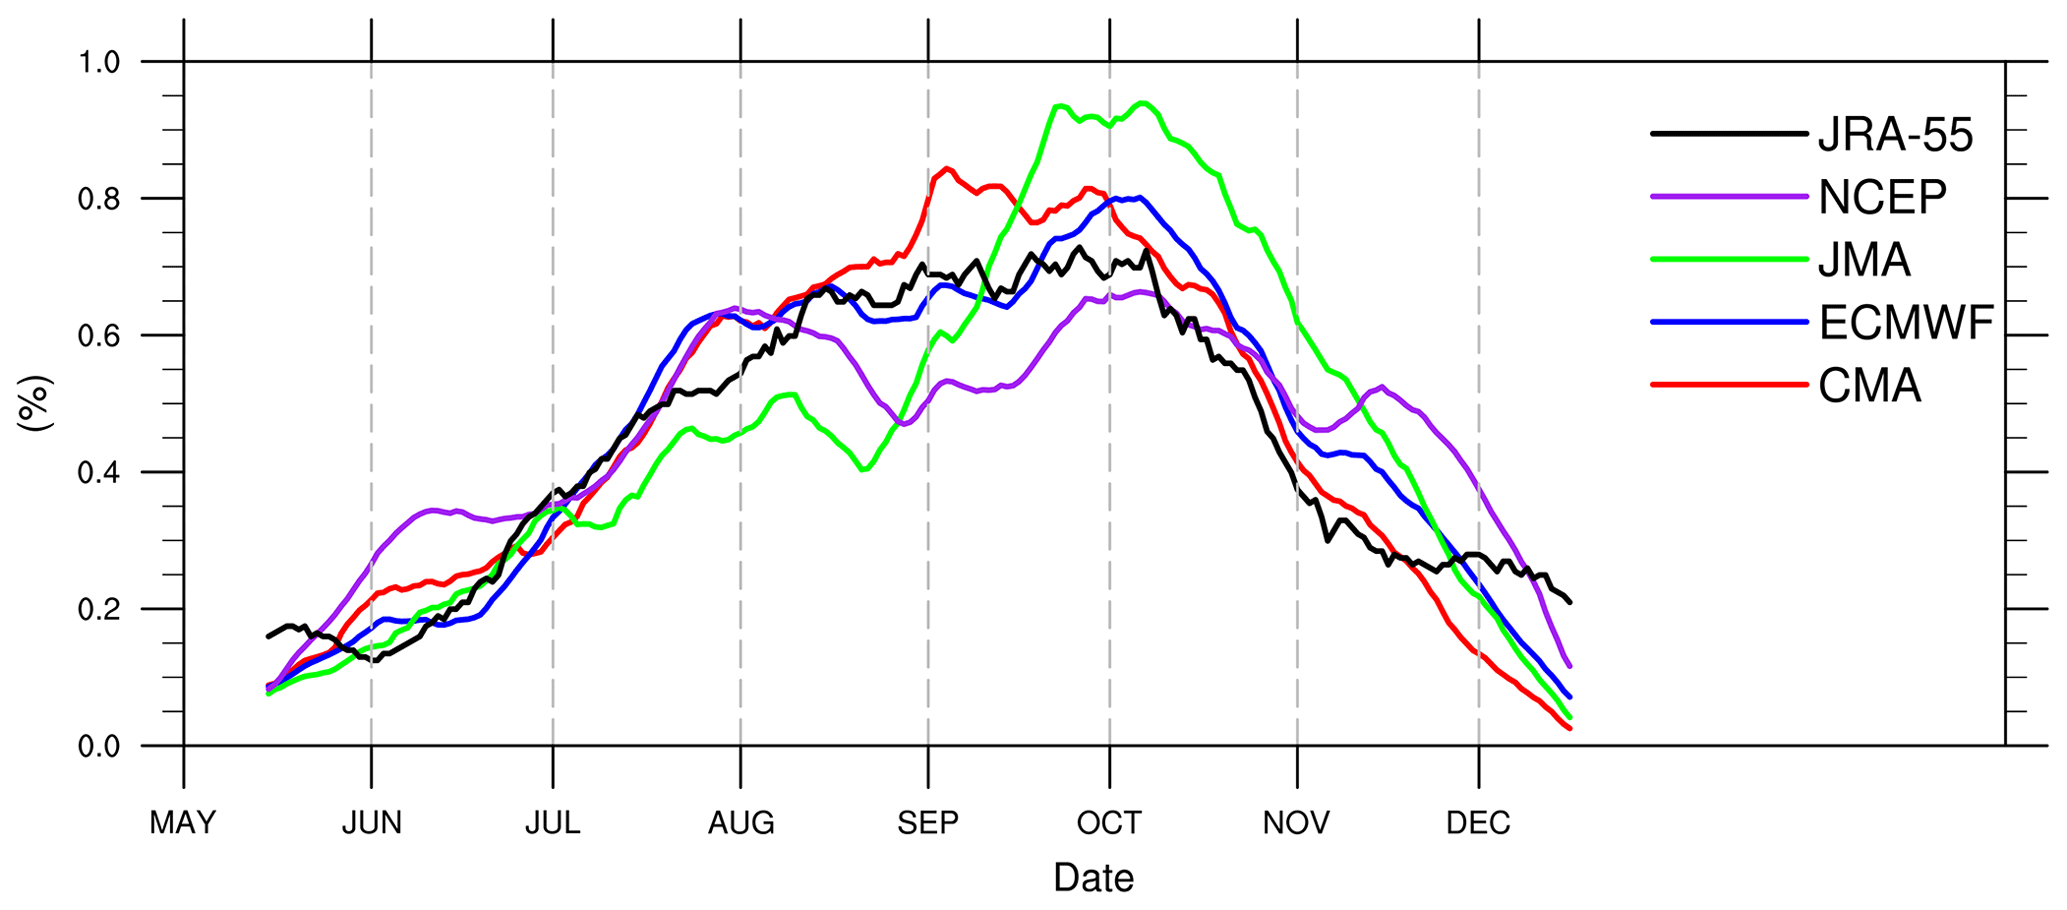
Figure 5Climatological daily number distribution of TC first detection for the TPEPS TC event set (CMA: red, ECMWF: blue, JMA: green, NCEP: purple) and the JRA-55 event set (black), i.e. the probability of TCs being first detected at a given day in the model. The 30 d moving average is used in order to remove high-frequency signals.
In general, the temporal evolutions of the number of first storm detections of the TPEPS event set during the integration time have an increasing trend in the short lead time, followed by a roughly constant behaviour (Fig. 6). In short lead times (i.e. close to initialisation of forecast), the true state of the atmosphere is simulated well by forecast models; thus, EPSs are likely to produce storms that actually occurred (i.e. MEPS storms) and less likely to produce PEPS storms (Osinski et al., 2016). As lead time increases, more PEPS storms are produced due to increasing uncertainty of the state and the chaotic behaviour of the atmosphere in EPSs. When an EPS has no memory of the initialisation state of the atmosphere, the probability distribution of formation of PEPS TCs becomes a uniform distribution.
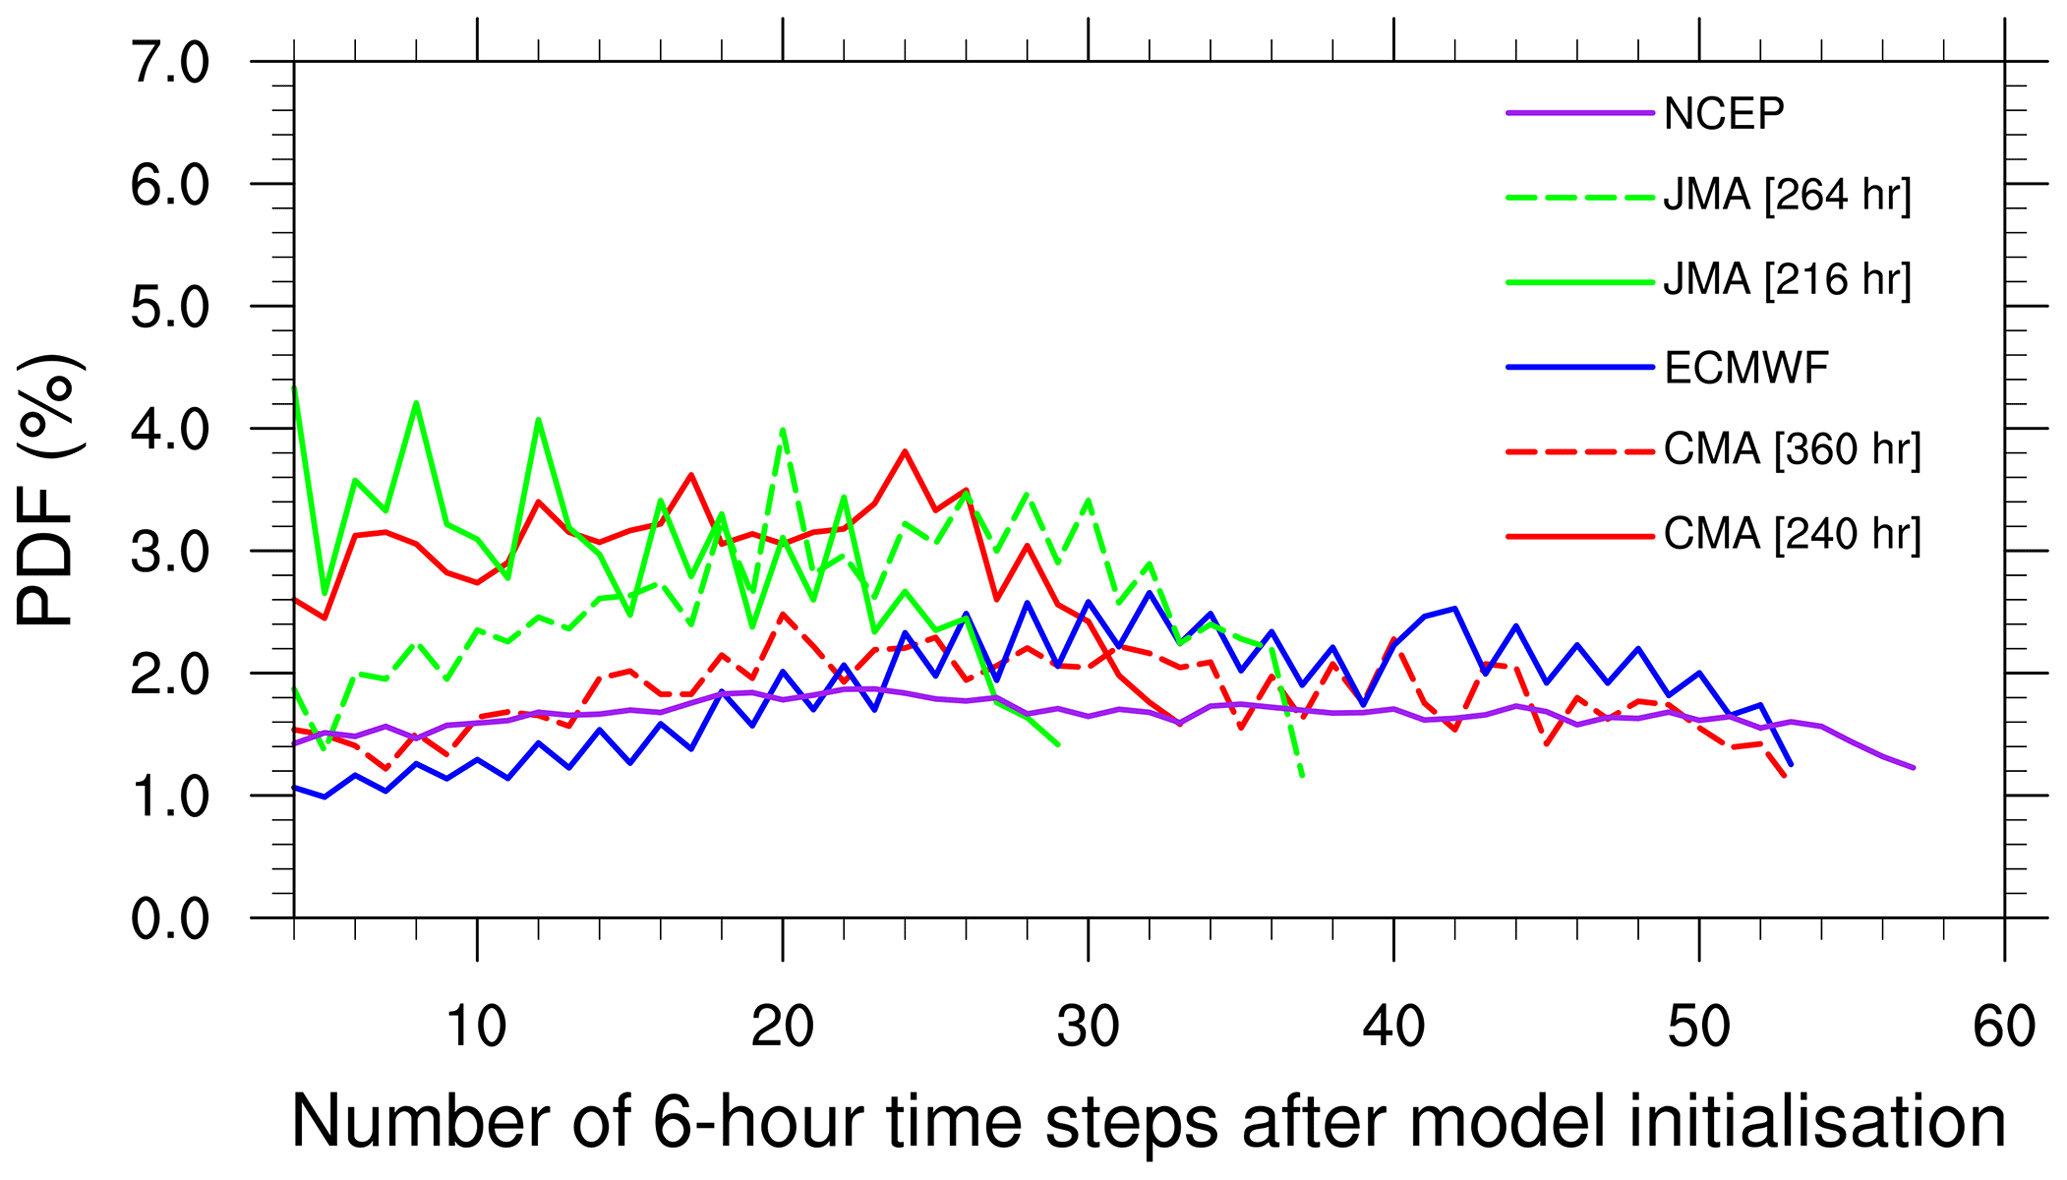
Figure 6Temporal evolution of frequency of first storm detections of the TPEPS event set (CMA: red, ECMWF: blue, JMA: green, NCEP: purple).
The overall impact of any storm is related to many factors, for example, the lifetime of the storm, the size of the storm, and the intensity (or strength) of the storm (e.g. Vickery et al., 2000; Mori and Takemi, 2016; Kim and Lee, 2019). Here we investigate whether there are systematic biases in the TPEPS TC event set which would affect these quantities. The lifetime distribution of TPEPS TCs matches the JRA-55 event set but proportionally overestimates for short-lived TCs and underestimates for long-lived TCs (Fig. 7a). These differences are the consequence of the finite simulation time in forecast models. If the same restriction (i.e. finite simulation time window) is applied to the JRA-55 TC event set (grey shaded areas in Fig. 7), the lifetime distribution of TPEPS TCs would be in good agreement with the JRA-55 TCs. A similar conclusion can be reached in the comparison of the distribution of time required to reach lifetime maximum intensity (LMI) (Fig. 7b). However, the finite simulation time of EPSs cannot explain the difference in the distribution of impact area, which is the total area that has experienced TC-associated extreme wind (i.e. larger than local climatological 98th percentile wind speed), between the TPEPS and JRA-55 event sets despite their having the same type of distribution (Fig. 7c). The difference in the distributions of impact area may be due to the fact that the wind speed of the TC wind fields is underestimated in JRA-55, as discussed above. Consequently, many weaker TCs which would have small impact areas are not detected, and thus they are not necessarily included in the JRA-55 TC event set.

Figure 7The distribution of (a) lifetime, (b) time required to reach LMI, and (c) impact area of TCs in the TPEPS TC event set (red lines) and the JRA-55 event set (black line). The grey area indicates the spread of the lifetime distribution of JRA-55 if finite simulation windows are applied to the JRA-55 event set.
4.2 Robust TC hazard assessment
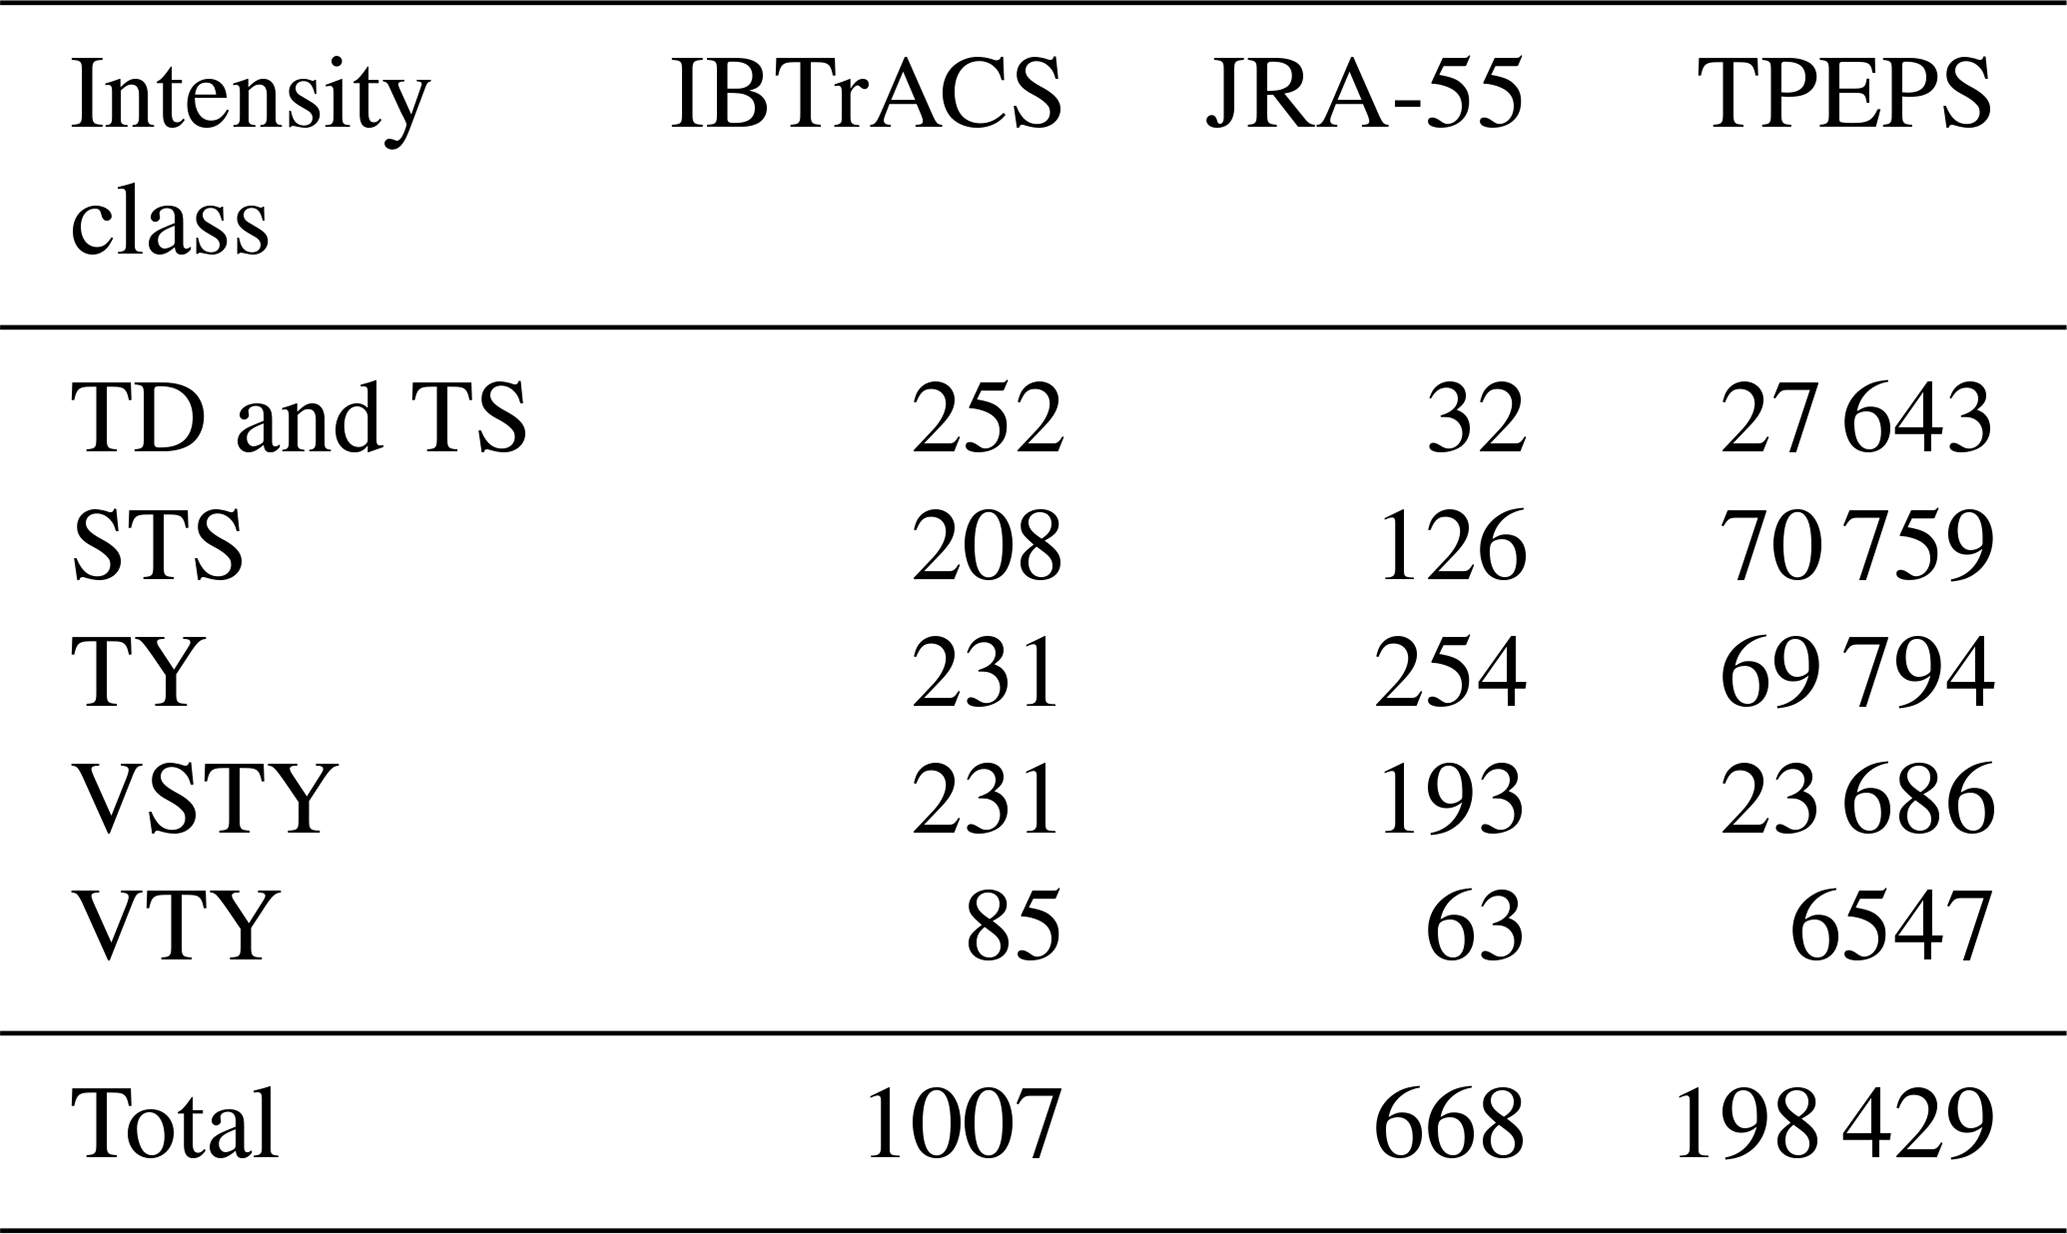
To demonstrate the benefit of our approach, TC records in IBTrACS, the JRA-55 TC event set, and the TPEPS TC event set are stratified into intensity classes according to their lifetime maximum intensity (cf. Table 6). Since WiTRACK is an impact-oriented, wind-speed-percentile-based tracking scheme which tracks TCs with potential impact (Befort et al., 2020), many of the low-impact TCs (i.e. TCs in the tropical depression, TD, and tropical storm, TS, categories) are not detected and thus not included in the TPEPS TC event set. Focusing on the categories of high-impact TCs, i.e. typhoon (TY), very strong typhoon (VSTY), and violent typhoon (VTY), the TPEPS event set contains 302.14, 102.54, and 77.02 times more TYs, VSTYs, and VTYs than the IBTrACS records, respectively. This means our new approach can capture many more extremely high-impact events such that a more robust analysis of extreme TC events can be done.
Table 6Number of TC records in IBTrACS, JRA-55 TC event set, and TPEPS TC event set for different intensity classes. The classes are tropical depression (TD) and tropical storm (TS), severe tropical storm (STS), typhoon (TY), very strong typhoon (VSTY), and violent typhoon (VTY). The intensity classes for IBTrACS are defined according to WMO (2019). The intensity classes for JRA-55 TC and TPEPS TC are derived from the WMO (2019) intensity classes by using quantile mapping of intensity records of JRA-55 TC and IBTrACS records.
The key advantage of this new approach is that it constructs a physically consistent and high information content TC event set with a good and realistic representation of the current climate state using a computationally inexpensive algorithm. Since more physically consistent and physically possible TCs are included, more extreme events can be captured in the TPEPS event set. Consequently, a robust TC hazard assessment can be obtained. Some of the examples are presented in this subsection.
Figure 8 shows the location of first detection of TCs with LMIs of at least typhoon strength which made landfall within the given domain (0–30∘ N, 105–180∘ E) for the TPEPS and JRA-55 TC event sets. The spatial pattern of the TPEPS TC event set (Fig. 8f) matches the spatial pattern of the JRA-55 TC event set. The data in the JRA-55 TC event set are sparse, and they do not provide sufficient information about whether TCs, which made landfall in this region, are typically first identified in the WNP or in the South China Sea (SCS). The TPEPS TC event set, on the other hand, provides a clearer picture and suggests that events which made landfall in this domain are typically first identified in the SCS and western WNP. This is consistent with the known climatology. As TCs within the SCS and western WNP usually follow the western and north-western trajectory and subsequently made landfall over Vietnam, south and south-east mainland China, Taiwan, and the Philippines.
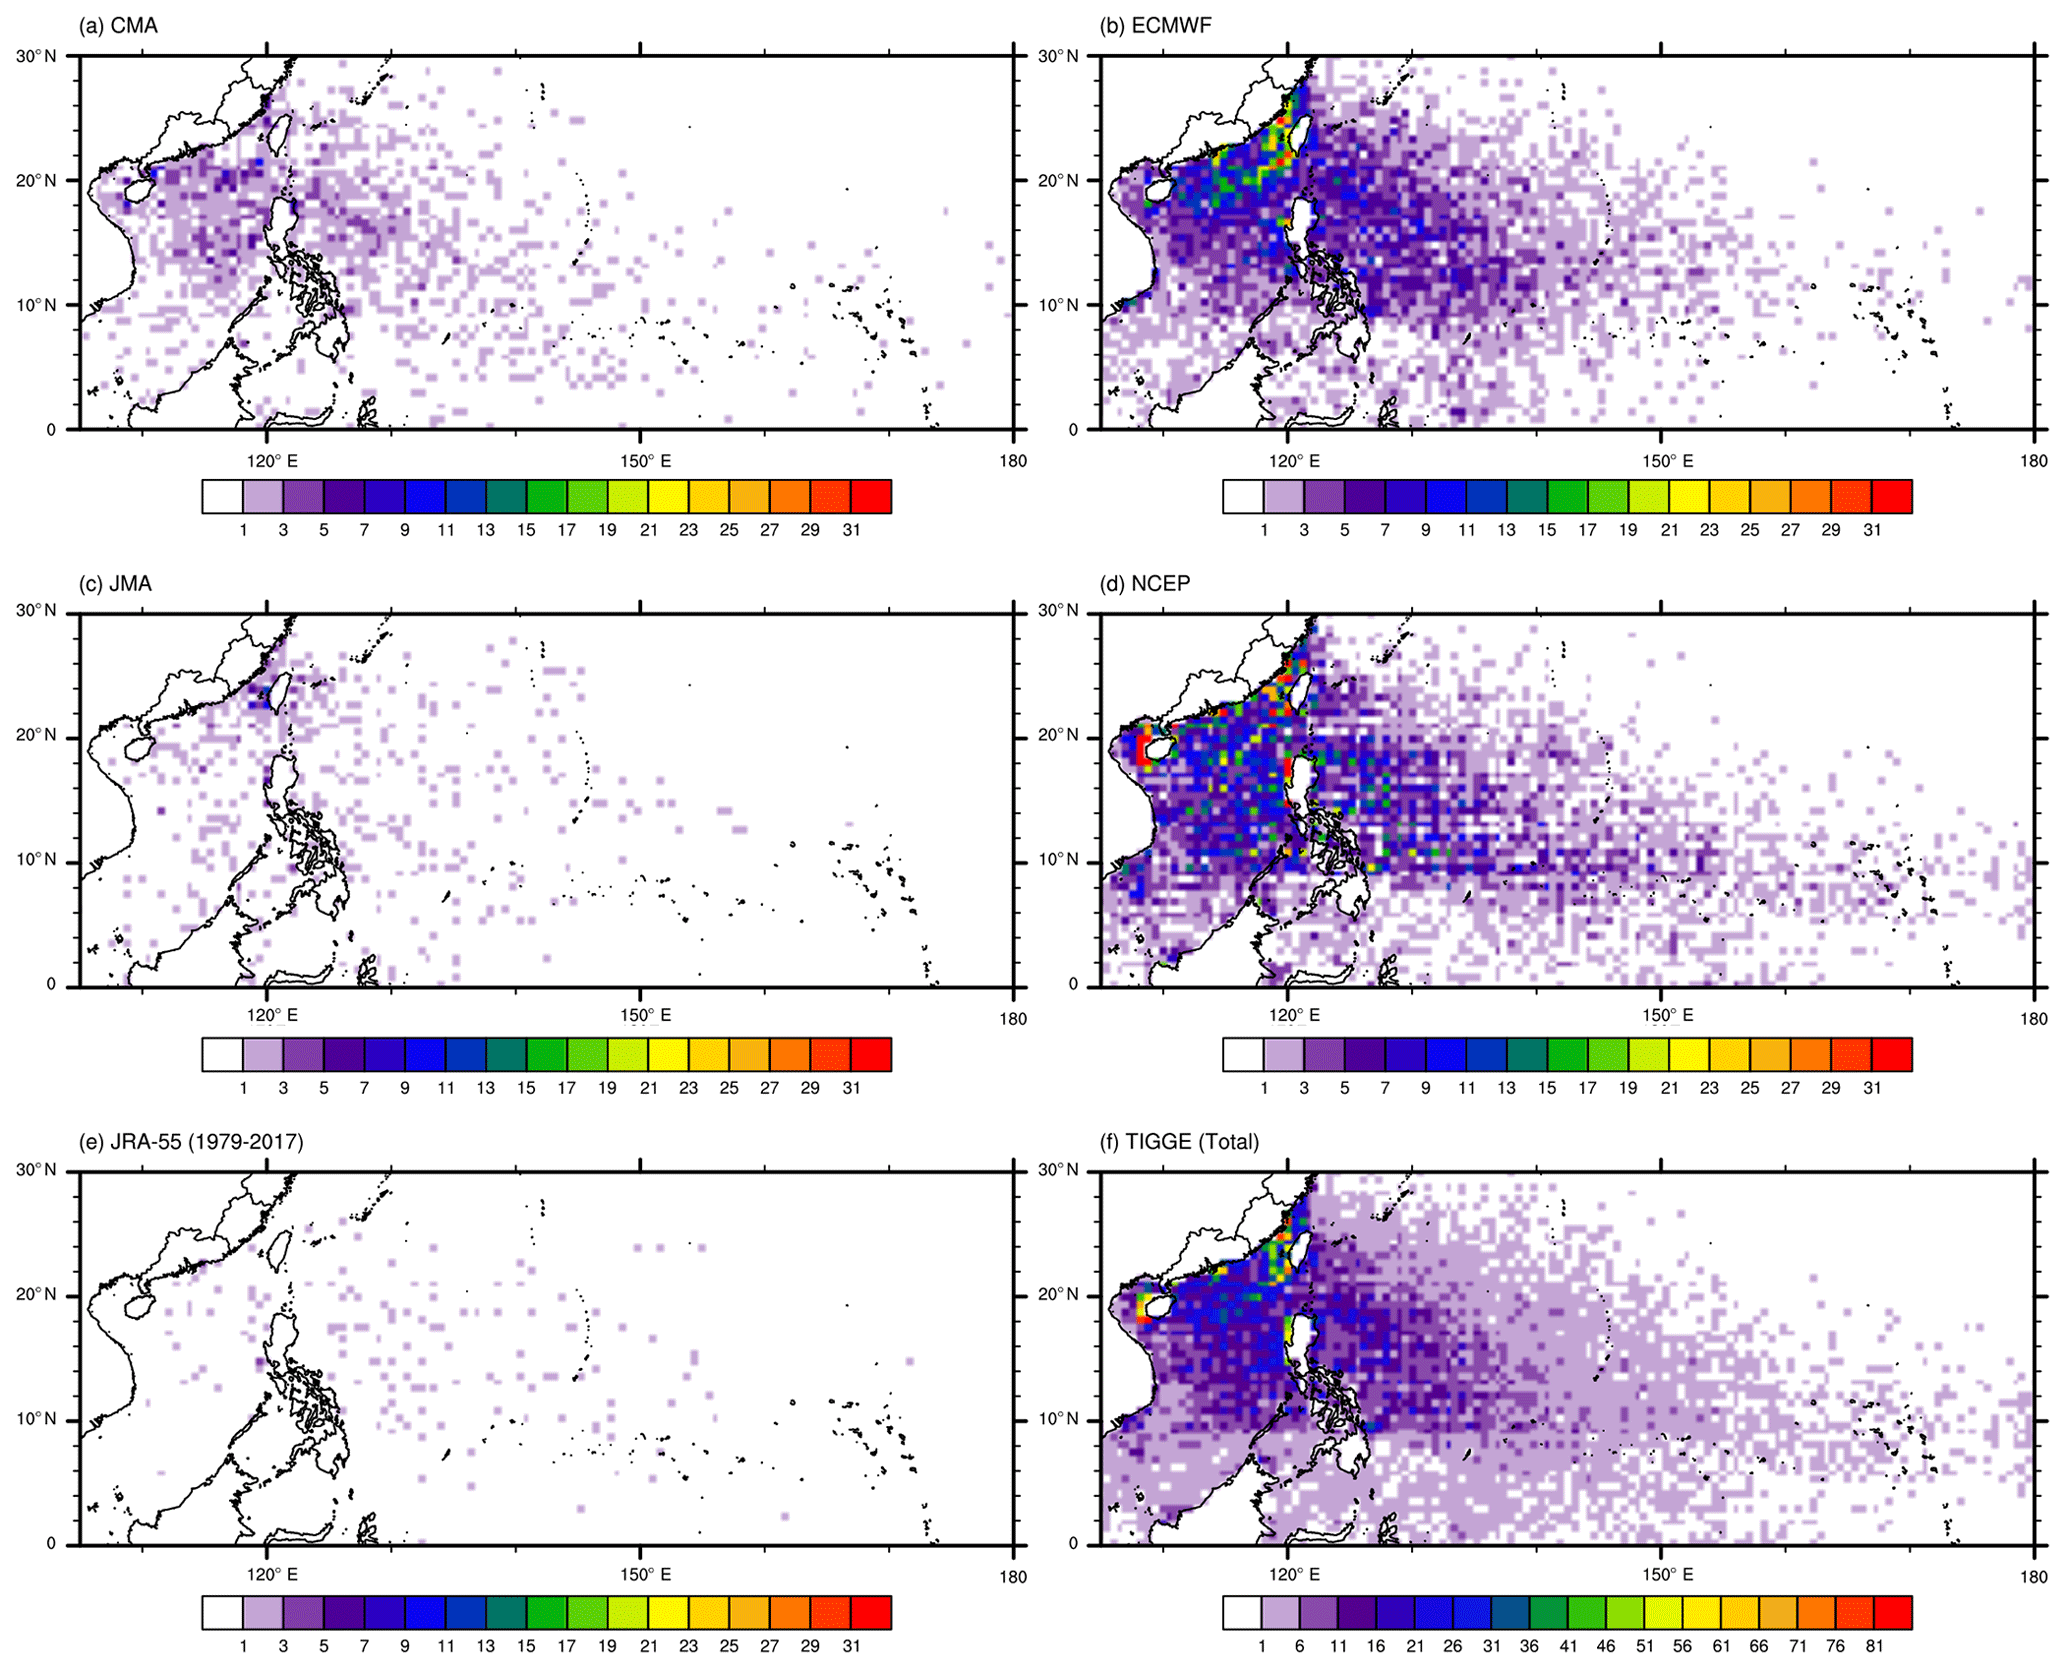
Figure 8The spatial distribution of location of first detection of TCs (with LMIs of at least typhoon strength) which made landfall within the domain 0–30∘ N, 105–180∘ E for the TPEPS TC event set and the JRA-55 event set.
Figure 9 shows the number of TC landfall events which made landfall with at least typhoon strength with the focus on southern and south-eastern mainland China and Taiwan. Many more landfall events have been captured by the TPEPS TC event set (11 449) than the JRA-55 TC event set (100). The spatial distribution of TPEPS TCs is in good agreement with the JRA-55 TCs with an uncentred pattern correlation of 0.8345. TCs which made landfall with at least typhoon strength are more likely to made landfall along the coast of the southern Fujian Province and the eastern Guangdong Province than any other coastal area south and south-east of mainland China. Furthermore, higher TC landfall frequency is observed on the side of islands (i.e. Hainan Island and Taiwan) which faces the open ocean than the other side of islands. This is consistent with observations. The TPEPS TC event set also provides information about the frequency of TC landfall at locations where no landfall events had been observed in the JRA-55 TC event set, e.g. locations along the coastline of Guangdong Province. Furthermore, the distribution of landfall intensity for TCs which made landfall with at least typhoon strength for the TPEPS TC event set is very similar to the JRA-55 TC event set (the null hypothesis, i.e. the distributions are the same, is not rejected at the 0.05 significance level of the two-sample Kolmogorov–Smirnov test).
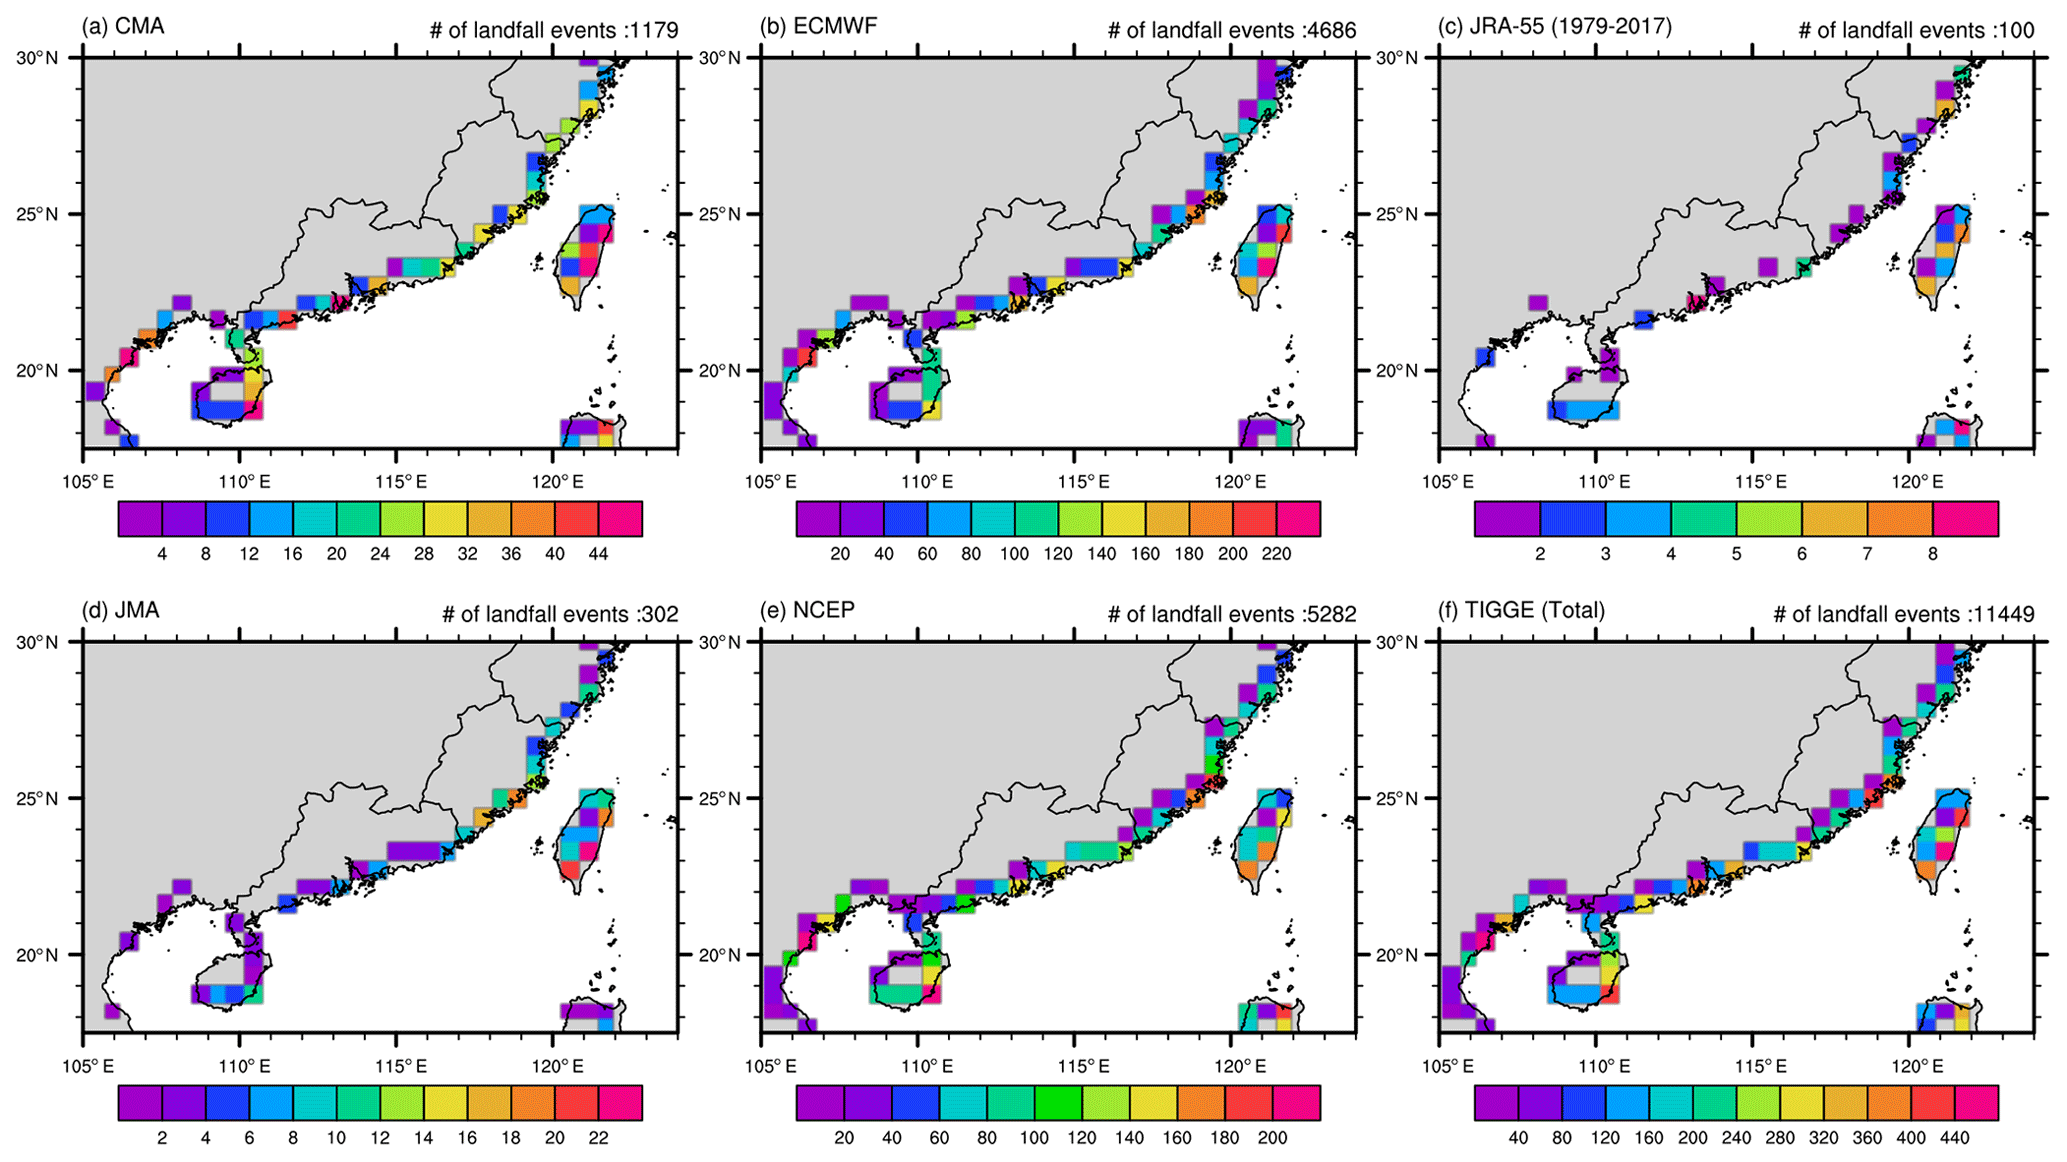
Figure 9Spatial distribution of the number of landfall events (landfall with at least typhoon strength) for the TPEPS TC event set and the JRA-55 event set (colours). The total number of landfall events in each panel is shown in the top right of each panel.
4.3 Application
The TPEPS TC event set is constructed based on physical models, i.e. GCMs, which provide a good representation of the atmosphere of the real world. The wind field associated with a TPEPS TC event is realistic, and local effects, such as local topography, have been taken into account. This implies the wind information of the TPEPS TC event set can be used for estimates of return periods of local extreme wind events associated with typhoons with high confidence. Figure 10 shows the number of TC-related 6-hourly extreme wind (i.e. wind speed higher than the local 98th percentile climatological wind speed) data entries in each of the grid boxes within Guangdong Province in southern China. The JRA-55 TC event set can only construct a TC-related 6-hourly extreme distribution with ∼25 (inland) and ∼325 (coastal) data entries, whereas such distributions can be constructed with at least 500 to over 28 000 data entries using the TPEPS TC event set. This implies the estimated return period using the TPEPS TC event set would be more reliable than using the JRA-55 TC event set and similarly the observation data alone. This is of importance from the DRR perspective as wind speed values are used in practice to decide on payments out of parametric insurance products (Swiss Re, 2016). Consequently, reliable wind-based trigger points of typhoon parametric insurance can be determined. This will further improve the suitability and flexibility of parametric insurance for DRR applications. Ultimately, this will improve the speed of post-disaster recovery. A demonstration for such an application is given below.
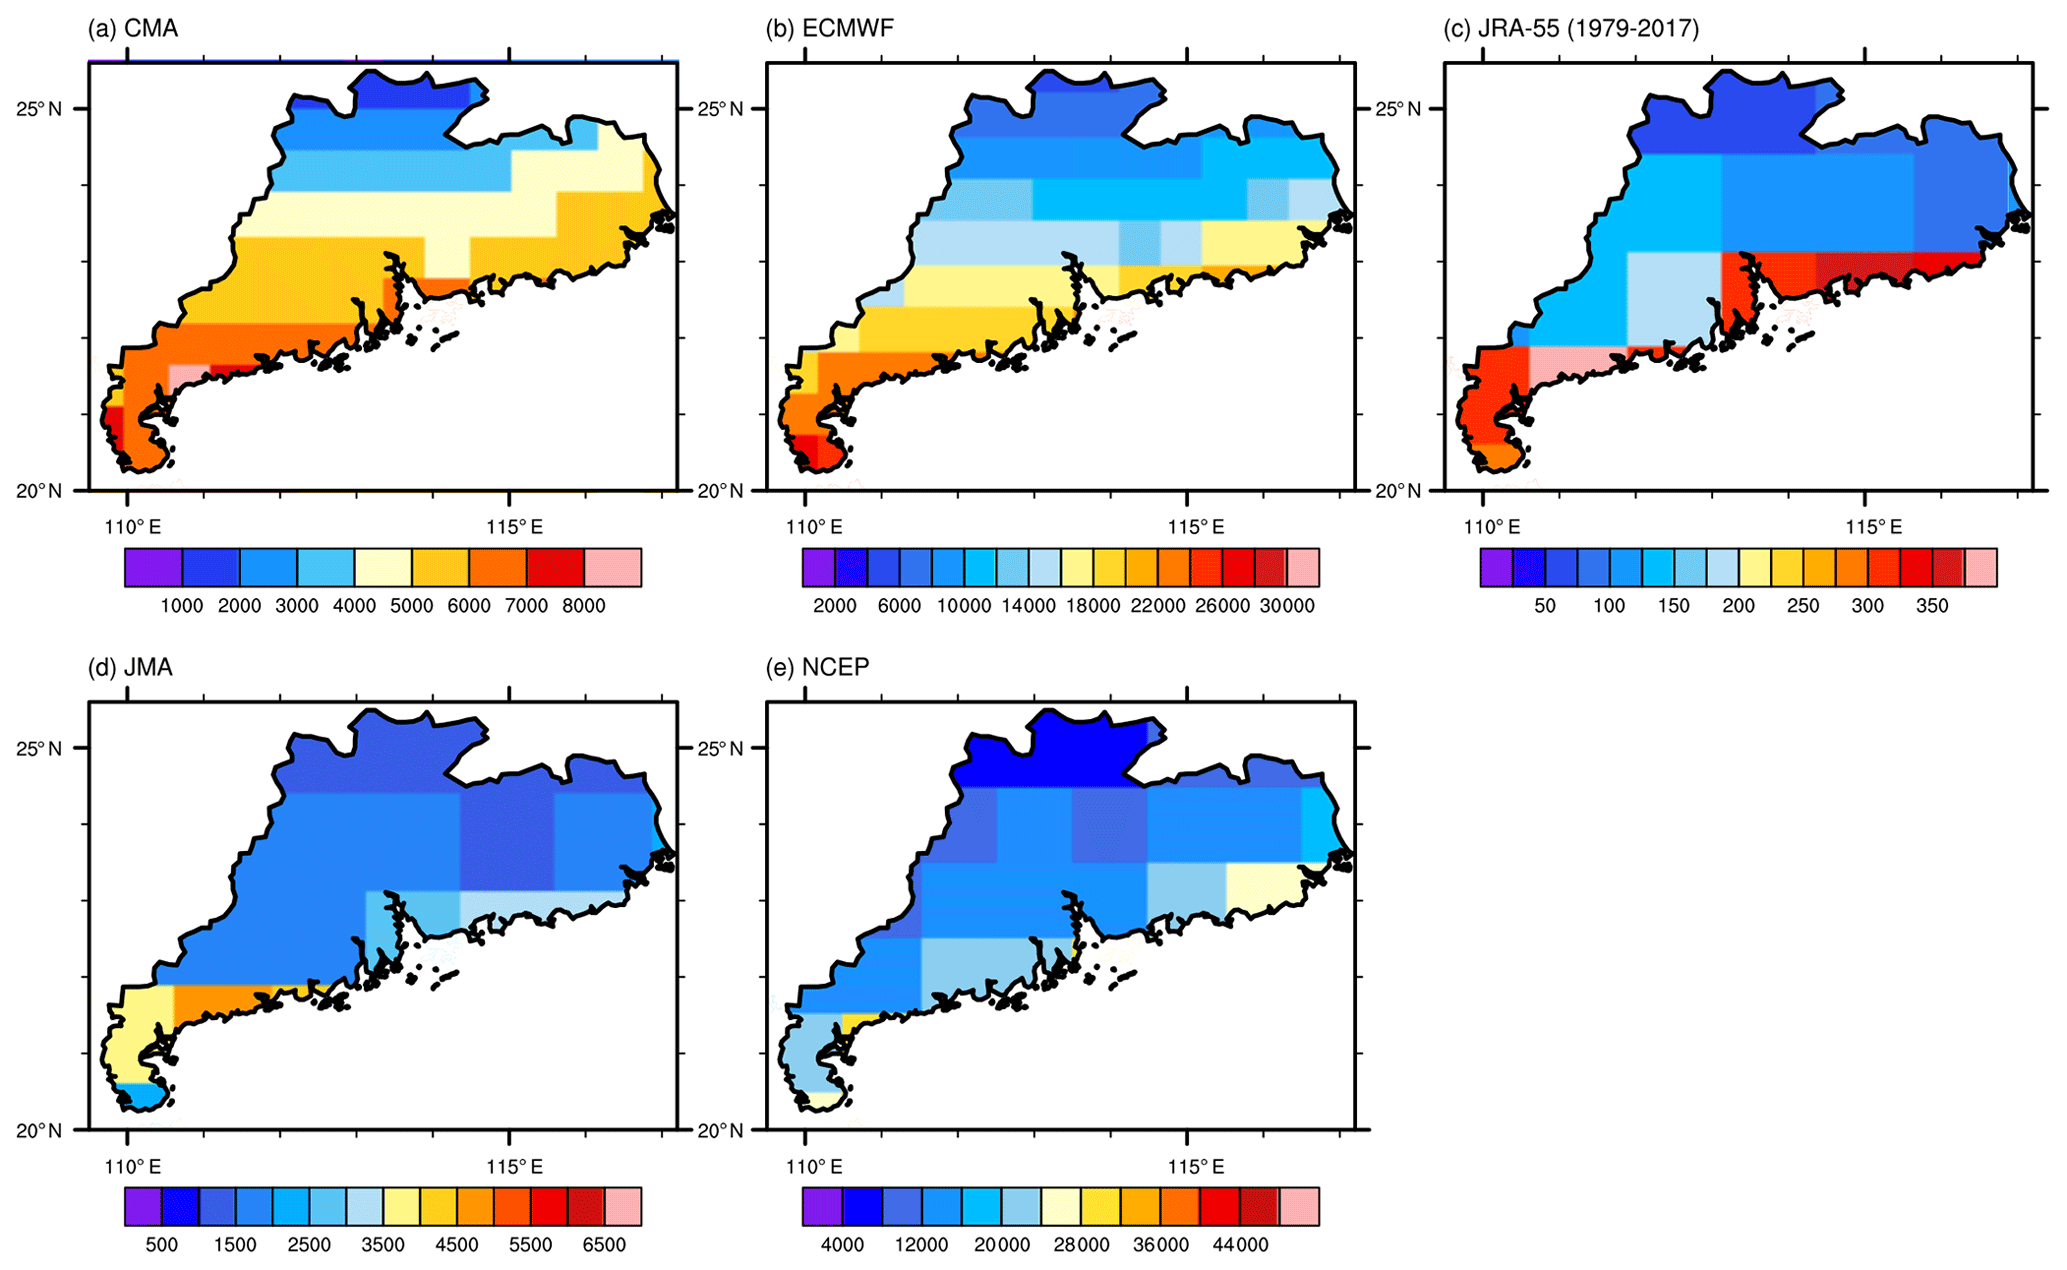
Figure 10The number of TC-related 6-hourly data entries in each of the grid boxes in Guangdong Province, China, for the TPEPS TC event set and the JRA-55 event set.
Four surface observation stations are chosen for this demonstration. They are Baiyun International Airport (BAIYUN INTL; 23.392∘ N, 113.299∘ E; from 1945 to 2019), Bao'an International Airport (BAOAN INTL; 22.639∘ N, 113.811∘ E; from 1957 to 2019), Shanwei (22.783∘ N, 115.367∘ E; from 1956 to 2019), and Shangchuan Dao (21.733∘ N, 112.767∘ E; from 1959 to 2019). For each selected surface station, the grid box of each EPS that corresponds to the surface station is identified (Fig. 11). The resolution of models is known to be a factor that limits the wind speed of TCs (Bengtsson et al., 2007). This means that for the same TC, the associated wind speed would be lower in low-resolution models and higher for high-resolution models. In order to utilise the extreme wind information from EPSs with different resolutions, the cube of the 98th percentile relative exceedance of wind speed (EXCE) is used. Since EXCE is a ratio, it is a resolution-independent quantity, and the tail behaviours of the EXCE distribution for these models are similar, which is in agreement with Osinski et al. (2016). Information from different models can be combined using EXCE. EXCE entries, which correspond to TCs in the TPEPS TC event set, are extracted for those grid boxes. This forms a set of “observations” of the impacts of high-impact TCs at those grid boxes in the model space. We assume all of the EXCE entries are independent and identically distributed (iid) random variables. This is a reasonable assumption due to the fast moving nature of TCs, diverse possible direction of the movement of wind field, and rapid decay of wind field over land for a 6 h interval; local observations often have only one extreme wind observation for a TC event. In order to translate this information to the physical world, quantile mapping is used for mapping EXCE to the observed surface wind speed which exceeded the local climatological 98th percentile. Historical in situ surface wind data are obtained from the Integrated Surface Database (ISD) (Smith et al., 2011). Quantile mapping is done using the R package qmap (Gudmundsson et al., 2012; Gudmundsson, 2016). Due to different geographic configurations and the climatology of each in situ observation station, different quantile mapping strategies have been employed. The optimal strategy is chosen based on the minimisation of the root-mean-square error (RMSE) of the quantile mapping output (see Gudmundsson, 2016, for more details). Using the above information, the return-period return level plot (using threshold exceedance approach) is constructed using the R package extRemes (Gilleland and Katz, 2016). For detailed discussions on the calculation of the return period and return level, readers are referred to Elsner et al. (2006), Jagger and Elsner (2006), and Gilleland and Katz (2016). Figure 12 shows the return-period return level plots of four selected stations which are derived using our proposed approach with the TPEPS TC event set and using in situ observational data. The width of the 95 % confidence interval which is calculated using our proposed approach is much sharper than the 95 % confidence interval which is calculated using in situ observational data. In other words, the uncertainty can be reduced by using the TPEPS TC event set because more observations are used in the calculation.
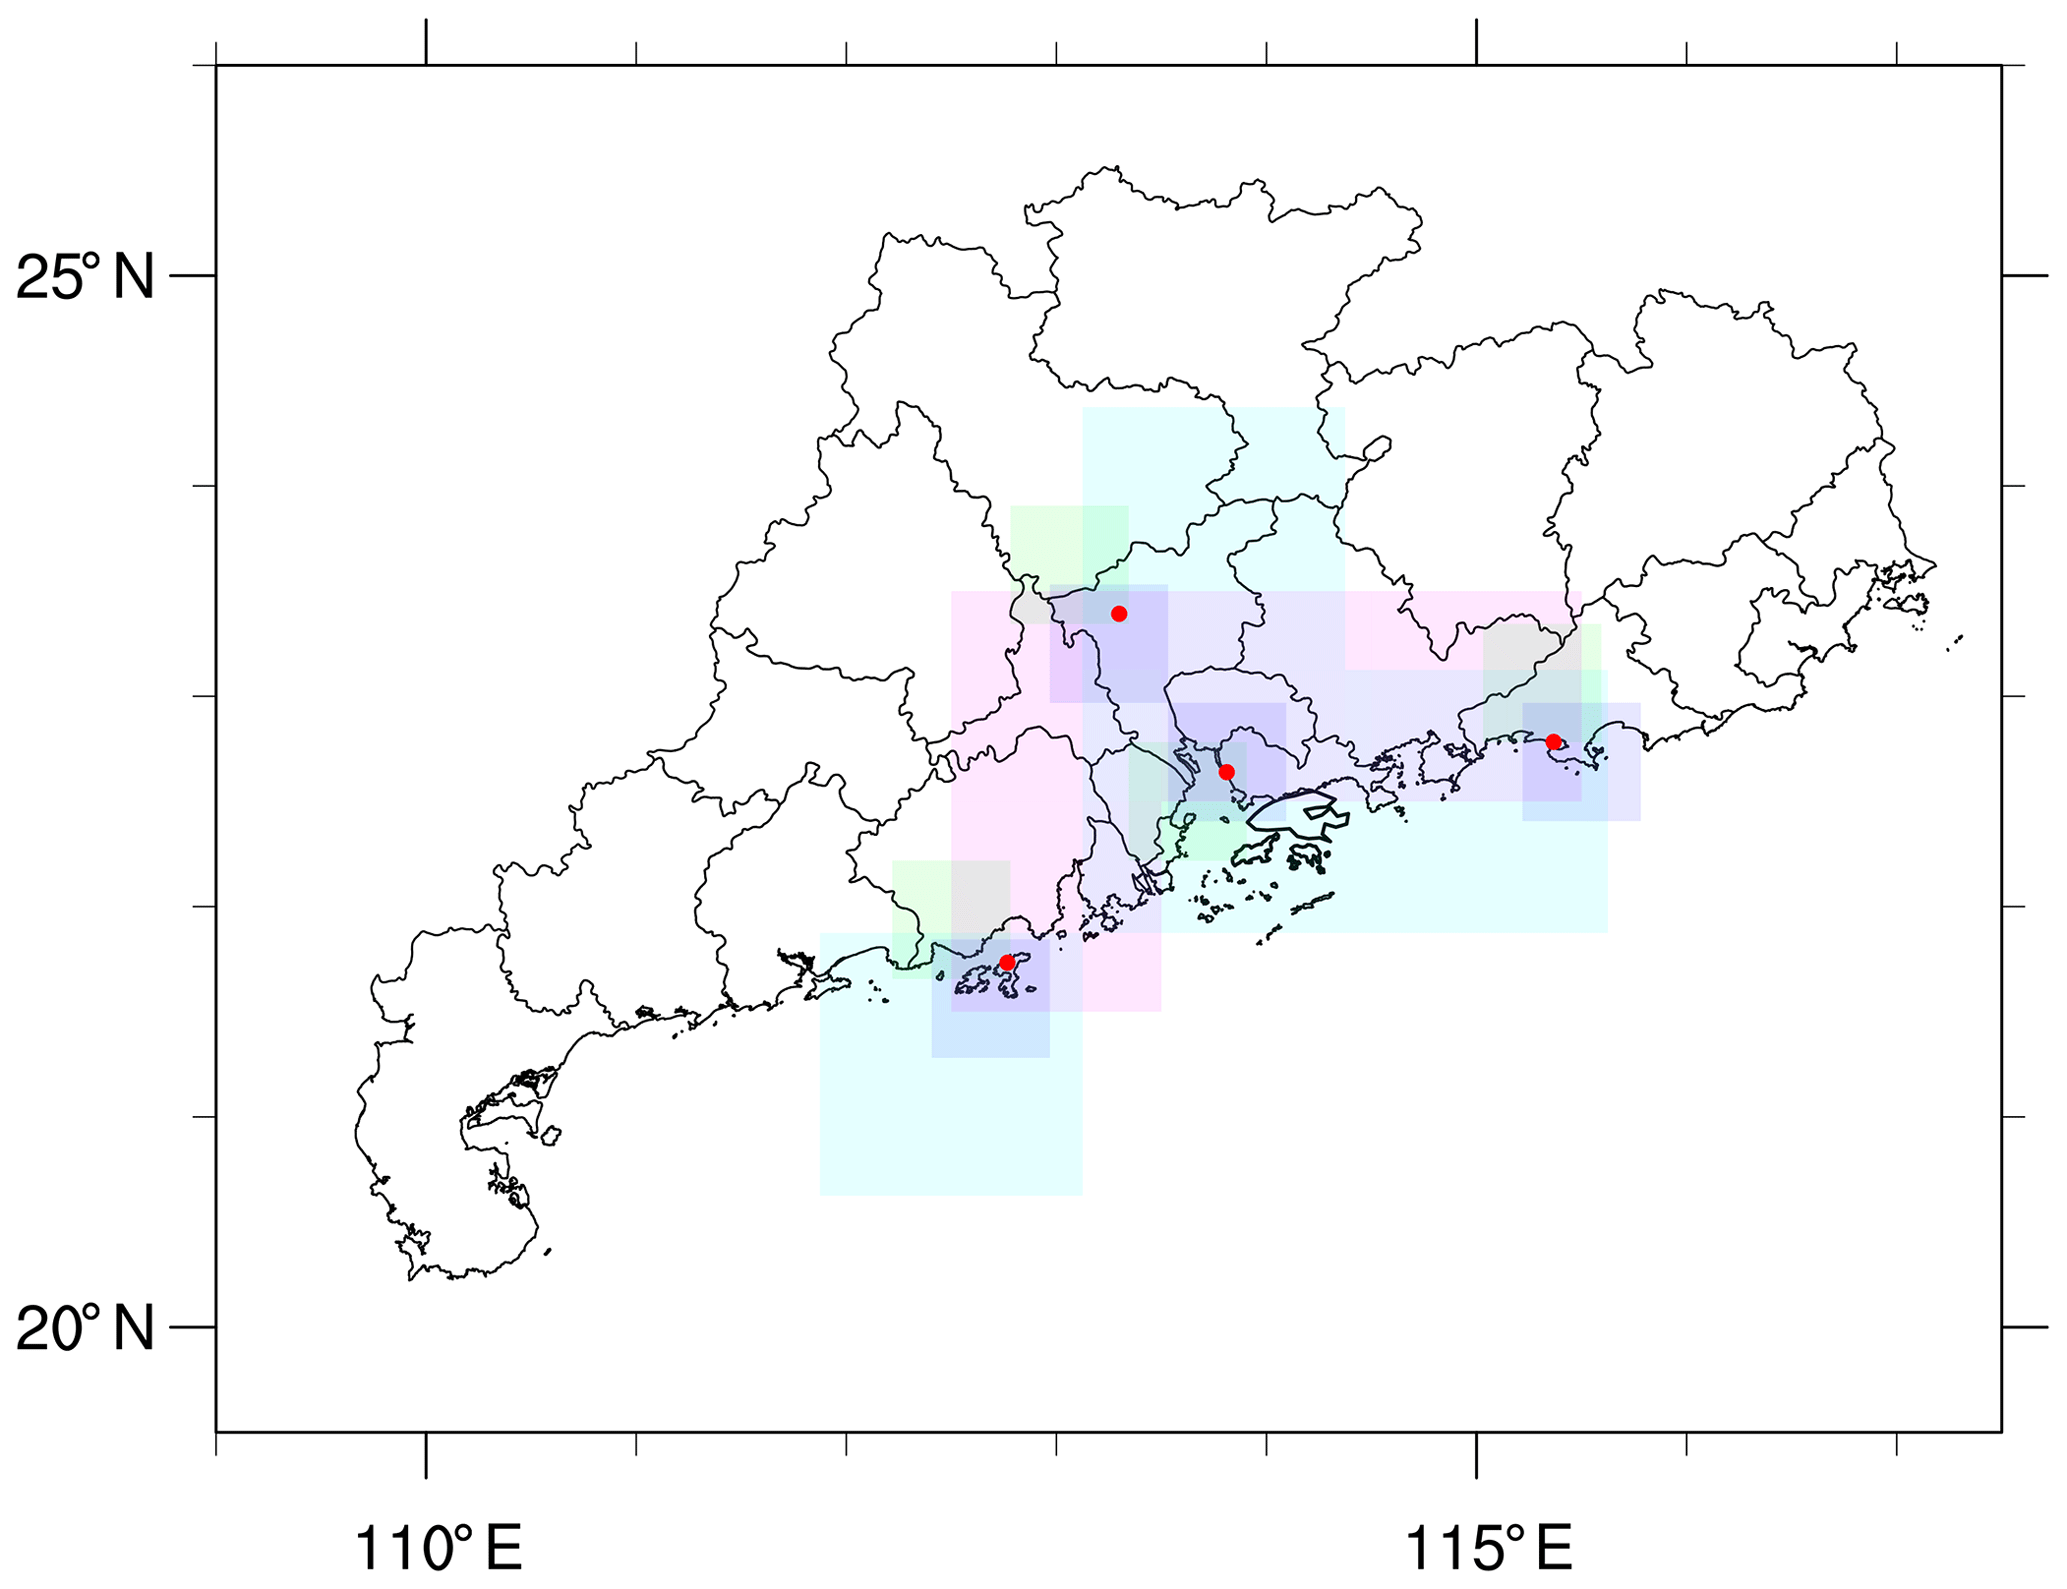
Figure 11Locations of the selected surface observation stations (red dots) in Guangdong, China, with corresponding grid boxes from four EPS outputs: CMA (green), ECMWF (blue), JMA (cyan), and NCEP (magenta). Information of prefectural boundaries is obtained from GADM version 3.6 level 2 (available at https://gadm.org/data.html, last access: 25 September 2018).
t

Figure 12Return-period return level plots for four selected surface observation stations: Baiyun International Airport, Bao'an International Airport, Shanwei, and Shangchuan Dao. Black lines indicate the best estimate of return-period return level. Blue lines indicate the 95 % confidence interval calculated using the TIGGE PEPS event set. Grey lines indicate the 95 % confidence interval calculated using in situ observations.
The above application of the TPEPS TC event set can provide crucial information for the DRR community. As discussed in the introduction, typhoon parametric insurance can be an effective financial instrument for typhoon risk transfer. However, an effective typhoon parametric insurance requires a robust trigger point which is determined by the meteorological information, e.g. wind speed. If the trigger point is too high, disbursements would not be made even if a catastrophic meteorological disaster had occurred, i.e. under-compensation; if the trigger point is too low, disbursements would be made even if no catastrophic event had occurred. Using the TPEPS TC event set, the estimated return period has smaller uncertainty than the estimation made by in situ observational data such that an optimal trigger point for typhoon parametric insurance can be determined.
In this study, a new and efficient method which addresses the critical issue in typhoon risk assessments – a robust methodology to determine the real frequency of TC occurrence with high socio-economic impact potential by constructing a physically consistent TC event set – is presented. This is achieved by applying an objective impact-oriented windstorm identification algorithm, WiTRACK, to a 6-hourly, 10 m horizontal wind field of a selected ensemble data set from a multi-centre grand ensemble data archive, TIGGE. While WiTRACK identifies major events based on one meteorological variable only, it is capable of identifying events of general loss relevance, as demonstrated by Befort et al. (2020). This implies the event set generated by our approach is in principle suitable for general TC risk assessments, as well as for an assessment of the hazards frequency–intensity distribution specifically. Several sensitivity tests with different parameter settings are done using JRA-55 data to obtain the optimal set-up for WiTRACK. Since WiTRACK can identify all types of windstorm events, four post-processing procedures are used to identify PEPS TCs; these procedures include a geographic filter and logistics regression classifier. The TPEPS event set has the climatological spatial and temporal pattern of TCs which match the historical climatological pattern of TCs in the WNP. More than 302, 102, and 77 times more TYs, VSTYs, and VTYs, respectively, are found in the TPEPS TC event set in comparison to the IBTrACS record. A robust representation of extreme TC events in the WNP can be obtained using the TPEPS TC event set because of the high number of physically consistent extreme events. Consequently, a robust hazard assessment of land-affecting TCs in the WNP can be produced using the event set constructed by this new method. Furthermore, the return period of typhoon-related extreme wind events, e.g. Typhoon Haiyan (2013) and Typhoon Mangkhut (2018), can be determined with sharper confidence intervals in a similar manner as Walz and Leckebusch (2019). As a result, policymakers and related stakeholders can improve the current typhoon-related disaster reduction and mitigation strategy. Furthermore, a robust trigger point for parametric typhoon hazard insurance can be determined using our proposed approach by reducing the uncertainty of the estimated return period of a meteorological extreme event. This will improve the suitability and flexibility of parametric insurance for DRR applications. Consequently, this will improve the speed of post-disaster recovery.
The TC event set constructed using the method described in this study has several unique properties in comparison to the TC event set constructed by other methods (Vickery et al., 2000; Emanuel et al., 2006; Rumpf et al., 2009; Kim and Lee, 2019).
- i.
Many methods in the literature (e.g. Emanuel et al., 2006; Rumpf et al., 2009) use historical best track data to construct a spatial probability function that determines the genesis location of synthetic TCs and a parametric track model that matches the historical observations to determine the movement of synthetic TCs. Consequently, these synthetic tracks are highly likely to be identified in the region where TCs were identified from the historical observations and highly rare in the regions where TCs were never identified but physically possible. In contrast, TPEPS TCs are detected at any physically possible location over the WNP. This means that besides the events, which are similar to the historical observations, the TPEPS TC event set also includes events that occur in the regions where no historical event was observed. Consequently, the TPEPS TC event set provides an important and unique advantage for typhoon hazard assessment. In comparison to other methods to generate large TC event sets, our specific approach is limited mainly by the source of data used. The current TC event set constructed using medium-range forecasts archived in TIGGE is strictly speaking representative only for the current climate state. Any longer-term climate variability (e.g. multi-decadal fluctuations like the Pacific Decadal Oscillation, PDO) and its impacts on any TC frequency–intensity distribution are not accounted for in this setting. Nevertheless, the presented approach would be equally applicable to data sets representing that kind of variability on longer timescales (e.g. decadal predictions or transient climate model simulations).
- ii.
In the literature, the structure of the wind field of synthetic TCs follows a predefined, analytical model, e.g. parametric vortex structure developed by Holland (1980) or modified Rankine vortex. For the TPEPS TC event set, complex physical processes in GCMs determine the structure of the wind field of TCs; therefore, the structure of the wind field of TCs is realistic. This is an advantage for robust wind hazard assessment of land-affecting TCs because the resultant wind field includes the complex atmosphere–land interaction which depends on the local topography. Consequently, the TPEPS TC event set can be used as additional observations for the estimation of the return period of TC-related extreme wind, as demonstrated above.
- iii.
Many of the TC risk assessments are done based on wind risk and/or wind-induced coastal risk but not TC-related precipitation risk (Vickery et al., 2000; Emanuel et al., 2006; Rumpf et al., 2009; Mendelsohn et al., 2012; Mori and Takemi, 2016; Marsooli et al., 2019; Kim and Lee, 2019). A reason is that historical damage due to TC-related wind is much better documented than TC-related precipitation damage (Emanuel et al., 2006). However, damage due to TC-related precipitation, e.g. flooding, should not be ignored. Based on the pay-out of the National Flood Insurance Program of the United States for the flood event of Hurricane Ike (2008), Smith and Katz (2013) estimated the insured flood damage at USD 5.4 billion. Furthermore, some of the high-impact TCs in the WNP have a typical typhoon intensity, but the amount of rainfall is extremely high, e.g. Typhoon Morakot (2009) (Wu, 2012). Since precipitation is one of the output variables of these medium-range ensemble forecasts, precipitation-related impact can be examined by integrating the realistic precipitation information from forecast outputs into the TPEPS TC event set. In addition, a spatial distribution of TC-related hazards, e.g. extreme wind and extreme precipitation, of the TPEPS TC event set can be constructed using the notion of TC hazard footprint (Chen et al., 2018). Consequently, a more thorough typhoon risk assessment can be achieved. This is currently under our investigation.
In conclusion, the event set that we have constructed contains all necessary information for applications in the DRR context. This event set can improve the hazard component in an overall assessment of integrated TC risks (e.g. Sajjad and Chan, 2019) by providing a robust probability of occurrence of extreme TC events. Furthermore, using this event set, a robust trigger points of parametric insurance for the local hazards can be determined. Once such trigger points for the local hazards are available (including their uncertainty), the targeted application of parametric insurance products in disaster relief application is possible, especially when it comes to the evaluation of the basic risk. This study is merely the first step toward a statistically robust, full physical-model-based TC hazard assessment. The impact of TC-related extreme precipitation and storm surges can be integrated following the approach developed by Befort et al. (2015).
JRA-55 (Kobayashi et al., 2015) and ERA-I (Dee et al., 2011) are freely available for academic use at the UCAR Research Data Archive: for JRA55: https://doi.org/10.5065/D6HH6H41 (JMA, 2013) and for ERA-I (https://doi.org/10.5065/D64747WN) (ECMWF, 2012). The TIGGE data set (Bougeault et al., 2010; Swinbank et al., 2015) used in this study can be accessed through the ECMWF server: https://apps.ecmwf.int/datasets/data/tigge/levtype=sfc/type=pf/ (last access: 13 June 2019) (ECMWF, 2019). IBTrACS (Knapp et al., 2010) and ISD (Smith et al., 2011) are available at the United States National Centers for Environmental Information, National Oceanic and Atmospheric Administration: https://www.ncdc.noaa.gov/ibtracs/index.php (last access: 19 September 2018) (Knapp et al., 2018) and https://www.ncdc.noaa.gov/isd (last access: 15 March 2020) (NCEI, 2020), respectively. JTWC best track data used in this study are obtained from the United States Navy website: https://www.metoc.navy.mil/jtwc/jtwc.html?best-tracks (last access: 12 February 2019) (JTWC, 2019).
KSN and GCL originated the idea, developed the methodology, performed data analysis, and wrote the paper.
The authors declare that they have no conflict of interest.
The authors thank three reviewers for their helpful and constructive comments. The authors thank Daniel Befort and Michael Angus for valuable discussions. This work was supported by the Building Resilience to Natural Disasters using Financial Instruments grant INPAIS (Integrated Threshold Development for Parametric Insurance Solutions for Guangdong Province China; grant ref: NE/R014264/1) through the Natural Environment Research Council (NERC). The computations described in this paper were performed using the BlueBEAR HPC service at the University of Birmingham.
This research has been supported by the Natural Environment Research Council (grant no. NE/R014264/1).
This paper was edited by Piero Lionello and reviewed by three anonymous referees.
Befort, D. J., Fischer, M., Leckebusch, G. C., Ulbrich, U., Ganske, A., Rosenhagen, G., and Heinrich, H.: Identification of storm surge events over the German Bight from atmospheric reanalysis and climate model data, Nat. Hazards Earth Syst. Sci., 15, 1437–1447, https://doi.org/10.5194/nhess-15-1437-2015, 2015.
Befort, D. J., Kruschke, T., and Leckebusch, G. C.: Objective identification of potentially damaging tropical cyclones over the Western North Pacific, Environ. Res. Commun., 2, 031005, https://doi.org/10.1088/2515-7620/ab7b35, 2020.
Belanger, J. I., Webster, P. J., Curry, J. A., and Jelinek, M. T.: Extended Prediction of North Indian Ocean Tropical Cyclones, Weather Forecast., 27, 757–769, https://doi.org/10.1175/WAF-D-11-00083.1, 2012.
Bell, R., Strachan, J., Vidale, P. L., Hodges, K., and Roberts, M.: Response of Tropical Cyclones to Idealized Climate Change Experiments in a Global High-Resolution Coupled General Circulation Model, J. Climate, 26, 7966–7980, https://doi.org/10.1175/JCLI-D-12-00749.1, 2013.
Bengtsson, L., Hodges, K. I., and Esch, M.: Tropical cyclones in a T159 resolution global climate model: Comparison with observations and re-analyses, Tellus A, 59, 396–416, 2007.
Bougeault, P., Toth, Z., Bishop, C., Brown, B., Burridge, D., Chen, D. H., Ebert, B., Fuentes, M., Hamill, T. M., Mylne, K., Nicolau, J., Paccagnella, T., Park, Y.-Y., Parsons, D., Raoult, B., Schuster, D., Dias, P. S., Swinbank, R., Takeuchi, Y., Tennant, W., Wilson, L., and Worley, S.: The THORPEX Interactive Grand Global Ensemble, B. Am. Meteorol. Soc., 91, 1059–1072, https://doi.org/10.1175/2010BAMS2853.1, 2010.
Buckingham, C., Marchok, T., Ginis, I., Rothstein, L., and Rowe, D.: Short- and Medium-Range Prediction of Tropical and Transitioning Cyclone Tracks within the NCEP Global Ensemble Forecasting System, Weather Forecast., 25, 1736–1754, https://doi.org/10.1175/2010WAF2222398.1, 2010.
Camargo, S. J., Barnston, A. G., and Zebiak, S. E.: A statistical assessment of tropical cyclone activity in atmospheric general circulation models, Tellus A, 57, 589–604, https://doi.org/10.1111/j.1600-0870.2005.00117.x, 2005.
Camp, J., Roberts, M., MacLachlan, C., Wallace, E., Hermanson, L., Brookshaw, A., Arribas, A., and Scaife, A. A.: Seasonal forecasting of tropical storms using the Met Office GloSea5 seasonal forecast system, Q. J. Roy. Meteorol. Soc., 141, 2206–2219, https://doi.org/10.1002/qj.2516, 2015.
Chan, J. C. L.: Movement of Tropical Cyclones, in: Global Perspectives on Tropical Cyclones, World Scientific Series on Asia-Pacific Weather and Climate, Volume 4, World Scientific, Singapore, 133–148, 2010.
Chan, K. T. F. and Chan, J. C. L.: Size and Strength of Tropical Cyclones as Inferred from QuikSCAT Data, Mon. Weather Rev., 140, 811–824, https://doi.org/10.1175/MWR-D-10-05062.1, 2011.
Chen, W., Lu, Y., Sun, S., Duan, Y., and Leckebusch, G. C.: Hazard Footprint-Based Normalization of Economic Losses from Tropical Cyclones in China During 1983–2015, Int. J. Disast. Risk Sci., 9, 195–206, https://doi.org/10.1007/s13753-018-0172-y, 2018.
CMA – China Meteorological Administration: Member report, in: ESCAP/WMO Typhoon Committee 13th Integrated Workshop, Chiang Mai, Thailand, 36 pp., 2018.
Dee, D. P., Uppala, S. M., Simmons, A. J., Berrisford, P., Poli, P., Kobayashi, S., Andrae, U., Balmaseda, M. A., Balsamo, G., Bauer, P., Bechtold, P., Beljaars, A. C. M., van de Berg, L., Bidlot, J., Bormann, N., Delsol, C., Dragani, R., Fuentes, M., Geer, A. J., Haimberger, L., Healy, S. B., Hersbach, H., Hólm, E. V., Isaksen, L., Kållberg, P., Köhler, M., Matricardi, M., McNally, A. P., Monge-Sanz, B. M., Morcrette, J. J., Park, B. K., Peubey, C., de Rosnay, P., Tavolato, C., Thépaut, J. N., and Vitart, F.: The ERA-Interim reanalysis: configuration and performance of the data assimilation system, Q. J. Roy. Meteorol. Soc., 137, 553–597, https://doi.org/10.1002/qj.828, 2011.
Desai, B., Maskrey, A., Peduzzi, P., De Bono, A., and Herold, C.: Making Development Sustainable: The Future of Disaster Risk Management, Global Assessment Report on Disaster Risk Reduction, UNISDR – United Nations Office for Disaster Risk Reduction, Geneva, Switzerland, 2015.
ECMWF: ERA-Interim Project, Single Parameter 6-Hourly Surface Analysis and Surface Forecast Time Series, Research Data Archive at the National Center for Atmospheric Research, Computational and Information Systems Laboratory, https://doi.org/10.5065/D64747WN, 2012.
ECMWF: The TIGGE dataset, available at: https://apps.ecmwf.int/datasets/data/tigge/levtype=sfc/type=pf/, last access: 13 June 2019.
Elsner, J. B., Jagger, T. H., and Tsonis, A. A.: Estimated return periods for Hurricane Katrina, Geophys. Res. Lett., 33, L08704, https://doi.org/10.1029/2005GL025452, 2006.
Emanuel, K.: Climate and tropical cyclone activity: A new model downscaling approach, J. Climate, 19, 4797–4802, https://doi.org/10.1175/Jcli3908.1, 2006.
Emanuel, K., Ravela, S., Vivant, E., and Risi, C.: A statistical deterministic approach to hurricane risk assessment, B. Am. Meteorol. Soc., 87, 299–314, https://doi.org/10.1175/Bams-87-3-299, 2006.
Gilleland, E., and Katz, R. W.: extRemes 2.0: An Extreme Value Analysis Package in R, J. Stat. Softw., 72, 1–39, https://doi.org/10.18637/jss.v072.i08, 2016.
Glauber, J. W.: Crop Insurance Reconsidered, Am. J. Agricult. Econ., 86, 1179–1195, https://doi.org/10.1111/j.0002-9092.2004.00663.x, 2004.
Gray, W. M.: Tropical Cyclone Genesis in the Western North Pacific, J. Meteorol. Soc. Jpn., 55, 465–482, 1977.
Gudmundsson, L.: qmap: Statistical transformations for post-processing climate model output, R package version 1.0-4, CRAN [code], available at: https://cran.r-project.org/web/packages/qmap/index.html (last access: 29 November 2018), 2016.
Gudmundsson, L., Bremnes, J. B., Haugen, J. E., and Engen-Skaugen, T.: Technical Note: Downscaling RCM precipitation to the station scale using statistical transformations – a comparison of methods, Hydrol. Earth Syst. Sci., 16, 3383–3390, https://doi.org/10.5194/hess-16-3383-2012, 2012.
Halperin, D. J., Fuelberg, H. E., Hart, R. E., Cossuth, J. H., Sura, P., and Pasch, R. J.: An Evaluation of Tropical Cyclone Genesis Forecasts from Global Numerical Models, Weather Forecast., 28, 1423–1445, https://doi.org/10.1175/WAF-D-13-00008.1, 2013.
Hamill, T. M., Whitaker, J. S., Fiorino, M., and Benjamin, S. G.: Global Ensemble Predictions of 2009's Tropical Cyclones Initialized with an Ensemble Kalman Filter, Mon. Weather Rev., 139, 668–688, https://doi.org/10.1175/2010MWR3456.1, 2010.
Hart, R. E.: A cyclone phase space derived from thermal wind and thermal asymmetry, Mon. Weather Rev., 131, 585–616, https://doi.org/10.1175/1520-0493(2003)131<0585:Acpsdf>2.0.Co;2, 2003.
Hastie, T., Tibshirani, R., and Friedman, J.: The Elements of Statistical Learning, Springer Series in Statistics, Springer-Verlag, New York, 745 pp., 2009.
Holland, G. J.: An Analytic Model of the Wind and Pressure Profiles in Hurricanes, Mon. Weather Rev., 108, 1212–1218, https://doi.org/10.1175/1520-0493(1980)108<1212:AAMOTW>2.0.CO;2, 1980.
IPCC: Managing the risks of extreme events and disasters to advance climate change adaptation, in: A special report of Working Groups I and II of the Intergovernmental Panel on Climate Change, Cambridge, 2012.
Jagger, T. H. and Elsner, J. B.: Climatology Models for Extreme Hurricane Winds near the United States, J. Climate, 19, 3220–3236, https://doi.org/10.1175/JCLI3913.1, 2006.
Jing, R. and Lin, N.: An Environment-Dependent Probabilistic Tropical Cyclone Model, J. Adv. Model. Earth Syst., 12, e2019MS001975, https://doi.org/10.1029/2019MS001975, 2020.
JMA: JRA-55: Japanese 55-year Reanalysis, Daily 3-Hourly and 6-Hourly Data, Research Data Archive at the National Center for Atmospheric Research, Computational and Information Systems Laboratory, https://doi.org/10.5065/D6HH6H41, 2013.
JTWC: Best Track Archive, available at: https://www.metoc.navy.mil/jtwc/jtwc.html?best-tracks, last access: 12 February 2019.
Kim, G. Y. and Lee, S.: Prediction of extreme wind by stochastic typhoon model considering climate change, J. Wind Eng. Indust. Aerodynam., 192, 17–30, https://doi.org/10.1016/j.jweia.2019.05.003, 2019.
Knapp, K. R., Kruk, M. C., Levinson, D. H., Diamond, H. J., and Neumann, C. J.: The International Best Track Archive for Climate Stewardship (IBTrACS) Unifying Tropical Cyclone Data, B. Am. Meteorol. Soc., 91, 363–376, https://doi.org/10.1175/2009bams2755.1, 2010.
Knapp, K. R., Kruk, M. C., Levinson, D. H., Diamond, H. J., and Neumann, C. J.: International Best Track Archive for Climate Stewardship (IBTrACS) data, available at: https://www.ncdc.noaa.gov/ibtracs/index.php, last access: 19 September 2018.
Kobayashi, S., Ota, Y., Harada, Y., Ebita, A., Moriya, M., Onoda, H., Onogi, K., Kamahori, H., Kobayashi, C., Endo, H., Miyaoka, K., and Takahashi, K.: The JRA-55 Reanalysis: General Specifications and Basic Characteristics, J. Meteorol. Soc. Jpn. Ser. II, 93, 5–48, https://doi.org/10.2151/jmsj.2015-001, 2015.
Kruschke, T.: Winter wind storms: Identification, verification of decadal predictions, and regionalization, Doktors der Naturwissenschaften, Institut für Meteorologie, Freie Universität Berlin, Berlin, 181 pp., 2015.
Kuhn, M., Wing, J., Weston, S., Williams, A., Keefer, C., Engelhardt, A., Cooper, T., Mayer, Z., Kenkel, B., Benesty, M., Lescarbeau, R., Ziem, A., Scrucca, L., Tang, Y., Candan, C., and Hunt, T.: Classification and Regression Training, R package version 6.0-84, GitHub [code], available at: https://github.com/topepo/caret/ (last access: 28 October 2019), 2018.
Leckebusch, G. C., Renggli, D., and Ulbrich, U.: Development and Application of an Objective Storm Severity Measure for the Northeast Atlantic Region, Meteorol. Z., 17, 575–587, https://doi.org/10.1127/0941-2948/2008/0323, 2008.
Lee, C.-S., Cheung, K. K. W., Fang, W.-T., and Elsberry, R. L.: Initial Maintenance of Tropical Cyclone Size in the Western North Pacific, Mon. Weather Rev., 138, 3207–3223, https://doi.org/10.1175/2010MWR3023.1, 2010.
Lee, C.-Y., Tippett, M. K., Sobel, A. H., and Camargo, S. J.: An Environmentally Forced Tropical Cyclone Hazard Model, J. Adv. Model. Earth Syst., 10, 223–241, https://doi.org/10.1002/2017MS001186, 2018.
Lemcke, G.: A resilient world: NatCat parametric insurance solutions for China's Provincial Government, in: Sigma event 2017: Catastrophes-Protecting the unisured, Solutions for a resilient world, 6–7 April 2017, Zurich, Switzerland, 2017.
Leonardo, N. M. and Colle, B. A.: Verification of Multimodel Ensemble Forecasts of North Atlantic Tropical Cyclones, Weather Forecast., 32, 2083–2101, https://doi.org/10.1175/WAF-D-17-0058.1, 2017.
Luitel, B., Villarini, G., and Vecchi, G. A.: Verification of the skill of numerical weather prediction models in forecasting rainfall from U.S. landfalling tropical cyclones, J. Hydrol., 556, 1026–1037, https://doi.org/10.1016/j.jhydrol.2016.09.019, 2018.
Magnusson, L., Bidlot, J.-R., Lang, S. T. K., Thorpe, A., Wedi, N., and Yamaguchi, M.: Evaluation of Medium-Range Forecasts for Hurricane Sandy, Mon. Weather Rev., 142, 1962–1981, https://doi.org/10.1175/MWR-D-13-00228.1, 2014.
Majumdar, S. J. and Torn, R. D.: Probabilistic Verification of Global and Mesoscale Ensemble Forecasts of Tropical Cyclogenesis, Weather Forecast., 29, 1181–1198, https://doi.org/10.1175/WAF-D-14-00028.1, 2014.
Marsooli, R., Lin, N., Emanuel, K., and Feng, K.: Climate change exacerbates hurricane flood hazards along US Atlantic and Gulf Coasts in spatially varying patterns, Nat. Commun., 10, 3785, https://doi.org/10.1038/s41467-019-11755-z, 2019.
Mendelsohn, R., Emanuel, K., Chonabayashi, S., and Bakkensen, L.: The impact of climate change on global tropical cyclone damage, Nat. Clim. Change, 2, 205–209, https://doi.org/10.1038/nclimate1357, 2012.
Mori, N. and Takemi, T.: Impact assessment of coastal hazards due to future changes of tropical cyclones in the North Pacific Ocean, Weather Clim. Ext., 11, 53–69, https://doi.org/10.1016/j.wace.2015.09.002, 2016.
Murakami, H.: Tropical cyclones in reanalysis data sets, Geophys. Res. Lett., 41, 2133–2141, https://doi.org/10.1002/2014GL059519, 2014.
NCEI – National Centers for Environmental Information: The Integrated Surface Database, available at: https://www.ncdc.noaa.gov/isd, last access: 15 March 2020.
Nolan, D. S.: What is the trigger for tropical cyclogenesis?, Aust. Meteorol. Mag., 56, 241–266, 2007.
Osinski, R., Lorenz, P., Kruschke, T., Voigt, M., Ulbrich, U., Leckebusch, G. C., Faust, E., Hofherr, T., and Majewski, D.: An approach to build an event set of European windstorms based on ECMWF EPS, Nat. Hazards Earth Syst. Sci., 16, 255–268, https://doi.org/10.5194/nhess-16-255-2016, 2016.
Ritchie, E. A. and Holland, G. J.: Scale interactions during the formation of Typhoon Irving, Mon. Weather Rev., 125, 1377–1396, 1997.
Roberts, M. J., Camp, J., Seddon, J., Vidale, P. L., Hodges, K., Vanniere, B., Mecking, J., Haarsma, R., Bellucci, A., Scoccimarro, E., Caron, L.-P., Chauvin, F., Terray, L., Valcke, S., Moine, M.-P., Putrasahan, D., Roberts, C., Senan, R., Zarzycki, C., and Ullrich, P.: Impact of Model Resolution on Tropical Cyclone Simulation Using the HighResMIP–PRIMAVERA Multimodel Ensemble, J. Climate, 33, 2557–2583, https://doi.org/10.1175/JCLI-D-19-0639.1, 2020.
Rumpf, J., Weindl, H., Höppe, P., Rauch, E., and Schmidt, V.: Stochastic modelling of tropical cyclone tracks, Math. Meth. Oper. Res., 66, 475–490, https://doi.org/10.1007/s00186-007-0168-7, 2007.
Rumpf, J., Weindl, H., Höppe, P., Rauch, E., and Schmidt, V.: Tropical cyclone hazard assessment using model-based track simulation, Nat. Hazards, 48, 383–398, https://doi.org/10.1007/s11069-008-9268-9, 2009.
Sajjad, M. and Chan, J. C. L.: Risk assessment for the sustainability of coastal communities: A preliminary study, Sci. Total Environ., 671, 339–350, https://doi.org/10.1016/j.scitotenv.2019.03.326, 2019.
Shi, P.: On the role of government in integrated disaster risk governance – Based on practices in China, Int. J. Disast. Risk Sci., 3, 139–146, https://doi.org/10.1007/s13753-012-0014-2, 2012.
Smith, A., Lott, N., and Vose, R.: The Integrated Surface Database: Recent Developments and Partnerships, B. Am. Meteorol. Soc., 92, 704–708, https://doi.org/10.1175/2011BAMS3015.1, 2011.
Smith, A. B. and Katz, R. W.: US billion-dollar weather and climate disasters: data sources, trends, accuracy and biases, Nat. Hazards, 67, 387–410, https://doi.org/10.1007/s11069-013-0566-5, 2013.
Strachan, J., Vidale, P. L., Hodges, K., Roberts, M., and Demory, M.-E.: Investigating Global Tropical Cyclone Activity with a Hierarchy of AGCMs: The Role of Model Resolution, J. Climate, 26, 133–152, https://doi.org/10.1175/JCLI-D-12-00012.1, 2013.
Sun, B., Guo, C., and Cornelis van Kooten, G.: Hedging weather risk for corn production in Northeastern China: The efficiency of weather-indexed insurance, Agricult. Finance Rev., 74, 555–572, https://doi.org/10.1108/AFR-01-2014-0001, 2014.
Swinbank, R., Kyouda, M., Buchanan, P., Froude, L., Hamill, T. M., Hewson, T. D., Keller, J. H., Matsueda, M., Methven, J., Pappenberger, F., Scheuerer, M., Titley, H. A., Wilson, L., and Yamaguchi, M.: The TIGGE Project and Its Achievements, B. Am. Meteorol. Soc., 97, 49–67, https://doi.org/10.1175/BAMS-D-13-00191.1, 2015.
Swiss Re: Natural catastrophes and man-made disasters in 2015: Asia suffers substantial losses, available at: https://reliefweb.int/sites/reliefweb.int/files/resources/sigma1_2016_en.pdf (last access: 9 December 2019), 2016.
Vickery, P. J., Skerlj, P. F., and Twisdale, L. A.: Simulation of Hurricane Risk in the U.S. Using Empirical Track Model, J. Struct. Eng., 126, 1222–1237, https://doi.org/10.1061/(ASCE)0733-9445(2000)126:10(1222), 2000.
Vitart, F., Prates, F., Bonet, A., and Sahin, C.: New tropical cyclone products on the web, in: ECMWF Newsletter, ECMWF, Reading, England, 17–23, https://doi.org/10.21957/ti1191e2, 2012.
Walz, M. A. and Leckebusch, G. C.: Loss potentials based on an ensemble forecast: How likely are winter windstorm losses similar to 1990?, Atmos. Sci. Lett., 20, e891, https://doi.org/10.1002/asl.891, 2019.
WMO: Typhoon Committee Operational Manual, World Meteorological Organization, Geneva, Switzerland, 2019.
Wu, C.-C.: Typhoon Morakot: Key Findings from the Journal TAO for Improving Prediction of Extreme Rains at Landfall, B. Am. Meteorol. Soc., 94, 155–160, https://doi.org/10.1175/BAMS-D-11-00155.1, 2012.
Xu, W., Qi, L., Du, Y., and Xia, L.: Analysis on Abnormal Tropical Cyclone Track Forecast Error of Ecmwf-Ifs in the Western North Pacific, Trop. Cycl. Res. Rev., 5, 12–22, https://doi.org/10.6057/2016TCRRh1.02, 2016.
Yamaguchi, M., Vitart, F., Lang, S. T. K., Magnusson, L., Elsberry, R. L., Elliott, G., Kyouda, M., and Nakazawa, T.: Global Distribution of the Skill of Tropical Cyclone Activity Forecasts on Short- to Medium-Range Time Scales, Weather Forecast., 30, 1695–1709, https://doi.org/10.1175/WAF-D-14-00136.1, 2015.
Ye, T., Wang, Y., Wu, B., Shi, P., Wang, M., and Hu, X.: Government Investment in Disaster Risk Reduction Based on a Probabilistic Risk Model: A Case Study of Typhoon Disasters in Shenzhen, China, Int. J. Disast. Risk Sci., 7, 123–137, https://doi.org/10.1007/s13753-016-0092-7, 2016.
Ye, T., Li, Y., Gao, Y., Wang, J., and Yi, M.: Designing index-based livestock insurance for managing snow disaster risk in Eastern Inner Mongolia, China, Int. J. Disast. Risk Reduct., 23, 160–168, https://doi.org/10.1016/j.ijdrr.2017.04.013, 2017.
Zhang, X., Chen, G., Yu, H., and Zeng, Z.: Verification of Ensemble Track Forecasts of Tropical Cyclones During 2014, Trop. Cycl. Res. Rev., 4, 79–87, https://doi.org/10.6057/2015TCRR02.04, 2015.