the Creative Commons Attribution 4.0 License.
the Creative Commons Attribution 4.0 License.
 | 16 Feb 2021
Facility for production of ambient-like model aerosols (PALMA) in the laboratory: application in the intercomparison of automated PM monitors with the reference gravimetric method
Stefan Horender
Kevin Auderset
Paul Quincey
Stefan Seeger
Søren Nielsen Skov
Kai Dirscherl
Thomas O. M. Smith
Katie Williams
Camille C. Aegerter
Daniel M. Kalbermatter
François Gaie-Levrel
Konstantina Vasilatou
A new facility has been developed which allows for a stable and reproducible production of ambient-like model aerosols (PALMA) in the laboratory. The set-up consists of multiple aerosol generators, a custom-made flow tube homogeniser, isokinetic sampling probes, and a system to control aerosol temperature and humidity. Model aerosols containing elemental carbon, secondary organic matter from the ozonolysis of α-pinene, inorganic salts such as ammonium sulfate and ammonium nitrate, mineral dust particles, and water were generated under different environmental conditions and at different number and mass concentrations. The aerosol physical and chemical properties were characterised with an array of experimental methods, including scanning mobility particle sizing, ion chromatography, total reflection X-ray fluorescence spectroscopy and thermo-optical analysis. The facility is very versatile and can find applications in the calibration and performance characterisation of aerosol instruments monitoring ambient air. In this study, we performed, as proof of concept, an intercomparison of three different commercial PM (particulate matter) monitors (TEOM 1405, DustTrak DRX 8533 and Fidas Frog) with the gravimetric reference method under three simulated environmental scenarios. The results are presented and compared to previous field studies. We believe that the laboratory-based method for simulating ambient aerosols presented here could provide in the future a useful alternative to time-consuming and expensive field campaigns, which are often required for instrument certification and calibration.


Atmospheric pollution by airborne particles significantly contributes to climate change and has been linked to respiratory and cardiovascular diseases and lung cancer (Fuzzi et al., 2015; Kim et al., 2015; WHO, 2013). It has been estimated that in Europe alone more than 500 000 deaths per year can be attributed to PM exposure, and that pollution hot spots of PM are responsible for a loss in life expectancy of up to 36 months (Fuzzi et al., 2015). For EU member states, air quality monitoring – as laid down in the Air Quality Directive 2008/50/EC (European Parliament, 2008, 2015) – is mandatory and comprises quantification of airborne particulate matter (PM) and some of its constituents. The most important regulated metric to monitor particulate air pollution is the mass concentration, or more specifically the total mass per unit volume of air of particulate matter which is small enough to pass through a size-selective inlet with a 50 % efficiency cut-off at 2.5 and 10 µm aerodynamic diameter, commonly referred to as PM2.5 and PM10 respectively. Ambient limit values for PM2.5 and PM10 have been established in Europe (European Parliament, 2008, 2015; FOEN, 2018), the USA (US-EPA, 2016) and other countries worldwide.
Regulatory bodies, air quality networks and atmospheric instrument manufacturers all strive to improve air quality monitoring, yet there is still a lack of metrological traceability in airborne PM measurements. PM mass concentration was established as the default metric of PM based on the assumption that mass measurements are straightforward; they can be performed with a conventional balance. The gravimetric filter-based reference methods for PM10 and PM2.5 are set out in the standards EN 12341:2014 (CEN/TC 264/WG-15, 2014) and EN 14907:2005; however, they fall short in areas such as time resolution and ongoing quality assurance and quality control to control the effects of semi-volatile particles and water absorption by particles, for example (CEN/TC 264/WG-15, 2014; Eisner and Wiener, 2002; Hauck et al., 2004; Zhu et al., 2007). The measurement uncertainties for PM mass concentration in the directive (European Parliament, 2008, 2015) are 25 %, and thus much higher than those for gaseous pollutants (typically 15 %).
Automatic PM monitoring systems were developed in order to avoid these drawbacks and enable time resolutions below 24 h (Schwab et al., 2006; Weingartner et al., 2011; Zhu et al., 2007); however, demonstrating their equivalence to the reference manual gravimetric method is time consuming and expensive (Hauck et al., 2004; Zhu et al., 2007). There are also inconsistencies in the automatic instruments based on different working principles (e.g. light scattering, beta absorption, oscillating microbalance) and the variations of the aerosols used for comparison. Ambient PM is not uniform with respect to chemical composition, particle size and shape. In most cases, PM does not refer to a single pollutant with a distinct chemical signature, but rather to a highly variable mixture of combustion particles, salts, mineral dust, organic substances and other materials (Hueglin et al., 2005; Putaud et al., 2010). Therefore, suitable standard calibration aerosols do not currently exist.
To date, automated PM instruments which are used for regulatory purposes (e.g. at national air quality monitoring stations) are tested for equivalence with the manual gravimetric reference method in monitoring sites using real ambient air (EC-WG, 2010; Hauck et al., 2004). This requires long and expensive testing campaigns at multiple sites during different times of the year in an attempt to include all representative meteorological conditions and the temporal and spatial variations of the ambient air composition. Portable and cost-effective PM monitors, such as the DustTrak (TSI Inc., USA) and Fidas Frog (Palas, Germany), which are mostly employed for industrial or occupational hygiene surveys (Asbach et al., 2018; Davison et al., 2019; Grzyb and Lenart-Boron, 2019), outdoor (Kingham et al., 2006; Viana et al., 2015; Wallace et al., 2011) and indoor (Chowdhury et al., 2013; Manibusan and Mainelis, 2020; Zhou et al., 2016) air quality investigations, process or emissions monitoring (Al-Attabi et al., 2017; Crilley et al., 2012; Grall et al., 2018; McNamara et al., 2011), and aerosol research studies, do not necessarily go through equivalence testing. Instead, they are often calibrated in the laboratory with simple model aerosols, e.g. with dust or salt particles (Hogrefe et al., 2004; Liu et al., 2017; Papapostolou et al., 2017; Schwab et al., 2004) or dried organic particles, such as sucrose and adipic acid (Zhang et al., 2018). Such model aerosols, however, are only partially representative of ambient air since they fail to account for carbonaceous particles and the complex organic matter, which constitute a considerable mass fraction of airborne particulates (Hueglin et al., 2005; Putaud et al., 2010). Light-scattering PM monitors are very sensitive to the aerosol size distribution, refractive index (i.e. chemistry) and humidity, and research findings suggest that a rigorous calibration with “tailored” aerosols, i.e. aerosols representative of the environment of their intended use, is needed (Jayaratne et al., 2020; McNamara et al., 2011).
The goal of this study was to develop a standardised laboratory-based calibration procedure for automatic PM-measuring instruments under well-controlled and reproducible experimental conditions. Multi-component model aerosols were generated in order to reproduce the main properties of real ambient air in terms of particle size distribution, chemical composition and number/mass concentration, including semi-volatility and hygroscopicity. The properties of ambient air, of course, may differ dramatically from place to place. Here, the main focus was on simulating aerosols encountered in Europe (Putaud et al., 2010), which are dominated by organic matter, inorganic ions (predominantly sulfate and nitrate, and to a lesser extent ammonium), carbonaceous particles (mostly from fossil fuel combustion rather than biomass burning), mineral dust and water.
Apart from the aerosol generation system (detailed below), the new set-up comprises a flow tube homogeniser and a system for reference gravimetric measurements. The facility is very versatile: the total PM mass concentration of the model aerosols can be adjusted in a range from a few micrograms per cubic metre up to about 500 µg m−3; the percentage fraction of each PM constituent can be tuned to simulate different urban, suburban or rural aerosols; and the aerosol temperature and relative humidity can be adjusted to simulate winter or summer-like environmental conditions. As a proof of concept, three different automated PM monitors, the TEOM 1405 (Thermo Scientific, USA), the DustTrak DRX 8533 (TSI Inc., USA) and the Fidas Frog (Palas, Germany), were compared with the reference gravimetric method under three different environmental scenarios. To our knowledge, this is the very first intercomparison involving the Fidas Frog.
Here, we focused on the calibration of the PM monitors' particle quantification, rather than the particle inlet size selection; i.e. the TEOM 1405 unit was calibrated without its PM sampling inlet. The Fidas Frog and DustTrak DRX 8533, which are optical instruments, do not possess any size-selective inlet. The facility could be, however, extended in the future to calibrate PM monitors together with their sampling inlets, if needed. Finally, the facility for generating ambient-like model aerosols presented in this study is not only relevant for the calibration of PM monitors but can find applications in the performance evaluation and quality assurance of other aerosol instruments meant for monitoring ambient, indoor and workplace air as well as in controlled health studies and in vitro toxicology.
The experimental set-up consists of three distinct parts: (i) the generators of the primary aerosols (dust, salts, soot and aged soot); (ii) a flow tube homogeniser for aerosol mixing, including isokinetic sampling probes; and (iii) a system for reference gravimetric measurements. Each part is described in more detail in the following subsections.
2.1 Aerosol generation
Four primary aerosols, fresh soot, aged (i.e. organically coated) soot, inorganic salt and mineral dust particles, were generated as depicted in Fig. 1. Fresh soot particles were generated with a miniCAST 6204 burner (Jing Ltd., Switzerland). The operation point was optimised to produce combustion particles with a geometric mean mobility diameter (GMD) of 90 nm and EC TC (elemental carbon to total carbon) mass fraction of >90 %. The combustion aerosol was split in two portions; one portion was led to the exhaust and the other through a metallic agglomeration tube (1.2 m long, 5 mm internal diameter), where the soot particles grew to about 120 nm. The mobility diameter was measured by a scanning mobility particle sizer (SMPS). The combustion aerosol was subsequently diluted by a factor of 10 with a VKL10 dilution unit (Palas, Germany). The outlet flow was delivered into an oxidation flow reactor known as the Micro Smog Chamber (MSC prototype developed by Keller and Burtscher, 2012, and used by Bruns et al., 2015; Corbin et al., 2015b, 2015a; Keller and Burtscher, 2012), where soot was mixed with a controlled amount of α-pinene vapours (≥97 % purity, Sigma Aldrich, Switzerland) under dry conditions (RH<5 %). The concentration of α-pinene at the inlet of the MSC was determined with a photoionisation detector (PID PhoCheck TIGER, Ion Science Ltd, UK) after filtering out the particles. The concentration could be varied by adjusting the flow of air through the α-pinene container (gas bubbler) and typically ranged between 60 and 70 ppm. RH was measured with a digital humidity sensor (FHAD 46 series/Almemo D6, Ahlborn, Germany). The aerosol flow through the MSC was set to 1.2 L min−1 with the use of a miniature radial air blower (model H015X-525A9 with controller, Micronel AG, Switzerland). Higher aerosol flows through the MSC would lead to the residence time in the reactor being too short and should be avoided. α-Pinene underwent ozonolysis in the MSC, forming secondary organic aerosol (SOA), part of which condensed on the surface of the soot particles, simulating atmospheric ageing procedures (Ess et al., 2020).

Figure 1Schematic illustration of the experimental set-up. DUT stands for device under testing.
The GMD of the soot mobility size distribution was shifted to 160 nm upon coating with SOA, and the EC TC mass fraction dropped to about 20 %. In parallel, fresh soot particles (120 nm mobility diameter) were sampled from the exhaust of the VKL10 dilution unit with the use of a second Micronel blower at flows between 1 and 2 L min−1.
Mineral dust particles (ISO 12103-1 A2 fine test dust, Powder Technology Inc., USA) were generated with a rotating brush generator (RBG 1000, Palas, Germany) and were injected horizontally into an empty vessel, which acted as a swirl separator, filtering out the largest size fraction above PM10. Alternatively, whenever calibration with respect to the PM2.5 faction is desired, a PM2.5 impactor can be installed right before injecting the dust particles into the homogeniser.
Inorganic salt particles were generated by nebulising aqueous mixtures of ammonium sulfate and ammonium nitrate at various ratios with the use of a TSI 3076 atomiser (TSI Inc., USA). The particles were passed through a 1.5 m long, spiral-shaped agglomeration tube to increase the GMD of the (number-based) mobility size distribution to about 100 nm (the mass-based aerodynamic size distribution shows a maximum at ≈200 nm). The aim was to simulate the presence of ammonium, nitrate and sulfate ions in the fine mode of atmospheric particle size distributions (Liu et al., 2000; Wall et al., 1988; Zhuang et al., 1999). Although generation of coarse-mode nitrate, formed at coastal areas by the reaction of gas-phase nitric acid with sea-salt or soil dust particles, or coarse-mode sulfate was not actively pursued, there is evidence (see Sect. 3) of coarse-sulfate formation. Presumably, this is either due to internal mixing of sulfate ions and mineral dust particles in the flow tube homogeniser or to deposition of salt particles in the aerosol pipes and consequent re-entrainment of agglomerates, which are larger than the particles initially produced by the generator.
The primary aerosols were introduced into a flow tube homogeniser (see Sect. 2.2) through separate injection ports. The flow of each primary aerosol entering the homogeniser could be regulated with separate mass flow controllers (Red-y MFC, Vögtlin, Switzerland) by splitting and directing part of the main primary aerosol flow to the exhaust. A filter (HEPA capsule, Pall Corporation, USA) was placed upstream of each MFC to remove the particles from the air flow. All four MFCs were connected to the same aerosol pump (VTE8, Thomas, Germany) as shown in Fig. 1.
The mobility diameter and number concentration of the soot and salt particles were determined with a scanning mobility particle sizer (SMPS 4.500, Grimm Aerosol Technik GmbH & Co. KG, Germany, L-DMA, Am-241 neutraliser, scan time 695 s). The mass concentration of each primary aerosol was measured with a tapered element oscillating microbalance (TEOM 1405, Thermo Scientific, USA), operated at a flow rate of 3 L min−1 and a temperature of 30 ∘C. The TEOM data were recorded via a custom-made LabVIEW routine every 6 s without averaging. The size distribution of the dust particles was measured with a Fidas Frog fine-dust monitor (Palas, Germany) and a high-resolution optical particle counter LAS-X II (Particle Measuring Systems, USA).
2.2 Aerosol homogenisation and sampling
The homogeniser is a 2.1 m long custom-made stainless steel tube with an inner diameter of 16.4 cm, placed vertically. The design is based on a previous study but has been significantly improved, and the facility has been shortened (Horender et al., 2019). The tube is equipped with five identical inlets, placed at the very top as shown in Figs. 1 and 2a. Dilution air (filtered, humidity and temperature controlled) is delivered to each one of the inlets at a flow rate of 24 L min−1. The air is conditioned in two steps (Niedermeier et al., 2020) in such a way that the humidified air is particle-free: first, the dew point is adjusted by passing the air through a Nafion humidifier (Series FC125-240-10MP, PermaPure, USA) filled with water (ultra-analytic grade, Purelab ultra, ELGA, Switzerland) at a preselected water temperature, adjusted between 3 and 30 ∘C with a cryostat–thermostat (LAUDA Ecoline Staredition RE 306, Lauda DR. R. Wobser GmbH & Co. KG, Germany). After being put through the Nafion humidifier, the air is fully saturated with water. Subsequently, the air is guided through a heated hose (Series T-7000, Thermocoax Isopad GmbH, Germany), where the temperature can be adjusted up to 100 ∘C. The temperature and RH of the aerosol were monitored in the homogeniser at the height of the sampling probes with digital sensors (FHAD 46 series/Almemo D6, Ahlborn, Germany).
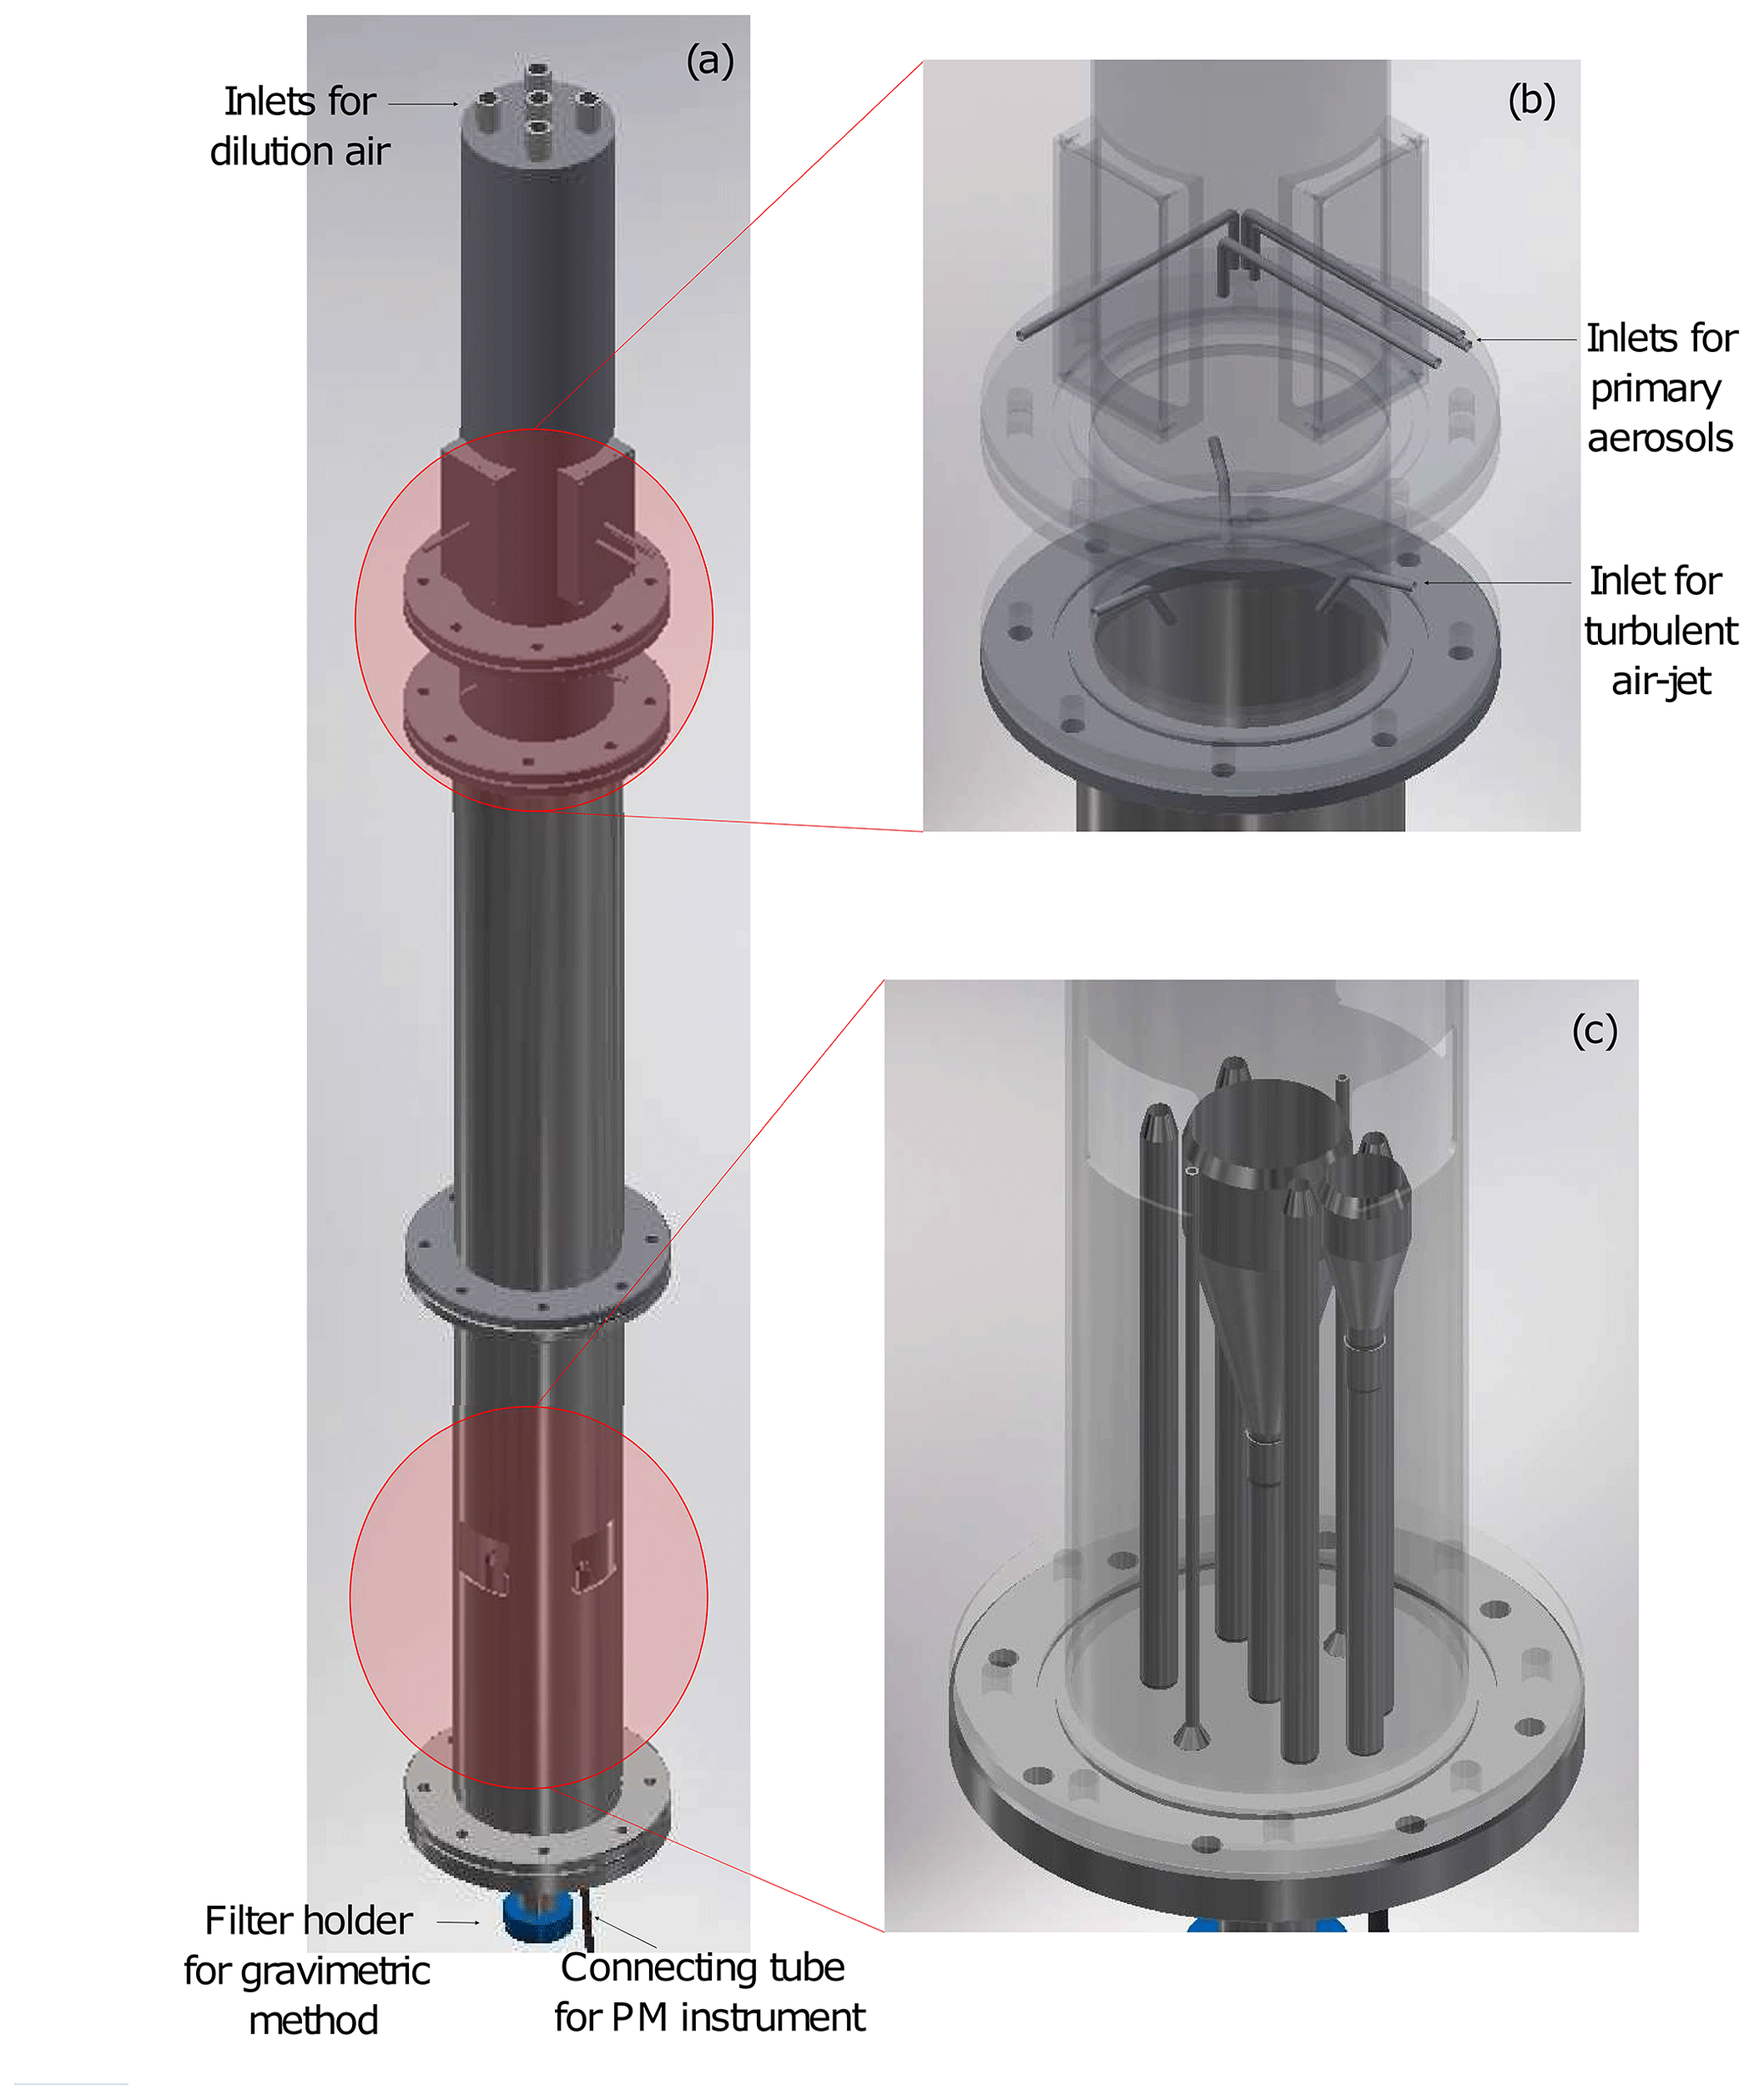
Figure 2(a) Computer-aided design (CAD, Inventor Professional 2019, Autodesk, USA) of the homogeniser. Panels (b) and (c) show enlarged views of the primary aerosol inlets and isokinetic sampling probes, respectively.
The primary aerosols are injected in the middle of the tube through separate ports located 50 cm downstream as shown in Fig. 2b. The dilution air sweeps the particles down the tube, where they are further mixed by three turbulent jets of air. The three air-jet injection tubes (flow rate 20 L min−1 each) are placed symmetrically around the homogeniser tube pointing 60∘ downwards (Fig. 2b). The total flow rate of the homogenised aerosol is hence equal to 180 L min−1 plus the flows of the four primary aerosols (in total less than 10 L min−1). The temperature and relative humidity of the air jets are adjusted as described above for the dilution air. Finally, the homogeniser is surrounded by copper tubes with flowing water in order to maintain the stainless-steel tube at the same temperature as the aerosol. The temperature of water is adjusted by a flow-type cooler (AS-160 Green Line, Lindr, Czech Republic) or a thermostat (LAUDA EcoGold E4, Lauda DR. R. Wobser GmbH & Co. KG, Germany). The water flows in a closed loop, i.e. circulates back to the cryostat–thermostat as shown in Fig. 1. Currently, the homogeniser can only be cooled down to about 10 ∘C, and this poses limitations to the environmental conditions which can be simulated in the laboratory; even though the aerosol entering the homogeniser can be preconditioned at a temperature down to about 5 ∘C, the aerosol temperature at the outlet of the homogeniser will always be .
The sampling zone is located 1.25 m downstream of the injection position and accommodates isokinetic sampling probes (funnels) placed at the bottom end of the homogeniser as illustrated in Fig. 2c. Isokinetic conditions are necessary when sampling with instruments operating at different flow rates to ensure representative sampling, e.g. by minimising sampling artefacts of larger particles. Several custom-made sampling probes with different cross sections have been therefore designed to match the flow rate of the various automated PM monitors, which typically ranges between 0.2 and 20 L min−1. It is worth noting that the sampling system is highly adaptable; the lower end (outlet) of each sampling probe has custom-made threads so that it can be screwed in and out of the bottom metallic plate of the homogeniser. This ensures that the sampling probes can be readily exchanged before each experiment depending on the specifications of the PM monitors under testing. Finally, the excess aerosol flow exits the homogeniser through an exhaust outlet connected to a vacuum line as illustrated schematically in Fig. 1.
To characterise the aerosol homogeneity in the flow tube as a function of particle size, sodium chloride (NaCl) particles with a geometric mean mobility diameter of 50 nm and mineral dust particles with an aerodynamic diameter in the lower micrometre range (ISO A2 dust) were generated with a nebuliser and a rotating-brush generator, respectively, as described in Sect. 2.1. Two parallel sampling lines were inserted into the flow tube at the height where the sampling probes would be normally located; the position of the first sampling line was kept fixed at the centre of the flow tube (radial position 0), whereas the second one was placed consecutively at a distance , −50, −30, −10, +10, +30, +50 and +70 mm with respect to the centre. The outlet of each sampling line was connected to a calibrated condensation particle counter (CPC; Models 3775 and 3776, respectively, TSI inc., USA). In total, concentration measurements at eight different positions along the diameter of the flow tube were performed. The particle number concentration measured at the centre was used as reference (Cref=C0), and the aerosol homogeneity was calculated as . The flow rate of each CPC was 0.3 L min−1, and the inner diameter of the sampling line was 6 mm. This configuration ensured nearly isokinetic sampling.
The tests were performed with NaCl and mineral dust particles separately. In both cases the aerosol spatial homogeneity was found to be well within 3 % in number concentration as shown in Fig. 3a and b, respectively, indicating that the particle mixing characteristics do not depend on particle size in the tested range (i.e. from lower nanometre to lower micrometre range). A final test was performed by mixing NaCl and dust particles to investigate whether the particle mixing properties are affected when two primary aerosols are introduced into the homogeniser simultaneously. It was confirmed that the aerosol homogeneity remains well within ±3 % (measurements not shown), indicating that the simultaneous injection of primary aerosols into the homogeniser through separate ports (see Fig. 2b) does not compromise particle mixing in any way.
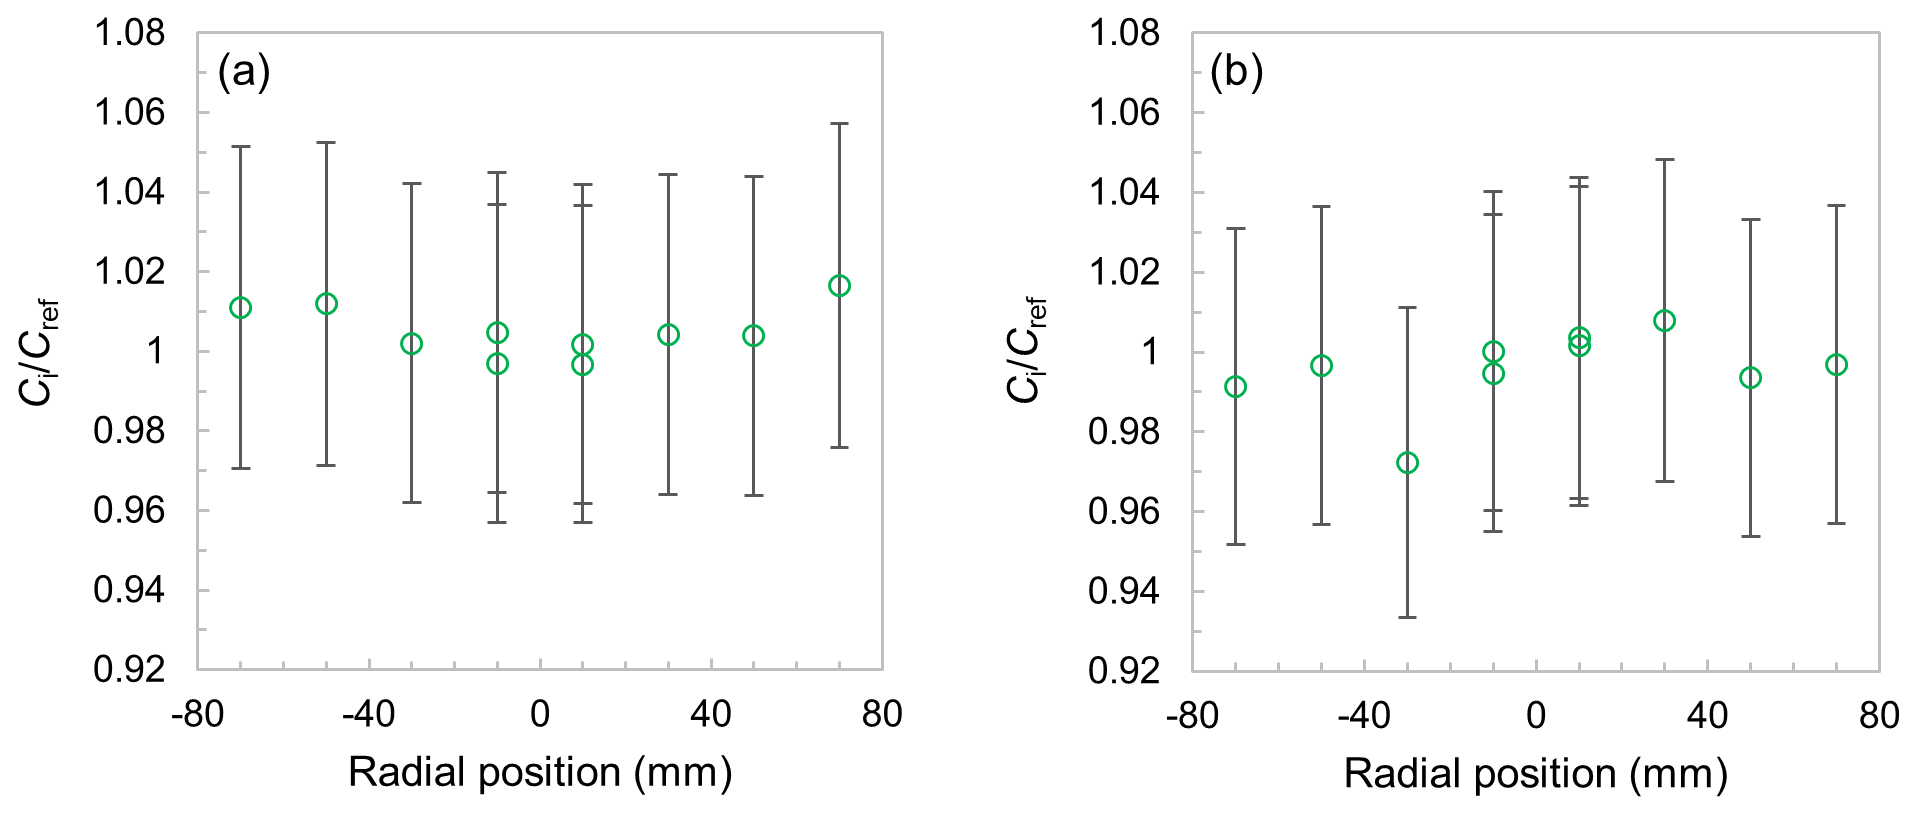
Figure 3Aerosol spatial homogeneity, ηhom=Ci/Cref, at various radial positions along the diameter of the flow tube with (a) NaCl (sodium chloride) and (b) mineral dust particles as test aerosols. The measurements at positions and +10 mm were performed twice to assess measurement reproducibility. The error bars designate expanded uncertainties (95 % confidence level). These are type B uncertainties from the combined measurement uncertainties of the two CPCs and have no influence on the determination of homogeneity since they would shift all data points upwards or downwards by the same amount.
Table 1Example of the uncertainty budget for a PM10 mass concentration of 40 µg m−3 and a sampling time of 240 min.
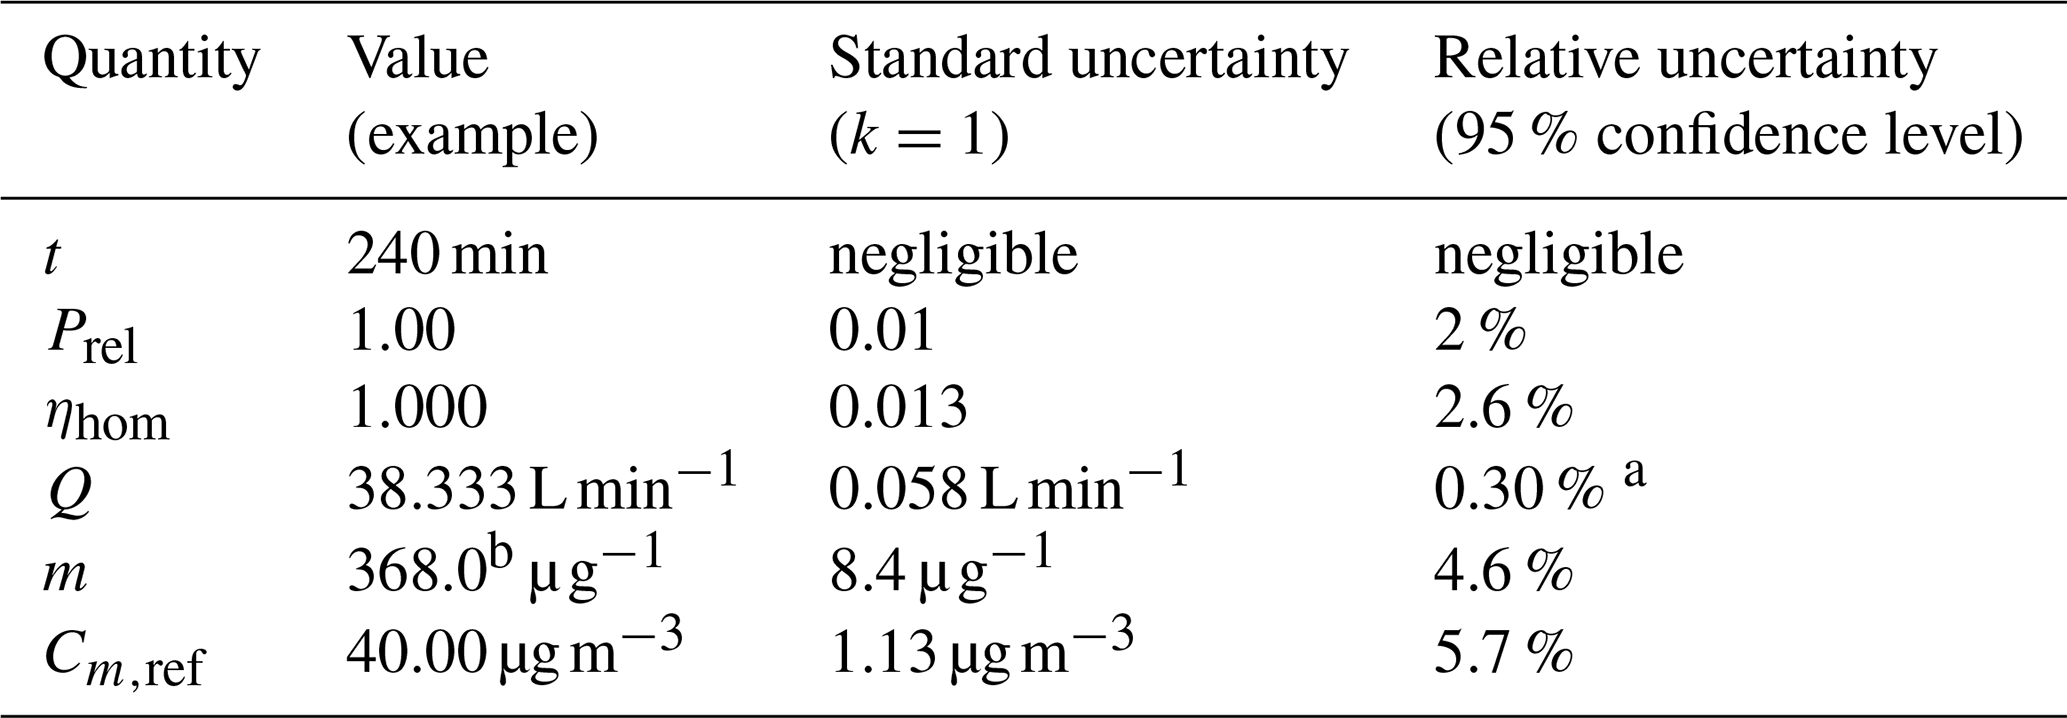
a The mass flow meter (Natec Sensors GmbH, Germany) was calibrated at METAS in a traceable manner. The expanded relative uncertainty on the calibration certificate amounts to 0.15 %. Here, a conservative estimation of 0.30 % was made to account for possible drifts since the time of calibration. b Assuming no loss of particulate mass during filter conditioning.
By calculating the standard deviation of all 28 measured data points, the spatial inhomogeneity of the aerosol in terms of number concentration was found to be 1.3 % for coverage factor k=1 (i.e. 68 % confidence level) or 2.6 % for k=2 (i.e. 95 % confidence level). This is used as an estimate for the uncertainty of the aerosol spatial homogeneity ηhom (see fourth row of Table 1). This is a crucial parameter which had not been evaluated so rigorously, if at all, in previous chamber studies (Hogrefe et al., 2004; Liu et al., 2017; Papapostolou et al., 2017; Schwab et al., 2004; Zhu et al., 2007).
2.3 Reference gravimetric method
The reference method used in this study for determining the PM10 or PM2.5 mass concentrations of particulate matter in the synthetic ambient aerosols is similar to the method described in the standard EN 12341:2014 (CEN/TC 264/WG-15, 2014); i.e. particulate matter was sampled on filters and weighed by means of a balance. The only major deviation from the requirements of the standard is the absence of any size-selective inlets upstream of the automatic PM samplers and the filter holder of the reference gravimetric method.
Briefly, model aerosols were drawn through 47 mm PTFE-coated glass fibre filters (Measurement Technology Laboratories, USA) placed in a metallic filter holder (C806 standard aerosol filter holder, Merck Millipore, Germany). The aerosol flow was controlled with a needle valve and measured with a calibrated mass flow meter (Natec Sensors GmbH, Germany) connected to an aerosol pump (VTE8, Thomas, Germany) in such a way that the volumetric flow corresponded to 2.3 m3 h−1 at ambient conditions. Here, ambient conditions refer to the aerosol temperature and pressure in the homogeniser at the height of the sampling probes. In the EN 12341 standard, the requirement that the aerosol flow be set to 2.3 m3 h−1 () at ambient conditions arises from the need to accurately define the size cut-off of the PM inlets, a property that depends on the inlet flow. Since the custom-made facility developed in this study aims at calibrating the PM monitors without their respective PM inlet, this flow requirement is here largely superfluous, apart from effects on sampling from the velocity of air through the filter. Nevertheless, during the experiments the aerosol flow was set to 2.3 m3 h−1 at ambient conditions to facilitate comparison between the conventional field-based and the new laboratory-based procedures. The connecting tube between the isokinetic sampling probe (i.e. central sampling funnel in Fig. 2c) and the filter holder was made of inert, electrically conducting rubber material and was kept as short as possible (≈5 cm) without bends to minimise deposition losses of particulate matter by kinetic processes as well as losses due to thermal, chemical or electrostatic processes. Finally, the laboratory temperature and pressure were kept constant at (21±1) ∘C and (950±20) hPa, respectively.
Before sampling, the filters were conditioned and weighed at the National Physical Laboratory (NPL) and shipped in individual plastic containers to the Federal Institute of Metrology METAS. After sampling, the filter samples were placed in Petri dishes, wrapped tightly in plastic covers and stored at 4 ∘C for about a week. They were then shipped to NPL for conditioning and weighing. NPL use a Measurement Technology Laboratories robotic filter weighing system that comprises an environmental chamber ( and 47.5 %±2.5 % relative humidity), an autohandler system and a Mettler Toledo XP2U balance. The filters are conditioned in the chamber for 48 h before weighing. The filters are weighed, and then the system pauses for 24 h before reweighing the filters to identify any time variation in filter mass. Numerous quality assurance and quality control checks are made before each set of weighings.
2.4 Uncertainty budget for the laboratory-based calibration of PM monitors
The reference mass concentration, Cm,ref, is given by the equation , where ηhom is the aerosol homogeneity in the flow tube, m is the particulate mass collected on the filter and V is the sampled volume. V is given by the aerosol flow through the filter, Q, multiplied by the time duration of the measurement t. Prel is defined as the relative particle penetration, , where PDUT and Pref are the penetration through the sampling probe and connecting tube of the device under testing (DUT) and the reference method, respectively. The associated uncertainties are listed in Table 1.
Since sampling is carried out with isokinetic sampling probes and the tubes leading to the filter holder and the DUT are kept straight and as short as possible, particle losses are minimised. Penetration Prel was set to 1; however, an uncertainty of 2 % was assigned to account for the higher impaction losses of supermicrometre particles in the sampling funnel of the reference method due to the higher sampling flow (von der Weiden et al., 2009). These losses are to some extent counteracted by the lower diffusion losses of submicrometre particles, which decrease with increasing sampling flow. Here, we followed a rather conservative approach and kept the uncertainty of Prel at 2 %.
Ion chromatography was performed with a Thermo Scientific Dionex™ICS-1500 Ion Chromatography System for analysis of anions and the ICS-2100 model for cations. The systems consist of a liquid eluent, a high-pressure pump, an automatic sample injector, a guard and separator column, an electrolytic suppressor, and a conductivity cell. Before running a sample, the systems were calibrated using a traceable set of calibration standard solutions, which were prepared in-house. The data produced by the range of calibration standard solutions were used to calculate calibration coefficients, which were used to quantitate the sample ions.
Thermo-optical analysis of carbonaceous particles was performed with an OC–EC Analyzer (Lab OC-EC Aerosol Analyzer, Sunset Laboratory Inc., USA), which classified the carbonaceous material as elemental carbon (EC) and organic carbon (OC). The particles were sampled on quartz fibre filters (Advantec, Tokyo, Japan, QR-100, 47 mm). For the analysis, the EUSAAR2 protocol (Cavalli et al., 2010) was modified by extending the last temperature step (850 ∘C) from 80 s in the original protocol to 120 s in order to ensure the complete evolution of carbon (Ess and Vasilatou, 2019). The charring correction for pyrolysed OC was performed by transmittance. OC, EC and TC (total carbon=sum of OC and EC) masses were calculated by the software based on instrument calibration with sucrose solutions.
The elemental composition of the model aerosols was characterised by combining a cascade impactor for PM sampling with Total Reflection X-ray Fluorescence Spectroscopy (TXRF, Bruker TStar S4™, Germany) (Osán et al., 2020). A 13-stage low-pressure cascade impactor (Dekati DLPI 10™, Finland) with particle size range from 30 nm to 10 µm was modified to sample at a rate of 10 L min−1 on smooth and clean commercial-grade acrylic discs with 30 mm diameter, suitable for TXRF. In TXRF, the incident X-ray beam hits the disc's surface at the total reflection angle. The fluorescence spectrum is detected perpendicular to the surface and is dominated by the contributions from the deposit, i.e. the sampled particles. This allows for the detection of element masses as low as ≈10 to 100 pg and thus short sampling periods. The measured element quantities, combined with the sampled air volume, provide the particle size-selected element mass concentrations in the aerosol. The discs were prepared with a 50 ng yttrium standard for TXRF calibration.
As an example, the TXRF analysis of model aerosol 1 is shown in Fig. 4. The analysis revealed that the mineral dust particles contain primarily the elements Si and Al, and it was assumed that these are present as oxides SiO2 and Al2O3. The mass-based aerodynamic distribution of the SiO2 particles exhibits a maximum in the range 1–2 µm while the Al2O3 particles are larger (≈7 µm). Sulfur (i.e. in the form of sulfate ions) appears predominantly in the submicrometre range (aerodynamic diameter of 30 nm–1 µm), but a second weaker mode is visible at ≈4–7 µm, thus simulating the aerodynamic size distribution of sulfates in ambient air (Wall et al., 1988; Zhuang et al., 1999) reasonably well. The coarse-mode arises most probably from internal mixing of sulfate ions with mineral dust particles. Since nitrates and sulfates were generated with the same method, nitrates are expected to exhibit a similar bimodal size distribution, but this could not be experimentally confirmed since nitrogen is difficult to detect with TXRF spectroscopy. Finally, K+ and Cl− ions appear in the micrometre range (>2 µm). It is reasonable to expect that Na+ ions also appear in this size range; however, this could not be investigated by TXRF. By comparing the results of ion chromatography with those of TXRF spectroscopy, there is no evidence of insoluble potassium.
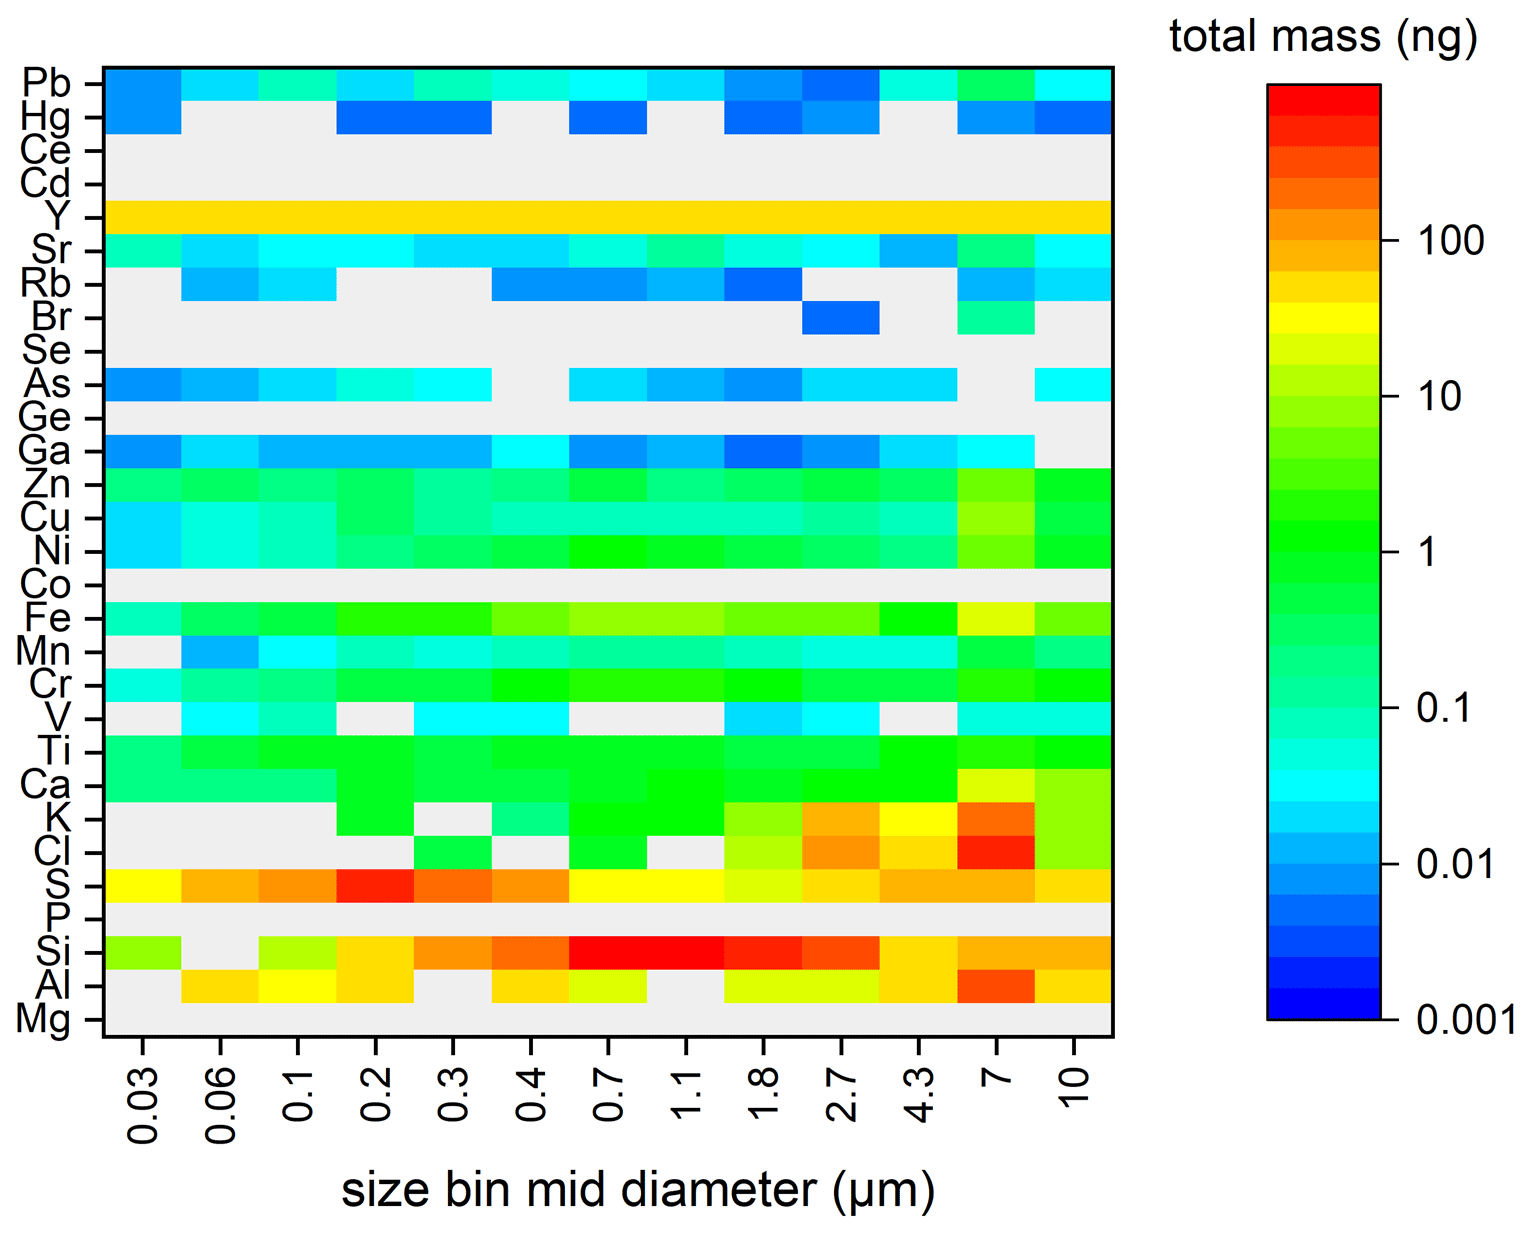
Figure 4TXRF analysis of model aerosol 1 (see text and Table 2 for a discussion on all three model aerosols).
Table 2Chemical composition of the three model aerosols, mass concentration (µg m−3) of each chemical constituent and environmental conditions during each experiment.
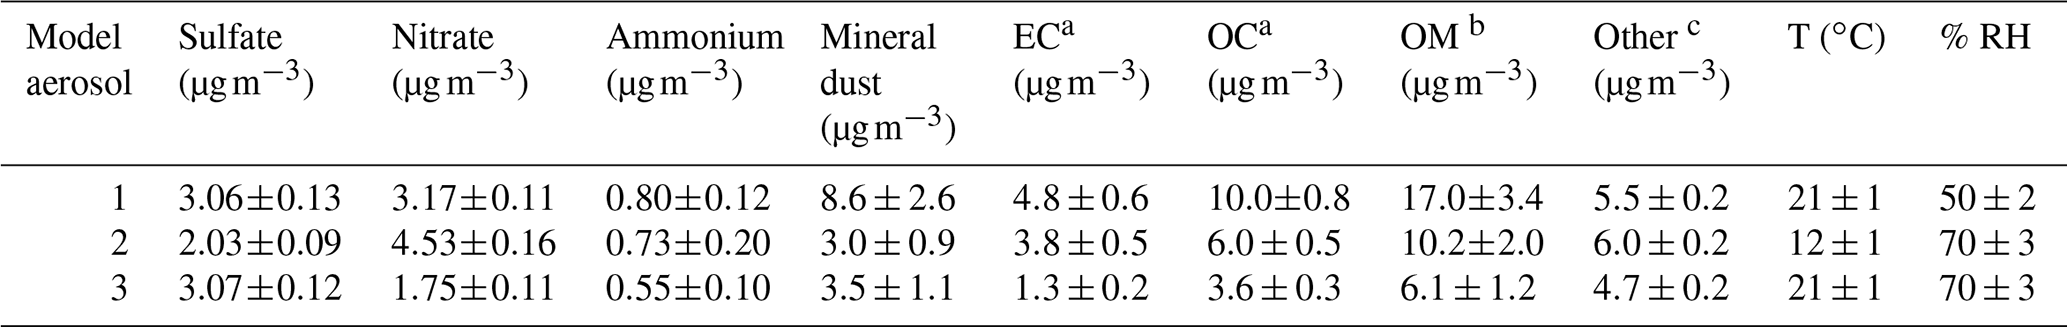
a The reported uncertainties do not include uncertainties in the determination of the split point. b In past studies with atmospheric aerosols, factors between 1.1 and 2.1 have been proposed to convert OC to OM mass (El-Zanan et al., 2005). The Micro Smog Chamber is known to yield moderately to strongly oxidised secondary organic matter (Bruns et al., 2015); thus a factor of 1.7±0.3 was assumed. c Mostly Na+ and to a lesser extent K+ and Cl− from contamination of the aerosol generation system and, possibly, impurities in the mineral dust mixture. By meticulously cleaning the aerosol inlet with wet tissues, it is possible to keep the mass fraction of “other material” well below 10 %.
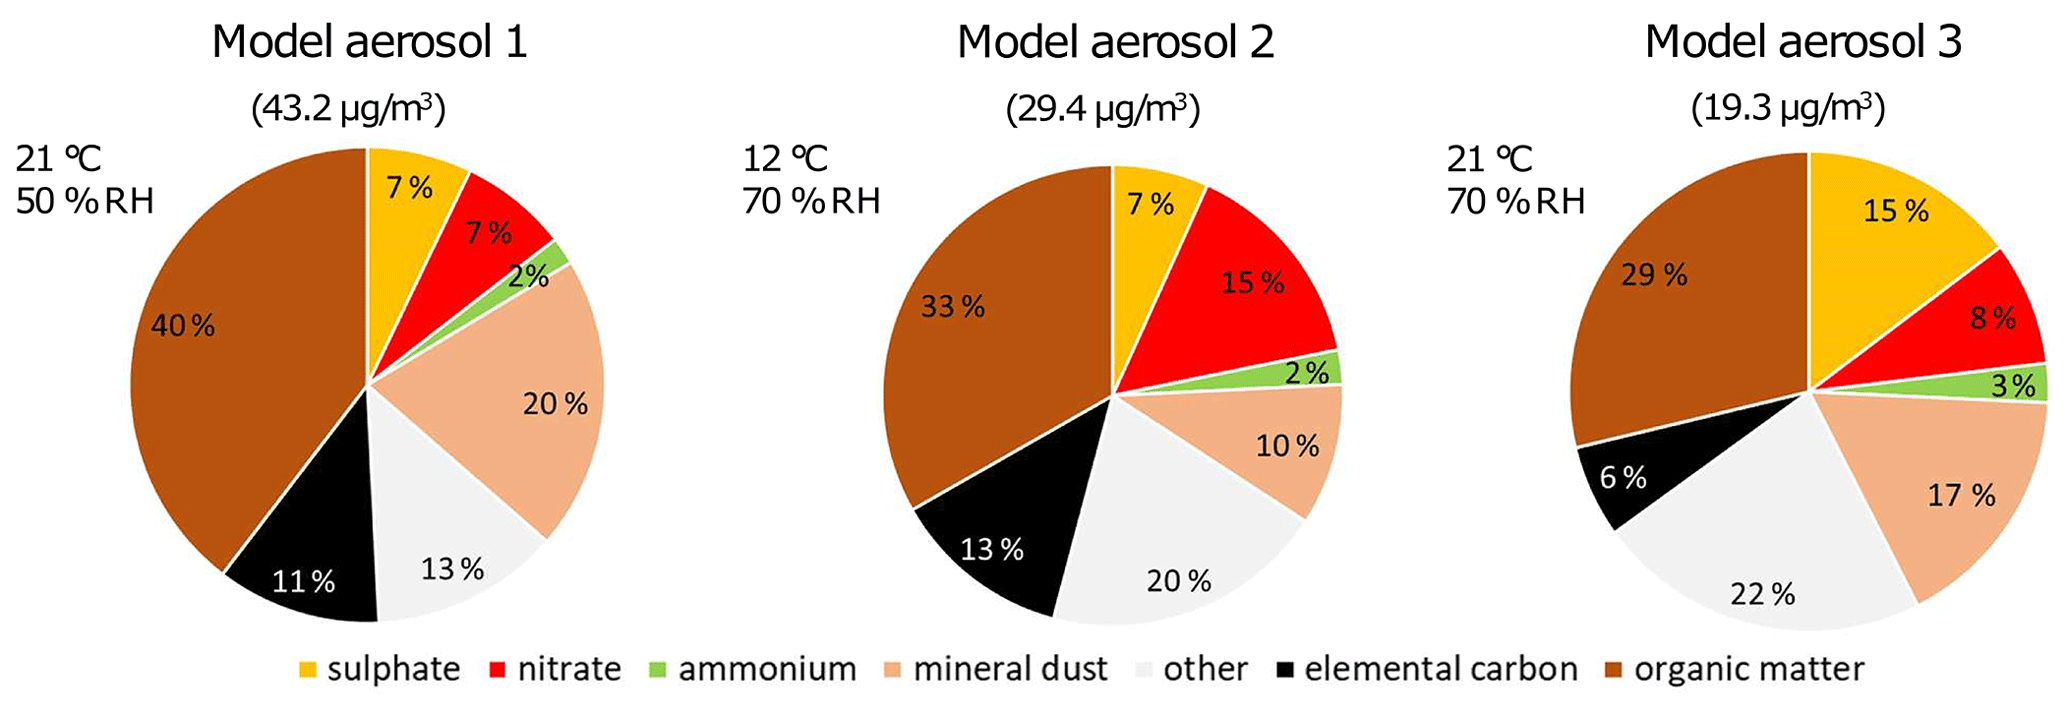
Figure 5PM composition (%) of the three model aerosols and environmental conditions during each experiment.
The results of the chemical analysis of the model aerosols with ion chromatography, analysis and TXRF spectroscopy are summarised in Table 2 and presented graphically in Fig. 5.
Three PM monitors, a TEOM 1405 (Thermo Scientific, USA), a DustTrak DRX 8533 (TSI Inc., USA) and a Fidas Frog (Palas, Germany), were used in this study. The 1405 TEOM takes continuous direct mass measurements of particulates using a tapered element oscillating microbalance and is considered to be one of the most well established automated instruments for monitoring PM mass concentration at air quality monitoring stations. The DustTrak DRX 8533 and the Fidas Frog aerosol monitors are, unlike TEOM, portable and more cost efficient. These do not measure particle mass directly but record instead the particle number concentration and size distribution using optical techniques, from which they calculate the mass concentration using built-in algorithms.
The PM monitors were exposed to three different model aerosols, which were generated in the laboratory with the facility described in Sect. 2. All three model aerosols were ambient-like mixtures; i.e. they contained inorganic salts, elemental carbon (soot), secondary organic matter, mineral dust and water. The aerosol composition was analysed with the methods described in Sect. 3. The chemical composition of the model aerosols and the environmental conditions during each experiment are listed in Table 2 and depicted schematically in Fig. 5. It can be seen that the mass fractions of the different chemical constituents varied in the range ≈30 %–40 % OM, ≈5 %–15 % EC, ≈7 %–15 % nitrate, ≈ 5 %–15 % sulfate, ≈ 2 %–3 % ammonium, ≈ 10 %–20 % mineral dust and ≈10 %–20 % other materials.
The PM10 mass concentration range (20–40 µg m−3) is typical for urban and suburban regions across Europe. The chemical composition is representative of European aerosols containing carbonaceous particles from fossil fuel combustion (rather than biomass burning); secondary organic matter; mineral dust particles; and inorganic ions such as ammonium, sulfate, nitrate and sodium. The temperature and relative humidity of the aerosols were controlled in the range ≈10–20 ∘C and 50 %–70 %, respectively, to simulate different ambient environmental conditions.
The results of the comparison between the automated PM monitors and the reference gravimetric method are shown in Fig. 6. For the automated PM monitors, which measure continuously and with high time resolution, each data point corresponds to the arithmetic average over a 30 min measurement period. The reference method delivers only one data point, i.e. the average PM10 mass concentration over the whole measurement period, which is illustrated in the graph as a straight solid line and summarised in Table 2. It must be noted that the operating temperature of the TEOM 1405 monitor was set as low as possible, i.e. to 30 ∘C, to minimise losses due to (semi)volatile material (Meyer et al., 2000). For the DustTrak and Fidas Frog the default factory settings were used.
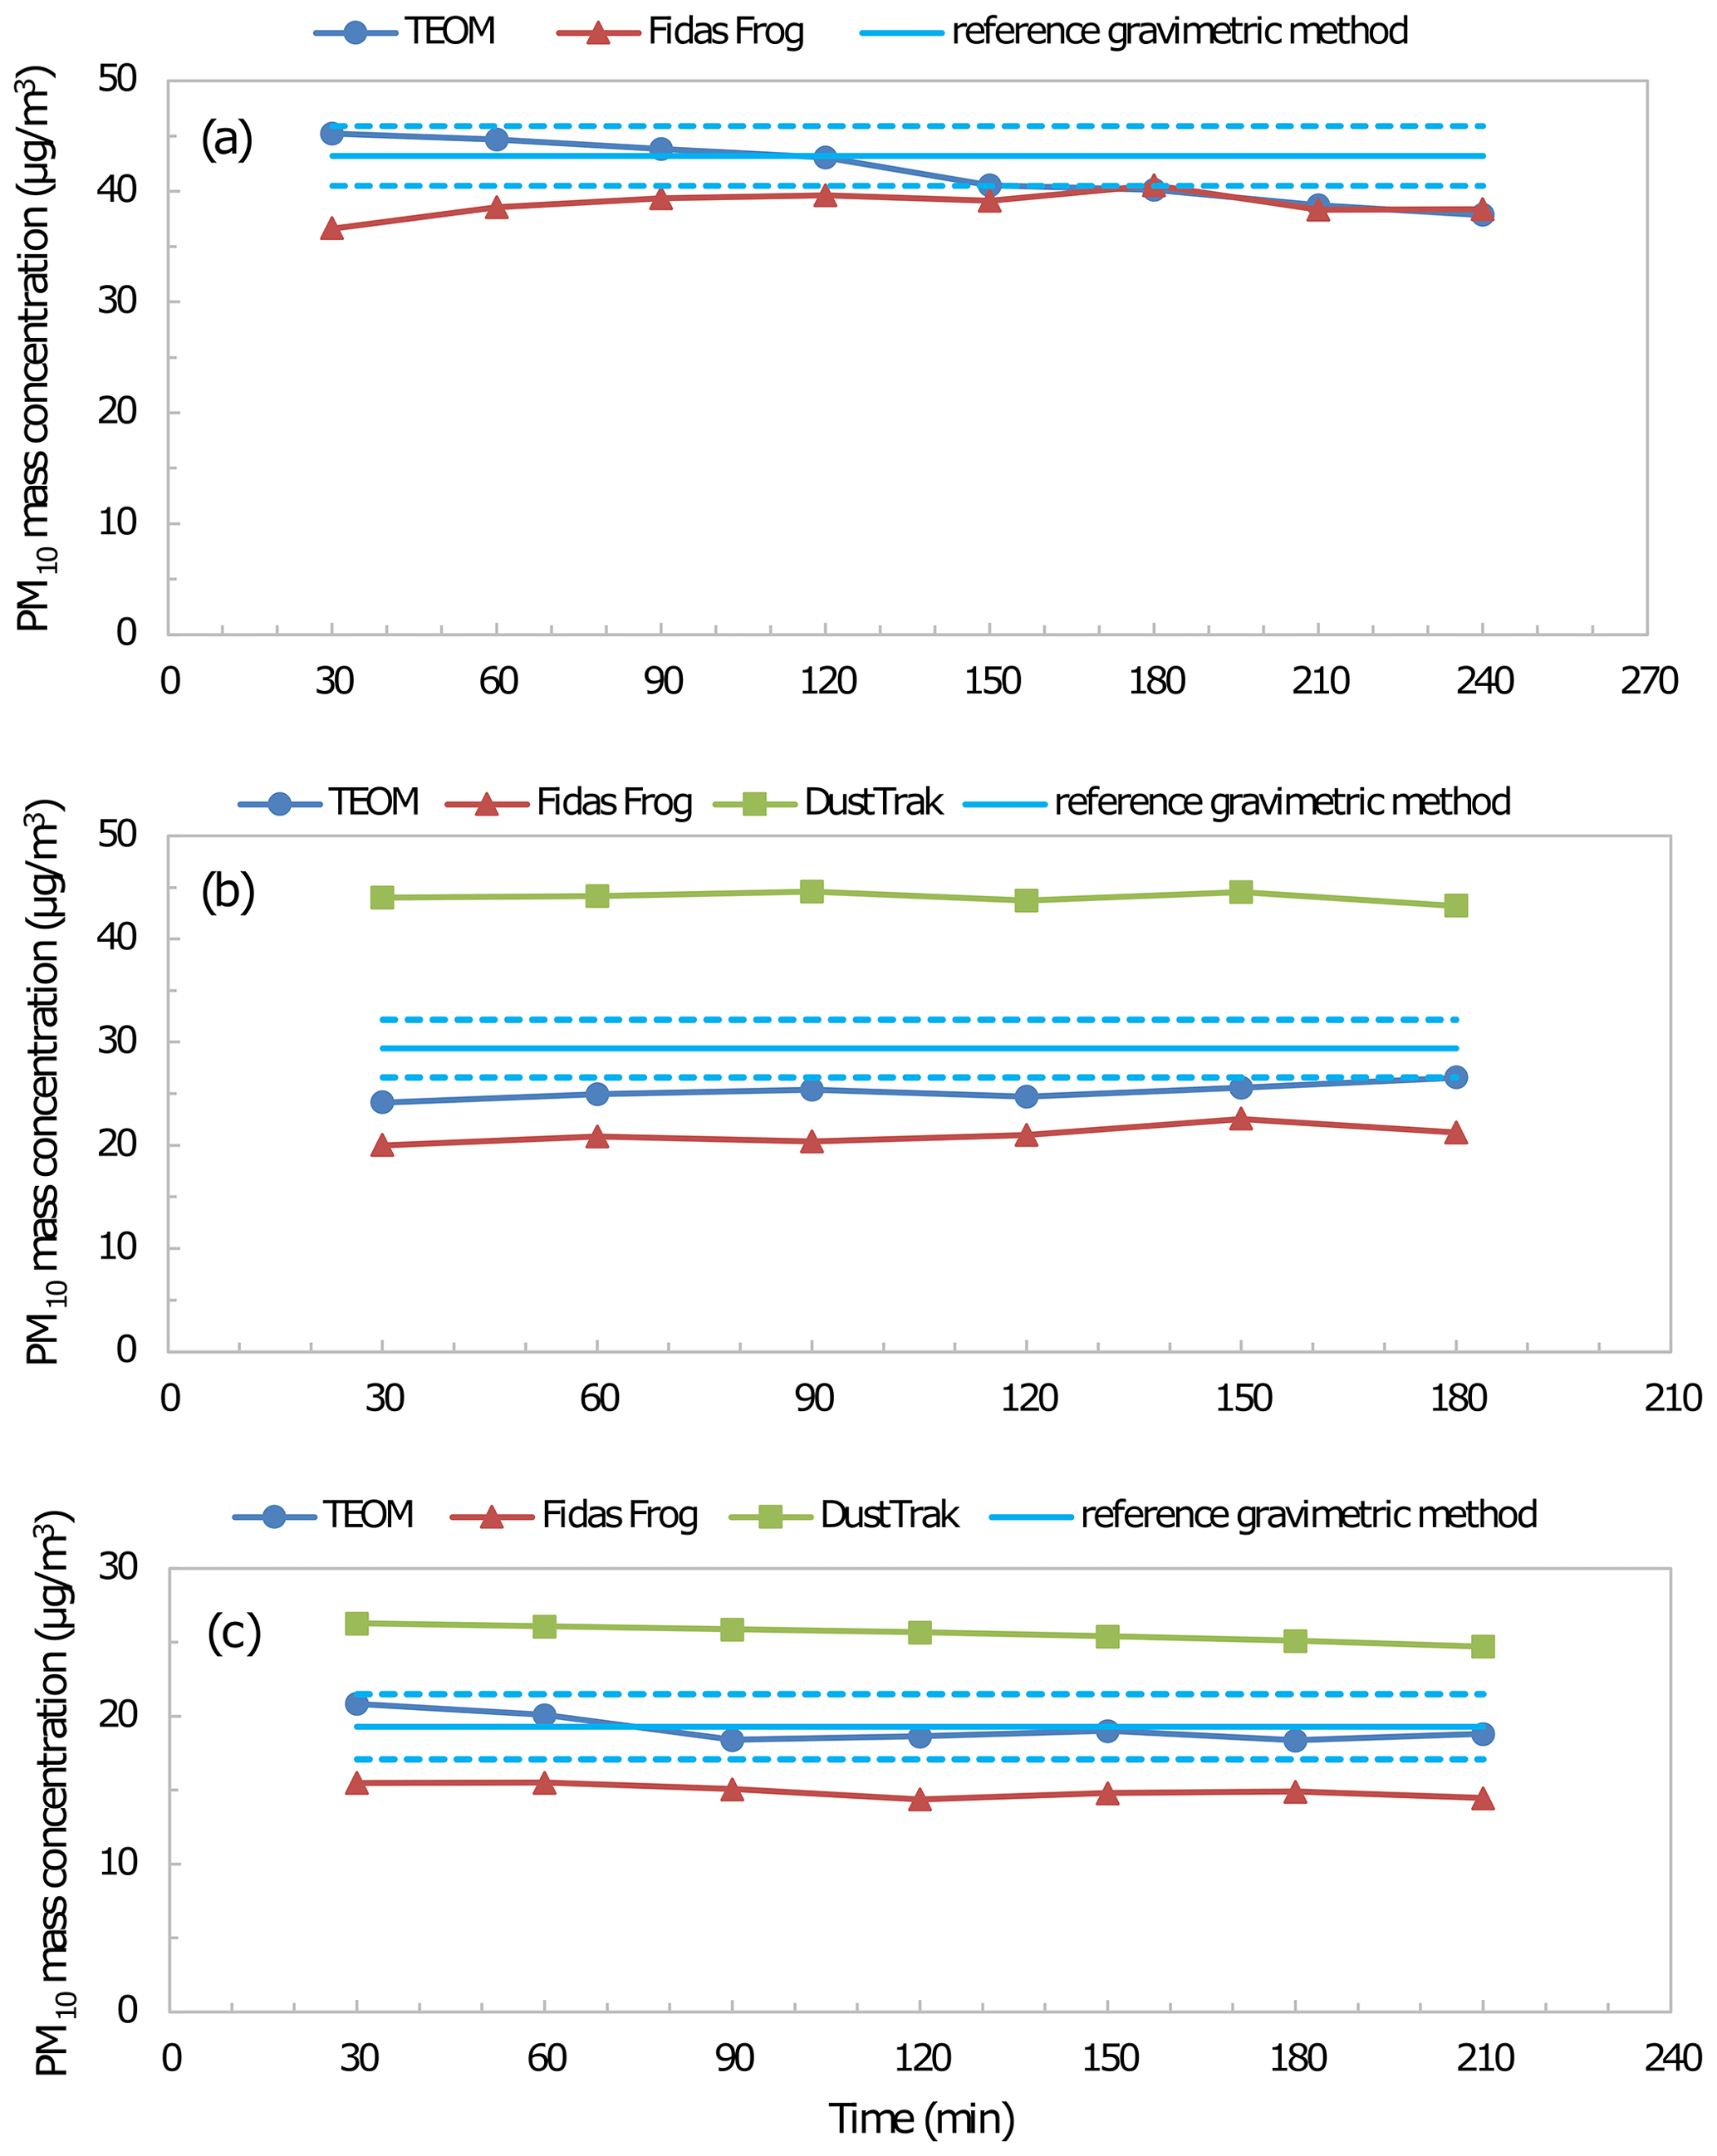
Figure 6PM10 mass concentrations reported by the TEOM 1405, DustTrak DRX 8533 and Fidas Frog monitors compared to the results of the reference gravimetric method in the case of (a) model aerosol 1, (b) model aerosol 2 and (c) model aerosol 3. In Fig. 6a, the results of the DustTrak 8533 are not plotted because of technical issues during measurement (see text for more details). The dashed lines designate the expanded uncertainties (95 % confidence level) of the reference PM10 value.
Table 3Average PM10 mass concentration (µg m−3) reported by the TEOM 1405, Fidas Frog and DustTrak 8533 automated PM monitors and the reference gravimetric method.
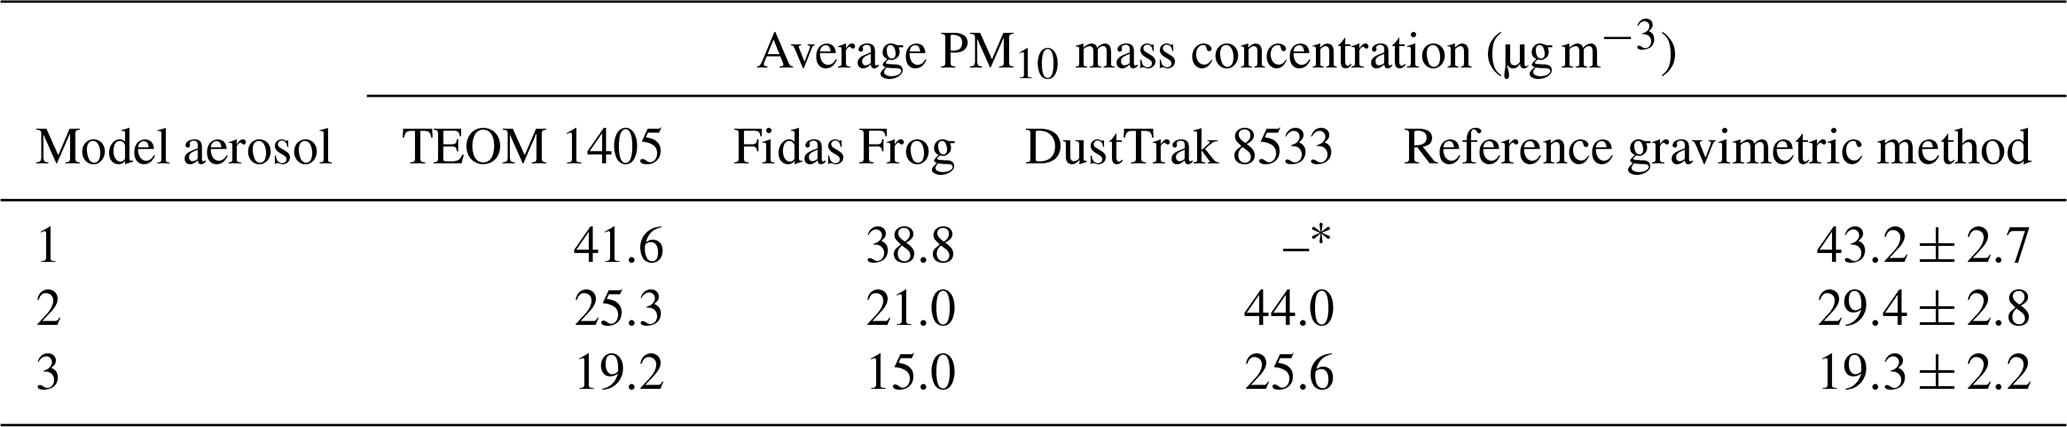
∗The result was discarded because of a technical issue during measurement.
Figure 6a presents the results of the TEOM 1405, Fidas Frog and the reference gravimetric method for model aerosol 1. The results of the DustTrak 8533 are not reported because of a technical problem (obstruction of the aerosol inlet) which compromised the measurement accuracy. The TEOM 1405 seems to agree well with the reference method in the beginning but indicates a decrease of about 15 % in mass concentration at the end of the 4 h measurement. Particle number concentration measurements of the primary aerosols before and after the experiment revealed that the number concentration of the fresh soot particles decreased by about 60 % during the measurement period, whereas the number concentration of the dust, salt and aged soot particles remained largely constant. The reason was a defect in the valve regulating the flow of the fresh soot particles into the homogeniser. The decrease in the aerosol mass concentration recorded by the TEOM is therefore real and can be attributed predominantly to the decreasing number and mass concentration of the uncoated soot particles. Since the concentration of the model aerosol decreased during measurement, the best way to assess the performance of the TEOM 1405 with respect to the reference method is to calculate the 4 h average mass concentration. This amounts to 41.6 µg m−3 (see Table 3), only 3.7 % lower than the reference measurement (43.2 µg m−3).
The fresh soot particles consist mainly of EC and have a geometric mean mobility diameter of about 120 nm, i.e. below the cut-off limit of the Fidas Frog. Indeed, experiments with miniCAST soot showed that the Fidas Frog and DustTrak 8533 failed to detect soot particles of this size. This explains why the Fidas Frog reported a constant mass concentration over the whole measurement period. In Table 3, it can be seen that the Fidas Frog reported an average PM10 mass concentration of 38.8 µg m−3, i.e. with respect to the reference method. This deviation agrees well with the EC mass concentration of 5.0 µg m−3 (Table 2), as determined with analysis. Note that the cut-off curve of optical instruments depends on the refractive index of the particles: the Fidas Frog fails to detect fresh soot particles below ≈200 nm but detects a considerable mass fraction of the coated soot and salt particles despite their small size.
The results obtained with model aerosol 2 are displayed in Fig. 6b. Here, the concentration of the aerosol remained constant throughout the measurement period. The Fidas Frog and TEOM 1405 monitors underestimate the mass concentration by 29 % and 14 %, respectively, compared to the reference method, while the DustTrak 8533 overestimates the mass concentration by 50 %. The larger deviation between the TEOM 1405 and the reference method compared to model aerosol 1 results from the winter-like environmental conditions; the temperature of model aerosol 2 was set to 12 ∘C, the relative humidity was set to 70 % and the nitrate content was relatively high (about 15 %) as shown in Table 2. Since the aerosol stream sampled by the TEOM 1405 is heated to 30 ∘C, a fraction of the (semi)volatile components (e.g. nitrate, secondary organic aerosol and water) evolves into the gas phase and is therefore not collected on the filter. These results are in agreement with previous studies reporting that TEOM monitors set at a lower temperature than the standard configuration (50 ∘C) still could lose semivolatile materials (Lee et al., 2005), especially in cooler months (Sofowote et al., 2014; Su et al., 2018).
The large positive deviation of the DustTrak 8533 by a factor of about 1.5 is not surprising. Previous studies have found that different DustTrak models over-recorded PM values by a factor of 1.2–3 (Chung et al., 2001; Grzyb and Lenart-Boron, 2019; Heal et al., 2000; Kingham et al., 2006; Liu et al., 2017; McNamara et al., 2011; Wallace et al., 2011; Yanosky et al., 2002) depending on the aerosol properties. It has been suggested that the “over-estimation is a simple calibration issue in which differences between the optical properties of the manufacturer's factory calibration PM (Arizona Road Dust) and the PM under study explained the uniform relative errors recorded” (Kingham et al., 2006). The results are nevertheless puzzling. Considering that the device fails completely to detect fresh soot and underestimates the amount of aged soot, we would have rather expected to observe a negative deviation with respect to the reference method. In any case, the large range of the positive systematic bias (factor of 1.2–3) highlights the need for source-specific calibration procedures against a reference method.
In the case of Fidas Frog, if the reading of the monitor (21.0 µg m−3; Table 3) is corrected for the undetected mass of fresh soot (3.8 µg m−3; Table 2), then the Fidas Frog still underestimates the mass concentration by ≈15 % with respect to the reference method.
The results obtained in the case of model aerosol 3 are illustrated in Fig. 6c. With an average PM10 mass concentration of 19.2 µg m−3, the TEOM 1405 exhibits an excellent agreement with the reference method (19.3 µg m−3; see Table 2). The DustTrak 8533 overestimates the mass concentration by approx. 33 % and thus performs slightly better than in the case of model aerosol 2. Fidas Frog underestimates the mass concentration by about 23 %, or ≈15 % after correction for the undetected mass of fresh soot, in agreement with the findings of the experiment with model aerosol 2. As mentioned above, PM monitors based on light scattering, such as the Fidas Frog and the DustTrak, measure particle number concentration and convert this into mass concentration by using a size-dependent particle density function. This function is integrated into the software of the instrument. Deviations may occur if the built-in functions differ substantially from the real density function of the aerosol. Hygroscopic growth of aerosol particles can also lead to considerable measurement artefacts especially when low-cost PM sensors are used (Di Antonio et al., 2018; Crilley et al., 2018). More experiments with ambient-like model aerosols under low and high relative humidity would be needed to define a comprehensive set of calibration factors for these instruments.
In this study, we present the first steps towards the generation of ambient-like model aerosols in the laboratory. A custom-made facility (PALMA) for the stable and reproducible generation of such model aerosols was developed, which presents the following advantages:
-
The model aerosols are complex, consisting of elemental carbon (fresh soot), soot coated with SOA (aged soot), inorganic ions (such as ammonium, sulfate and nitrate) and mineral dust particles.
-
The aerosol mixture can therefore have a controlled amount of semi-volatile and hygroscopic material.
-
The total PM mass concentration of the model aerosols can be adjusted in a range from a few micrograms per cubic metre up to about 500 µg m−3 and remains stable over several hours.
-
The percentage fraction of each PM constituent can be tuned to simulate different urban, suburban or rural aerosols.
-
The size distribution (geometric mean and width of accumulation and coarse mode) can be adjusted by tuning the size distribution of the primary aerosols.
-
The aerosol temperature and relative humidity can be adjusted to simulate winter-like or summer-like environmental conditions (10–40 ∘C, 5 %–90 % RH).
-
A spatial aerosol homogeneity of 2.6 % (k=2) in number concentration can be attained in the mixing chamber, a parameter not evaluated so rigorously, if at all, in previous chamber studies (Hogrefe et al., 2004; Liu et al., 2017; Papapostolou et al., 2017; Schwab et al., 2004; Zhu et al., 2007).
-
The isokinetic sampling system is highly adaptable and can accommodate instruments with flows up to at least 40 L min−1.
-
The design is much more compact compared to other mixing chambers described in the literature (Hogrefe et al., 2004; Horender et al., 2019; Papapostolou et al., 2017; Schwab et al., 2004; Zhu et al., 2007) and can therefore easily fit into a typical laboratory.
As a proof of concept, three different automated PM monitors, the TEOM 1405 (Thermo Scientific, USA), the DustTrak DRX 8533 (TSI Inc., USA) and the Fidas Frog (Palas, Germany), were compared with the reference gravimetric method under three different environmental scenarios. The TEOM 1405, operated at 30 ∘C, agreed very well with the reference gravimetric method in the case of summertime aerosols (21 ∘C) but showed a negative deviation in PM10 mass concentration of ≈15 % when the model aerosol was conditioned at 12 ∘C due to losses of semi-volatile material. The Fidas Frog underestimated the PM10 mass concentration by ≈10 %–30 %, whereas the DustTrak 8533 overestimated the PM10 mass concentration by ≈30 %–50 % depending on the aerosol chemical composition and environmental conditions.
Currently, one limitation of the facility is that the model aerosols cannot be conditioned to temperatures lower than 10 ∘C, but this could be improved by thermally insulating the homogeniser (e.g. with black nitrile foam insulation). Moreover, the composition of the model aerosols could be further refined by adding more components, such as metallic particles with the use of a spark-discharge generator, bioaerosols (e.g. with a Sparging Liquid Aerosol Generator – SLAG, CH Technologies, USA) and particles from biomass burning. This last step could pose challenges since the mass output is usually not very stable over time and the physicochemical properties of the aerosol depend heavily on the combustion material, as well as the stove design.
To conclude, the facility presented in this study can be used to generate ambient-like model aerosols for quality assurance testing, intercomparisons of different instruments, and performance evaluation and calibration with respect to PM mass concentration. The same facility could also be used for other PM measurements such as number concentration and absorption properties (e.g. those related to black carbon). The aerosol facility also provides excellent opportunities for basic aerosol research and aerosol health-related studies.
All data presented in the paper are available for research purposes on request to the authors of the paper.
SH and KV designed, validated and operated the experimental facility; coordinated the intercomparison; and prepared the paper with contributions from all other authors. KA designed the isokinetic sampling probes. CCA assisted during the preparation of the intercomparison and DMK performed analysis. StS performed TXRF analysis. PQ helped design the study, TOMS weighed the filter samples and KW performed ion chromatography analysis. FGL advised on aerosol generation. KD performed high-resolution measurements with a reference optical particle counter. SNS operated the DustTrak DRX during the intercomparison.
The authors declare that they have no conflict of interest.
The opinions expressed and arguments employed herein do not necessarily reflect the official views of the Swiss Government.
Stefan Horender, Kevin Auderset and Konstantina Vasilatou would like to thank their colleagues at the mechanical and electronic workshop (METAS) for valuable technical assistance throughout this study.
This research has been supported by the European Metrology Programme for Innovation and Research (EMPIR) (grant no. 16ENV07 Aeromet) and the Swiss State Secretariat for Education, Research and Innovation (SERI) (grant no. 17.00112). EMPIR is jointly funded by the EMPIR participating countries within EURAMET and the European Union.
This paper was edited by Francis Pope and reviewed by two anonymous referees.
Al-Attabi, R., Dumme, L. F., Kong, L., Schütz, J. A., and Morsi, Y.: High Efficiency Poly(acrylonitrile) Electrospun Nanofiber Membranes for Airborne Nanomaterials Filtration, Adv. Eng. Mater., 20, 1700572, https://doi.org/10.1002/adem.201700572, 2017.
Asbach, C., Hellack, B., Schumacher, S., Bässler, M., Spreitzer, M., Pohl, T., Weber, K., Monz, C., Bieder, S., Schultze, T., and Todea, A.: Anwendungsmöglichkeiten und Grenzen kostengünstiger Feinstaubsensoren, Gefahrstoffe-Reinhaltung der Luft, 78, 242–250, 2018.
Bruns, E. A., El Haddad, I., Keller, A., Klein, F., Kumar, N. K., Pieber, S. M., Corbin, J. C., Slowik, J. G., Brune, W. H., Baltensperger, U., and Prévôt, A. S. H.: Inter-comparison of laboratory smog chamber and flow reactor systems on organic aerosol yield and composition, Atmos. Meas. Tech., 8, 2315–2332, https://doi.org/10.5194/amt-8-2315-2015, 2015.
Cavalli, F., Viana, M., Yttri, K. E., Genberg, J., and Putaud, J.-P.: Toward a standardised thermal-optical protocol for measuring atmospheric organic and elemental carbon: the EUSAAR protocol, Atmos. Meas. Tech., 3, 79–89, https://doi.org/10.5194/amt-3-79-2010, 2010.
CEN/TC 264/WG-15: European Standard EN 12341: Ambient air – Standard gravimetric measurement method for the determination of the PM10 or PM2.5 mass concentration of suspended particulate matter, CEN-CENELEC Management Centre, Brussels, Belgium, 2014.
Chowdhury, Z., Campanella, L., Gray, C., Al Masud, A., Marter-Kenyon, J., Pennise, D., Charron, D., and Zuzhang, X.: Measurement and modeling of indoor air pollution in rural households with multiple stove interventions in Yunnan, China, Atmos. Environ., 67, 161–169, https://doi.org/10.1016/j.atmosenv.2012.10.041, 2013.
Chung, A., Chang, D. P. Y., Kleeman, M. J., Perry, K. D., Cahill, T. A., Dutcher, D., McDougall, E. M., and Stroud, K.: Comparison of Real-Time Instruments Used To Monitor Airborne Particulate Matter, J. Air Waste Manage. Assoc., 51, 109–120, https://doi.org/10.1080/10473289.2001.10464254, 2001.
Corbin, J. C., Lohmann, U., Sierau, B., Keller, A., Burtscher, H., and Mensah, A. A.: Black carbon surface oxidation and organic composition of beech-wood soot aerosols, Atmos. Chem. Phys., 15, 11885–11907, https://doi.org/10.5194/acp-15-11885-2015, 2015a.
Corbin, J. C., Keller, A., Lohmann, U., Burtscher, H., Sierau, B., and Mensah, A. A.: Organic Emissions from a Wood Stove and a Pellet Stove Before and After Simulated Atmospheric Aging Organic Emissions from a Wood Stove and a Pellet Stove Before and After Simulated Atmospheric Aging, Aerosol Sci. Technol., 49, 1037–1050, https://doi.org/10.1080/02786826.2015.1079586, 2015b.
Crilley, L. R., Knibbs, L. D., Miljevic, B., Cong, X., Fairfull-Smith, K. E., Bottle, S. E., Ristovski, Z. D., Ayoko, G. A., and Morawska, L.: Concentration and oxidative potential of on-road particle emissions and their relationship with traffic composition: Relevance to exposure assessment, Atmos. Environ., 59, 533–539, https://doi.org/10.1016/j.atmosenv.2012.05.039, 2012.
Crilley, L. R., Shaw, M., Pound, R., Kramer, L. J., Price, R., Young, S., Lewis, A. C., and Pope, F. D.: Evaluation of a low-cost optical particle counter (Alphasense OPC-N2) for ambient air monitoring, Atmos. Meas. Tech., 11, 709–720, https://doi.org/10.5194/amt-11-709-2018, 2018.
Davison, J. A., Wylie, C. E., McGladdery, C. E., Fettes, C., Haggett, E. F. and Ramzan, P. H. L.: Airborne particulate size and concentrations in five Thoroughbred training yards in Newmarket (UK), Vet. J., 248, 48–50, https://doi.org/10.1016/j.tvjl.2019.04.006, 2019.
Di Antonio, A., Olalekan, M. A. P., Ouyang, B., Saffell, J., and Jones, R. L.: Developing a Relative Humidity Correction for Low-Cost Sensors Measuring Ambient Particulate Matter, Sensors, 18, 2790, https://doi.org/10.3390/s18092790, 2018.
EC-WG: Guidance to the demonstration of equivalence of ambient air monitoring methods, Report by an EC Working Group on Guidance for the Demonstration of Equivalence, available at: http://ec.europa.eu/environment/air/quality/legislation/assessment.htm (last access: 31 August 2020), 2010.
Eisner, A. D. and Wiener, R. W.: Discussion and Evaluation of the Volatility Test for Equivalency of Other Methods to the Federal Reference Method for Fine Particulate Matter, Aerosol Sci. Technol., 36, 433–440, https://doi.org/10.1080/027868202753571250, 2002.
El-Zanan, H. S., Lowenthal, D. H., Zielinska, B., Chow, J. C., and Kumar, N.: Determination of the organic aerosol mass to organic carbon ratio in IMPROVE samples, Chemosphere, 60, 485–496, https://doi.org/10.1016/j.chemosphere.2005.01.005, 2005.
Ess, M. N. and Vasilatou, K.: Characterization of a new miniCAST with diffusion flame and premixed flame options: Generation of particles with high EC content in the size range 30 nm to 200 nm, Aerosol Sci. Technol., 53, 29–44, https://doi.org/10.1080/02786826.2018.1536818, 2019.
Ess, M. N., Berto, M., Keller, A., Gysel, M., and Vasilatou, K.: Laboratory generated coated-soot particles with tunable, well-controlled properties using a miniCAST BC and a micro smog chamber (to be submitted), 2020.
European Parliament: Directive 2008/50/EC of the European Parliament and of the Council of 21 May 2008 on ambient air quality and cleaner air for Europe (OJ L 152, 11.6.2008, p. 1–44), available at: https://eur-lex.europa.eu/legal-content/en/ALL/?uri=CELEX{%}3A32008L0050 (last access: 31 August 2020), 2008.
European Parliament: Consolidated text: Directive 2008/50/EC of the European Parliament and of the Council of 21 May 2008 on ambient air quality and cleaner air for Europe, available at: https://eur-lex.europa.eu/legal-content/EN/TXT/?uri=CELEX:02008L0050-20150918 (last access: 31 August 2020), 2015.
FOEN: Fine particles, available at: https://www.bafu.admin.ch/bafu/en/home/topics/air/info-specialists/air-quality-in-switzerland/fine-particles.html (last access: 31 August 2020), 2018.
Fuzzi, S., Baltensperger, U., Carslaw, K., Decesari, S., Denier van der Gon, H., Facchini, M. C., Fowler, D., Koren, I., Langford, B., Lohmann, U., Nemitz, E., Pandis, S., Riipinen, I., Rudich, Y., Schaap, M., Slowik, J. G., Spracklen, D. V., Vignati, E., Wild, M., Williams, M., and Gilardoni, S.: Particulate matter, air quality and climate: lessons learned and future needs, Atmos. Chem. Phys., 15, 8217–8299, https://doi.org/10.5194/acp-15-8217-2015, 2015.
Grall, S., Debéda, H., Dufour, I., and Aubry, V.: Screen-Printed Microcantilevers for Environmental Sensing, Proceedings, 2, 722, https://doi.org/10.3390/proceedings2130722, 2018.
Grzyb, J. and Lenart-Boron, A.: Bacterial bioaerosol concentration and size distribution in the selected animal premises in a zoological garden, Aerobiologia (Bologna), 35, 253–268, https://doi.org/10.1007/s10453-018-09557-9, 2019.
Hauck, H., Berner, A., Gomiscek, B., Stopper, S., Puxbauma, H., Kundi, M. and Preining, O.: On the equivalence of gravimetric PM data with TEOM and beta-attenuation measurements, J. Aerosol Sci., 35, 1135–1149, https://doi.org/10.1016/j.jaerosci.2004.04.004, 2004.
Heal, M. R., Beverland, I. J., McCabe, M., Hepburn, W., and Agius, R. M.: Intercomparison of five PM10 monitoring devices and the implications for exposure measurement in epidemiological research, J. Environ. Monit., 2, 455–461, https://doi.org/10.1039/b002741n, 2000.
Hogrefe, O., Drewnick, F., Garland Lala, G., Schwab, J. J., and Demerjian, K. L.: Development, Operation and Applications of an Aerosol Generation, Calibration and Research Facility Special Issue of Aerosol Science and Technology on Findings from the Fine Particulate Matter Supersites Program, Aerosol Sci. Technol., 38, 196–214, https://doi.org/10.1080/02786820390229516, 2004.
Horender, S., Auderset, K., and Vasilatou, K.: Facility for calibration of optical and condensation particle counters based on a turbulent aerosol mixing tube and a reference optical particle counter, Rev. Sci. Instrum., 90, 075111, https://doi.org/10.1063/1.5095853, 2019.
Hueglin, C., Gehrig, R., Baltensperger, U., Gysel, M., Monn, C., and Vonmont, H.: Chemical characterisation of PM2.5, PM10 and coarse particles at urban, near-city and rural sites in Switzerland, Atmos. Environ., 39, 637–651, https://doi.org/10.1016/j.atmosenv.2004.10.027, 2005.
Jayaratne, R., Liu, X., Ahn, K.-H., Asumadu-Sakyi, A., Fisher, G., Gao, J., Mabon, A., Mazaheri, M., Mullins, B., Nyarku, M., Ristovski, Z., Scorgie, Y., Phong, T., Dunbabin, M., and Morawska, L.: Low-cost PM2.5 Sensors: An Assessment of their Suitability for Various Applications, Aerosol Air Qual. Res., 20, 520–532, https://doi.org/10.4209/aaqr.2018.10.0390, 2020.
Keller, A. and Burtscher, H.: A continuous photo-oxidation flow reactor for a defined measurement of the SOA formation potential of wood burning emissions, J. Aerosol Sci., 49, 9–20, https://doi.org/10.1016/j.jaerosci.2012.02.007, 2012.
Kim, K.-H., Kabir, E., and Kabir, S.: A review on the human health impact of airborne particulate matter, Environ. Int., 74, 136–143, https://doi.org/10.1016/j.envint.2014.10.005, 2015.
Kingham, S., Durand, M., Aberkane, T., Harrison, J., Wilson, J. G., and Epton, M.: Winter comparison of TEOM, MiniVol and DustTrak PM10 monitors in a woodsmoke environment, Atmos. Environ., 40, 338–347, https://doi.org/10.1016/j.atmosenv.2005.09.042, 2006.
Lee, J. H., Hopke, P. K., Holsen, T. M., and Polissar, A. V: Evaluation of Continuous and Filter-Based Methods for Measuring PM2.5 Mass Concentration, Aerosol Sci. Technol., 39, 290–303, https://doi.org/10.1080/027868290929323, 2005.
Liu, D.-Y., Prather, K. A., and Hering, S. V.: Variations in the Size and Chemical Composition of Nitrate-Containing Particles in Riverside, CA, Aerosol Sci. Technol., 33, 71–86, https://doi.org/10.1080/027868200410859, 2000.
Liu, D., Zhang, Q., Jiang, J., and Chen, D.: Performance calibration of low-cost and portable particular matter (PM) sensors, J. Aerosol Sci., 112, 1–10, https://doi.org/10.1016/j.jaerosci.2017.05.011, 2017.
Manibusan, S. and Mainelis, G.: Performance of Four Consumer-grade Air Pollution Measurement Devices in Different Residences, Aerosol Air Qual. Res., 20, 217–230, https://doi.org/10.4209/aaqr.2019.01.0045, 2020.
McNamara, M. L., Noonan, C. W., and Ward, T. J.: Correction Factor for Continuous Monitoring of Wood Smoke Fine Particulate Matter, Aerosol Air Qual. Res., 11, 315–322, https://doi.org/10.4209/aaqr.2010.08.0072, 2011.
Meyer, M. B., Patashnick, H., Ambs, J. L., and Rupprecht, E.: Development of a Sample Equilibration System for the TEOM Continuous PM Monitor, J. Air Waste Manage. Assoc., 50, 1345–1349, https://doi.org/10.1080/10473289.2000.10464180, 2000.
Niedermeier, D., Voigtländer, J., Schmalfuß, S., Busch, D., Schumacher, J., Shaw, R. A., and Stratmann, F.: Characterization and first results from LACIS-T: a moist-air wind tunnel to study aerosol–cloud–turbulence interactions, Atmos. Meas. Tech., 13, 2015–2033, https://doi.org/10.5194/amt-13-2015-2020, 2020.
Osán, J., Börcsök, E., Czömpöly, O., Dian, C., Groma, V., Stabile, L., and Török, S.: Experimental evaluation of the in-the-field capabilities of total-reflection X-ray fluorescence analysis to trace fine and ultrafine aerosol particles in populated areas, Spectrochim. Acta Part B, 167, 105852, https://doi.org/10.1016/j.sab.2020.105852, 2020.
Papapostolou, V., Zhang, H., Feenstra, B. J., and Polidori, A.: Development of an environmental chamber for evaluating the performance of low-cost air quality sensors under controlled conditions, Atmos. Environ., 171, 82–90, https://doi.org/10.1016/j.atmosenv.2017.10.003, 2017.
Putaud, J.-P., Dingenen, R. Van, Alastuey, A., Bauer, H., Birmili, W., Cyrys, J., Flentje, H., Fuzzi, S., Gehrig, R., Hansson, H. C., Harrison, R. M., Herrmann, H., Hitzenberger, R., Hüglin, C., Jones, A. M., Kasper-Giebl, A., Kiss, G., Kousa, A., Kuhlbusch, T. A. J., Löschau, G., Maenhaut, W., Molnar, A., Moreno, T., Pekkanen, J., Perrino, C., Pitz, M., Puxbaum, H., Querol, X., Rodriguez, S., Salma, I., Schwarz, J., Smolik, J., Schneider, J., Spindler, G., ten Brink, H., Tursic, J., Viana, M., Wiedensohler, A., and Raes, F.: A European aerosol phenomenology - 3: Physical and chemical characteristics of particulate matter from 60 rural, urban, and kerbside sites across Europe, Atmos. Environ., 44, 1308–1320, https://doi.org/10.1016/j.atmosenv.2009.12.011, 2010.
Schwab, J. J., Hogrefe, O., Demerjian, K. L., and Ambs, J. L.: Laboratory Characterization of Modified Tapered Element Oscillating Microbalance Samplers, J. Air Waste Manage. Assoc., 54, 1254–1263, https://doi.org/10.1080/10473289.2004.10471019, 2004.
Schwab, J. J., Felton, H. D., Rattigan, O. V., and Demerjian, K. L.: New York State Urban and Rural Measurements of Continuous PM 2.5 Mass by FDMS, TEOM, and BAM, J. Air Waste Manage. Assoc., 56, 372–383, https://doi.org/10.1080/10473289.2006.10464523, 2006.
Sofowote, U., Su, Y., Bitzos, M. M., and Munoz, A.: Improving the correlations of ambient tapered element oscillating microbalance PM2.5 data and SHARP 5030 Federal Equivalent Method in Ontario: A multiple linear regression analysis, J. Air Waste Manage. Assoc., 61, 104–114, https://doi.org/10.1080/10962247.2013.833145, 2014.
Su, Y., Sofowote, U., Debosz, J., White, L., and Munoz, A.: Multi-Year Continuous PM2.5 Measurements with the Federal Equivalent Method SHARP 5030 and Comparisons to Filter-Based and TEOM Measurements in Ontario, Canada, Atmosphere (Basel), 9, 1–13, https://doi.org/10.3390/atmos9050191, 2018.
US-EPA: National Ambient Air Quality Standards published by the United States Environment Protection Agency, available at: https://www.epa.gov/criteria-air-pollutants/naaqs-table (last access: 31 August 2020), 2016.
Viana, M., Rivas, I., Reche, C., Fonseca, A., Perez, N., Querol, X., Alastuey, A., Alvarez-Pedrerol, M., and Sunyer, J.: Field comparison of portable and stationary instruments for outdoor urban air exposure assessments, Atmos. Environ., 123, 220–228, https://doi.org/10.1016/j.atmosenv.2015.10.076, 2015.
Wall, S. M., Walter, J., and Ondo, J. L.: Measurement of aerosol size distributions for nitrate and major ionic species, Atmos. Environ., 22, 1649–1656, https://doi.org/10.1016/0004-6981(88)90392-7, 1988.
Wallace, L. A., Wheeler, A. J., Kearney, J., Van Ryswyk, K., You, H., Kulka, R. H., Rasmussen, P. E., Brook, J. R., and Xu, X.: Validation of continuous particle monitors for personal, indoor, and outdoor exposures, J. Expo. Sci. Environ. Epidemiol., 21, 49–64, https://doi.org/10.1038/jes.2010.15, 2011.
von der Weiden, S.-L., Drewnick, F., and Borrmann, S.: Particle Loss Calculator – a new software tool for the assessment of the performance of aerosol inlet systems, Atmos. Meas. Tech., 2, 479–494, https://doi.org/10.5194/amt-2-479-2009, 2009.
Weingartner, E., Burtscher, H., Hüglin, C., and Ehara, K.: Semi-continuous mass measurement, in Aerosol Measurement: Principles, Techniques, and Applications, edited by P. Kulkarni, P. A. Baron, and K. Willeke, 155–168, John Wiley & Sons, Inc., Hoboken, New Jersey., 2011.
WHO: Review of evidence on health aspects of air pollution – REVIHAAP Project, available at: https://www.euro. who.int/en/health-topics/environment-and-health/air-quality/ publications/2013/review-of-evidence-on-health-aspects-of-air-pollution (last access: 5 September 2020), 2013.
Yanosky, J. D., Williams, P. L., and Macintosh, D. L.: A comparison of two direct-reading aerosol monitors with the federal reference method for PM2.5 in indoor air, Atmos. Environ., 36, 107–113, https://doi.org/10.1016/S1352-2310(01)00422-8, 2002.
Zhang, J., Marto, J. P., and Schwab, J. J.: Exploring the applicability and limitations of selected optical scattering instruments for PM mass measurement, Atmos. Meas. Tech., 11, 2995–3005, https://doi.org/10.5194/amt-11-2995-2018, 2018.
Zhou, Z., Liu, Y., Yuan, J., Zuo, J., Chen, G., Xu, L., and Rameezdeen, R.: Indoor PM2.5 concentrations in residential buildings during a severely polluted winter: A case study in Tianjin, China, Renew. Sustain. Energy Rev., 64, 372–381, https://doi.org/10.1016/j.rser.2016.06.018, 2016.
Zhu, K., Zhang, J. J., and Lioy, P. J.: Evaluation and Comparison of Continuous Fine Particulate Matter Monitors for Measurement of Ambient Aerosols, J. Air Waste Manage. Assoc., 57, 1499–1506, https://doi.org/10.3155/1047-3289.57.12.1499, 2007.
Zhuang, H., Chan, C. K., Fang, M., and Wexler, A. S.: Size distributions of particulate sulfate, nitrate, and ammonium at a coastal site in Hong Kong, Atmos. Environ., 33, 843–853, https://doi.org/10.1016/S1352-2310(98)00305-7, 1999.
- Abstract
- Introduction
- Design and validation of the experimental set-up
- Chemical characterisation of model aerosols
- Intercomparison of automated PM monitors with the reference gravimetric method
- Conclusions
- Data availability
- Author contributions
- Competing interests
- Disclaimer
- Acknowledgements
- Financial support
- Review statement
- References