the Creative Commons Attribution 4.0 License.
the Creative Commons Attribution 4.0 License.
 | 12 Feb 2021
The Portable Ice Nucleation Experiment (PINE): a new online instrument for laboratory studies and automated long-term field observations of ice-nucleating particles
Michael Adams
Larissa Lacher
Franziska Vogel
Jens Nadolny
Romy Ullrich
Cristian Boffo
Tatjana Pfeuffer
Achim Hobl
Maximilian Weiß
Hemanth S. K. Vepuri
Naruki Hiranuma
Benjamin J. Murray
Atmospheric ice-nucleating particles (INPs) play an important role in determining the phase of clouds, which affects their albedo and lifetime. A lack of data on the spatial and temporal variation of INPs around the globe limits our predictive capacity and understanding of clouds containing ice. Automated instrumentation that can robustly measure INP concentrations across the full range of tropospheric temperatures is needed in order to address this knowledge gap. In this study, we demonstrate the functionality and capacity of the new Portable Ice Nucleation Experiment (PINE) to study ice nucleation processes and to measure INP concentrations under conditions pertinent for mixed-phase clouds, with temperatures from about −10 to about −40 ∘C. PINE is a cloud expansion chamber which avoids frost formation on the cold walls and thereby omits frost fragmentation and related background ice signals during the operation. The development, working principle and treatment of data for the PINE instrument is discussed in detail. We present laboratory-based tests where PINE measurements were compared with those from the established AIDA (Aerosol Interaction and Dynamics in the Atmosphere) cloud chamber. Within experimental uncertainties, PINE agreed with AIDA for homogeneous freezing of pure water droplets and the immersion freezing activity of mineral aerosols. Results from a first field campaign conducted at the Atmospheric Radiation Measurement (ARM) Southern Great Plains (SGP) observatory in Oklahoma, USA, from 1 October to 14 November 2019 with the latest PINE design (a commercially available PINE chamber) are also shown, demonstrating PINE's ability to make automated field measurements of INP concentrations at a time resolution of about 8 min with continuous temperature scans for INP measurements between −10 and −30 ∘C. During this field campaign, PINE was continuously operated for 45 d in a fully automated and semi-autonomous way, demonstrating the capability of this new instrument to also be used for longer-term field measurements and INP monitoring activities in observatories.
- Article
(4072 KB) - Full-text XML
- BibTeX
- EndNote


Atmospheric ice-nucleating particles (INPs) induce ice formation in atmospheric clouds and thus are important for initiating precipitation in mixed-phase clouds and determining the phase of clouds, their albedo, lifetime and other important properties (DeMott et al., 2010). However, the details of these aerosol–cloud–climate interactions remain highly uncertain (Boucher et al., 2013; Fan et al., 2017; Lohmann, 2017). This is partly due to the fact that such clouds are rather complex systems and that the knowledge on the formation, the concentration and the fate of ice crystals is still uncertain (Heymsfield et al., 2017; Korolev et al., 2017).
In the absence of homogeneous freezing, the cloud ice phase is initiated in various ways by INPs, a very small fraction of atmospheric aerosol particles (Vali et al., 2015). In mixed-phase clouds, immersion freezing is thought to be the dominating freezing mechanism (de Boer et al., 2011; Hande and Hoose, 2017; Hoose et al., 2010). Vergara-Temprado et al. (2018) showed INPs to have a strong control of cloud reflectivity over the Southern Ocean. Mülmenstädt et al. (2015) and Field and Heymsfield (2015) showed the ice or snow phase to exist in a large fraction of precipitating clouds, in particular over the continents. This underlines the importance of INPs for cloud radiative properties and precipitation formation, but it should be noted here that the cloud ice phase not only depends on the primary ice formation by INPs, but is also largely influenced by a cascade of secondary ice formation and interaction processes, in particular at temperatures above −15 ∘C (Field et al., 2016). Increased ice crystal concentrations can for example lead to rapid cloud glaciation and associated dissipation (Campbell and Shiobara, 2008; Paukert and Hoose, 2014), as also observed recently in a laboratory cloud chamber experiment (Desai et al., 2019).
Throughout the troposphere, INPs are difficult to identify and to quantify due to their low and largely variable number fraction compared to the total aerosol concentration (DeMott et al., 2010; Kanji et al., 2017). This fraction strongly depends not only on temperature and relative humidity conditions, but also on the particle type, size and surface properties (Pruppacher and Klett, 2010; Holden et al., 2019). Nevertheless, cloud, weather and climate models need to formulate and quantify primary ice formation as accurately as possible (Vergara-Temprado et al., 2018; Waliser et al., 2009). This is achieved by calculating the abundance of INPs with parameterizations based on either laboratory ice-nucleation experiments (Hoose and Möhler, 2012; Murray et al., 2012; Sesartic et al., 2013; Spracklen and Heald, 2014; Vergara-Temprado et al., 2018) or field measurements (DeMott et al., 2010; McCluskey et al., 2018; Tobo et al., 2013; Wilson et al., 2015). A number of different parameterizations for the various pathways of atmospheric ice nucleation in supercooled liquid and cirrus clouds have been developed under different assumptions, based on either temperature- and time-dependent ice formation rates according to classical nucleation rate formulations (Barahona and Nenes, 2009; Kärcher and Lohmann, 2002, 2003), the number concentration of larger aerosol particles (DeMott et al., 2010, 2015), or the temperature-dependent ice nucleation active site (INAS) density on the surface of aerosol particles (Connolly et al., 2009; Harrison et al., 2019; Niemand et al., 2012; Ullrich et al., 2017).
Existing parameterizations are applied in models to calculate and predict primary ice formation in clouds; however, the atmospheric INP data that we can compare with global fields of model-predicted INP concentrations are limited in spatial, temporal and concentration ranges (Burrows et al., 2013; Vergara-Temprado et al., 2017). Hence, there is an urgent need for more INP observation and monitoring not only for constraining INP predictions by models and representing a fuller range of INP sources in those models, but also to extend the database for a better understanding of temperature-dependent INP concentrations throughout the atmosphere and the year. Existing measurements of ambient INP concentrations at mixed-phase cloud temperatures (Kanji et al., 2017) show a great variability not only across the temperature range from about −5 to −35 ∘C (10 orders of magnitudes), but also at a single temperature (∼4 orders of magnitude). Different aerosol types were found to dominate the INP population at specific temperatures.
Most of the previous INP measurements were only sensitive to immersion freezing INPs in the temperature range of mixed-phase clouds and were carried out at boundary layer field sites which were considered to be predominantly influenced by different aerosol types. Measurements in the free troposphere were either performed at high-altitude mountain stations (Boose et al., 2016a, b; DeMott et al., 2003a; Conen et al., 2015; Lacher et al., 2018a, b) or with aircraft-based measurements (Rogers et al., 2001; DeMott et al., 2003b; Prenni et al., 2009; Pratt et al., 2010; Eidhammer et al., 2010; Field et al., 2012), but most of them were also limited to measure immersion freezing INPs at higher temperatures. DeMott et al. (2003b) also measured the concentration of INPs active in the deposition mode at temperatures below −40 ∘C.
The identification of INP types in ambient air remains challenging. Most ambient studies focus on sampling INPs in campaigns over a limited time period and focus on specific air masses like Saharan dust events (Boose et al., 2016b), biogenic source regions (O'Sullivan et al., 2018) or marine environments (Mason et al., 2015; McCluskey et al., 2018), or they use back trajectories to identify source regions (e.g. Lacher et al., 2017; Wex et al., 2019). Depending on the specific campaign goals and objectives, different instruments and methods were used, like continuous flow diffusion chambers (CFDCs) with higher time resolution to for example characterize changing air masses (Boose et al., 2016a; Lacher et al., 2018b), aerosol-filter-based offline methods to achieve high sensitivity for characterizing INPs at higher temperatures or in clean environments (Wex et al., 2019), or a combination of both (Welti et al., 2018). What is missing so far is the long-term monitoring of INPs with high time resolution and over a wide temperature range.
An increasing number of new methods and instruments for INP measurements have been developed and compared to each other during the previous years (DeMott et al., 2011; Hiranuma et al., 2015; Wex et al., 2015; DeMott et al., 2018). The most recent and comprehensive INP instrument and method intercomparison study was the Fifth International Workshop on Ice Nucleation phase 2 (FIN-02), and many of the latest developments for atmospheric INP measurements are included and described with respective references in the overview paper by DeMott et al. (2018). Most of the INP methods showed reasonable agreement with each other, but many of them are time and operator intensive. A general feature is that offline methods based on aerosol filter samples have poor time resolution depending on the required aerosol sampling time of hours to days and require intensive manpower and time for both operation and offline analysis. Most online instruments can only be operated periodically, and also require operator time during the measurements, but can be operated for INP measurements at higher time resolution in particular at low temperature or in polluted environments where concentrations are higher. Only recently, newly developed INP instruments with a higher degree of automation have become available (Bi et al., 2019; Brunner and Kanji, 2021). The automated CFDC instrument used by Bi et al. (2019) performed INP measurements during a period of 1 month in 2018 at temperatures between −20 and −30 ∘C. The CFDC instrument called HINC-Auto (Horizontal Ice Nucleation Chamber) used by Brunner and Kanji (2021) autonomously measured immersion freezing INPs for 90 consecutive days but only at one temperature of −30 ∘C. A combination of both high time resolution and wide temperature range for long-term INP measurements, together with a comprehensive set of high-resolution aerosol analytics, would challenge the comparison to potential driving factors for atmospheric ice nucleation.
This paper presents the development, technical description, working principle, and first laboratory and field applications of the new Portable Ice Nucleation Experiment (PINE). PINE is the first fully automated instrument for laboratory ice nucleation studies and long-term field observations of INPs in a wide temperature range. This paper demonstrates the instrument's ability to measure in the mixed-phase cloud temperature regime from −10 to −40 ∘C. PINE is also able to measure ice nucleation at cirrus cloud temperatures to about −65 ∘C, which is the topic of ongoing studies. Similar to the AIDA (Aerosol Interaction and Dynamics in the Atmosphere) cloud simulation chamber, PINE is based on a pumped expansion principle to induce ice and water supersaturated conditions for aerosol particles sampled either from laboratory setups or natural environments. The instrument is operated in repeated cycles of sampling the aerosol into a pre-cooled cloud chamber, activating the aerosol particles as supercooled droplets and ice crystals by expanding the air inside the cloud chamber and refilling the cloud chamber with fresh aerosol for the next cycle (see Sect. 4).
The idea for PINE resulted from the experience in operating the AIDA facility for cloud experiments at simulated conditions of updraughting atmospheric air parcels. Cloud formation in the rigid but large AIDA chamber with a volume of 84 m3 is induced in a controlled way by lowering the pressure at different rates, starting from well-controlled thermodynamic conditions (Möhler et al., 2003, 2005). With a volume of only about 10 L, the PINE cloud simulation chamber is much smaller, transportable and operated in a fully automated sequence. Similar to the AIDA cloud chamber, PINE also uses the principle of pressure reduction by controlled pumping of air out of the cloud chamber. Therefore, the temperature in the chamber decreases due to expansion cooling, while the relative humidity increases. This causes the aerosol particles, which are present in the chamber prior to the expansion, to act as cloud condensation nuclei (CCN) and/or INPs to form liquid cloud droplets and ice crystals, depending on the temperature, ice supersaturation and the type of aerosol. The starting temperature of each expansion run can be set in a wide range from about −10 to −60 ∘C, depending on the capacity of the cooling system. Large aerosol particles, droplets and ice crystals are measured and counted with an optical particle counter (OPC). Placing the OPC in the vertically oriented pump tube below the cloud chamber was one of the critical development ideas for PINE (see patent applications DE 102018210643A1 and US 20200003671). PINE can be operated both for ice nucleation research in the laboratory and for INP measurements in field campaigns including long-term monitoring activities.
The first version of PINE was successfully tested in January 2016. It consisted of a simple perplex chamber of 10 L volume with manual valve and flow control, as well as a welas 2300 single-particle optical detector from Palas GmbH, Karlsruhe, Germany. Another prototype chamber of about 7 L volume was then built of stainless steel and also operated in a cold room for further proof-of-concept experiments. Based on the development and operational experience with the prototype versions, we developed the first mobile versions PINE-1A and PINE-1B with their own cooling systems and a control system for semi-autonomous operation during laboratory ice nucleation measurements and field INP observations. Because both systems are almost identical, we only refer to PINE-1A in the following sections, for simplicity. PINE-1A can be operated in a temperature range from −10 to about −40 ∘C, was characterized in a series of laboratory experiments and was used in a first field campaign. As a next step, the version PINE-c was developed, which is now commercially available from Bilfinger Noell GmbH in Germany (see https://www.noell.bilfinger.com/pine/#c167514, last access: 3 February 2021). PINE-c is operated in the same way as PINE-1A but received a few new components and features, making it more compact and autonomous for operation in both field and lab studies. This will be detailed in Sect. 3, together with a general technical description of the new PINE instrument. The typical working principle and operation of PINE will be explained in Sect. 4. In Sect. 5 we summarize and discuss some first results from laboratory test and characterization experiments of PINE-1A in comparison with the AIDA cloud chamber. Finally, in Sect. 6, we will present and discuss some results from a first field application of PINE-c, which continuously measured during all 45 d of a field campaign at the U.S. Department of Energy Southern Great Plains (SGP) site in Oklahoma from 1 October to 14 November 2019.
As illustrated in Fig. 1, PINE consists of five major parts: (I) an inlet system, (II) a cloud chamber, (III) a cooling system, (IV) a particle detection system, and (V) a control and data acquisition system. Figure 2 shows a simplified schematics of the PINE setup in the different operational flow configurations that will be discussed in Sect. 3.
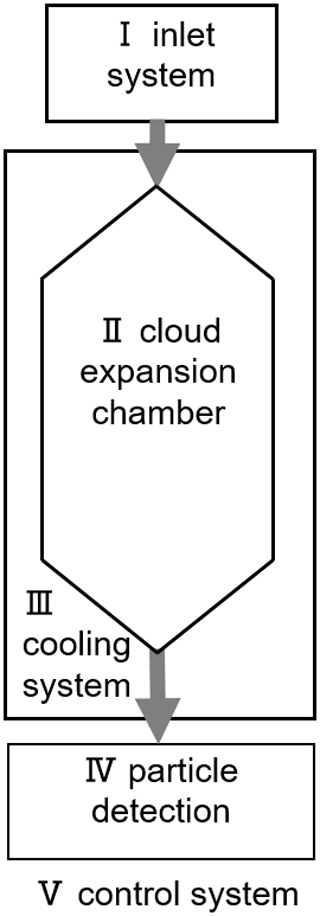
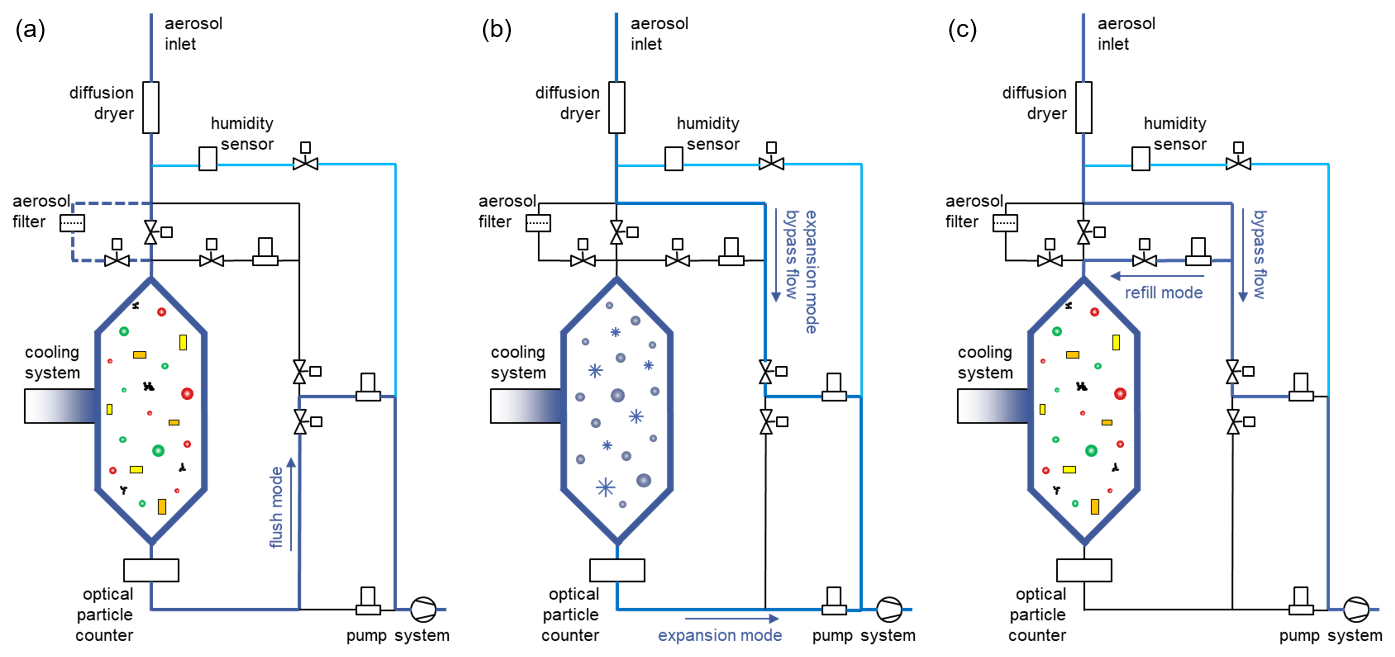
Figure 2 Schematic setup of the PINE. The three figures show the same instrument but in the different run modes (a) flush, (b) expansion and (c) refill. The thick blue lines indicate which parts of the flow setup are active in the respective modes. The sampling gas flow through the humidity sensor (light blue line) is active all the time in a bypass line to the sampling pump. A background measurement can be done by passing the sample flow over an aerosol filter (dashed line, a). In the flush mode (a), aerosol particles are sampled (coloured various symbols) and activate into cloud droplets and ice crystals during the expansion mode (b, blue circles and stars, respectively). During the refill mode, aerosol particles enter the chamber again (c, coloured various symbols).
The inlet system (Fig. 1, part I) is composed of an inlet or sampling tube, a diffusion dryer, a humidity sensor, and a bypass flow section with aerosol particle filter for background measurements. The relative humidity, measured with a dew point sensor (Vaisala DRYCAP® DMT143), has to be high enough to allow cloud droplet formation upon expansion cooling and at the same time low enough to avoid frost formation on the chamber walls (see Sects. 4 and 5). Both the prototype version PINE-1A and the commercial version PINE-c (see Table 1 and Sect. 6) are equipped with two Nafion membrane diffusion dryers (Perma Pure, MD-700-24S-1, length 62 cm) in parallel, in order to reduce the flow through one single dryer and thus enhance the drying efficiency.
Table 1 Configuration and operational parameters of PINE prototype version 1A as well as the currently available commercial version PINE-c.
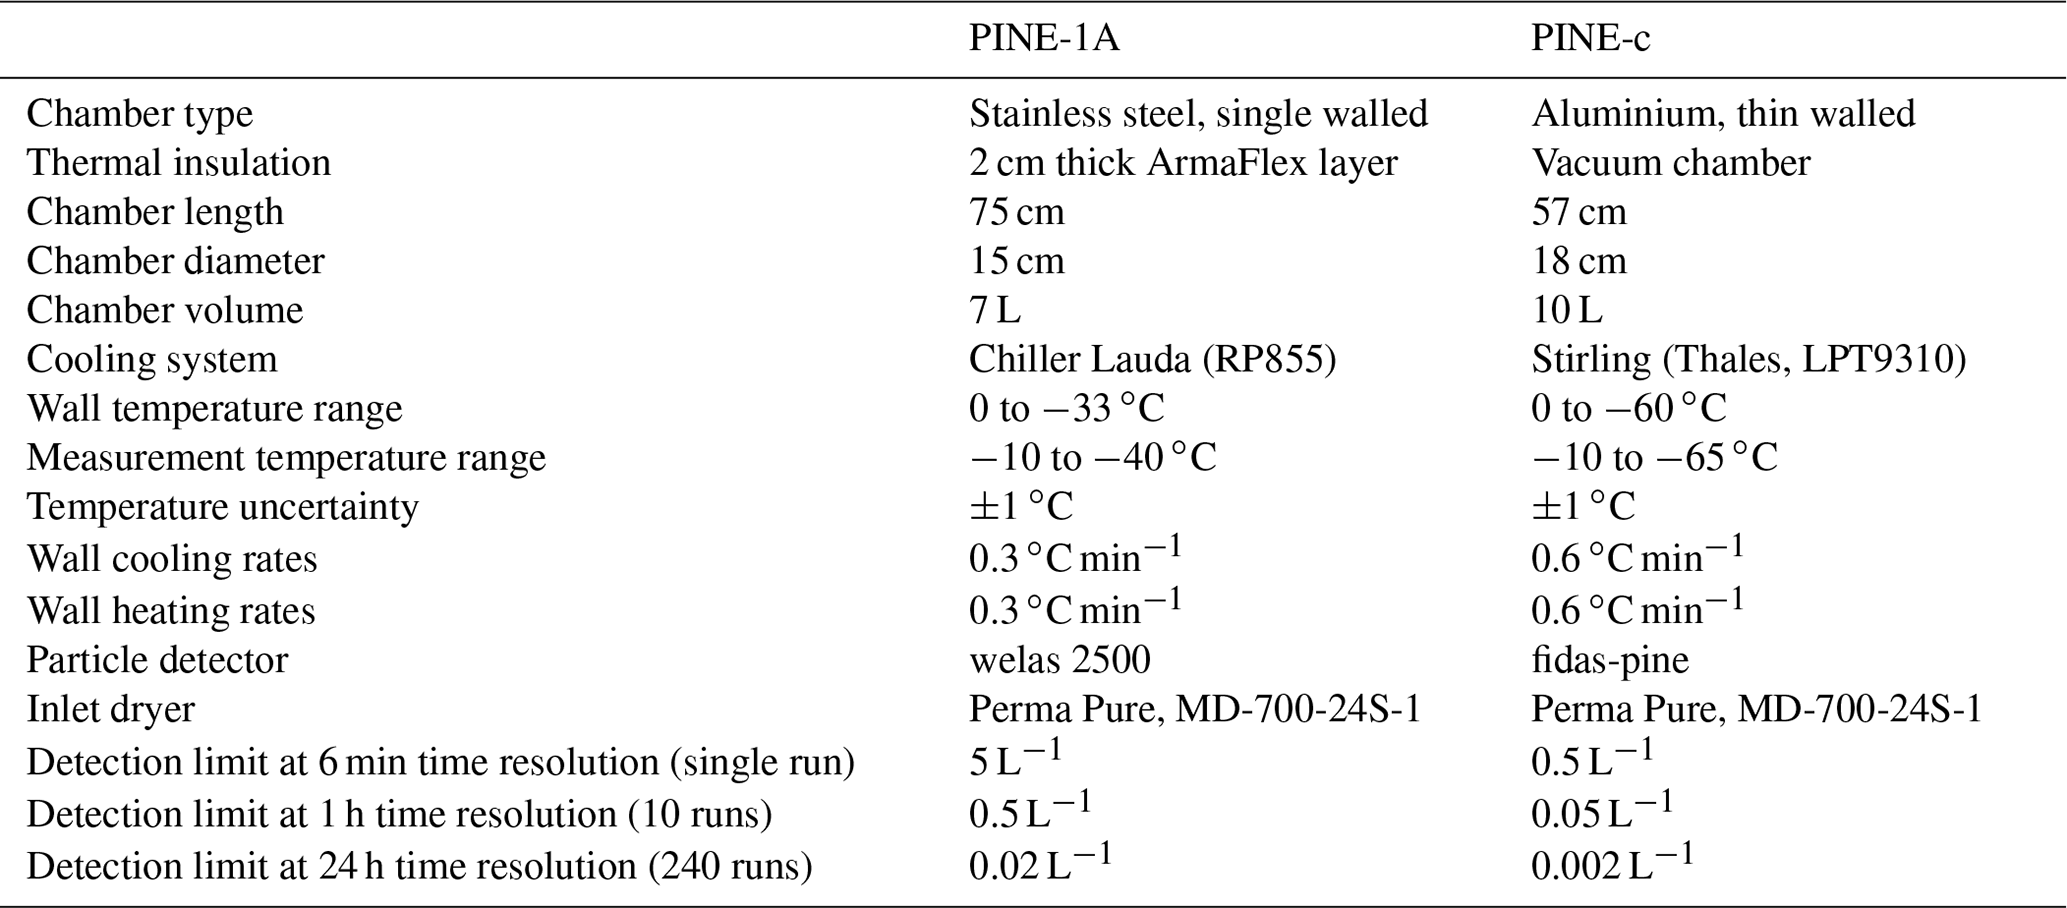
Figure A1 shows the PINE sample flow dryer setup with two Nafion diffusion dryers and other major components. The sample flow passes the straight Nafion tube of 1.7 cm diameter and 62 cm length from top to bottom. The Nafion tube is located inside an airtight stainless-steel tube of 2.5 cm diameter. A second air flow passes the annular gap between the coaxial Nafion and stainless-steel tubes from bottom to top (counterflow arrangement). For simplicity, the PINE system uses ambient air for this counterflow but at reduced absolute pressure. The absolute pressure reduction also reduces the water vapour partial pressure compared the sample flow inside the Nafion tube at ambient pressure. This water vapour partial pressure difference across the Nafion membrane, which is permeable for water molecules, drives a diffusional flow of water molecules from the sample flow to the counterflow. The molar flux of water molecules increases with the pressure difference across the membrane and the residence time of the sample air inside the Nafion tube. As seen in Fig. A2, the drying efficiency increases with pressure reduction. The pressure of the counterflow air is controlled with a pressure controller (Wagner Mess- und Regeltechnik GmbH, type P-702), located between the dryer and the vacuum pump, and the volumetric flow rate of the counterflow air is controlled with a critical orifice at the inlet side. In comparison to conventionally used diffusion dryers with water adsorption material, the membrane dryers used in the PINE setup have the great advantage that they can be operated long term without decreasing their drying efficiency.
Because the current PINE instrument versions are typically operated with a sample flow rate of up to 4 L min−1 (see Sect. 4), two Nafion dryers are used in parallel operation, in order to limit the sample flow through each dryer to 2 L min−1. If needed, the dryers can then be operated with a maximum pressure difference of about 800 hPa to achieve a high drying efficiency with a drop in the sample flow dew point temperature of at least 10 ∘C. As mentioned above, the frost point temperature of the sample air should be close to the wall temperature of the PINE cloud chamber. If the sampled air is too humid, frost may form at the coldest wall sections, potentially causing an increasing ice background due to frost artefacts. However, this was not the case when operating PINE-1A during a first field application for several weeks at temperatures below −25 ∘C and sample air frost point temperatures around −15 ∘C. This was tested by passing the sample flow through the particle filter (see Fig. 2), resulting in zero particle counts in the detection range for ice crystals after about five consecutive runs (Fig. A3). This means that when the sample air is passing through the bypass particle filter, the system detects neither aerosol particles, nor activated droplets nor ice crystals. In the commercial version, the standard location of the dryers is next to the cloud chamber with vertical orientation, so that the sampled air flows in upward direction through the dyers and then passes a 90∘ bend, a horizontal distance of 50 cm and another 90∘ bend to then flow downward into the PINE cloud chamber. The aerosol particle loss for this setup was measured to be less than 20 % for particles smaller than 2 µm diameter. It decreased to about 50 % for particles with an aerodynamic diameter of about 4 µm. The dryers can also be mounted above the PINE chamber for a strictly vertical sample flow, for which a further reduced particle loss can be expected. More systematic sampling efficiency measurements for different configurations and operations will be performed in the future.
The heart of a PINE instrument is a temperature-controlled cloud chamber (part II in Fig. 1). The PINE-1A cloud chamber has a volume of about 7 L and is made of stainless steel, with a central cylindrical part and two cones at the top and the bottom (Table 1). With the cooling system (part III in Fig. 1), the wall temperature of the cloud chamber can either be controlled at a constant value or changed at constant cooling or heating rates of up to 0.3 . The PINE-1A cloud chamber is temperature-controlled with an ethanol bath chiller (Lauda RP 855; Lauda-Königshofen, Germany). This is achieved by circulating the chilled ethanol from the bath chiller through thermo-conductive ethylene propylene diene monomer rubber tubes wound around the chamber. The wall temperature of the chamber is measured with three thermocouples attached to the outer chamber walls at three different locations. The gas temperature inside the cloud chamber is also measured with three thermocouples located in the bottom, middle and upper section of the chamber about 5 cm off the wall (see Fig. A4). All thermocouples have been calibrated to a reference sensor (Lake Shore, model PT-103, sensor type platinum resistor) with an accuracy of ±0.1 ∘C. A minimum wall temperature of about −33 ∘C can be reached with PINE-1A. With additional expansion cooling of the chamber volume (see Sect. 4), a minimum gas temperature of about −40 ∘C is then reached for ice activation of the aerosol particles.
PINE-c is equipped with a thin-walled aluminium cloud chamber with a slightly larger volume of 10 L as compared to PINE-1A (see Table 1). Mainly for thermal insulation, the cloud chamber is located in an evacuated stainless-steel container and is cooled with a Stirling cooler (Thales, LPT9310, Johnson et al., 2014). A dual-opposed-piston compressor driven by linear motors with moving-magnet-flexure-bearing design drives a Stirling-type pulse tube. As a consequence, there is only little vibration introduced to the cloud chamber in direct thermal contact to the pulse tube. The compressor of the cryocooler is force-flow air cooled. Therefore, no cooling liquids are required and the cooling system is maintenance-free. The combination of the low mass and heat capacity of the thin-walled cloud chamber and the high cooling power of the Stirling cooler allows us to cool the PINE-c cloud chamber at a rate of up to approximately 0.6 without any notable effects of measurement disturbance (see Sect. 6). The heating rate of the chamber can also automatically be set to a value up to 0.6 . Therefore, faster temperature scans than with PINE-1A can be achieved for temperature-dependent ice nucleation and INP measurements. PINE-c can also be cooled to a lower wall temperature of −60 ∘C and can therefore be operated at cirrus cloud temperatures in upcoming studies.
The PINE particle detection system (part IV in Fig. 1) consists of an OPC connected to the control and data acquisition system (part V in Fig. 1). Depending on the OPC type, aerosol particles, activated cloud droplets and ice crystals are detected during the different run modes as described in Sect. 4. The OPC is mounted to the pump tube, with a minimum distance to the cloud chamber in order to minimize warming of the cold air flow from the cloud chamber and thus avoid evaporation of supercooled cloud droplets and sublimation or melting of ice crystals. PINE-1A is equipped with a welas 2500 sensor connected to a Promo® 2000 system (Palas GmbH, Karlsruhe, Germany). The same sensor has been operated for many years at the AIDA cloud chamber for cloud droplet and ice crystal detection (Möhler et al., 2006; Wagner and Möhler, 2013). It measures aerosol particles, water droplets and ice crystals with optical sizes between 0.7 and 220 µm diameter, depending on the sensitivity setting of the photomultiplier measuring the intensity of light scattered by single particles when passing the optical detection volume (ODV). The welas sensor records for each detected particle the time of detection, the transit time through the ODV and the intensity of light scattered into a range of scattering angles around 90∘ (sideward scattering). This optical arrangement is favourable for the selective detection of aspherical ice crystals, which are measured at a larger optical size than spherical droplets of the same volume and can therefore more easily be distinguished from droplets by setting a simple threshold for the optical size (see Sect. 4).
The welas 2500 sensor has a well-confined ODV with a sample flow cross-section area Aw=0.24 mm2 and a length lw=0.31 mm. Because the transect time τw of particles through the ODV is also measured, the sample flow rate through the ODV can be calculated as
With the count rate cp of detected particles, one can then calculate the particle number concentration:
On average, the ratio of the volume flow through the ODV to the total volume flow through the welas 2500 sensor is about 0.105. This means that the sensor detects only about 10 % of the particles sampled from the cloud chamber. The PINE-c version uses a new OPC called fidas-pine (Palas GmbH, Karlsruhe, Germany). This new OPC was developed especially for the PINE-c instrument and analyses the full sample flow of up to 5 L min−1 for particles in a size range similar to the welas 2500 sensor. For PINE-c, the particle number concentration can still be calculated with Eq. (2), just by replacing the flow rate through the ODV of the welas 2500 sensor by the total sample flow rate Fem during the expansion mode (see Sect. 4). Therefore, fidas-pine has a 10-times-higher detection rate of particles and thus a 10-times-lower INP concentration detection threshold than PINE-1A.
PINE is controlled via a bespoke LabVIEW program, which sets the respective measurement condition; displays the parameters such as particle size, temperature, pressure and flows; and saves the data internally. Metadata describing the experiment are saved automatically using LabVIEW, such as date and time; type of OPC used; and its configuration, temperature and pressure conditions.
The PINE instrument can either be used in an individual-operator-controlled mode for laboratory ice nucleation experiments and measurements or in a fully automated mode for long-term field measurements and observations of INPs. The instrument's settings during a laboratory or field campaign and the data storage systems of PINE are organized in a well-defined sequence of operations and runs. All data and metadata are saved automatically using the LabVIEW program.
An operation is defined as a specific series of runs, which can be, for example, performed at one temperature, and during a specific sampling time. Each run is composed of a sequence of three modes called “flush”, “expansion” and “refill”. The flow settings of PINE in these three run modes are illustrated in Fig. 2. In the flush mode (Fig. 2a), the sample flow is passed through the cloud chamber to fill it with the aerosol under investigation. This can either be ambient air at a field station where PINE measures INP concentrations or an aerosol generated in a laboratory for ice nucleation studies. For PINE-1A and PINE-c, the sample flow rate is limited to about 4 L min−1 (see Sect. 4). In the flush mode, the sample flow can also be passed through an aerosol filter for background, particle-free measurements.
In the expansion mode (Fig. 2b), the sample flow is kept constant but switched to a bypass line around the cloud chamber. At the same time, a valve at the chamber inlet is closed, and the OPC flow rate is set to a value between 2 and 5 L min−1, such that the pressure in the cloud chamber is lowered at a constant rate and to a pre-defined minimum pressure. This forced gas expansion in the cloud chamber causes an adiabatic cooling and thereby an increase in the relative humidity. When the relative humidity exceeds ice or water saturation, the aerosol particles in the cloud chamber, which were sampled during the flush mode, are then activated to form liquid cloud droplets and/or ice crystals, depending on the temperature and the type of aerosols. Both droplets and ice crystals are measured with an OPC downstream of the chamber. Ice crystals are distinguished from droplets by their larger optical size, as discussed later in this section. The expansion mode flow rate Fem is limited to 2 and 5 L min−1 because both the welas 2500 and fidas-pine OPCs can only be operated to a maximum sample flow rate of 5 L min−1. Smaller flow rates can cause cloud droplet evaporation or ice crystal sublimation in the tube connection between the cloud chamber and the OPC. The end pressure is typically 200 to 300 hPa lower than the start pressure that is given by the pressure of the aerosol sampled during the flush mode.
The refill mode (Fig. 2c) is the final run mode and is carried out to safely re-pressurize the PINE chamber to the start pressure. Once this pressure is reached, the sample flow is immediately switched back to pass the cloud chamber, starting the next run with the same series of flush, expansion and refill modes. A full run takes about 4 to 6 min, depending on the flush time, the pump flow rate during the expansion mode and the end pressure. The higher the sample flow rate, the faster the air in the cloud chamber is replenished and renewed for the next run, and the shorter the flush time that can be chosen. The lower the minimum pressure during expansion, the longer the refill mode time.
Figures 3 to 6 show results from a PINE-1A operation on 25 March 2018 during the HyICE field campaign, which includes a series of 59 identical runs. Each run to ok about 6 min, so the whole operation lasted almost 6 h. During this time, the ambient total aerosol concentration varied between about 900 and 2300 cm−3, with the majority of particles smaller than 0.5 µm in diameter, and PINE-1A sampled ambient air at a flow rate of 3 L min−1. The flush time was set to 4 min. Each expansion was started at a wall temperature of about −26 ∘C with pump flow rate of 4 L min−1 and took about 40 s. An example of one these 59 runs is depicted in Fig. 3, which shows the end of the flush mode, the expansion mode and the refill mode. The data time series are plotted as a function of the time in seconds relative to the start of the expansion mode. A temperature and pressure decrease of about 6 ∘C and 300 hPa, respectively, is observed during the expansion (Fig. 3a). Here, only the data from the lowest of the three gas temperature sensors (see Fig. A4) are plotted, which reaches a minimum value of about −32 ∘C at the end of the expansion after about 40 s.
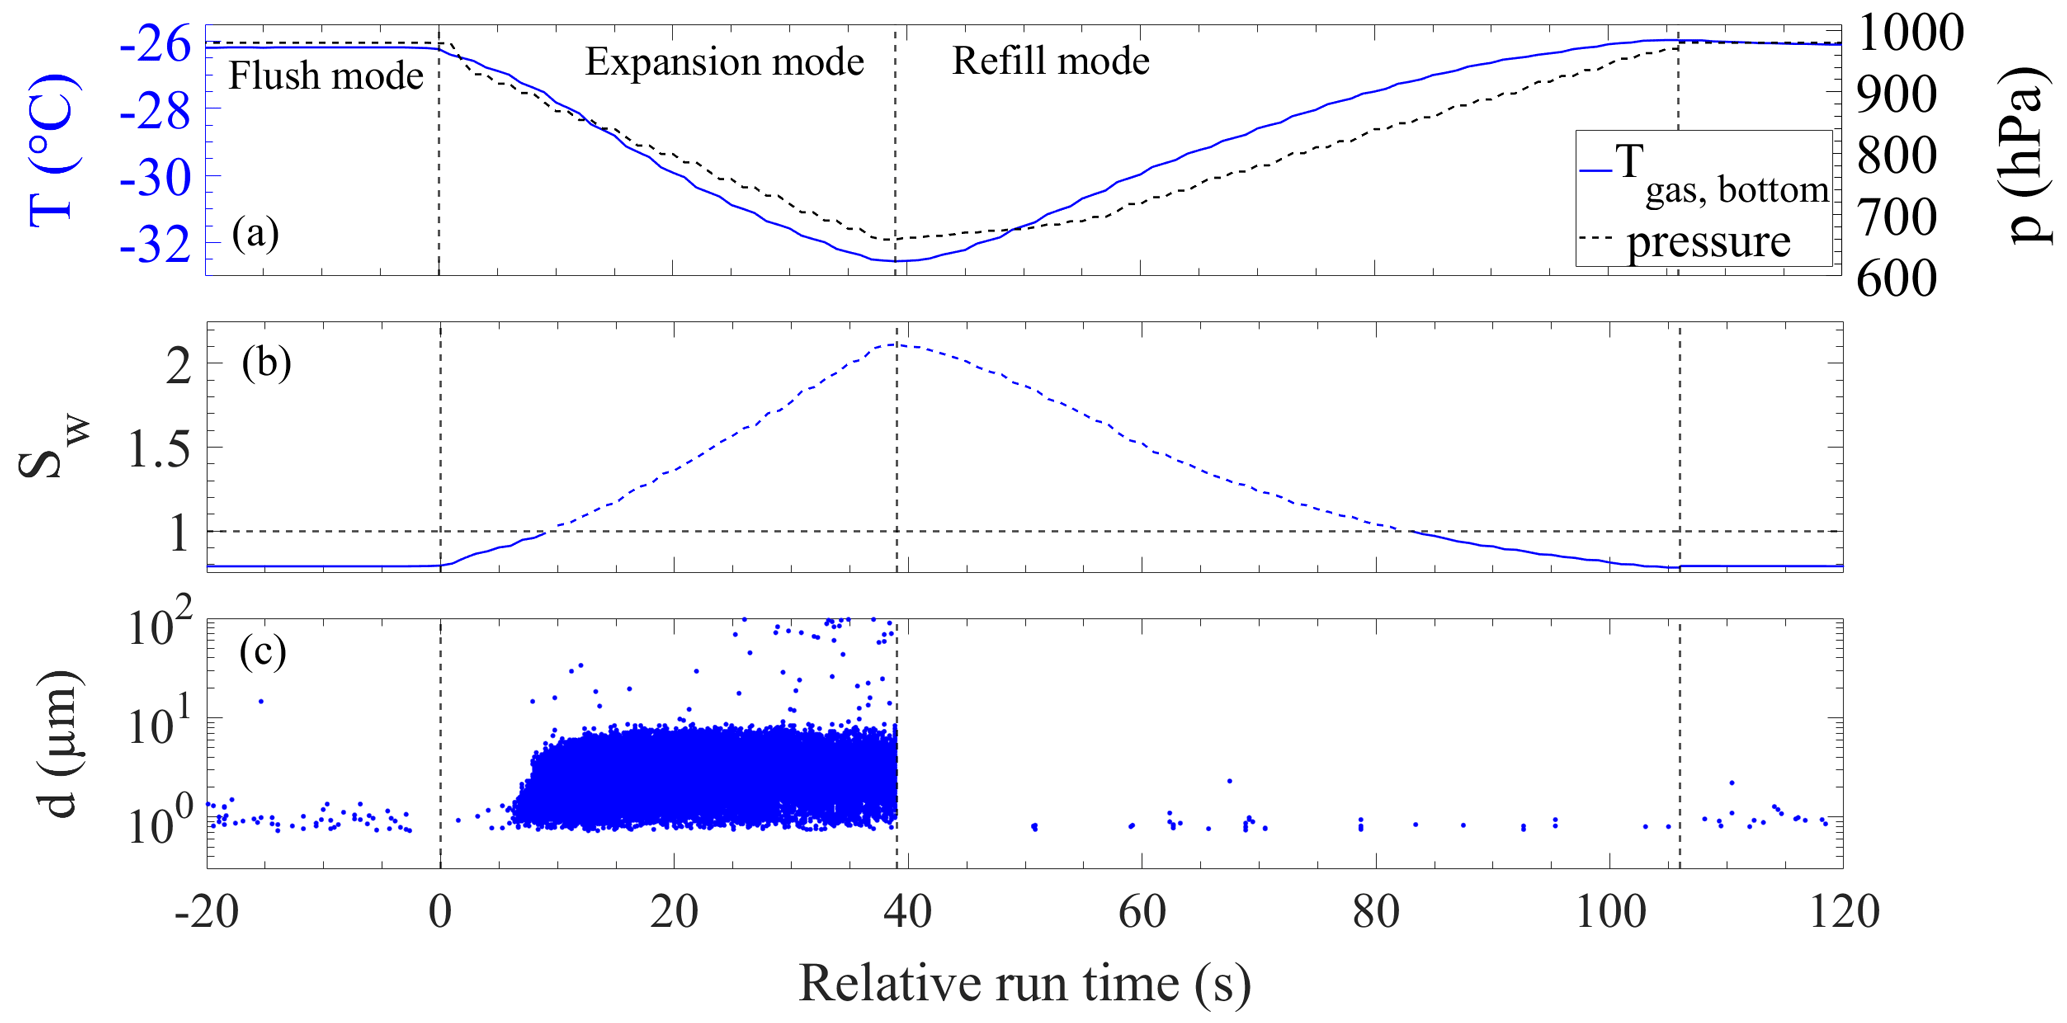
Figure 3 A typical run of PINE-1A showing both cloud droplet formation and ice formation during the cloud expansion mode. (a) Lowest gas temperature (T; blue line) and pressure (p; black line) measured in the chamber. (b) Calculated liquid water saturation ratio (Sw). (c) Optical particle diameter (d) detected in the OPC. This panel shows each single particle detected by the OPC plotted as a single blue dot at the time of occurrence and with its measured optical diameter.
The relative humidity is not directly measured in the PINE cloud chamber but can be calculated from the change in the temperature-dependent water saturation pressure, assuming ice-saturated conditions at the start of the expansion and omitting water vapour sources and sinks during the expansion. This assumption is reasonable because the frost point temperature of the air sampled into the chamber was slightly higher than the average wall temperature. The excess water vapour quickly condenses to the cold chamber walls, so that the water vapour partial pressure at the start of the expansion equals the ice saturation pressure calculated as function of the wall temperature at the start of the expansion (, and the corresponding saturation ratio with respect to liquid water is Sw=0.79 at the same start temperature ∘C. During the expansion mode, the liquid water saturation ratio was then calculated as
with
where p0 is the pressure at the start of the expansion and p the pressure during the expansion. It can be seen that after about 10 s, the calculated Sw exceeds 1 (Fig. 3b). Note that S will in reality be limited by the growth of cloud droplets but that conditions of S>1 indicate conditions where a liquid cloud could form. This roughly corresponds with the start of cloud droplet activation as shown in panel (c) of Fig. 3, shown by the sudden occurrence of a large number of particles with diameters up to 10 µm. This panel shows each single particle detected by the OPC plotted as a single blue dot at the time of occurrence and with its measured optical diameter. With ongoing pressure reduction and related cooling, a small number of particles is detected at larger optical size, with diameters larger than the dense cloud of liquid droplets (Fig. 3c). Those particles are identified as ice crystals formed by immersion freezing of only a minor droplet fraction. The expansion mode stops after about 40 s, and the chamber is refilled to ambient pressure within about 1 min. The next run is started with the flush mode, filling the cloud chamber again with ambient aerosol particles for the next expansion run. Refilling causes compression of the chamber air and related warming (see upper panel of Fig. 3). This also leads to the evaporation of the droplets and ice crystals after some time; however, the abrupt stop of particle recording is related to the fact that the pump flow rate through the OPC is stopped at the end of expansion, so that only a few particles are moving through the OPC detection volume during the refill mode.
For the same PINE-1A operation during the HyICE field campaign, there is little run-to-run variation for the total OPC counts per second of run time (Fig. 4). This means that PINE is able to reproduce the formation of the supercooled droplet cloud in repeated runs at constant sampling and operation conditions, which provides a good basis for conducting series of immersion mode INP and freezing measurements at high precision. The small grey dots in this figure show the OPC count rates of individual runs, and the bigger black circle shows the mean over all 59 runs of this operation. The variation can partly be explained by the natural variability of the ambient aerosol concentration, which also causes a variation of the droplet number concentration. As mentioned above, the aerosol number concentration varied by about a factor of 2 between 900 and 2300 cm−3.
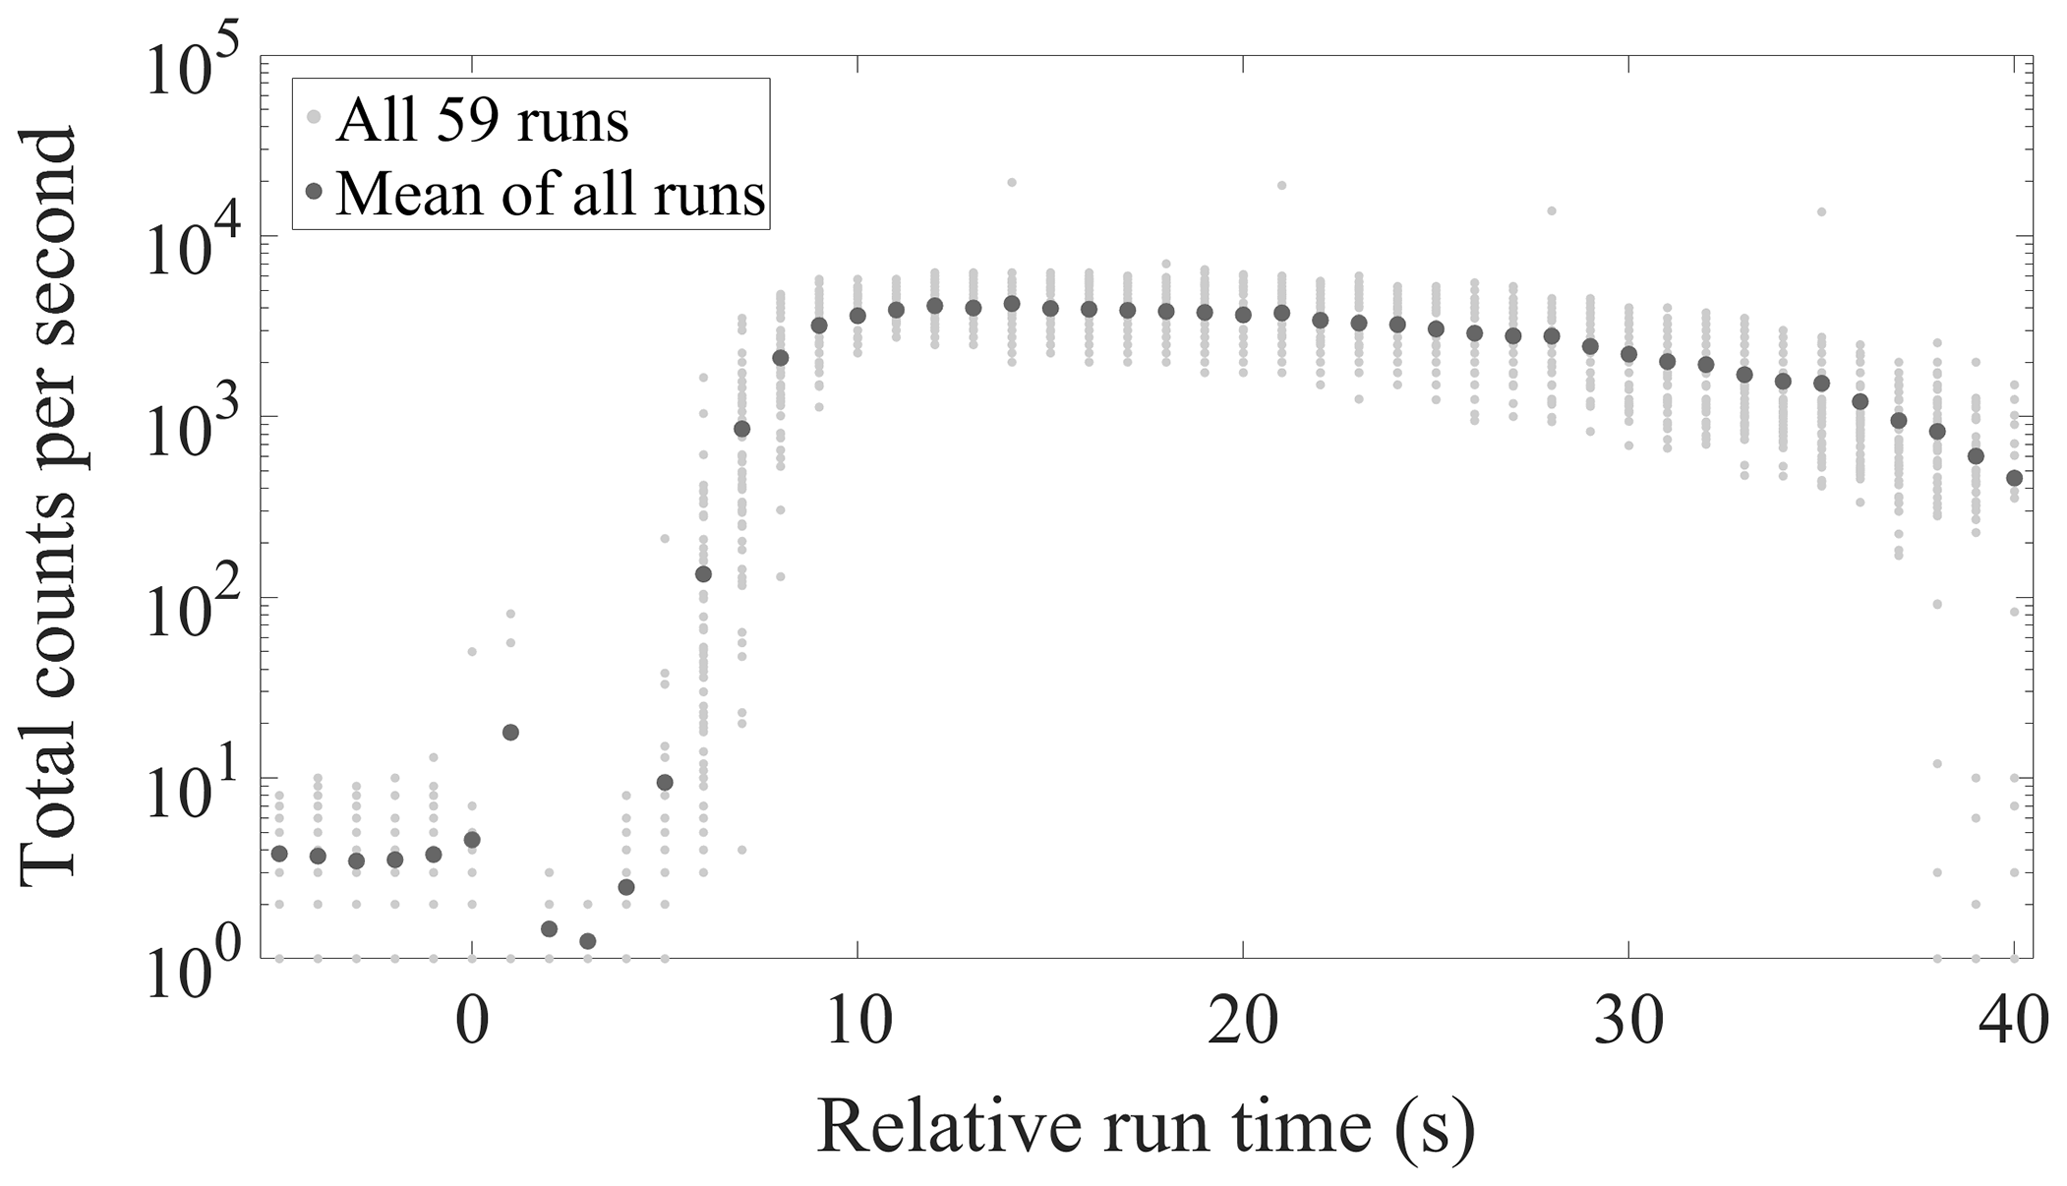
Figure 4 Total number counts measured with PINE-1A in 1 s time intervals of 59 consecutive runs during the HyICE field campaign (operation 64 on 25 March 2018). The measured count rates are plotted as a function of time relative to the start of the expansion. The small grey dots in this figure show the OPC count rates of individual runs, and the bigger black circle shows the mean over all 59 runs of this operation. Before the start of the expansion, only larger aerosol particles are measured. The sharp increase after about 6 s of expansion is due to CCN activation of the aerosol particles in the chamber and the growth of droplets.
Not only cloud droplets but also ice crystals were detected during the same operation as shown by the occurrence of particles larger than ∼10 µm (Fig. 3c). The whole size distribution of both cloud droplet and ice crystals (Fig. 5) reveals that there is only little variation from run to run, at least for the droplet mode with maximum diameters of ∼10 µm. Larger particles are identified as ice crystals and can be distinguished from the droplets by setting a size threshold close to the end (the right edge) of the sharp droplet mode. The use of a simple size threshold to distinguish between ice crystals and droplets is supported by the fact that the sideward scattering geometry of both the welas and fidas sensors detects aspherical particles with a much larger scattering intensity than spherical particles of the same volume and refractive index. Järvinen et al. (2014) determined an average oversizing factor of 2.2 for the welas sensor. For individual ice crystals, this factor can be much larger depending on their size, shape and orientation in the OPC detection volume.
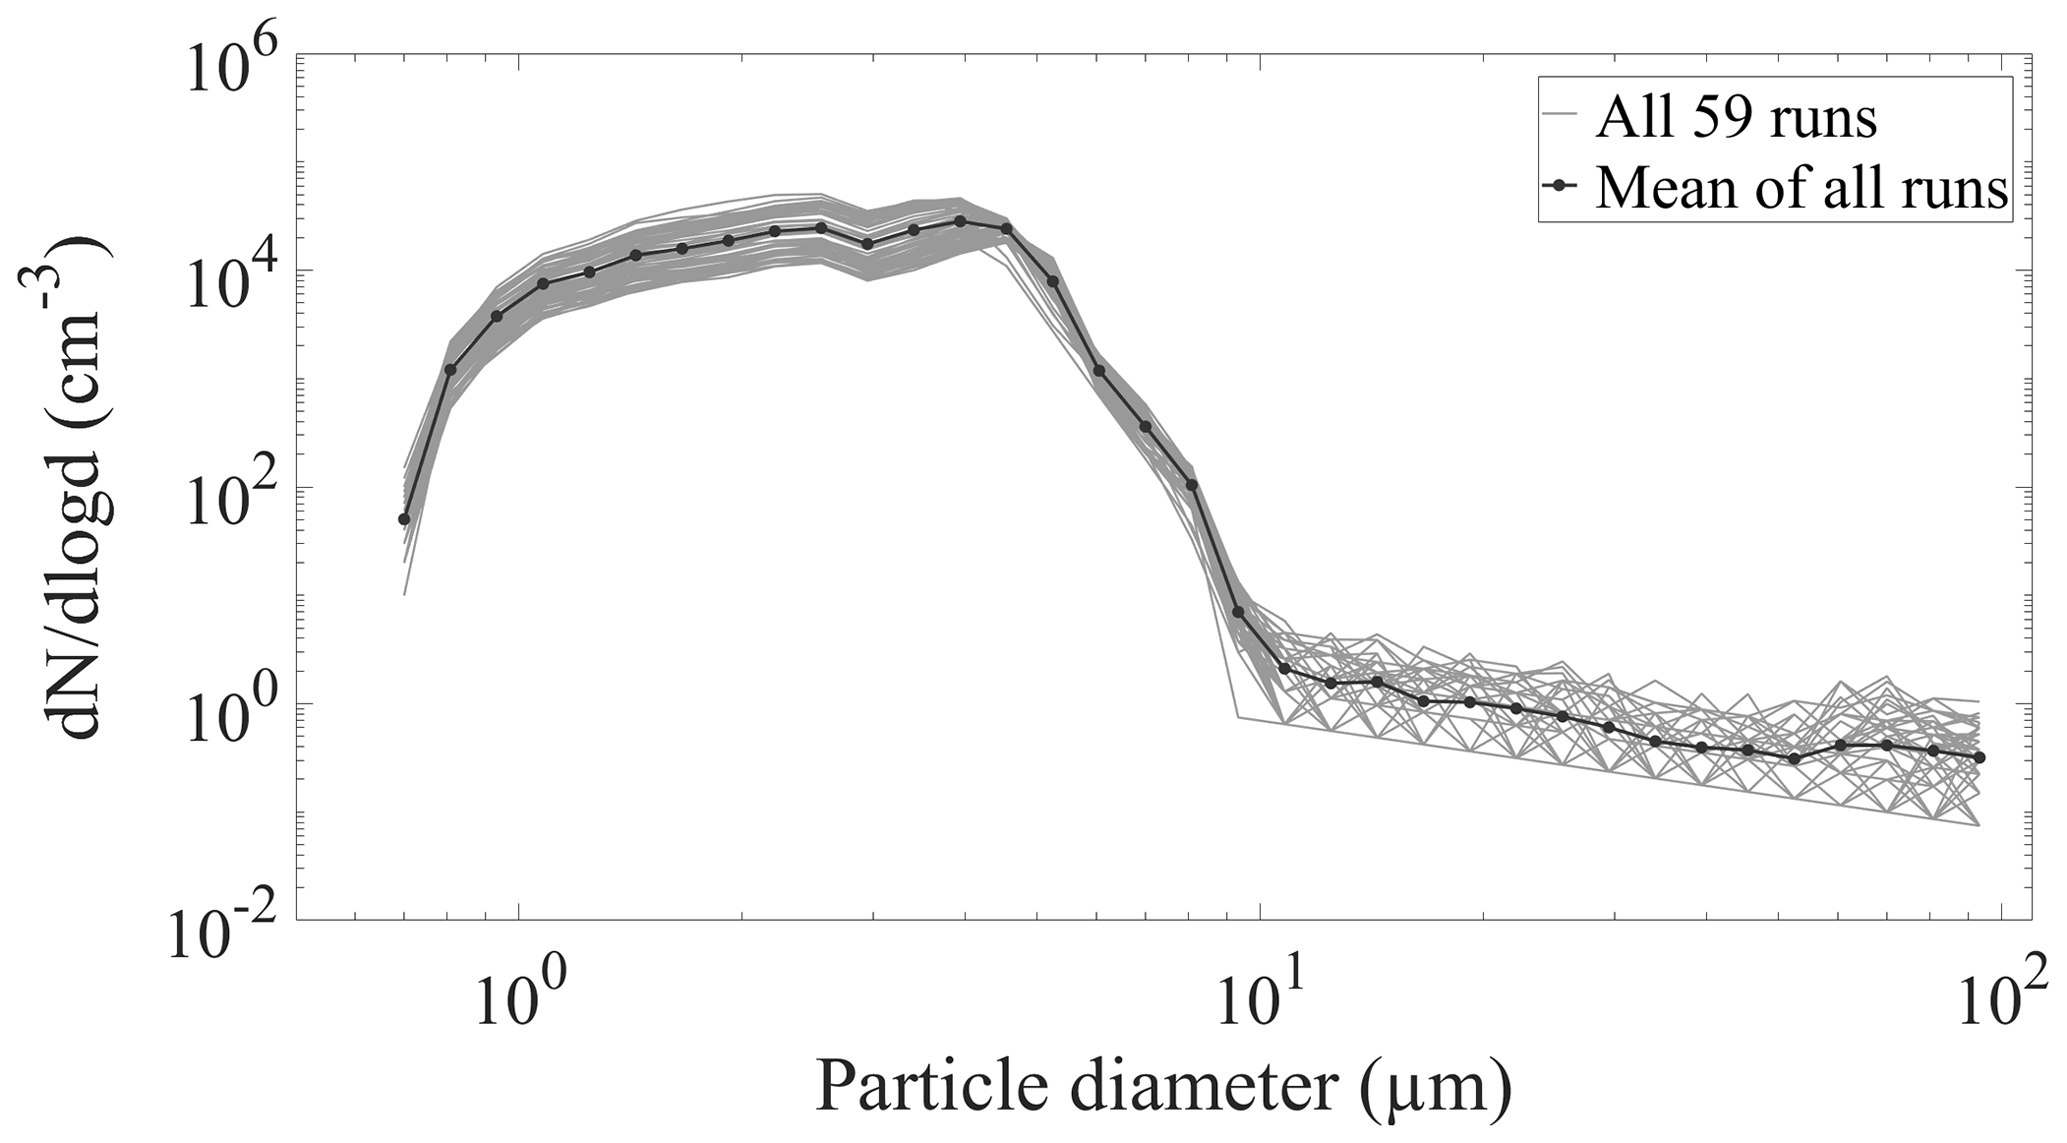
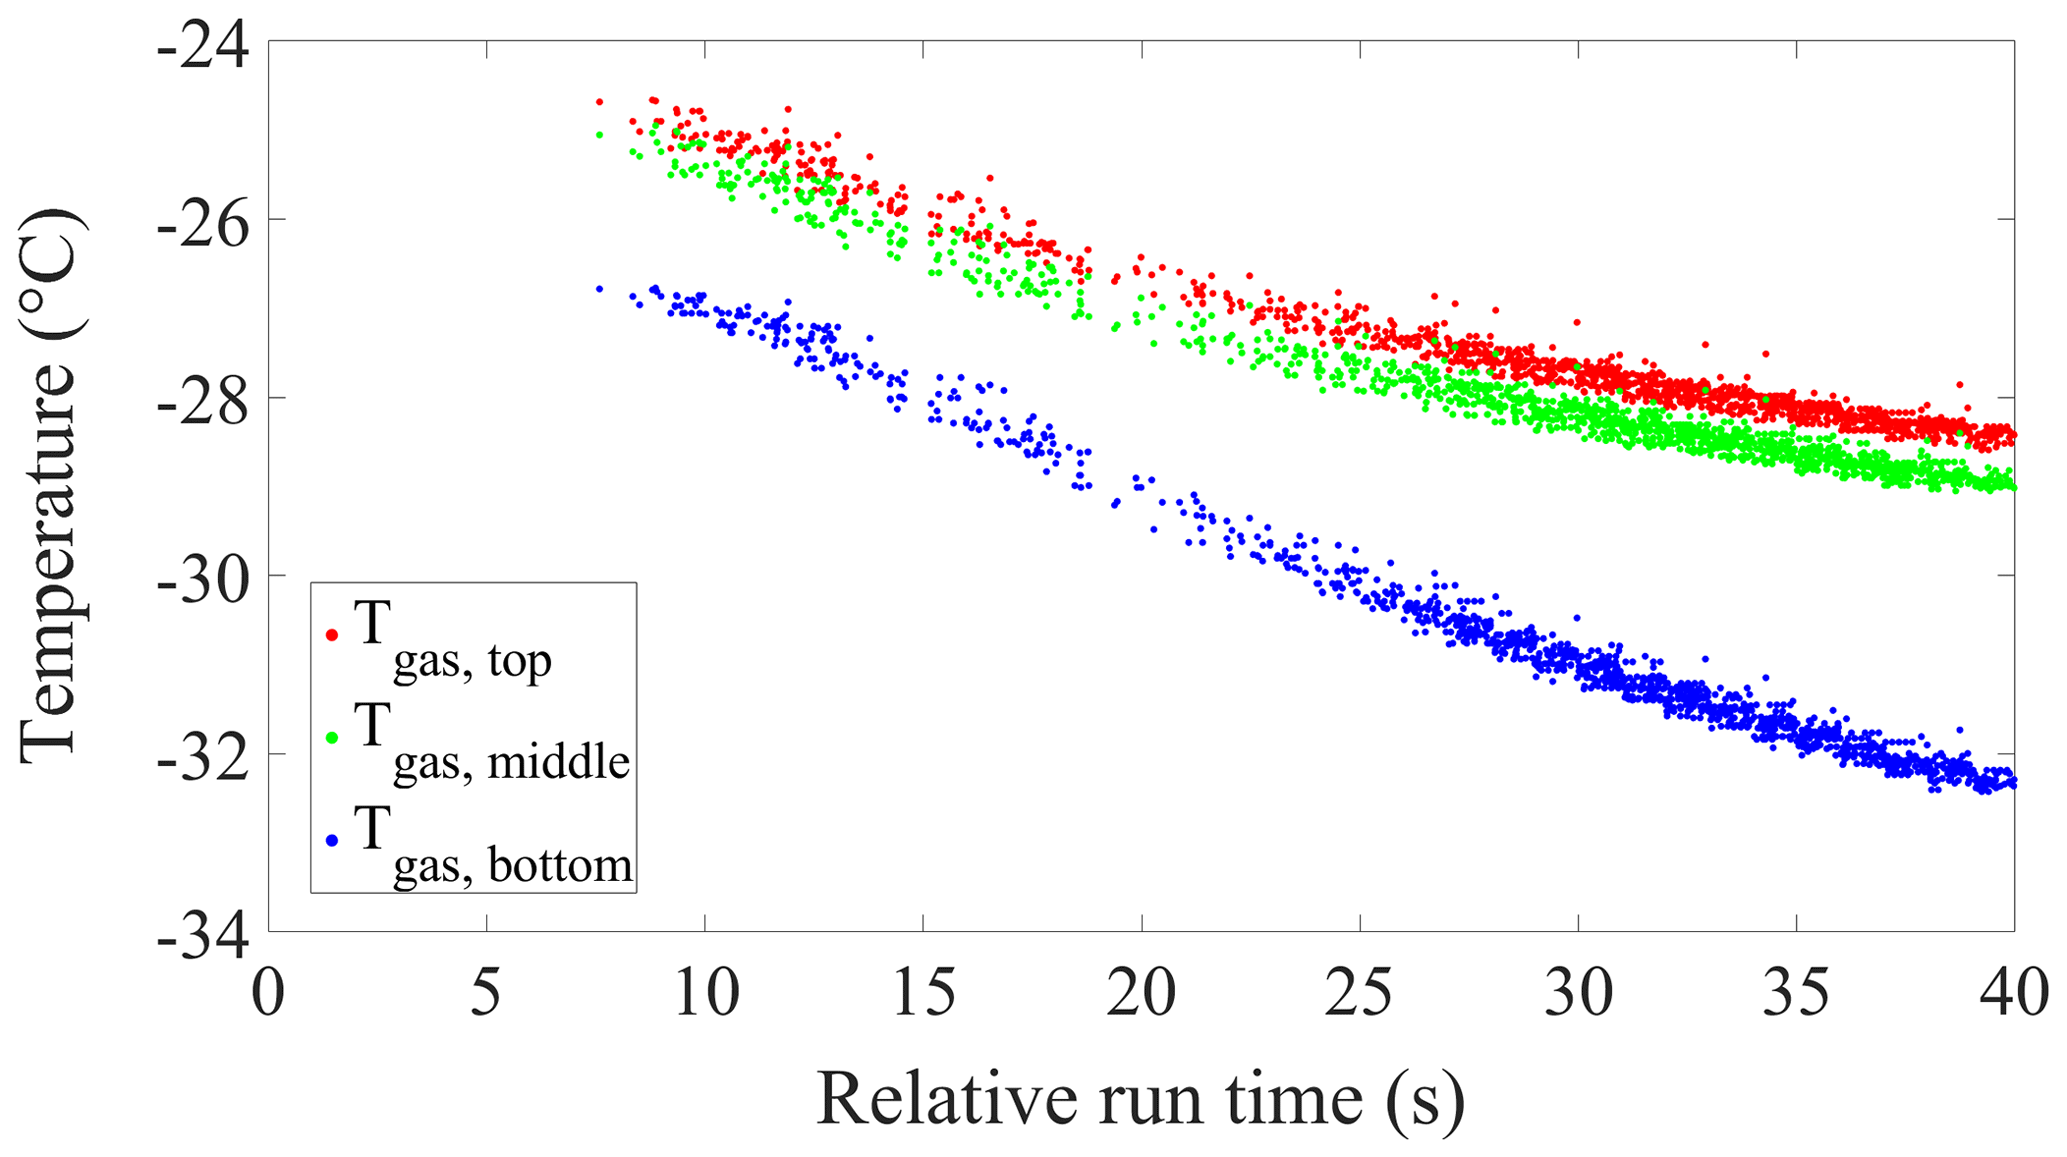
Figure 6 The data points show event temperatures of all ice crystals measured with PINE-1A during the same operation of 59 runs shown in Figs. 4 and 5. The events are plotted as a function of the relative run time at which they were detected, and the gas temperatures were measured at the same time with three sensors located in the lower (blue), the middle (green) and the upper (red) part of the chamber.
Based on Eq. (1), the immersion mode INP number concentration measured in one run of the PINE-1A system can then be calculated by dividing the total number ΔNice of ice crystals detected by the total volume ΔVw of air passing the ODV of the welas OPC during the expansion mode after the formation of the supercooled liquid cloud:
where Fw is the volumetric flow rate through the optical detection volume of the welas sensor and Δtem the duration of the expansion mode from the start of liquid cloud formation (see also Sect. 3 and Eq. 2). For the welas 2500 sensor, ΔVw is about 10 % of the total volume ΔVem passing the OPC during the same time. For the PINE-c system equipped with a fidas-pine (fp) sensor analysing the total pump flow for particles (see Sect. 3), the INP number concentration results from
Examples from PINE-1A at higher temperatures without ice crystal formation prove that this right edge of the activated droplet size distribution is indeed rather sharp in typical expansion runs (Fig. A5). For data interpretation, the size threshold to distinguish between droplets and ice crystals can be set manually; however, it varies with operation temperature and droplet number concentration. Ongoing activities for improving the operation and data analysis tools for PINE also focus on developing an automated procedure for setting this threshold. Counting all particles larger than this threshold as ice crystals is a simple straightforward procedure but neglects smaller ice particles which may also be present in the overlapping size range with the droplets and may cause an underestimation of the ice crystal number concentration. Therefore, the PINE instrument was also operated next to the AIDA cloud chamber for homogeneous droplet freezing and immersion freezing experiments in order to identify and quantify potential systematic uncertainties and biases (see Sect. 5).
In addition to detecting the accurate number of ice crystals, the quality of ice nucleation and INP measurements also depends on measuring the precise temperature at which the ice crystals are actually nucleated, either homogeneously or at the surface of an INP. The variability of the gas temperature in the PINE cloud chamber during 59 expansions is illustrated in Fig. 6. Here, all ice crystals detected during the 59 expansions are plotted for the relative time after the start of the run in which they were measured, and the respective gas temperature is measured with three sensors located in the lower (blue), the middle (green) and the upper (red) part of the chamber (see Fig. A4). First of all, one can see that the number of ice crystals, and thereby also the number of immersion freezing INPs that caused the ice formation in these expansions, increases with decreasing temperature, which reflects the temperature-dependent INP number concentration in ambient air. For individual sensors, the temperature variability from run to run is less than about 0.5 ∘C, clearly underlining that PINE is able to detect the temperature-dependent ice crystal formation from run to run at well-controlled conditions. However, there is an increasing deviation of the temperature readings at the different locations in the PINE cloud chamber, with the lowest temperature measured at the bottom and the largest at the top. This inhomogeneity of the temperature across the chamber arises from the fact that there is an increasing temperature difference between the expanding gas and the almost constant wall temperature. This causes an increasing heat flux into the chamber volume and thus an increasing temperature distortion and deviation from the adiabatic temperature profile. The hereby formed warm air tends to be collected in the top part of the chamber. The related temperature variability inside the cloud chamber impacts the temperature uncertainty for the INP and ice nucleation detection. However, it can be assumed that most of the ice crystals detected in the PINE expansion mode are formed at the lowest temperature in the bottom part of the chamber, where all the air flowing to the OPC passes through. Since ice nucleation is a strong function of temperature, it is a good first-order approximation to assume the coldest temperature in the chamber to guide the ice nucleation. This assumption will be solidified by the results of experiments presented and discussed in the following section.
An important part of PINE operations is the background runs during which the sampled air is guided through a filter while the operation runs are ongoing. After typically 5 to 10 runs, the chamber becomes particle-free, and as such any remaining particle counts indicate the presence of frost formation on the walls or a leak in the chamber or pipework. A typical background measurement, where almost no particles are present after five cycles, is presented in Fig. A3. Regular background run series are performed with PINE at least during longer measurement phases at low temperatures. A frost-free chamber is a prerequisite for operating PINE with the highest sensitivity. In the event of zero background conditions, the detection limit for INP number concentrations can be calculated by dividing the minimum number of ice crystals detected in a certain volume of air. In one expansion with PINE-1A and PINE-c analysing about 0.2 and 2 L of air per run, respectively, the resulting one count detection threshold is 5 and 0.5 L−1, respectively (see also Table 1). Note that the detection limit of PINE-1A is a factor of 10 lower because only about 10 % of the pump flow during the expansion is analysed, whereas the OPC of PINE-c detects all ice crystals in the pump flow. If 10 consecutive runs are conducted and summed up in 1 h, assuming the total run time is set to 6 min, about 10 times more volume of air is analysed, and all ice crystals detected can be summed up, so that the INP detection limits are reduced by a factor of 10 to 0.5 and 0.05 L−1 for PINE-1A and PINE-c, respectively, with a time resolution of 1 h. When summing up over a whole day of subsequent runs, the detection limits are further reduced to 0.02 and 0.002 L−1, respectively.
During several test series, immersion freezing and cloud droplet freezing measurements with PINE-1A were compared to the AIDA cloud camber results. For these intercomparison studies, PINE-1A sampled aerosols directly from the AIDA chamber and was operated at similar wall temperatures to the AIDA cloud chamber. Therefore, the cloud expansion runs covered a similar temperature range and as such allowed the intercomparison of temperature-dependent freezing rates or INP concentrations. Homogeneous freezing of supercooled water droplets is known from classical nucleation theory and from literature results (Pruppacher and Klett, 2010; Koop and Murray, 2016) to occur at temperatures between about −35 and −37 ∘C. Figure 7 shows the freezing of water droplets to be measured with PINE-1A in the expected temperature range. As in the experiments by Benz et al. (2005), aqueous sulfuric acid particles were first added to the AIDA chamber. Then, the aerosol particles with a diameter around 0.8 µm and a number concentration of about 200 cm−3 were sampled into the PINE-1A chamber for its homogeneous freezing experiments, followed by an AIDA cloud expansion experiment with the same aerosol. Figure 7 shows the onset temperature of the homogeneous freezing in PINE-1A to agree with the results of the AIDA cloud expansion experiment. The PINE-1A data are plotted as a function of the temperature measured with the bottom temperature sensor, which always measures the lowest temperature during a run (see Fig. 6). This result underlines the assumption that the ice formation measured with PINE is mainly controlled by the minimum temperature in the cloud chamber.
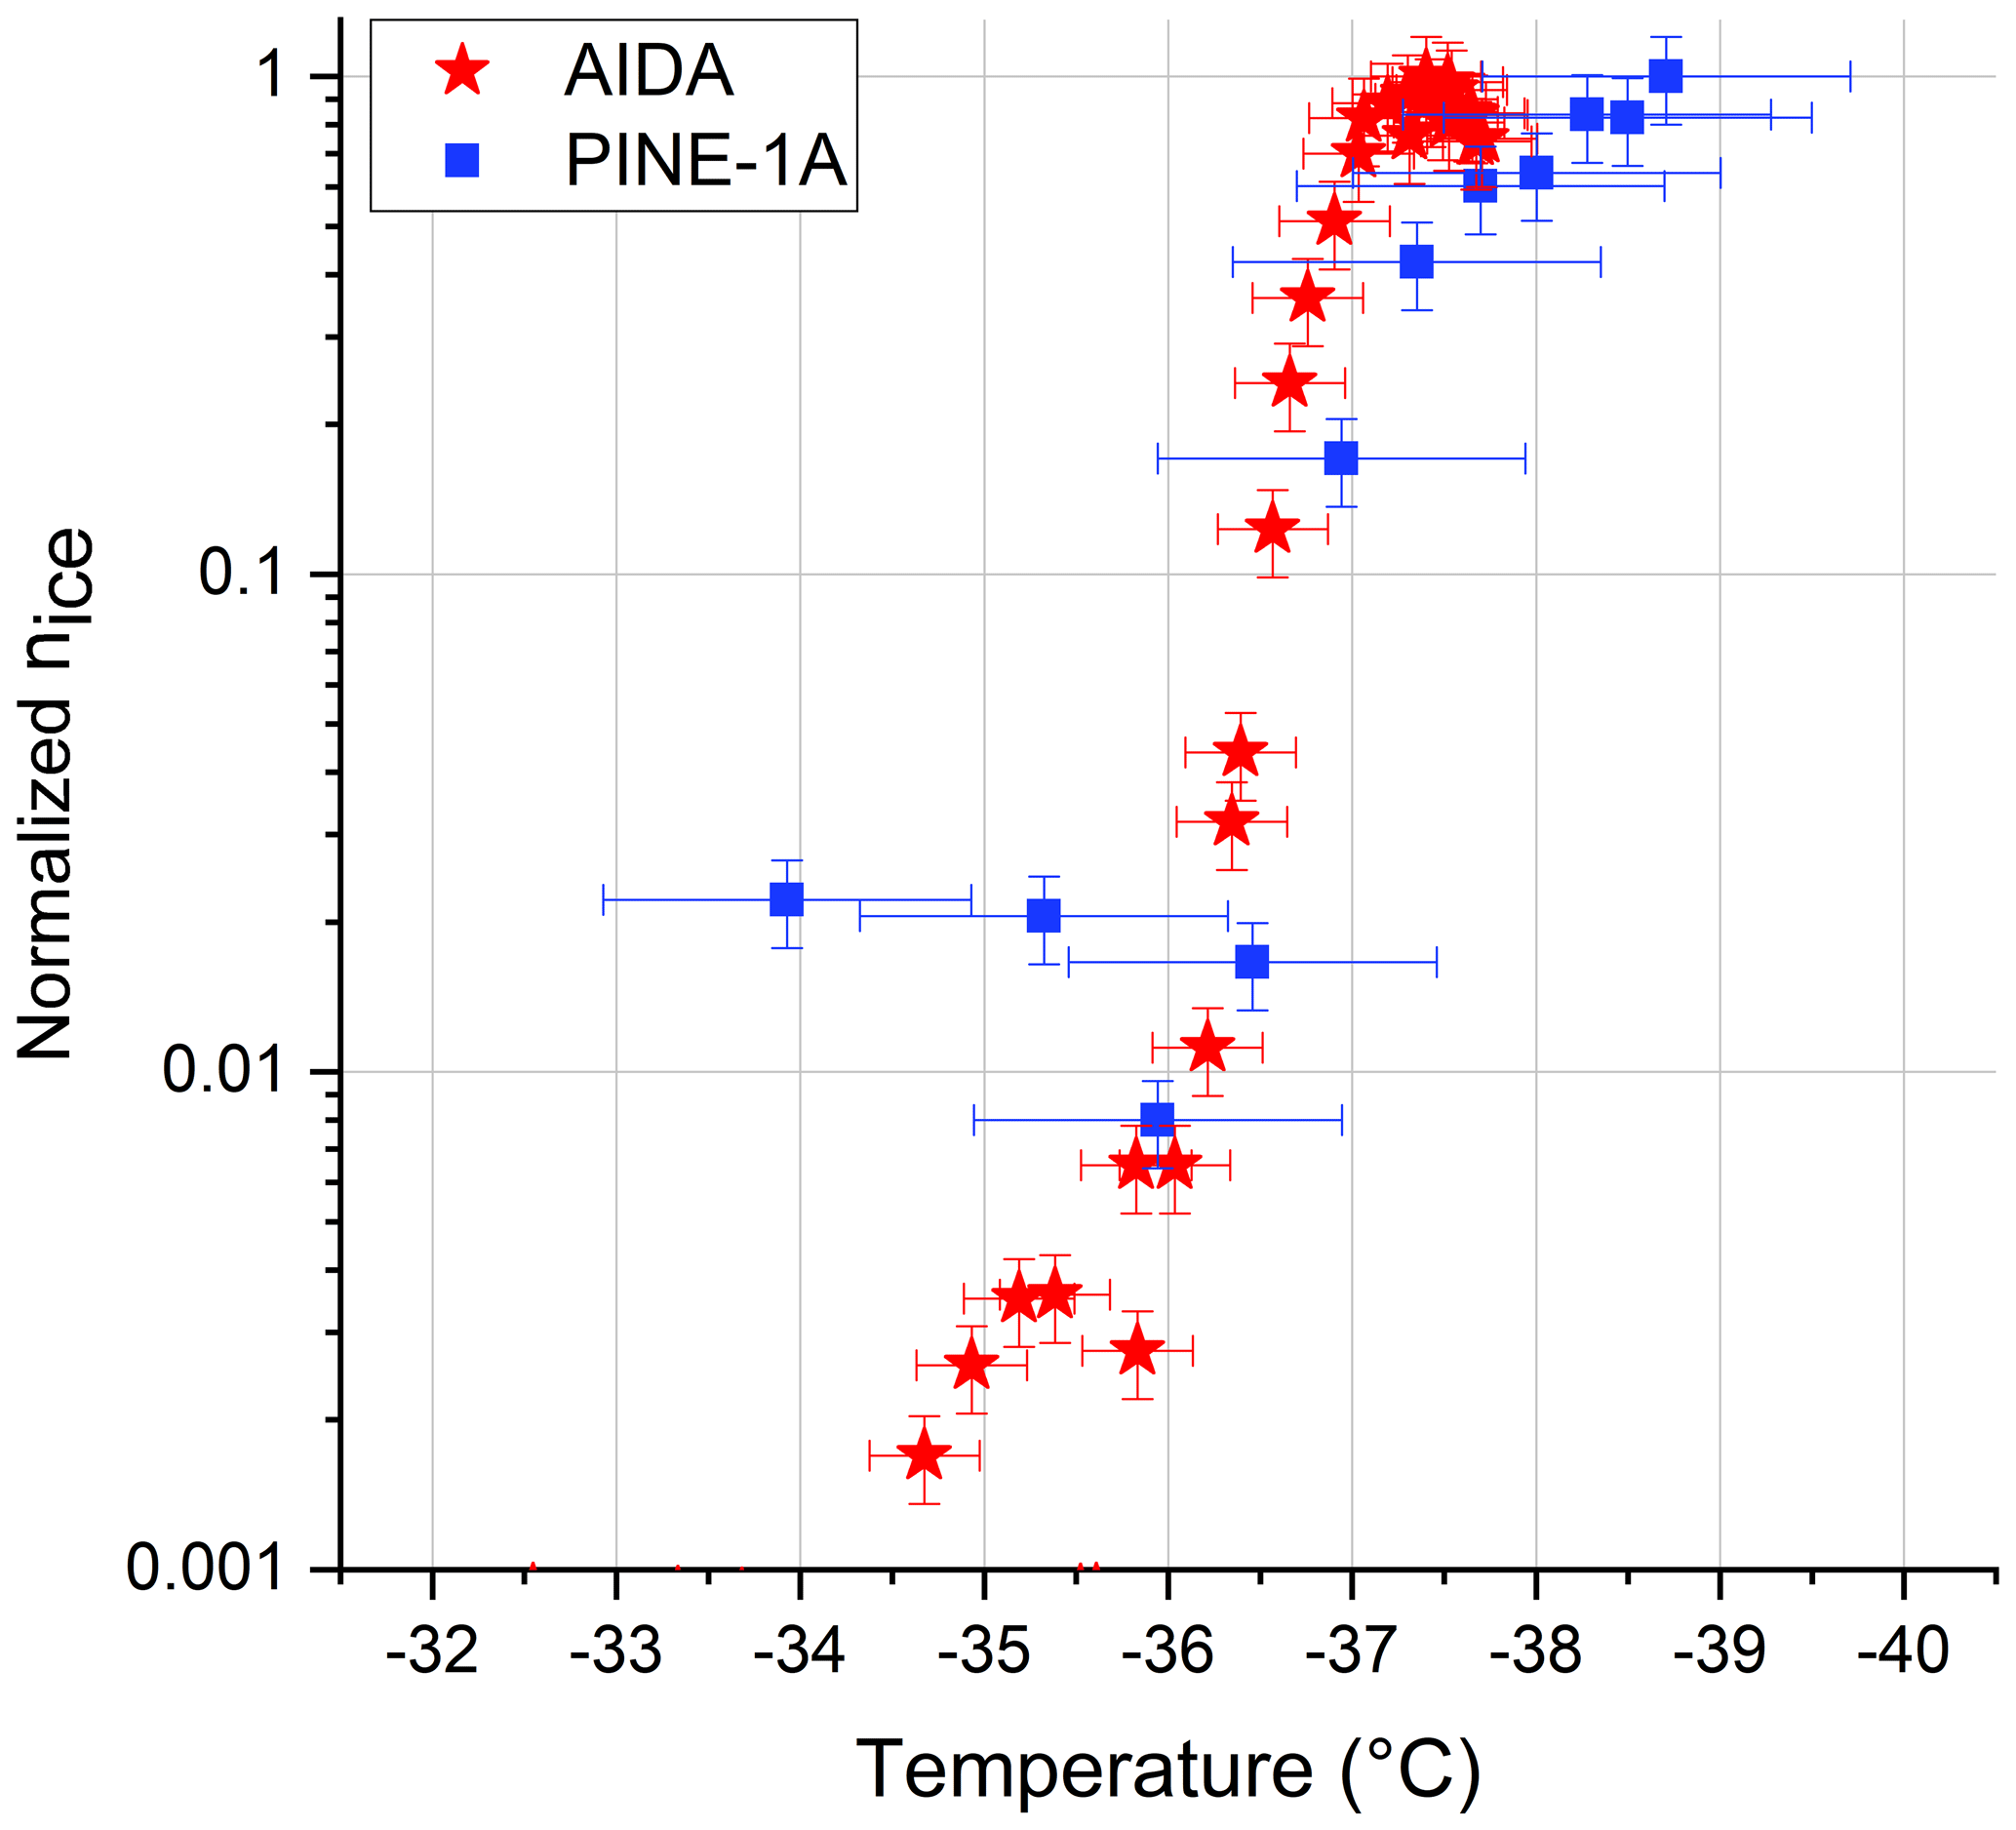
Figure 7 Homogeneous freezing of supercooled water droplets measured with PINE-1A and with AIDA during a PINE characterization campaign in December 2018. For this measurement, the PINE-1A was equipped with a welas 2500 OPC and sampled sulfuric acid aerosol directly from the AIDA chamber. PINE-1A was operated at a wall temperature of about −32.5 ∘C, the expansion run was done with a flow rate of 5 L min−1, and reached a minimum gas temperature of −39 ∘C. The AIDA expansion was started at a temperature of about −31 ∘C and reached a minimum temperature of about −38 ∘C.
PINE-1A was also operated next to the AIDA cloud chamber during the EXTRA18 campaign in February 2018. This campaign was mainly organized to test and calibrate the newly constructed PINE-1A in preparation for a first field campaign. During this campaign, PINE-1A sampled aerosol particles directly from the AIDA chamber again and measured their ice nucleation activity in the same temperature range covered by AIDA cloud expansion runs with the same aerosols. Arizona test dust (ATD) and illite NX aerosols where used during this campaign. These aerosols are well studied for their ice nucleation activities and were also used in previous intercomparison experiments for INP instruments (DeMott et al., 2011, 2018; Hiranuma et al., 2015). We used the same aerosol sources as Steinke et al. (2015) for ATD and Hiranuma et al. (2015) for illite NX, and the methods for generating and characterizing these aerosols are described in these papers.
The supercooling or minimum temperature reached in a PINE expansion can be controlled by two parameters, the pump flow rate and the end pressure. This allows for a quick scan through a certain temperature range of ice nucleation activity. Both higher pump flow rates and lower end pressure cause a larger supercooling of the air in the cloud chamber, which means a lower minimum temperature at the end of expansion. An example is shown in Fig. 8. In this operation, PINE-1A sampled ATD aerosol directly from the AIDA chamber and measured the number fraction fice of ice-active ATD particles in a series of runs starting from a temperature of about −18 ∘C. The expansion flow rate was 5 L min−1 in all runs, but the end pressure was stepwise reduced every three runs from about 800 hPa at the beginning to about 500 hPa at the end of this operation (see panel a of Fig. 8). This caused a stepwise decrease in the minimum gas temperature in the cloud chamber, as also shown in panel (a). The welas 2500 single-particle data (Fig. 8, panel b) indicate an increasing amount of ice formation with decreasing minimum temperature. This stepwise increase in the number concentration of ice crystals or INPs is shown in panel (c) of Fig. 8, which depicts the time series of the ice crystal number concentrations measured at the end of each expansion.
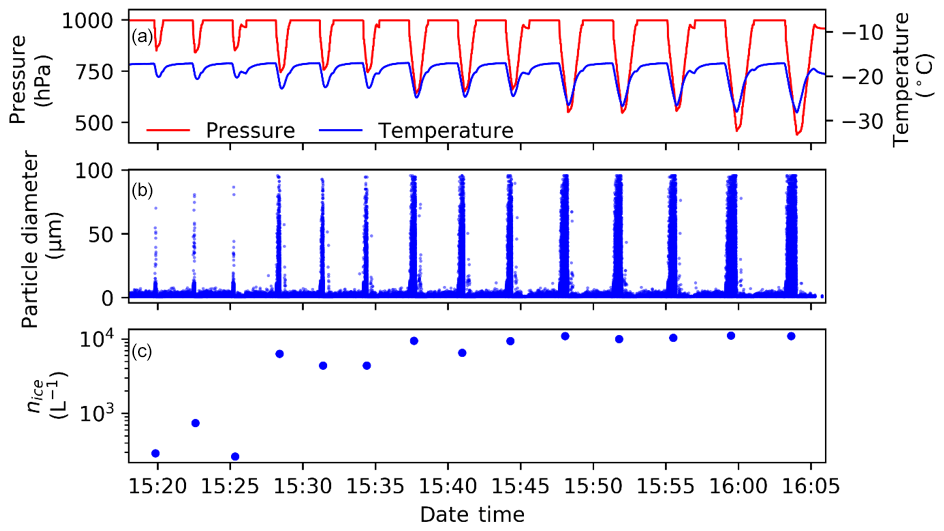
Figure 8 Repeated runs of PINE-1A sampling ATD aerosol from the AIDA cloud chamber during the EXTRA18 campaign. The runs were started at the same temperature of about −18 ∘C (blue line), but the minimum expansion pressure (red line) and thus also the minimum gas temperature in the PINE cloud chamber were stepwise changed every third run (a). Therefore, the number of ice crystals formed by immersion freezing also stepwise increased, as shown in the single-particle plot from the welas 2500 OPC data (b) and the ice crystal concentration measured at the end of each expansion (c).
Figure 9 depicts the ice crystal number fraction calculated with Eq. (5) divided by the aerosol number concentration for each individual run as function of gas temperature measured with the sensor in the bottom of the PINE-1A cloud chamber. The measured number concentration of ice crystals equals the number concentration of ice-active ATD particles measured in an AIDA cloud chamber experiment with the same aerosol (Fig. 9). For the PINE measurements, we estimate a temperature uncertainty of ±1 ∘C, mainly caused by the inhomogeneous temperature distribution in the PINE cloud chamber during the expansion run (see Fig. 6). The temperature uncertainty during AIDA cloud expansion experiments is ±0.3 ∘C. The estimated uncertainty for the ice number concentration is ±20 % for both PINE and AIDA, mainly due to the uncertainty in the dimension of the ODV of the welas sensor and the measured transect time of particles passing the ODV (see Eq. 1).

Figure 9 Ice-active particle fraction fice measured with PINE-1A for ATD as a function of temperature (see also Fig. 8), in comparison to fice measured in an AIDA cloud expansion experiment with the same aerosol, right after the PINE-1A runs were finished.
The same measurements as for ATD were also performed with illite NX aerosol (Figs. 10 and 11) but with both AIDA and PINE-1A starting their cloud expansions at a slightly lower temperature of about −22 ∘C because of the somewhat lower ice nucleation activity of illite NX compared to ATD. Within the given uncertainty ranges, the PINE-1A data are in excellent agreement with the AIDA data for both ATD (Figs. 8 and 9) and illite NX (Figs. 10 and 11). This also underlines the assumption that the ice formation in PINE is mainly controlled by the coldest temperature in the bottom part of the chamber and that the number concentration of ice crystals, and thus the number concentration of ice-active aerosol particles in laboratory experiments and of INPs during field measurements, can be calculated with Eqs. (5) and (6) within the above given uncertainty estimates for the number concentration and the nucleation temperature. We should note here that these uncertainty limits are so far only justified by comparison of PINE with AIDA results. Further systematic uncertainties like the loss of large ice crystals between the PINE cloud chamber and OPC, size range overlap of small ice crystals with large aerosol particles not activated to droplets, or the sampling efficiency of large aerosol particles into the cloud chamber may have to be considered for calculating the overall accuracy of INP measurements.
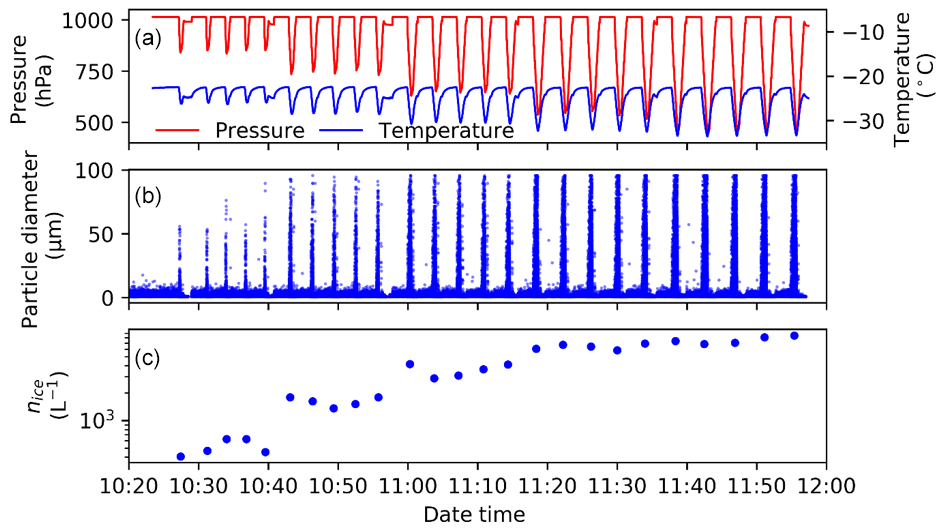
Figure 10 Same plot as shown in Fig. 8, but with PINE-1A sampling illite NX aerosol from the AIDA cloud chamber, and with a lower start temperature of about −22 ∘C (see a, blue line). As for ATD runs, the minimum expansion pressure (red line) and thus also the minimum gas temperature in the PINE cloud chamber were stepwise changed every fifth run (a). Therefore, the number of ice crystals formed by immersion freezing also stepwise increased, as shown in the single-particle plot from the welas OPC data (b) and the ice crystal concentration measured at the end of each expansion (c).
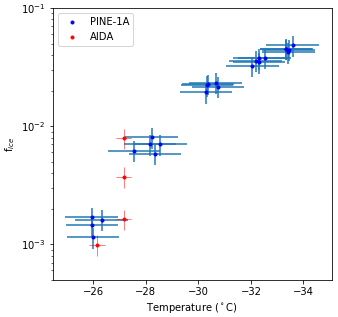
Figure 11 Ice-active particle fraction fice measured with PINE-1A (blue dots) for illite NX as a function of temperature (see also Fig. 10), in comparison to fice measured in an AIDA (red dots) cloud expansion experiment with the same aerosol, right after the PINE-1A runs were finished.
A more comprehensive uncertainty assessment for PINE may result from recent intercomparison studies with other methods and instruments and ongoing long-term operation in field campaigns. For long-term measurements, another important parameter is the precision for repeated measurements at the same sampling and operating conditions. In a recent test experiment at the AIDA cloud chamber, the new commercial PINE-04-01 instrument sampled a mixed aerosol (ammonium sulfate and natural dust) for more than 8 h from the AIDA chamber (Fig. A6). During this experiment, a mean ice-active particle number fraction of was measured with a standard deviation of , which corresponds to a relative uncertainty of about 12 %. During this operation, an average number Nice of about 90 ice crystals was measured during one run. Therefore, the relative uncertainty from counting statistics can be calculated as %, which is close to the relative standard deviation of the run-by-run data from the mean value. For measurements with a much lower number of ice crystals detected in one run or a consecutive number of runs, the measurement uncertainty from counting statistics can be much larger. Next versions of the PINE analysis software tools will also include uncertainty analysis for low-counting cases close to the PINE detection limit.
We performed ground-based INP measurements with PINE-c at the SGP observatory in Oklahoma, where long-term measurements provide statistical context (https://www.arm.gov/capabilities/observatories/sgp, last access: 3 February 2021). During the ExINP-SGP campaign (https://www.arm.gov/research/campaigns/sgp2019exinp, last access: 3 February 2021), we have successfully operated PINE-c (Fig. A7) via remote control for INP concentration measurements on a continuous basis for 45 consecutive days. During the entire campaign, PINE-c was operated with an expansion mode time of 60 to 90 s, resulting in an average sampled gas volume of 3.7±0.6 L. This resulted in the minimum detectable INP concentration of about 0.2 to 0.3 L−1 for a single run of approximately 8 min duration. PINE-c was set to automated wall temperature control with ramping back and forth between −5 and −35 ∘C every 90 min, without any substantial technical issues during the whole campaign period.
Shown in Fig. 12 is the overall summary of compiled Nice(T) spectra measured during the ExINP-SGP campaign. Individual data points (black dots) represent 6 h time-averaged cumulative INP concentrations with a temperature interval of 1 ∘C for each expansion. Here, we display the PINE-c Nice data for the temperature segment of −10 ∘C ∘C. This temperature range represents the PINE-c condition, where ice nucleation through immersion freezing was possible below the frost point temperature of the sample air after passing the membrane diffusion dryers operated at maximum drying efficiency. For measurements at higher temperature, the drying efficiency has to be reduced in order to increase the dew point of the sampled air and to exceed water saturation during the expansion mode at higher temperature. Next versions of the PINE control program will include this option for operation at higher temperature. Any further discussions regarding PINE-c operations, observations and data analysis, in combination with other INP and aerosol measurements during the ExINP-SGP campaign, are beyond the scope of our current study and will be followed up in future publications.
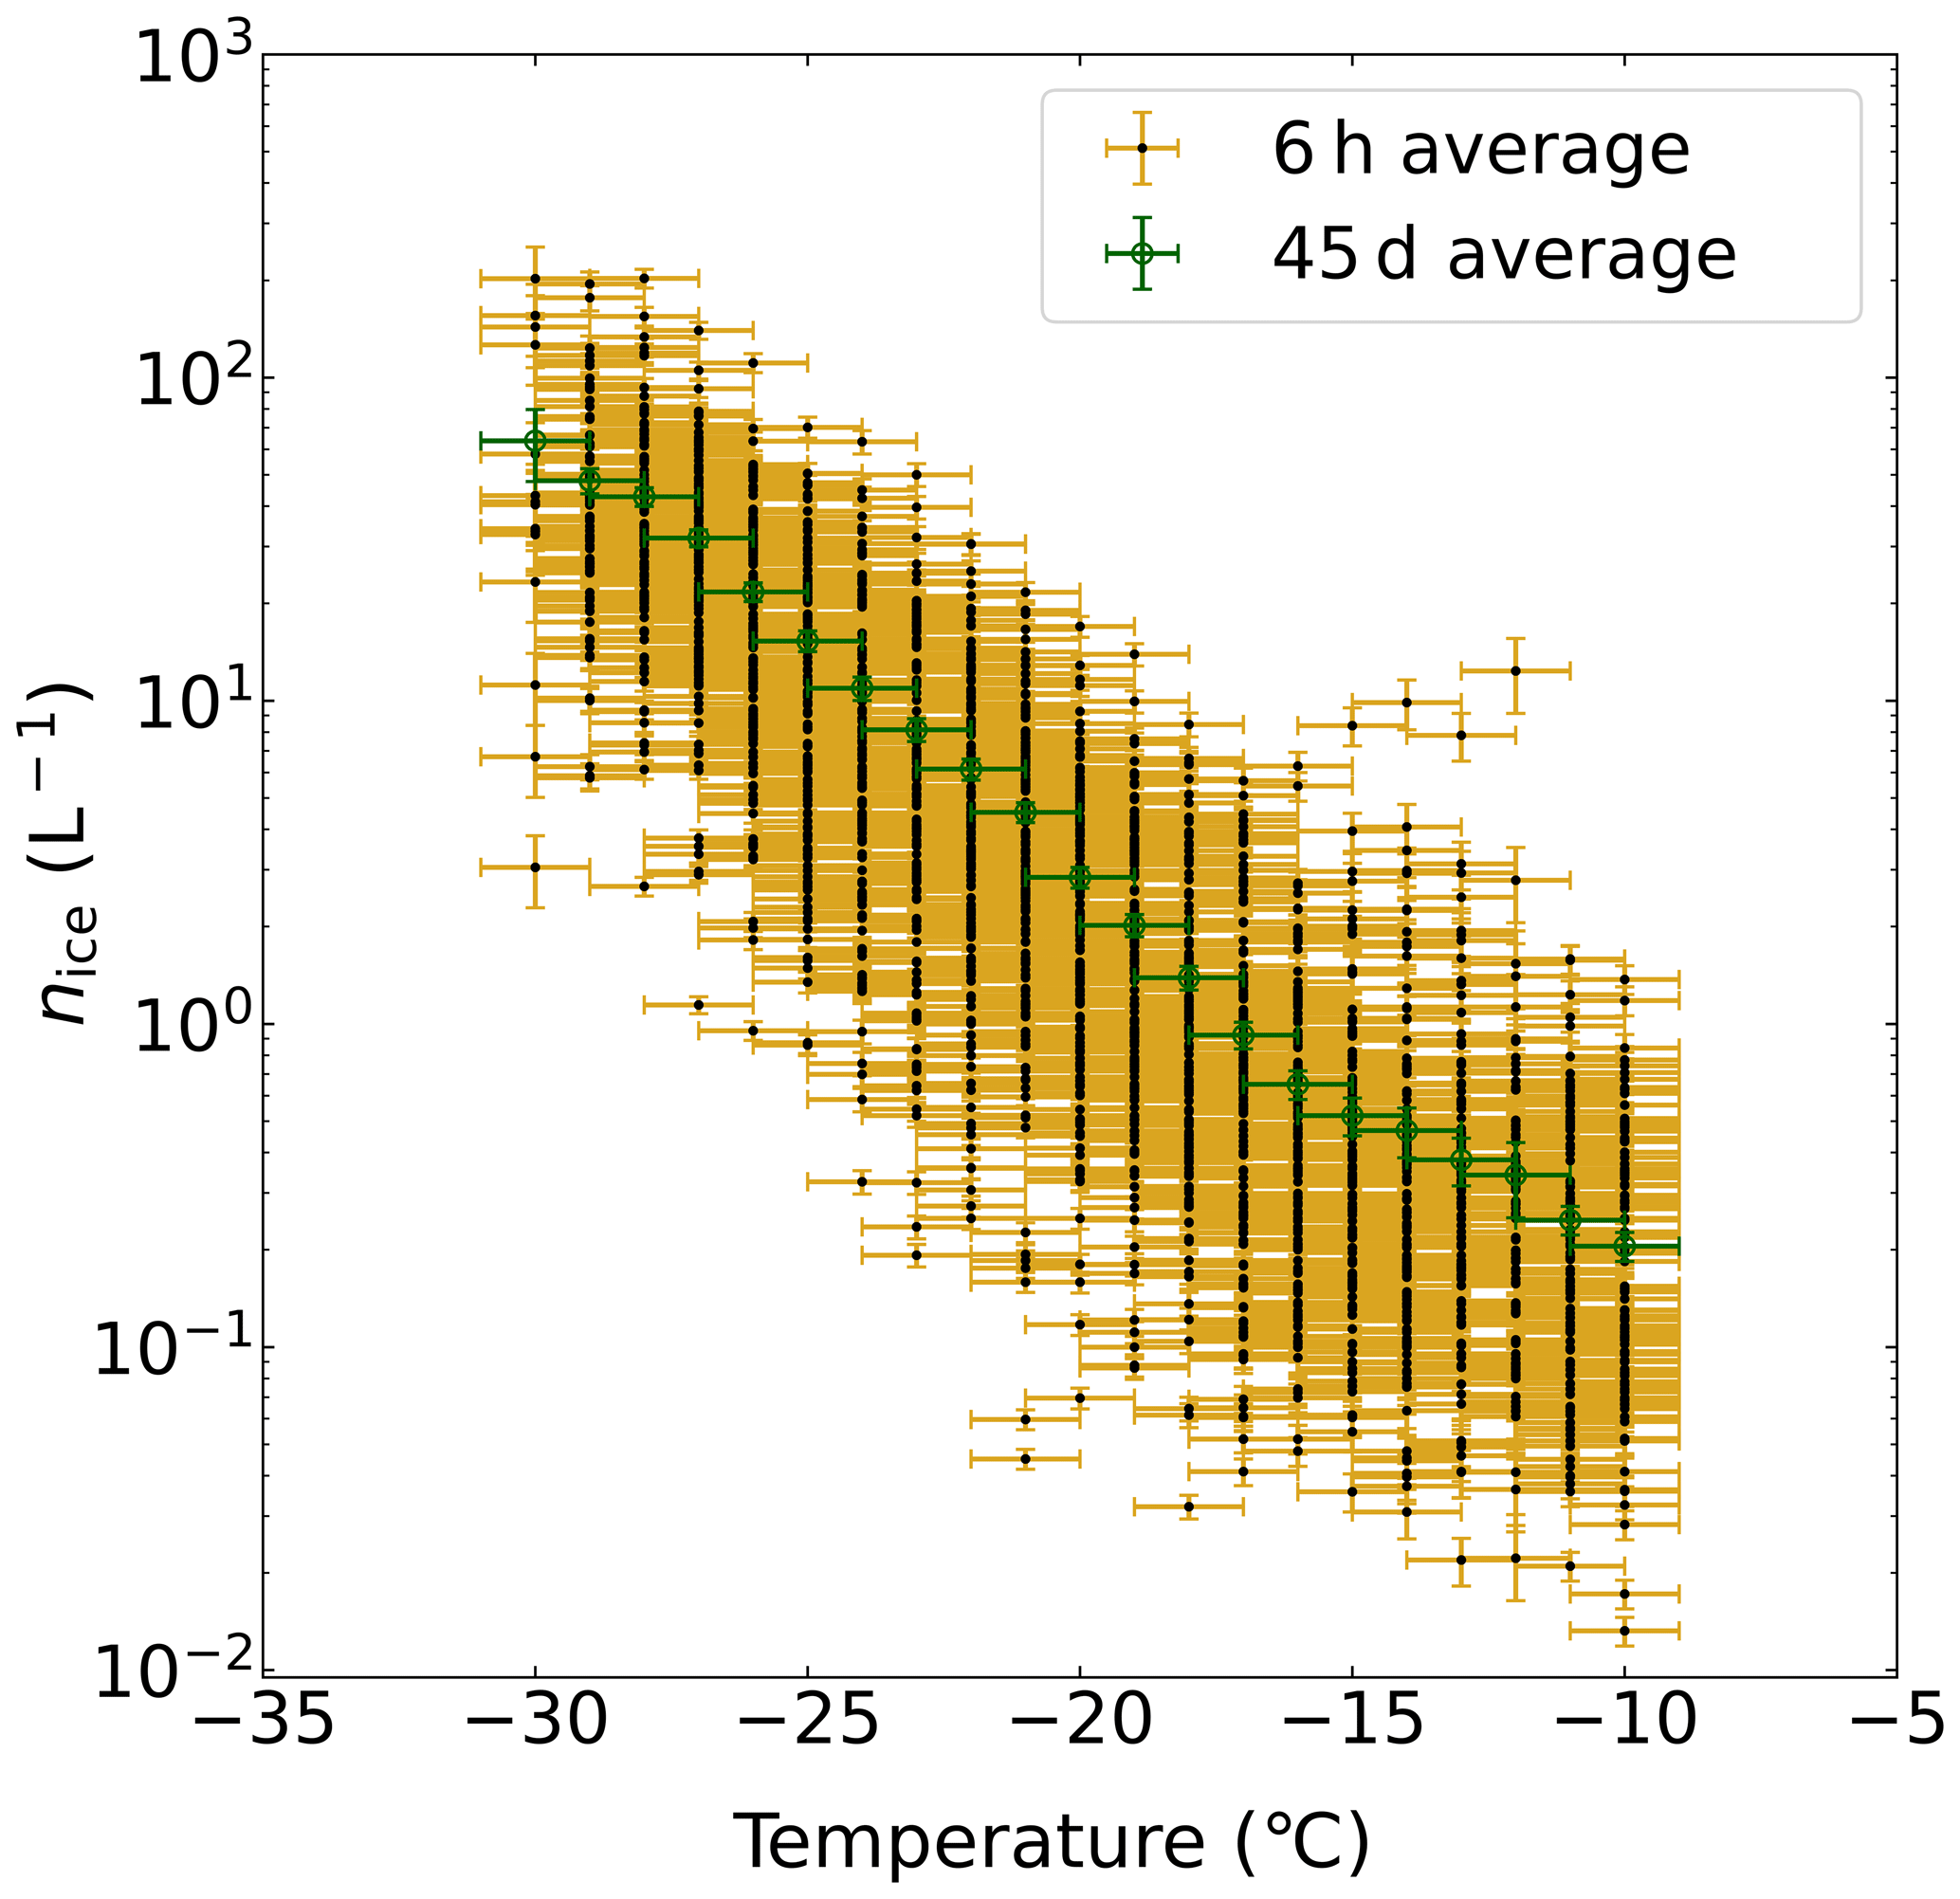
Figure 12 PINE-c INP concentration (Nice) measured as function of the representative gas temperature during the ExINP-SGP campaign at the ARM-SGP site in Oklahoma. PINE-c measured continuously for 45 d from 1 October to 14 November 2019. Temperature-binned concentration data (ΔT=1 ∘C) are shown for 6 h time averaged data (black markers) and 45 d averaged data (green markers). Note the temperature uncertainty of ±1 ∘C based on the homogeneous freezing temperature calibration with ammonium sulfate aerosol particles. The Nice uncertainties represent relative standard errors of 6 h averaged measurements at given temperatures. Statistical errors from low-counting signals are not considered here and will be the subject of further analysis.
We present a new instrument called PINE (Portable Ice Nucleation Experiment) for laboratory studies of ice nucleation and field measurement of ice-nucleating particles (INPs). Inspired by the large AIDA cloud chamber (Möhler et al., 2003, 2005), the PINE instrument also uses the principle of expansion to expose aerosols from different sources to cloud-relevant conditions. Therefore, the sampled aerosol particles are activated to form both supercooled water droplets and ice crystals, which are detected with an optical particle counter (OPC). However, with a volume of only about 10 L, PINE is much smaller than the AIDA cloud chamber. The instrument is sensitive to detect ice formation and INPs in the immersion freezing, pore condensation freezing, and deposition nucleation modes in a wide temperature range from −10 to −65 ∘C. Equipped with a LabVIEW control system, PINE can be operated autonomously over longer time periods and is therefore also suitable for INP monitoring at atmospheric field sites and observatories.
The operation of PINE is organized in a well defined sequence of runs. Each run is composed of three modes called “flush”, “expansion” and “refill”. During the flush mode, the aerosol under investigation is sampled into the pre-cooled cloud chamber. The sampled aerosol particles are activated as supercooled cloud droplets and ice crystals during the expansion mode, depending on the pre-set wall temperature, the expansion rate and the minimum pressure reached at the end of the expansion mode. Droplets and ice crystals are detected with the OPC, and the fraction of ice-active aerosol particles or the number concentration of INPs in the sample can be calculated from the total number of ice crystals detected during the expansion mode and the volume of air that has passed the detection volume of the OPC. During the refill mode, the cloud chamber is just refilled to the ambient pressure to immediately start the next run. In the current PINE versions, one run takes about 4 to 6 min, which defines the highest time resolution that can be achieved with PINE when for example measuring time series of atmospheric INP concentration.
Here we presented and discussed the construction and performance of both the prototype version of the new instrument, called PINE-1A, and the more advanced and commercially available version PINE-c (Bilfinger Noell GmbH). PINE-1A has a stainless-steel cloud chamber of 7 L volume that is cooled with a chiller to measure immersion freezing INPs at temperatures between about −10 to −40 ∘C. This instrument was tested and characterized in a series of laboratory measurements in comparison with the benchmarked AIDA chamber. PINE-1A results for both homogeneous freezing of cloud water droplets and immersion freezing of ATD, and illite NX aerosols were in excellent agreement with AIDA results. The first operation of PINE-1A during the HyICE field campaign in Hyytiälä, Finland, also demonstrated that there is only little variability of the measured droplet and ice size distribution from run to run. The INP concentration is measured with a high precision and repeatability. The temperature uncertainty is estimated to be about ±1 ∘C, mainly influenced by an increasing temperature inhomogeneity during the expansion mode. The field operation also showed that the welas 2000 OPC can well distinguish between ice crystals and droplets by setting an optical size threshold and that PINE-1A was operated over longer time periods at almost zero background conditions without any detectable frost formation on the cold cloud chamber walls. A follow-up study will present more results from the HyICE field activity and will discuss in more detail the performance of PINE-1A during long-term field operation.
The advanced instrument version PINE-c has a somewhat larger cloud chamber of 10 L volume which is made of thin-walled aluminium and located in an evacuated chamber for thermal insulation. The cooling system is based on a Stirling cooler and allows cooling the chamber to temperatures as low as −60 ∘C. PINE-c was successfully operated for the first time during a field campaign conducted at the Atmospheric Radiation Measurement (ARM) Southern Great Plains (SGP) observatory in Oklahoma, USA. During this field campaign, PINE was continuously operated for 45 d in a fully automated and semi-autonomous way at a time resolution of about 8 min with continuous wall temperature scans between −5 and −35 ∘C. The overall INP concentrations ranged from about 0.02 L−1 at −10 ∘C to about 200 L−1 at −30 ∘C. More results from this field activity will be presented and discussed in a follow-up study.
One of the unique features of PINE, in contrast to flow diffusion or mixing devices, is its operation under dry and frost-free wall conditions. Therefore, long-term continuous operation over days and weeks can be performed without the occurrence of increasing background from frost artefacts. This is achieved by drying the sampled aerosol to a frost point temperature close to the minimum wall temperature. This was proven in a series of measurements during a field campaign in Hyytiälä, Finland. The sampled air needs to be humidified when its frost point temperature is clearly below the lowest chamber wall temperature. This may only be the case when sampling from extremely cold or dry environments, like polar regions or desert areas, or when sampling laboratory aerosols generated in extremely dry air. In most surface-based atmospheric sampling locations, the sample includes sufficient humidity and needs to be dried before entering the PINE chamber. Future versions of PINE may therefore also include an optional air humidification system in addition to the diffusion dryers. In addition, the newest version PINE-c is operated with a novel and liquid-free cooling system, which makes it suitable to even be operated autonomously at remote measurement sites.
Given the dearth of atmospheric INP measurements with which to challenge and inform our aerosol, cloud and climate models, an instrument, such as PINE, capable of making measurements on a routine and autonomous basis is needed. The development of PINE is timely, since INPs control the radiative properties of clouds around the globe and are of high importance for defining cloud feedbacks (Vergara-Temprado et al., 2018; Tan et al., 2016). We anticipate that PINE will become a standard autonomous instrument at atmospheric observatories around the globe as well as a versatile laboratory and research tool.
The PINE instruments are equipped with a dual-membrane dryer system (Fig. A1) to reduce the humidity of the aerosol sampled into the cold cloud chamber and thus to avoid frost formation on the cold cloud chamber walls. The drying efficiency of the Nafion tube was measured as a function of the pressure difference Δp between the sample flow and the counterflow and also as a function of the volumetric sample flow rate. The drying efficiency is plotted in Fig. A2 as the difference ΔTd of the sample air dew point temperatures measured with a chilled mirror dew point sensor (MBW type 393) before and after the dryer. The measurements shown in Fig. A2 were conducted with the dew point temperature of the sample air ranging from about 6 to 7 ∘C. The drying efficiency increases with the pressure difference and decreases with the sample flow rate. A drying efficiency with a drop in dew point temperature of more than 10 ∘C is achieved when operating the dryers with a sample flow rate below 2 to 3 L min−1 and at the maximum pressure difference of about 800 hPa across the membrane.
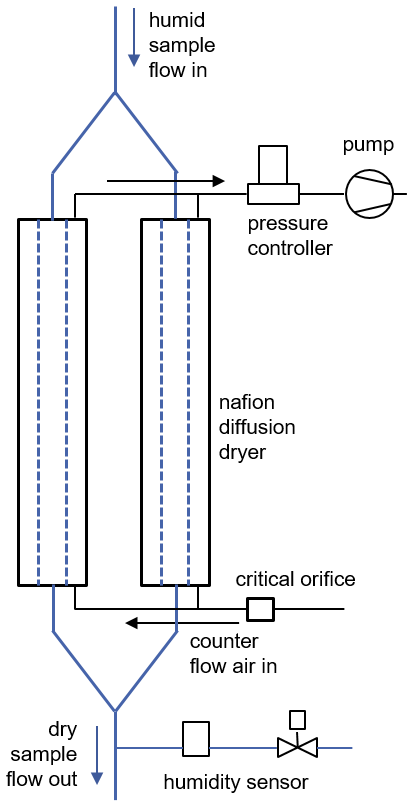
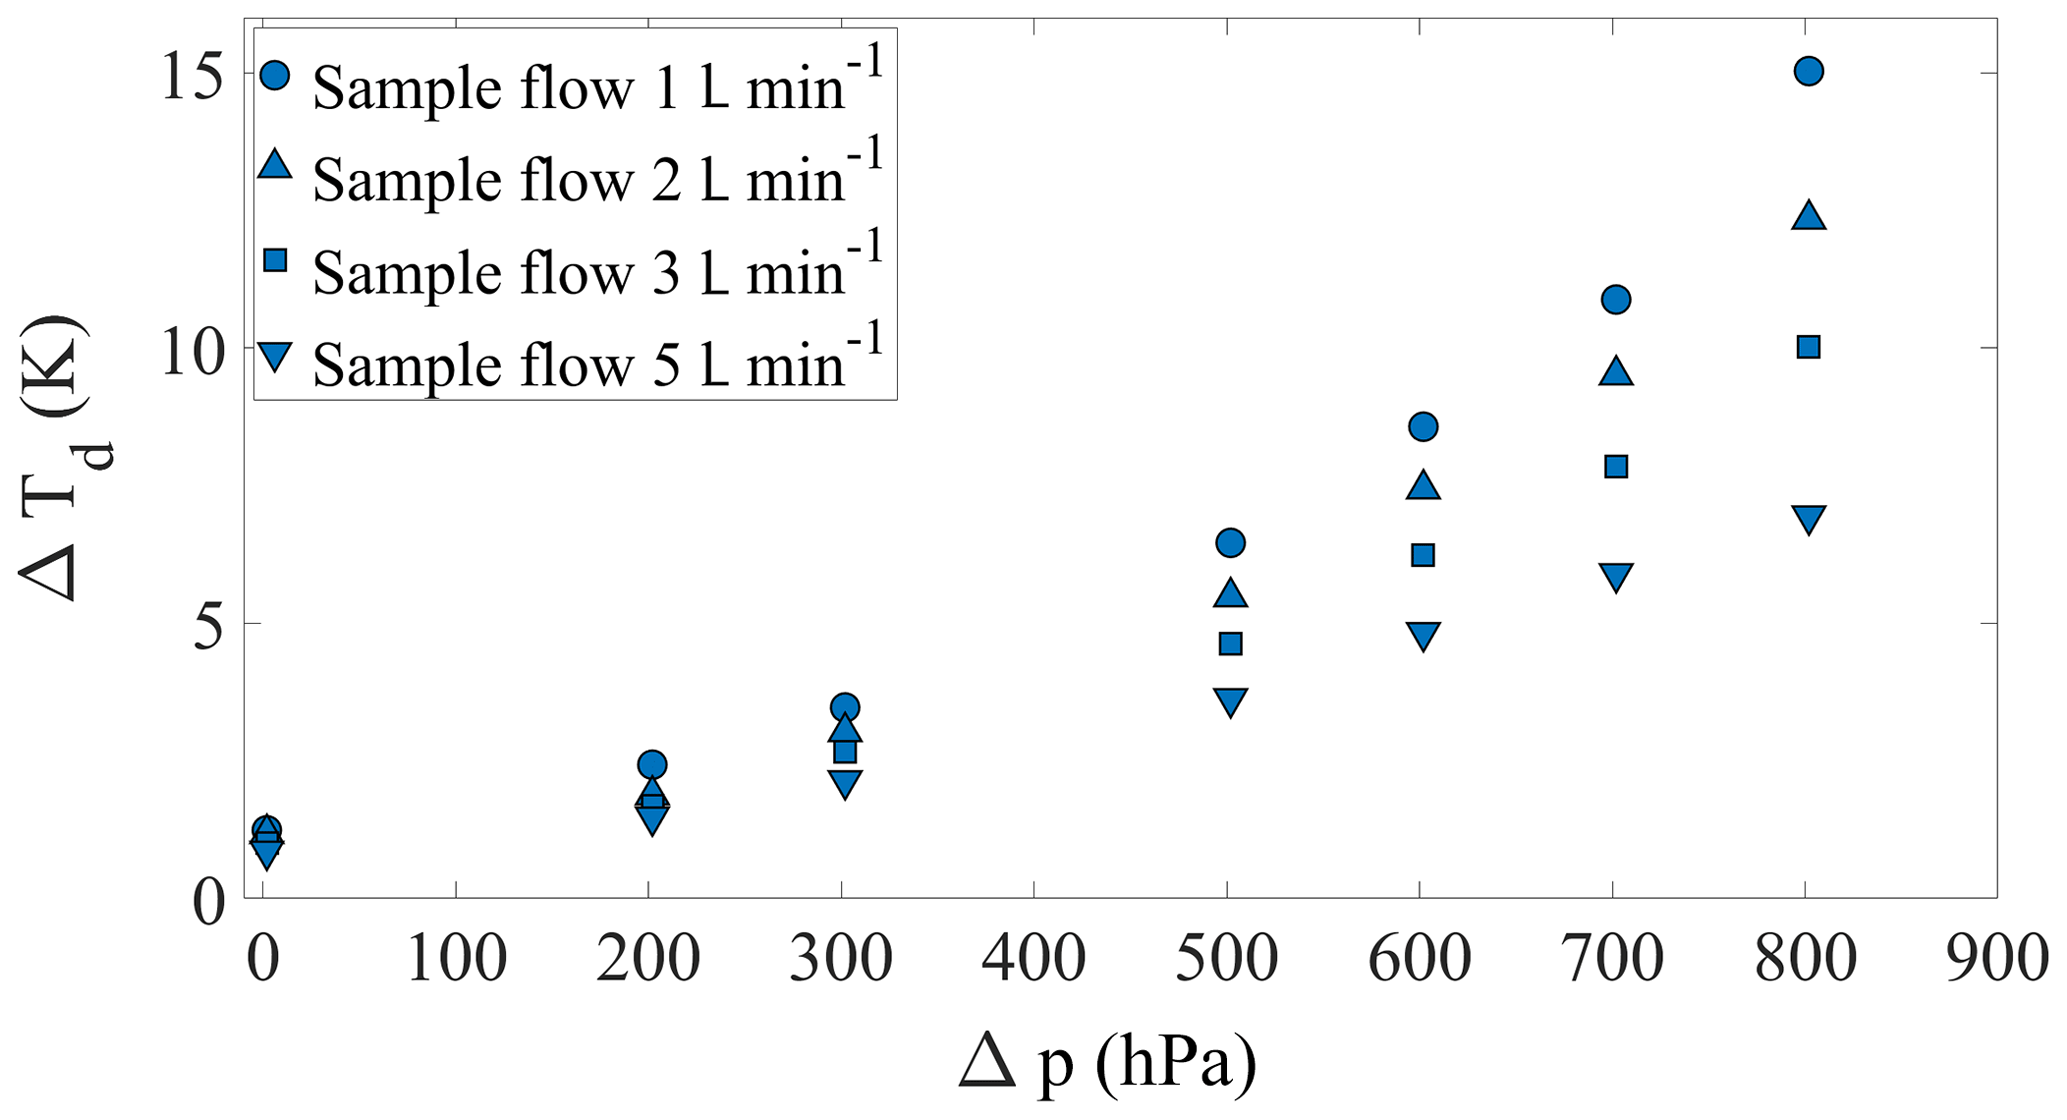
Figure A2 Drying efficiency of one Nafion diffusion dryer, plotted as the difference ΔTd of the dew point temperatures measured in the sample air before and after the Nafion tube. The drying efficiency increases with the pressure difference Δp between the sample air and the counterflow air and decreases with the sample flow.
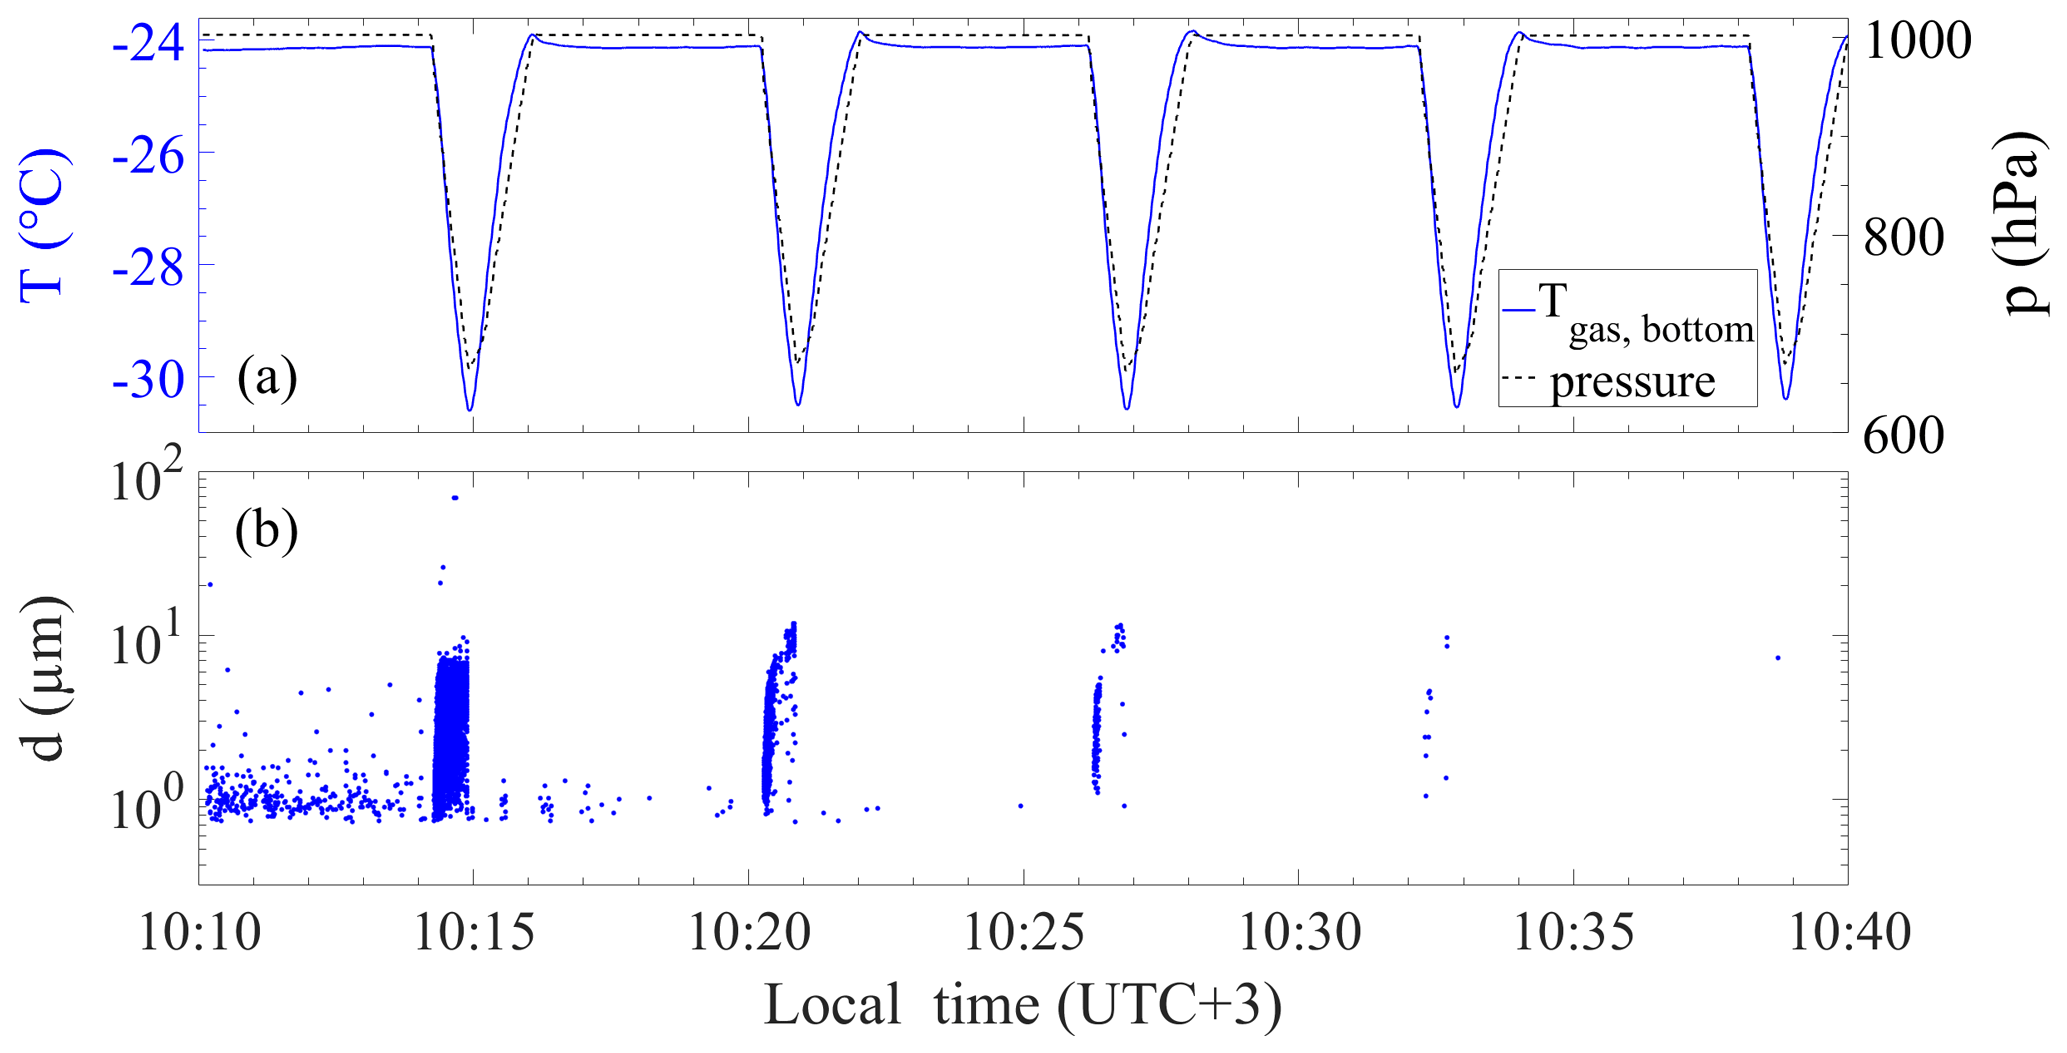
Figure A3 Background test run showing that after four consecutive expansion runs the total particle count is almost zero (only one droplet count detected in expansion no. 5).
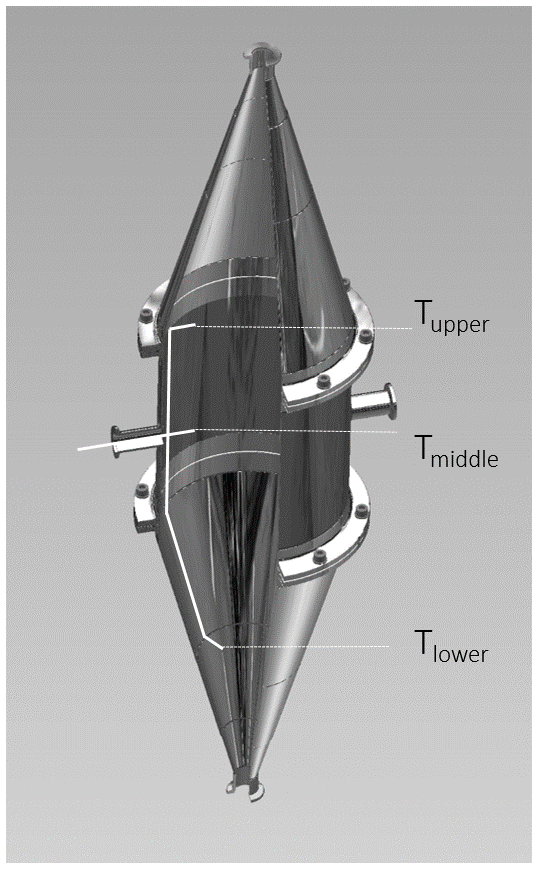
Figure A4 Construction of the PINE-1A stainless-steel cloud chamber, without cooling and thermal insulation. The white lines indicate the location of the three thermocouples measuring the gas temperature inside the cloud chamber.

Figure A5 Size distribution of activated droplets measured with PINE-1A at high-temperature conditions where no active INPs were present.
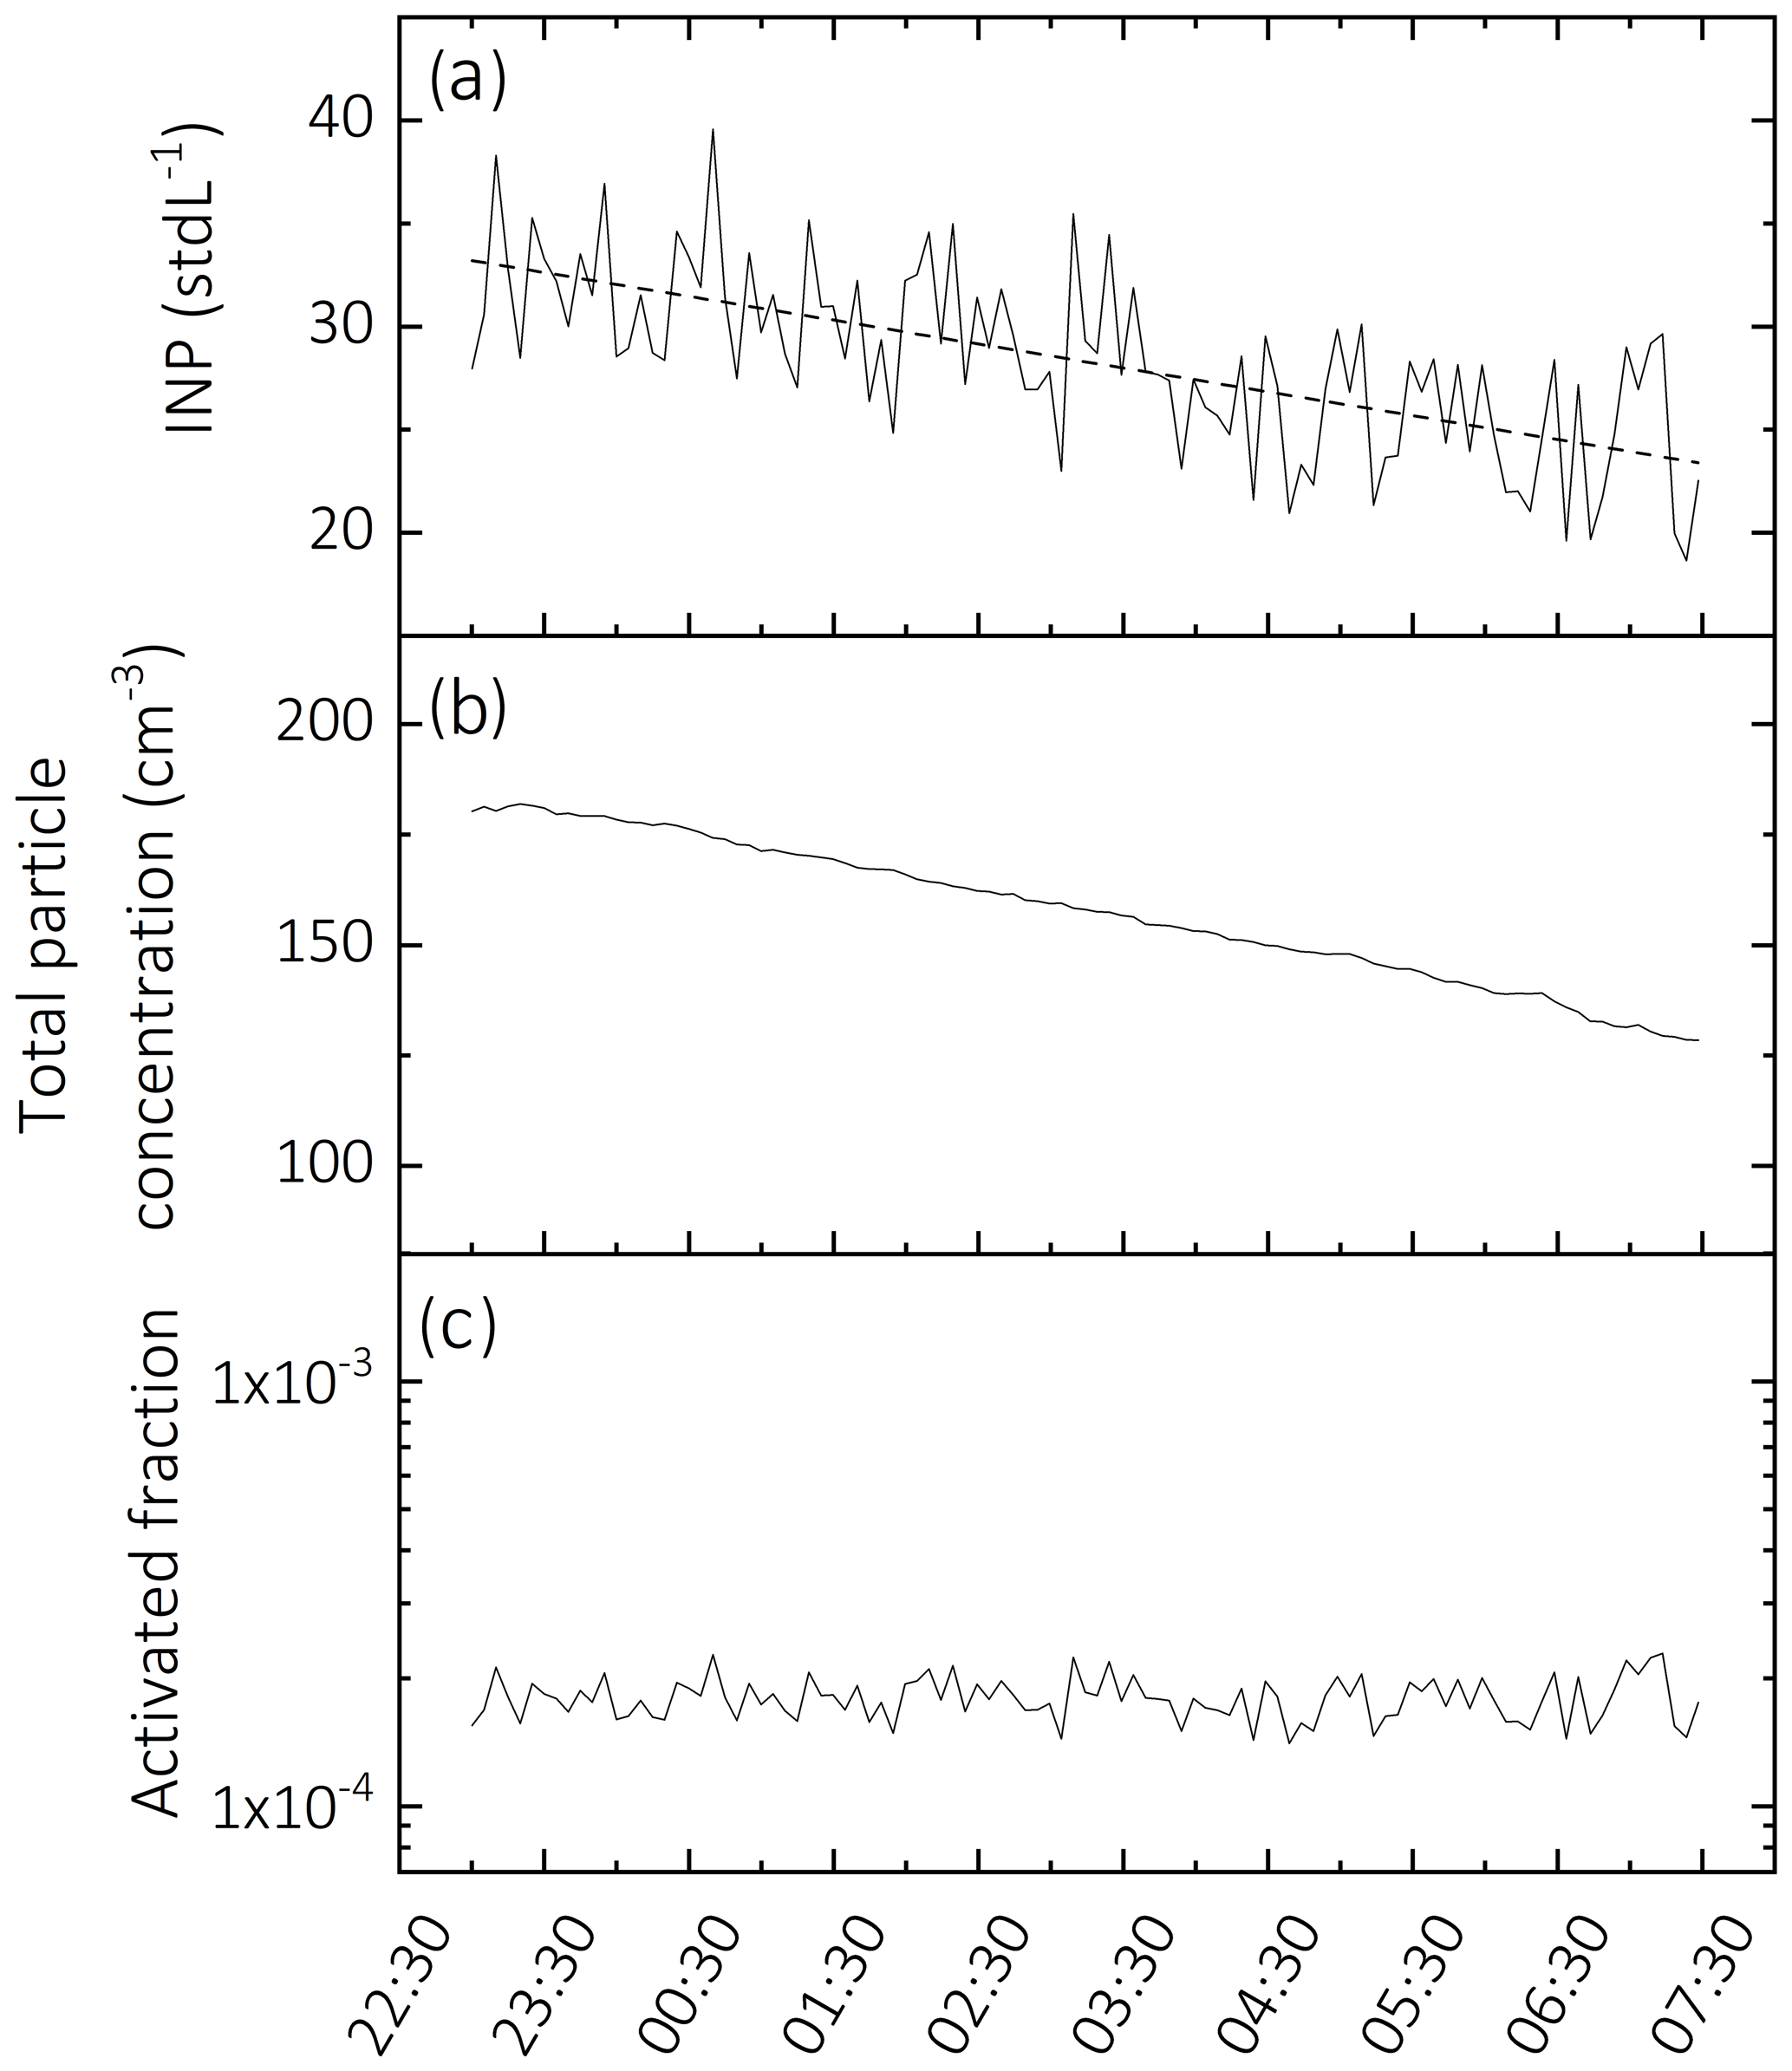
Figure A6 Time series from an experiment with the new commercial PINE-04-01 instrument sampling aerosol from the AIDA cloud chamber, with INP concentrations measured at 247.2 K (a), total aerosol particle number concentration measured with a condensation particle counter (b), and the ice-active particle fraction fice calculated from the ratio of the INP number concentration to the aerosol number concentration, with a mean value of and a standard deviation of .
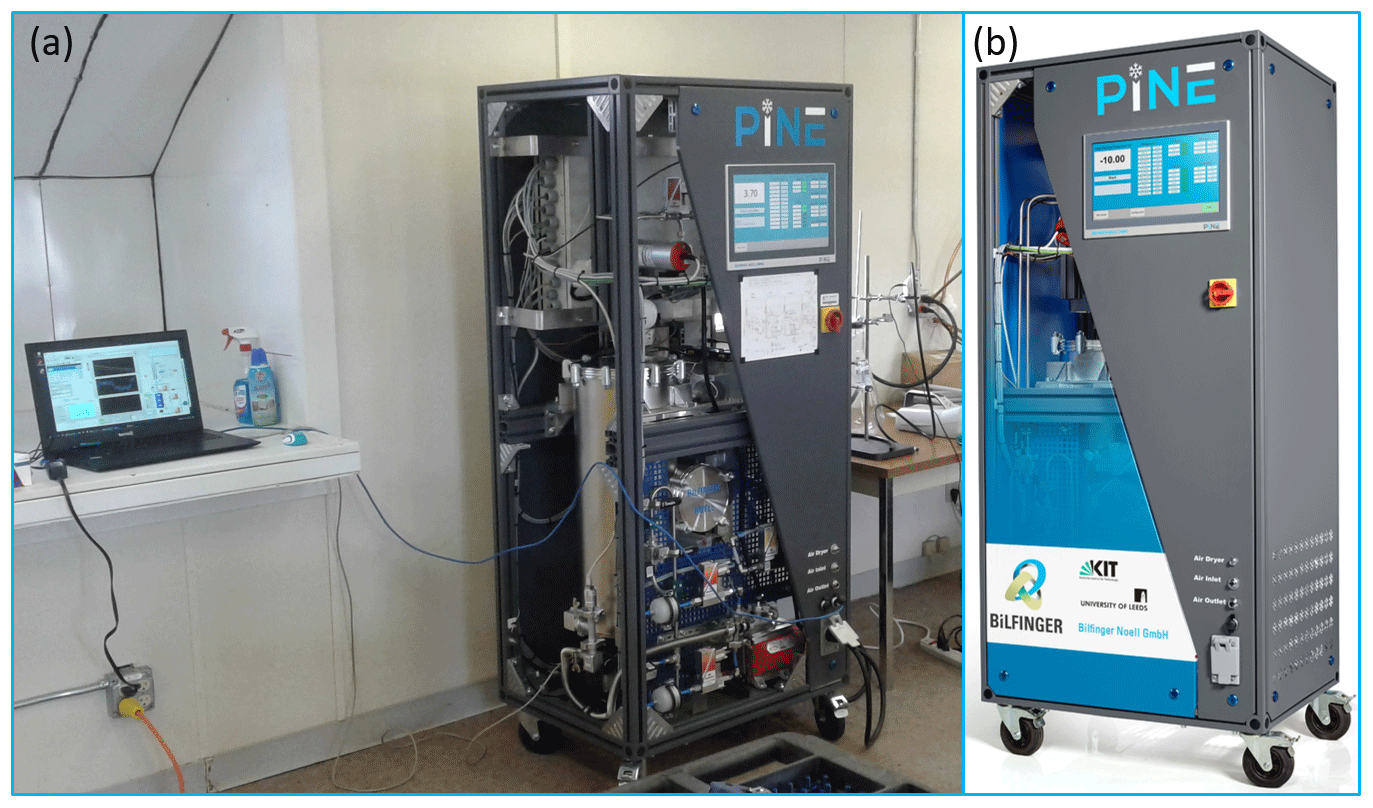
Figure A7 Photograph of PINE-c (a) located at the ARM-SGP site in Oklahoma for continuous INP measurements for 45 days from 1 October to 14 November 2019. Panel (b) shows a composite photograph of the same instrument before delivery.
Operating PINE with high sensitivity for INP detection requires low or even zero background conditions. Therefore, the control system allows for regular background checks, where the instrument is set to flush mode, and passing the sample flow through the bypass line with particle filter (via the dashed line in Fig. 2a). A typical background run sequence (operation) from the HyICE field measurements with PINE-1A (Fig. A3) shows that the particle counts approach or drop to zero after about four to five runs. More details about background behaviour of PINE will be presented and discussed in a follow-up paper.
Figure A4 shows the construction of the PINE-1A cloud chamber with the location of the three gas temperature sensors. For PINE measurements, a size threshold is used in order to distinguish larger ice crystals from smaller liquid water droplets in the OPC single-particle data (see discussion in Sects. 3 and 4). In the absence of INPs, the droplet size distribution measured with the OPC has a sharp edge to larger particle diameters (Fig. A5), which is favourable for setting the size threshold. Fig. A6 shows a recent measurement with the new commercial PINE-04-01 when sampling a mixed aerosol (ammonium sulfate and natural dust) for more than 8 h from the AIDA chamber. This figure well demonstrates the run-by-run stability and repeatability of PINE measurements. In this experiment we did not expect a constant but a steadily decreasing INP concentration (panel a) because of the steady decrease in the aerosol concentration (panel b) according to aerosol loss processes to the chamber walls. The ice-active particle number fraction (panel c) remained constant with a mean value of and a standard deviation of , which demonstrates the precision of PINE INP measurements under these conditions. Figure A7 shows the first version of the PINE-c instrument in operation at the ARM SGP field campaign ExINP-SGP (https://www.arm.gov/research/campaigns/sgp2019exinp, last access: 3 February 2021).
Data shown in Figs. 3–12, A2, A3, A5 and A6 are available in KITopenData under https://doi.org/10.5445/IR/1000122157 (Möhler et al., 2021).
OM wrote this paper; OM and BJM led the PINE development and coordinated the laboratory and field activities; MA, LL and FV conducted the laboratory experiments and field activities during the HyICE field campaign in Hyytiälä, Finland, and analysed the respective measurements; JN and RU developed the control and data analysis software for PINE and contributed to the analysis and interpretation of the measurements; CB, TP, AH and MW contributed to the engineering and construction of the PINE instrument; HSKV and NH conducted the measurements with PINE-c and analysed the data; and all co-authors participated in the data evaluation and interpretation and contributed in drafting this paper
The authors declare that they have no conflict of interest.
The development of the PINE instrument was supported by the Karlsruhe Institute of Technology (KIT) for the development of the PINE instrument through the technology transfer project N059 PINE. We gratefully acknowledge skilful support by the technical team at the KIT Institute of Meteorology and Climate Research (IMK-AAF), in particular by Georg Scheurig, Steffen Vogt and Tomasz Chudy. We also would like to thank the organizers of and participants in the HyICE campaign from March to May 2018 in Hyytiälä, Finland, where PINE-1A for the first time recorded field data over a longer time period of almost 2 months. We also thank the staff at the Hyytiälä field site for their support in operating PINE-1A. Benjamin J. Murray and Michael Adams from the University of Leeds received financial support through the European Research Council projects MarineIce (648661) and CountIce (862565). The material related to PINE-c is based upon work supported by the U.S. Department of Energy, Office of Science, Office of Biological and Environmental Research program under Early Career Research Program award (DE-SC0018979) as well as Aerosol-Ice Formation Closure Pilot Study (DE-SC0020006). Naruki Hiranuma and Hemanth Sandeep Kumar Vepuri gratefully acknowledge the ARM-SGP technicians and administrative team as well as WTAMU Office of Information Technology for maintaining the guest facility and supporting a remote operation of PINE-c.
This research has been supported by the Karlsruhe Institute of Technology (grant no. N059), the European Research Council (MarineIce (grant no. 648661) and CountIce (grant no. 862565)) and the U.S. Department of Energy (DE-SC0018979 and DE-SC0020006).
The article processing charges for this open-access publication were covered by a Research Centre of the Helmholtz Association.
This paper was edited by Hang Su and reviewed by Paul DeMott and three anonymous referees.
Barahona, D. and Nenes, A.: Parameterizing the competition between homogeneous and heterogeneous freezing in cirrus cloud formation – monodisperse ice nuclei, Atmos. Chem. Phys., 9, 369–381, https://doi.org/10.5194/acp-9-369-2009, 2009. a
Benz, S., Megahed, K., Möhler, O., Saathoff, H., Wagner, R., and Schurath, U.: T-dependent rate measurements of homogeneous ice nucleation in cloud droplets using a large atmospheric simulation chamber, J. Photoch. Photobio. A, 176, 208–217, https://doi.org/10.1016/j.jphotochem.2005.08.026, 2005. a
Bi, K., McMeeking, G. R., Ding, D. P., Levin, E. J. T., DeMott, P. J., Zhao, D. L., Wang, F., Liu, Q., Tian, P., Ma, X. C., Chen, Y. B., Huang, M. Y., Zhang, H. L., Gordon, T. D., and Chen, P.: Measurements of Ice Nucleating Particles in Beijing, China, J. Geophys. Res.-Atmos., 124, 8065–8075, https://doi.org/10.1029/2019jd030609, 2019. a, b
Boose, Y., Kanji, Z. A., Kohn, M., Sierau, B., Zipori, A., Crawford, I., Lloyd, G., Bukowiecki, N., Herrmann, E., Kupiszewski, P., Steinbacher, M., and Lohmann, U.: Ice Nucleating Particle Measurements at 241 K during Winter Months at 3580 m MSL in the Swiss Alps, J. Atmos. Sci., 73, 2203–2228, https://doi.org/10.1175/jas-d-15-0236.1, 2016a. a, b
Boose, Y., Sierau, B., García, M. I., Rodríguez, S., Alastuey, A., Linke, C., Schnaiter, M., Kupiszewski, P., Kanji, Z. A., and Lohmann, U.: Ice nucleating particles in the Saharan Air Layer, Atmos. Chem. Phys., 16, 9067–9087, https://doi.org/10.5194/acp-16-9067-2016, 2016b. a, b
Boucher, O., Randall, D., Artaxo, P., Bretherton, C., Feingold, G., Forster, P., Kerminen, V.-M., Kondo, Y., Liao, H., Lohmann, U., Rasch, P., Satheesh, S. K., Sherwood, S., Stevens, B., and Zhang, X. Y.: Intergovernmental Panel on Climate Change, Clouds and Aerosols, in: Climate Change 2013 – The Physical Science Basis: Working Group I Contribution to the Fifth Assessment Report of the Intergovernmental Panel on Climate Change, Cambridge University Press, Cambridge, UK, https://doi.org/10.1017/CBO9781107415324.016, 571–657, 2013. a
Brunner, C. and Kanji, Z. A.: Continuous online monitoring of ice-nucleating particles: development of the automated Horizontal Ice Nucleation Chamber (HINC-Auto), Atmos. Meas. Tech., 14, 269–293, https://doi.org/10.5194/amt-14-269-2021, 2021. a, b
Burrows, S. M., Hoose, C., Pöschl, U., and Lawrence, M. G.: Ice nuclei in marine air: biogenic particles or dust?, Atmos. Chem. Phys., 13, 245–267, https://doi.org/10.5194/acp-13-245-2013, 2013. a
Campbell, J. R. and Shiobara, M.: Glaciation of a mixed-phase boundary layer cloud at a coastal arctic site as depicted in continuous lidar measurements, Polar Sci., 2, 121–127, https://doi.org/10.1016/j.polar.2008.04.004, 2008. a
Conen, F., Rodríguez, S., Hülin, C., Henne, S., Herrmann, E., Bukowiecki, N., and Alewell, C.: Atmospheric ice nuclei at the high-altitude observatory Jungfraujoch, Switzerland, Tellus B, 67, 25014, https://doi.org/10.3402/tellusb.v67.25014, 2015. a
Connolly, P. J., Möhler, O., Field, P. R., Saathoff, H., Burgess, R., Choularton, T., and Gallagher, M.: Studies of heterogeneous freezing by three different desert dust samples, Atmos. Chem. Phys., 9, 2805–2824, https://doi.org/10.5194/acp-9-2805-2009, 2009. a
de Boer, G., Morrison, H., Shupe, M. D., and Hildner, R.: Evidence of liquid dependent ice nucleation in high-latitude stratiform clouds from surface remote sensors, Geophysical Research Letters, 38, L01803, https://doi.org/10.1029/2010gl046016, 2011. a
DeMott, P. J., Cziczo, D. J., Prenni, A. J., Murphy, D. M., Kreidenweis, S. M., Thomson, D. S., Borys, R., and Rogers, D. C.: Measurements of the concentration and composition of nuclei for cirrus formation, P. Natl. Acad. Sci. USA, 100, 14655–14660, https://doi.org/10.1073/pnas.2532677100, 2003a. a
DeMott, P. J., Sassen, K., Poellot, M. R., Baumgardner, D., Rogers, D. C., Brooks, S. D., Prenni, A. J., and Kreidenweis, S. M.: African dust aerosols as atmospheric ice nuclei, Geophys. Res. Lett., 30, 1732, https://doi.org/10.1029/2003gl017410, 2003b. a, b
DeMott, P. J., Prenni, A. J., Liu, X., Kreidenweis, S. M., Petters, M. D., Twohy, C. H., Richardson, M. S., Eidhammer, T., and Rogers, D. C.: Predicting global atmospheric ice nuclei distributions and their impacts on climate, P. Natl. Acad. Sci. USA, 107, 11217–11222, https://doi.org/10.1073/pnas.0910818107, 2010. a, b, c, d
DeMott, P. J., Möhler, O., Stetzer, O., Vali, G., Levin, Z., Petters, M. D., Murakami, M., Leisner, T., Bundke, U., Klein, H., Kanji, Z. A., Cotton, R., Jones, H., Benz, S., Brinkmann, M., Rzesanke, D., Saathoff, H., Nicolet, M., Saito, A., Nillius, B., Bingemer, H., Abbatt, J., Ardon, K., Ganor, E., Georgakopoulos, D. G., and Saunders, C.: Resurgence in Ice Nuclei Measurement Research, B. Am. Meteorol. Soc., 92, 1623–1635, https://doi.org/10.1175/2011bams3119.1, 2011. a, b
DeMott, P. J., Hill, T. C. J., McCluskey, C. S., Prather, K. A., Collins, D. B., Sullivan, R. C., Ruppel, M. J., Mason, R. H., Irish, V. E., Lee, T., Hwang, C. Y., Rhee, T. S., Snider, J. R., McMeeking, G. R., Dhaniyala, S., Lewis, E. R., Wentzell, J. J. B., Abbatt, J., Lee, C., Sultana, C. M., Ault, A. P., Axson, J. L., Martinez, M. D., Venero, I., Santos-Figueroa, G., Stokes, M. D., Deane, G. B., Mayol-Bracero, O. L., Grassian, V. H., Bertram, T. H., Bertram, A. K., Moffett, B. F., and Franc, G. D.: Sea spray aerosol as a unique source of ice nucleating particles, P. Natl. Acad. Sci. USA, 113, 5797–5803, https://doi.org/10.1073/pnas.1514034112, 2015. a
DeMott, P. J., Möhler, O., Cziczo, D. J., Hiranuma, N., Petters, M. D., Petters, S. S., Belosi, F., Bingemer, H. G., Brooks, S. D., Budke, C., Burkert-Kohn, M., Collier, K. N., Danielczok, A., Eppers, O., Felgitsch, L., Garimella, S., Grothe, H., Herenz, P., Hill, T. C. J., Höhler, K., Kanji, Z. A., Kiselev, A., Koop, T., Kristensen, T. B., Krüger, K., Kulkarni, G., Levin, E. J. T., Murray, B. J., Nicosia, A., O'Sullivan, D., Peckhaus, A., Polen, M. J., Price, H. C., Reicher, N., Rothenberg, D. A., Rudich, Y., Santachiara, G., Schiebel, T., Schrod, J., Seifried, T. M., Stratmann, F., Sullivan, R. C., Suski, K. J., Szakáll, M., Taylor, H. P., Ullrich, R., Vergara-Temprado, J., Wagner, R., Whale, T. F., Weber, D., Welti, A., Wilson, T. W., Wolf, M. J., and Zenker, J.: The Fifth International Workshop on Ice Nucleation phase 2 (FIN-02): laboratory intercomparison of ice nucleation measurements, Atmos. Meas. Tech., 11, 6231–6257, https://doi.org/10.5194/amt-11-6231-2018, 2018. a, b, c
Desai, N., Chandrakar, K. K., Kinney, G., Cantrell, W., and Shaw, R. A.: Aerosol-Mediated Glaciation of Mixed-Phase Clouds: Steady-State Laboratory Measurements, Geophys. Res. Lett., 46, 9154–9162, https://doi.org/10.1029/2019gl083503, 2019. a
Eidhammer, T., DeMott, P. J., Prenni, A. J., Petters, M. D., Twohy, C. H., Rogers, D. C., Stith, J., Heymsfield, A., Wang, Z., Pratt, K. A., Prather, K. A., Murphy, S. M., Seinfeld, J. H., Subramanian, R., and Kreidenweis, S. M.: Ice Initiation by Aerosol Particles: Measured and Predicted Ice Nuclei Concentrations versus Measured Ice Crystal Concentrations in an Orographic Wave Cloud, J. Atmos. Sci., 67, 2417–2436, https://doi.org/10.1175/2010jas3266.1, 2010. a
Fan, J., Leung, L. R., Rosenfeld, D., and DeMott, P. J.: Effects of cloud condensation nuclei and ice nucleating particles on precipitation processes and supercooled liquid in mixed-phase orographic clouds, Atmos. Chem. Phys., 17, 1017–1035, https://doi.org/10.5194/acp-17-1017-2017, 2017. a
Field, P. R. and Heymsfield, A. J.: Importance of snow to global precipitation, Geophys. Res. Lett., 42, 9512–9520, https://doi.org/10.1002/2015GL065497, 2015. a
Field, P. R., Heymsfield, A. J., Shipway, B. J., DeMott, P. J., Pratt, K. A., Rogers, D. C., Stith, J., and Prather, K. A.: Ice in Clouds Experiment – Layer Clouds. Part II: Testing Characteristics of Heterogeneous Ice Formation in Lee Wave Clouds, J. Atmos. Sci., 69, 1066–1079, https://doi.org/10.1175/jas-d-11-026.1, 2012. a
Field, P. R., Lawson, R. P., Brown, P. R. A., Lloyd, G., Westbrook, C., Moisseev, D., Miltenberger, A., Nenes, A., Blyth, A., Choularton, T., Connolly, P., Buehl, J., Crosier, J., Cui, Z., Dearden, C., DeMott, P., Flossmann, A., Heymsfield, A., Huang, Y., Kalesse, H., Kanji, Z. A., Korolev, A., Kirchgaessner, A., Lasher-Trapp, S., Leisner, T., McFarquhar, G., Phillips, V., Stith, J., and Sullivan, S.: Chapter 7. Secondary Ice Production - current state of the science and recommendations for the future, Meteor. Mon., 58, 7.1–7.20, https://doi.org/10.1175/amsmonographs-d-16-0014.1, 2016. a
Hande, L. B. and Hoose, C.: Partitioning the primary ice formation modes in large eddy simulations of mixed-phase clouds, Atmos. Chem. Phys., 17, 14105–14118, https://doi.org/10.5194/acp-17-14105-2017, 2017. a
Harrison, A. D., Lever, K., Sanchez-Marroquin, A., Holden, M. A., Whale, T. F., Tarn, M. D., McQuaid, J. B., and Murray, B. J.: The ice-nucleating ability of quartz immersed in water and its atmospheric importance compared to K-feldspar, Atmos. Chem. Phys., 19, 11343–11361, https://doi.org/10.5194/acp-19-11343-2019, 2019. a
Heymsfield, A. J., Krämer, M., Luebke, A., Brown, P., Cziczo, D. J., Franklin, C., Lawson, P., Lohmann, U., McFarquhar, G., Ulanowski, Z., and Tricht, K. V.: Cirrus Clouds, Meteor. Mon., 58, 21–226, https://doi.org/10.1175/amsmonographs-d-16-0010.1, 2017. a
Hiranuma, N., Augustin-Bauditz, S., Bingemer, H., Budke, C., Curtius, J., Danielczok, A., Diehl, K., Dreischmeier, K., Ebert, M., Frank, F., Hoffmann, N., Kandler, K., Kiselev, A., Koop, T., Leisner, T., Möhler, O., Nillius, B., Peckhaus, A., Rose, D., Weinbruch, S., Wex, H., Boose, Y., DeMott, P. J., Hader, J. D., Hill, T. C. J., Kanji, Z. A., Kulkarni, G., Levin, E. J. T., McCluskey, C. S., Murakami, M., Murray, B. J., Niedermeier, D., Petters, M. D., O'Sullivan, D., Saito, A., Schill, G. P., Tajiri, T., Tolbert, M. A., Welti, A., Whale, T. F., Wright, T. P., and Yamashita, K.: A comprehensive laboratory study on the immersion freezing behavior of illite NX particles: a comparison of 17 ice nucleation measurement techniques, Atmos. Chem. Phys., 15, 2489–2518, https://doi.org/10.5194/acp-15-2489-2015, 2015. a, b, c
Holden, M. A., Whale, T. F., Tarn, M. D., O'Sullivan, D., Walshaw, R. D., Murray, B. J., Meldrum, F. C., and Christenson, H. K.: High-speed imaging of ice nucleation in water proves the existence of active sites, Sci. Adv., 5, eaav4316, https://doi.org/10.1126/sciadv.aav4316, 2019. a
Hoose, C. and Möhler, O.: Heterogeneous ice nucleation on atmospheric aerosols: a review of results from laboratory experiments, Atmos. Chem. Phys., 12, 9817–9854, https://doi.org/10.5194/acp-12-9817-2012, 2012. a
Hoose, C., Kristjánsson, J. E., Chen, J.-P., and Hazra, A.: A Classical-Theory-Based Parameterization of Heterogeneous Ice Nucleation by Mineral Dust, Soot, and Biological Particles in a Global Climate Model, J. Atmos. Sci., 67, 2483–2503, https://doi.org/10.1175/2010jas3425.1, 2010. a
Johnson, D., McKinley, I., Rodriguez, J., Tseng, H., and Carroll, B.: Characterization testing of the Thales LPT9310 pulse tube cooler, in: Cryocoolers 18, edited by: Miller, S. D. and Ross Jr., R. G., International Cryocooler Conference, Inc., Boulder, CO, USA, 125–133, 2014. a
Järvinen, E., Vochezer, P., Möhler, O., and Schnaiter, M.: Laboratory study of microphysical and scattering properties of corona-producing cirrus clouds, Appl. Opt., 53, 7566, https://doi.org/10.1364/ao.53.007566, 2014. a
Kanji, Z. A., Ladino, L. A., Wex, H., Boose, Y., Burkert-Kohn, M., Cziczo, D. J., and Krämer, M.: Overview of Ice Nucleating Particles, Meteor. Mon., 58, 11–133, https://doi.org/10.1175/amsmonographs-d-16-0006.1, 2017. a, b
Koop, T. and Murray, B. J.: A physically constrained classical description of the homogeneous nucleation of ice in water, J. Chem. Phys., 145, 211915, https://doi.org/10.1063/1.4962355, 2016. a
Korolev, A., McFarquhar, G., Field, P. R., Franklin, C., Lawson, P., Wang, Z., Williams, E., Abel, S. J., Axisa, D., Borrmann, S., Crosier, J., Fugal, J., Krämer, M., Lohmann, U., Schlenczek, O., Schnaiter, M., and Wendisch, M.: Mixed-Phase Clouds: Progress and Challenges, Meteor. Mon., 58, 51–550, https://doi.org/10.1175/amsmonographs-d-17-0001.1, 2017. a
Kärcher, B. and Lohmann, U.: A Parameterization of cirrus cloud formation: Homogeneous freezing including effects of aerosol size, J. Geophys. Res.-Atmos., 107, AAC 9-1–AAC 9-10, https://doi.org/10.1029/2001JD001429, 2002. a
Kärcher, B. and Lohmann, U.: A parameterization of cirrus cloud formation: Heterogeneous freezing, J. Geophys. Res.-Atmos., 108, 4402, https://doi.org/10.1029/2002JD003220, 2003. a
Lacher, L., Lohmann, U., Boose, Y., Zipori, A., Herrmann, E., Bukowiecki, N., Steinbacher, M., and Kanji, Z. A.: The Horizontal Ice Nucleation Chamber (HINC): INP measurements at conditions relevant for mixed-phase clouds at the High Altitude Research Station Jungfraujoch, Atmos. Chem. Phys., 17, 15199–15224, https://doi.org/10.5194/acp-17-15199-2017, 2017. a
Lacher, L., DeMott, P. J., Levin, E. J. T., Suski, K. J., Boose, Y., Zipori, A., Herrmann, E., Bukowiecki, N., Steinbacher, M., Gute, E., Abbatt, J. P. D., Lohmann, U., and Kanji, Z. A.: Background Free-Tropospheric Ice Nucleating Particle Concentrations at Mixed-Phase Cloud Conditions, J. Geophys. Res.-Atmos., 123, 10506–10525, https://doi.org/10.1029/2018jd028338, 2018a. a
Lacher, L., Steinbacher, M., Bukowiecki, N., Herrmann, E., Zipori, A., and Kanji, Z.: Impact of Air Mass Conditions and Aerosol Properties on Ice Nucleating Particle Concentrations at the High Altitude Research Station Jungfraujoch, Atmosphere-Basel, 9, 363, https://doi.org/10.3390/atmos9090363, 2018b. a, b
Lohmann, U.: Anthropogenic aerosol influences on mixed-phase clouds, Current Climate Change Rep., 3, 32–44, 2017. a
Mason, R. H., Chou, C., McCluskey, C. S., Levin, E. J. T., Schiller, C. L., Hill, T. C. J., Huffman, J. A., DeMott, P. J., and Bertram, A. K.: The micro-orifice uniform deposit impactor–droplet freezing technique (MOUDI-DFT) for measuring concentrations of ice nucleating particles as a function of size: improvements and initial validation, Atmos. Meas. Tech., 8, 2449–2462, https://doi.org/10.5194/amt-8-2449-2015, 2015. a
McCluskey, C. S., Ovadnevaite, J., Rinaldi, M., Atkinson, J., Belosi, F., Ceburnis, D., Marullo, S., Hill, T. C. J., Lohmann, U., Kanji, Z. A., O′Dowd, C., Kreidenweis, S. M., and DeMott, P. J.: Marine and Terrestrial Organic Ice-Nucleating Particles in Pristine Marine to Continentally Influenced Northeast Atlantic Air Masses, J. Geophys. Res.-Atmos., 123, 6196–6212, https://doi.org/10.1029/2017jd028033, 2018. a, b
Murray, B. J., O′Sullivan, D., Atkinson, J. D., and Webb, M. E.: Ice nucleation by particles immersed in supercooled cloud droplets, Chem. Soc. Rev., 41, 6519, https://doi.org/10.1039/c2cs35200a, 2012. a
Möhler, O., Stetzer, O., Schaefers, S., Linke, C., Schnaiter, M., Tiede, R., Saathoff, H., Krämer, M., Mangold, A., Budz, P., Zink, P., Schreiner, J., Mauersberger, K., Haag, W., Kärcher, B., and Schurath, U.: Experimental investigation of homogeneous freezing of sulphuric acid particles in the aerosol chamber AIDA, Atmos. Chem. Phys., 3, 211–223, https://doi.org/10.5194/acp-3-211-2003, 2003. a, b
Möhler, O., Büttner, S., Linke, C., Schnaiter, M., Saathoff, H., Stetzer, O., Wagner, R., Krämer, M., Mangold, A., Ebert, V., and Schurath, U.: Effect of sulfuric acid coating on heterogeneous ice nucleation by soot aerosol particles, J. Geophys. Res.-Atmos., 110, 477–484, https://doi.org/10.1029/2004JD005169, 2005. a, b
Möhler, O., Field, P. R., Connolly, P., Benz, S., Saathoff, H., Schnaiter, M., Wagner, R., Cotton, R., Krämer, M., Mangold, A., and Heymsfield, A. J.: Efficiency of the deposition mode ice nucleation on mineral dust particles, Atmos. Chem. Phys., 6, 3007–3021, https://doi.org/10.5194/acp-6-3007-2006, 2006. a
Möhler, O., Adams, M., Lacher, L., Vogel, F., Nadolny, J., Fösig, R., Boffo, C., Pfeuffer, T., Hobl, A., Weis, M., Vepuri, H. S. K., Hiranuma, N., and Murray, B. J.: Data sets to research article by Möhler et al. “The portable ice nucleation experiment PINE: a new online instrument for laboratory studies and automated long-term field observations of ice-nucleating particles”, Technologie Transferprojekt N059 PINE, KIT-Bibliothek, https://doi.org/10.5445/IR/1000122157, 2021. a
Mülmenstädt, J., Sourdeval, O., Delanoë, J., and Quaas, J.: Frequency of occurrence of rain from liquid-, mixed-, and ice-phase clouds derived from A-Train satellite retrievals, Geophys. Res. Lett., 42, 6502–6509, https://doi.org/10.1002/2015gl064604, 2015. a
Niemand, M., Möhler, O., Vogel, B., Vogel, H., Hoose, C., Connolly, P., Klein, H., Bingemer, H., DeMott, P., Skrotzki, J., and Leisner, T.: A Particle-Surface-Area-Based Parameterization of Immersion Freezing on Desert Dust Particles, J. Atmos. Sci., 69, 3077–3092, https://doi.org/10.1175/jas-d-11-0249.1, 2012. a
O'Sullivan, D., Adams, M. P., Tarn, M. D., Harrison, A. D., Vergara-Temprado, J., Porter, G. C. E., Holden, M. A., Sanchez-Marroquin, A., Carotenuto, F., Whale, T. F., McQuaid, J. B., Walshaw, R., Hedges, D. H. P., Burke, I. T., Cui, Z., and Murray, B. J.: Contributions of biogenic material to the atmospheric ice-nucleating particle population in North Western Europe, Sci. Rep.-UK, 8, 13821, https://doi.org/10.1038/s41598-018-31981-7, 2018. a
Paukert, M. and Hoose, C.: Modeling immersion freezing with aerosol-dependent prognostic ice nuclei in Arctic mixed-phase clouds, J. Geophys. Res.-Atmos., 119, 9073–9092, https://doi.org/10.1002/2014jd021917, 2014. a
Pratt, K. A., Twohy, C. H., Murphy, S. M., Moffet, R. C., Heymsfield, A. J., Gaston, C. J., DeMott, P. J., Field, P. R., Henn, T. R., Rogers, D. C., Gilles, M. K., Seinfeld, J. H., and Prather, K. A.: Observation of playa salts as nuclei in orographic wave clouds, J. Geophys. Res., 115, D15301, https://doi.org/10.1029/2009jd013606, 2010. a
Prenni, A. J., DeMott, P. J., Rogers, D. C., Kreidenweis, S. M., McFarquhar, G. M., Zhang, G., and Poellot, M. R.: Ice nuclei characteristics from M-PACE and their relation to ice formation in clouds, Tellus B, 61, 436–448, https://doi.org/10.1111/j.1600-0889.2009.00415.x, 2009. a
Pruppacher, H. R. and Klett, J. D.: Microphysics of Clouds and Precipitation, Springer-Verlag GmbH, Second revised and expanded Edn., Springer Dordrecht Heidelberg London New York, ISBN 978-0-7923-4211-3, https://doi.org/10.1007/978-0-306-48100-0, 2010. a, b
Rogers, D. C., DeMott, P. J., Kreidenweis, S. M., and Chen, Y.: A Continuous-Flow Diffusion Chamber for Airborne Measurements of Ice Nuclei, J. Atmos. Ocean. Tech., 18, 725–741, https://doi.org/10.1175/1520-0426(2001)018<0725:acfdcf>2.0.co;2, 2001. a
Sesartic, A., Lohmann, U., and Storelvmo, T.: Modelling the impact of fungal spore ice nuclei on clouds and precipitation, Environ. Res. Lett., 8, 014029, https://doi.org/10.1088/1748-9326/8/1/014029, 2013. a
Spracklen, D. V. and Heald, C. L.: The contribution of fungal spores and bacteria to regional and global aerosol number and ice nucleation immersion freezing rates, Atmos. Chem. Phys., 14, 9051–9059, https://doi.org/10.5194/acp-14-9051-2014, 2014. a
Steinke, I., Hoose, C., Möhler, O., Connolly, P., and Leisner, T.: A new temperature- and humidity-dependent surface site density approach for deposition ice nucleation, Atmos. Chem. Phys., 15, 3703–3717, https://doi.org/10.5194/acp-15-3703-2015, 2015. a
Tan, I., Storelvmo, T., and Zelinka, M. D.: Observational constraints on mixed-phase clouds imply higher climate sensitivity, Science, 352, 224–227, https://doi.org/10.1126/science.aad5300, 2016. a
Tobo, Y., Prenni, A. J., DeMott, P. J., Huffman, J. A., McCluskey, C. S., Tian, G., Pöhlker, C., Pöschl, U., and Kreidenweis, S. M.: Biological aerosol particles as a key determinant of ice nuclei populations in a forest ecosystem, J. Geophys. Res.-Atmos., 118, 10100–10110, https://doi.org/10.1002/jgrd.50801, 2013. a
Ullrich, R., Hoose, C., Möhler, O., Niemand, M., Wagner, R., Höhler, K., Hiranuma, N., Saathoff, H., and Leisner, T.: A New Ice Nucleation Active Site Parameterization for Desert Dust and Soot, J. Atmos. Sci., 74, 699–717, https://doi.org/10.1175/jas-d-16-0074.1, 2017. a
Vali, G., DeMott, P. J., Möhler, O., and Whale, T. F.: Technical Note: A proposal for ice nucleation terminology, Atmos. Chem. Phys., 15, 10263–10270, https://doi.org/10.5194/acp-15-10263-2015, 2015. a
Vergara-Temprado, J., Murray, B. J., Wilson, T. W., O'Sullivan, D., Browse, J., Pringle, K. J., Ardon-Dryer, K., Bertram, A. K., Burrows, S. M., Ceburnis, D., DeMott, P. J., Mason, R. H., O'Dowd, C. D., Rinaldi, M., and Carslaw, K. S.: Contribution of feldspar and marine organic aerosols to global ice nucleating particle concentrations, Atmos. Chem. Phys., 17, 3637–3658, https://doi.org/10.5194/acp-17-3637-2017, 2017. a
Vergara-Temprado, J., Miltenberger, A. K., Furtado, K., Grosvenor, D. P., Shipway, B. J., Hill, A. A., Wilkinson, J. M., Field, P. R., Murray, B. J., and Carslaw, K. S.: Strong control of Southern Ocean cloud reflectivity by ice-nucleating particles, P. Natl. Acad. Sci. USA, 115, 2687–2692, https://doi.org/10.1073/pnas.1721627115, 2018. a, b, c, d
Wagner, R. and Möhler, O.: Heterogeneous ice nucleation ability of crystalline sodium chloride dihydrate particles, J. Geophys. Res.-Atmos., 118, 4610–4622, https://doi.org/10.1002/jgrd.50325, 2013. a
Waliser, D. E., Li, J.-L. F., Woods, C. P., Austin, R. T., Bacmeister, J., Chern, J., Genio, A. D., Jiang, J. H., Kuang, Z., Meng, H., Minnis, P., Platnick, S., Rossow, W. B., Stephens, G. L., Sun-Mack, S., Tao, W.-K., Tompkins, A. M., Vane, D. G., Walker, C., and Wu, D.: Cloud ice: A climate model challenge with signs and expectations of progress, J. Geophys. Res., 114, D00A21, https://doi.org/10.1029/2008jd010015, 2009. a
Welti, A., Müller, K., Fleming, Z. L., and Stratmann, F.: Concentration and variability of ice nuclei in the subtropical maritime boundary layer, Atmos. Chem. Phys., 18, 5307–5320, https://doi.org/10.5194/acp-18-5307-2018, 2018. a
Wex, H., Augustin-Bauditz, S., Boose, Y., Budke, C., Curtius, J., Diehl, K., Dreyer, A., Frank, F., Hartmann, S., Hiranuma, N., Jantsch, E., Kanji, Z. A., Kiselev, A., Koop, T., Möhler, O., Niedermeier, D., Nillius, B., Rösch, M., Rose, D., Schmidt, C., Steinke, I., and Stratmann, F.: Intercomparing different devices for the investigation of ice nucleating particles using Snomax® as test substance, Atmos. Chem. Phys., 15, 1463–1485, https://doi.org/10.5194/acp-15-1463-2015, 2015. a
Wex, H., Huang, L., Zhang, W., Hung, H., Traversi, R., Becagli, S., Sheesley, R. J., Moffett, C. E., Barrett, T. E., Bossi, R., Skov, H., Hünerbein, A., Lubitz, J., Löffler, M., Linke, O., Hartmann, M., Herenz, P., and Stratmann, F.: Annual variability of ice-nucleating particle concentrations at different Arctic locations, Atmos. Chem. Phys., 19, 5293–5311, https://doi.org/10.5194/acp-19-5293-2019, 2019. a, b
Wilson, T. W., Ladino, L. A., Alpert, P. A., Breckels, M. N., Brooks, I. M., Browse, J., Burrows, S. M., Carslaw, K. S., Huffman, J. A., Judd, C., Kilthau, W. P., Mason, R. H., McFiggans, G., Miller, L. A., Nájera, J. J., Polishchuk, E., Rae, S., Schiller, C. L., Si, M., Temprado, J. V., Whale, T. F., Wong, J. P. S., Wurl, O., Yakobi-Hancock, J. D., Abbatt, J. P. D., Aller, J. Y., Bertram, A. K., Knopf, D. A., and Murray, B. J.: A marine biogenic source of atmospheric ice-nucleating particles, Nature, 525, 234–238, https://doi.org/10.1038/nature14986, 2015. a
- Abstract
- Introduction
- Basic principles and milestones of the PINE development
- PINE instrument setup
- PINE operating principle
- Laboratory tests of the prototype version PINE-1A
- Field measurements with PINE-c
- Summary and conclusions
- Appendix A: Membrane diffusion dryer
- Appendix B: Background measurements
- Appendix C: PINE construction and operation
- Data availability
- Author contributions
- Competing interests
- Acknowledgements
- Financial support
- Review statement
- References