Lateral, Vertical, and Temporal Variability of Seawater Carbonate Chemistry at Hog Reef, Bermuda
 Ariel K. Pezner1*
  Travis A. Courtney1
  Heather N. Page1,2
  Sarah N. Giddings1 Cory M. Beatty3
  Michael D. DeGrandpre3
  Andreas J. Andersson1
- 1Scripps Institution of Oceanography, University of California, San Diego, La Jolla, CA, United States
- 2Sea Education Association, Woods Hole, MA, United States
- 3Department of Chemistry and Biochemistry, University of Montana, Missoula, MT, United States
Spatial and temporal carbonate chemistry variability on coral reefs is influenced by a combination of seawater hydrodynamics, geomorphology, and biogeochemical processes, though their relative influence varies by site. It is often assumed that the water column above most reefs is well-mixed with small to no gradients outside of the benthic boundary layer. However, few studies to date have explored the processes and properties controlling these multi-dimensional gradients. Here, we investigated the lateral, vertical, and temporal variability of seawater carbonate chemistry on a Bermudan rim reef using a combination of spatial seawater chemistry surveys and autonomous in situ sensors. Instruments were deployed at Hog Reef measuring current flow, seawater temperature, salinity, pHT, pCO2, dissolved oxygen (DO), and total alkalinity (TA) on the benthos, and temperature, salinity, DO, and pCO2 at the surface. Water samples from spatial surveys were collected from surface and bottom depths at 13 stations covering ∼3 km2 across 4 days. High frequency temporal variability in carbonate chemistry was driven by a combination of diel light and mixed semi-diurnal tidal cycles on the reef. Daytime gradients in DO between the surface and the benthos suggested significant water column production contributing to distinct diel trends in pHT, pCO2, and DO, but not TA. We hypothesize these differences reflect the differential effect of biogeochemical processes important in both the water column and benthos (organic carbon production/respiration) vs. processes mainly occurring on the benthos (calcium carbonate production/dissolution). Locally at Hog Reef, the relative magnitude of the diel variability of organic carbon production/respiration was 1.4–4.6 times larger than that of calcium carbonate production/dissolution, though estimates of net organic carbon production and calcification based on inshore-offshore chemical gradients revealed net heterotrophy (−118 ± 51 mmol m–2 day–1) and net calcification (150 ± 37 mmol CaCO3 m–2 day–1). These results reflect the important roles of time and space in assessing reef biogeochemical processes. The spatial variability in carbonate chemistry parameters was larger laterally than vertically and was generally observed in conjunction with depth gradients, but varied between sampling events, depending on time of day and modifications due to current flow.
Introduction
Coral reefs are some of the most ecologically diverse and economically valuable ecosystems in the world, providing ecosystem services such as coastline protection, fisheries provisioning, tourism revenue, nutrient cycling, and habitat creation that amount to billions of dollars annually (e.g., Spurgeon, 1992; Moberg and Folke, 1999; Brander et al., 2007; Costanza et al., 2014). However, anthropogenic stressors on local and global scales, including temperature rise (e.g., Hughes et al., 2003), overfishing (e.g., Jackson et al., 2001), hypoxia (Nelson and Altieri, 2019), and ocean acidification (e.g., Hoegh-Guldberg et al., 2007) are threatening reef function around the world. Coral reefs may be particularly susceptible to the effects of ocean acidification due to the large presence of marine calcifiers whose calcium carbonate (CaCO3) structures serve as the reef foundation (Kleypas et al., 1999; Hoegh-Guldberg et al., 2007; Kleypas and Yates, 2009). Increasingly acidified conditions resulting from changes in seawater carbonate chemistry are predicted to drive declines in calcification by organisms such as corals (e.g., Langdon et al., 2000; for a metanalysis see Chan and Connolly, 2013) and increases in bioerosion and CaCO3 dissolution rates (e.g., Andersson and Gledhill, 2013; Schönberg et al., 2017) which could result in many reefs potentially shifting to net dissolving instead of net calcifying by the end of the century (Hoegh-Guldberg et al., 2007; Silverman et al., 2009; Eyre et al., 2018).
An individual reef’s response to acidified conditions, however, may be strongly dependent on the biogeochemistry of the particular system (Andersson et al., 2014). Locally, carbonate chemistry is in part controlled by the metabolic processes occurring on the benthos such as calcification, CaCO3 dissolution, primary production, and respiration (Anthony et al., 2011; Kleypas et al., 2011). The net sum of total calcification and CaCO3 dissolution is referred to as Net Community Calcification (NCC); whereas, the net sum of primary production and total respiration is referred to as Net Community Production (NCP). Changes in NCC affect the balance of both total alkalinity (TA) and dissolved inorganic carbon (DIC) in a ratio of 2:1, whereas changes in NCP in reef environments mainly affect DIC (Zeebe and Wolf-Gladrow, 2001; Andersson and Gledhill, 2013). Consequently, positive NCC results in a decrease in seawater pH while positive NCP results in an increase in pH, and vice versa for negative NCC and NCP, respectively (Zeebe and Wolf-Gladrow, 2001). Concurrent with these metabolic processes, physical factors such as the reef geomorphology, hydrodynamics, and residence time also influence local variability in carbonate chemistry, as these physical properties control the flow trajectory and contact time between seawater and the benthos (Anthony et al., 2011; Zhang et al., 2012; Falter et al., 2013; Lowe and Falter, 2015; Page et al., 2018). It has been hypothesized that these metabolic and physical processes together may modulate local seawater chemistry to the extent they can either alleviate or exacerbate acidification over reefs compared to the open ocean (Bates et al., 2010; Anthony et al., 2011, 2013; Andersson et al., 2014; Cyronak et al., 2014). However, how these biological and physical drivers interact and contribute to local seawater carbonate chemistry variability in different coral reef habitats and across vertical, lateral, and temporal scales has not been fully characterized (Page et al., 2018; Takeshita et al., 2018).
Many previous studies have demonstrated carbonate chemistry variability as a function of time at the surface or at the bottom in numerous coral reef locations (e.g., Gray et al., 2012; Sutton et al., 2014; DeCarlo et al., 2017) with fewer studies characterizing the spatial and lateral variability across different habitats (Suzuki and Kawahata, 2003; Watanabe et al., 2006; Andersson et al., 2014). In terms of vertical variability, most studies assume that the water column above a shallow reef is well-mixed with small to no gradients above the benthic boundary layer (e.g., Falter et al., 2013; Page et al., 2018). However, given that flow regime, residence time, and benthic productivity have the potential to form strong gradients in water chemistry from upstream to downstream (Anthony et al., 2011; Takeshita et al., 2018), there may also be gradients between surface and bottom that are not often quantified (Watanabe et al., 2006; Andersson et al., 2007). Spatial gradients in any direction also change through time, on hourly to seasonal (e.g., Gagliano et al., 2010; Gray et al., 2012; Guadayol et al., 2014) and annual to decadal time scales (e.g., Pelejero et al., 2005; Wei et al., 2015). This variability has been characterized in Bermuda over shorter timescales (days) (e.g., Takeshita et al., 2018) and longer timescales (seasons to years) (e.g., Bates et al., 2010; Andersson et al., 2014; Yeakel et al., 2015; Bates, 2017). However, there is a scarcity of studies examining vertical, lateral, and temporal variations in reef carbonate chemistry simultaneously.
Compared to low latitude, tropical coral reefs, the high latitude reefs in Bermuda experience significant seasonal and inter-annual variations in seawater chemistry as a result of variations in seawater temperature and local reef metabolism (Andersson et al., 2014; Courtney et al., 2017), as well as larger scale ocean processes linked to the North Atlantic Oscillation (NAO) (Yeakel et al., 2015). In addition, this ocean region has been identified as an area with one of the fastest changing chemical environments under ocean acidification (Andersson et al., 2019). Furthermore, it has been suggested that the coral community structure of Bermuda, which is made up of coral taxa with relatively stress-tolerant life histories, may represent one potential stable state of coral reefs in a future high CO2 world (Courtney et al., 2017), making it an important area to study. Here, the main objective was to compare the spatial variability of seawater chemistry laterally across a reef, at surface and at depth, and through time, in order to capture variability in four dimensions. We also estimated the relative contributions of biogeochemical processes to variability in DIC and TA locally and relative to the open ocean end-member during the study period. Understanding the variability of local seawater chemistry, both spatially and temporally, as well as the drivers of this variability, will be important for predicting the scope and magnitude of ocean acidification impacts on coral reefs.
Materials and Methods
Study Site
The study was conducted at Hog Reef (32.457°N, 64.835°W), a rim-reef on the northern edge of the Bermuda carbonate platform (Figure 1). Depth varies across Hog Reef, ranging from ∼4 to 25 m with a mean (± 1 SD) of 10.3 ± 3.3 m, generally increasing offshore but with high structural complexity and variability (Courtney et al., 2016; Takeshita et al., 2018; Figures 1, 2). Mean (± 1 SD) benthic cover at Hog Reef has been previously described as 35 ± 3% macroalgae, 27 ± 5% hard coral, 20 ± 4% turf algae, 16 ± 2% soft coral, and < 5% sand, rock, rubble, and coralline algae (Marine Environmental Program, 2007; Courtney et al., 2016). Residence time of the water on this rim reef has been estimated to be about 1–4 days using various tracer methods (Morris et al., 1977; Venti et al., 2012). Tides in this area can be characterized as mixed semi-diurnal, with a mean tidal range of 0.90 ± 0.11 m. Tide information (mean sea level, MSL; m) data were accessed from the NOAA Tides and Currents Database for the nearest tide station (St. Georges Island, Bermuda Station1). Bathymetry data was accessed from Sutherland et al. (2014) and the satellite image of Hog Reef is courtesy of the Digital Globe Foundation.
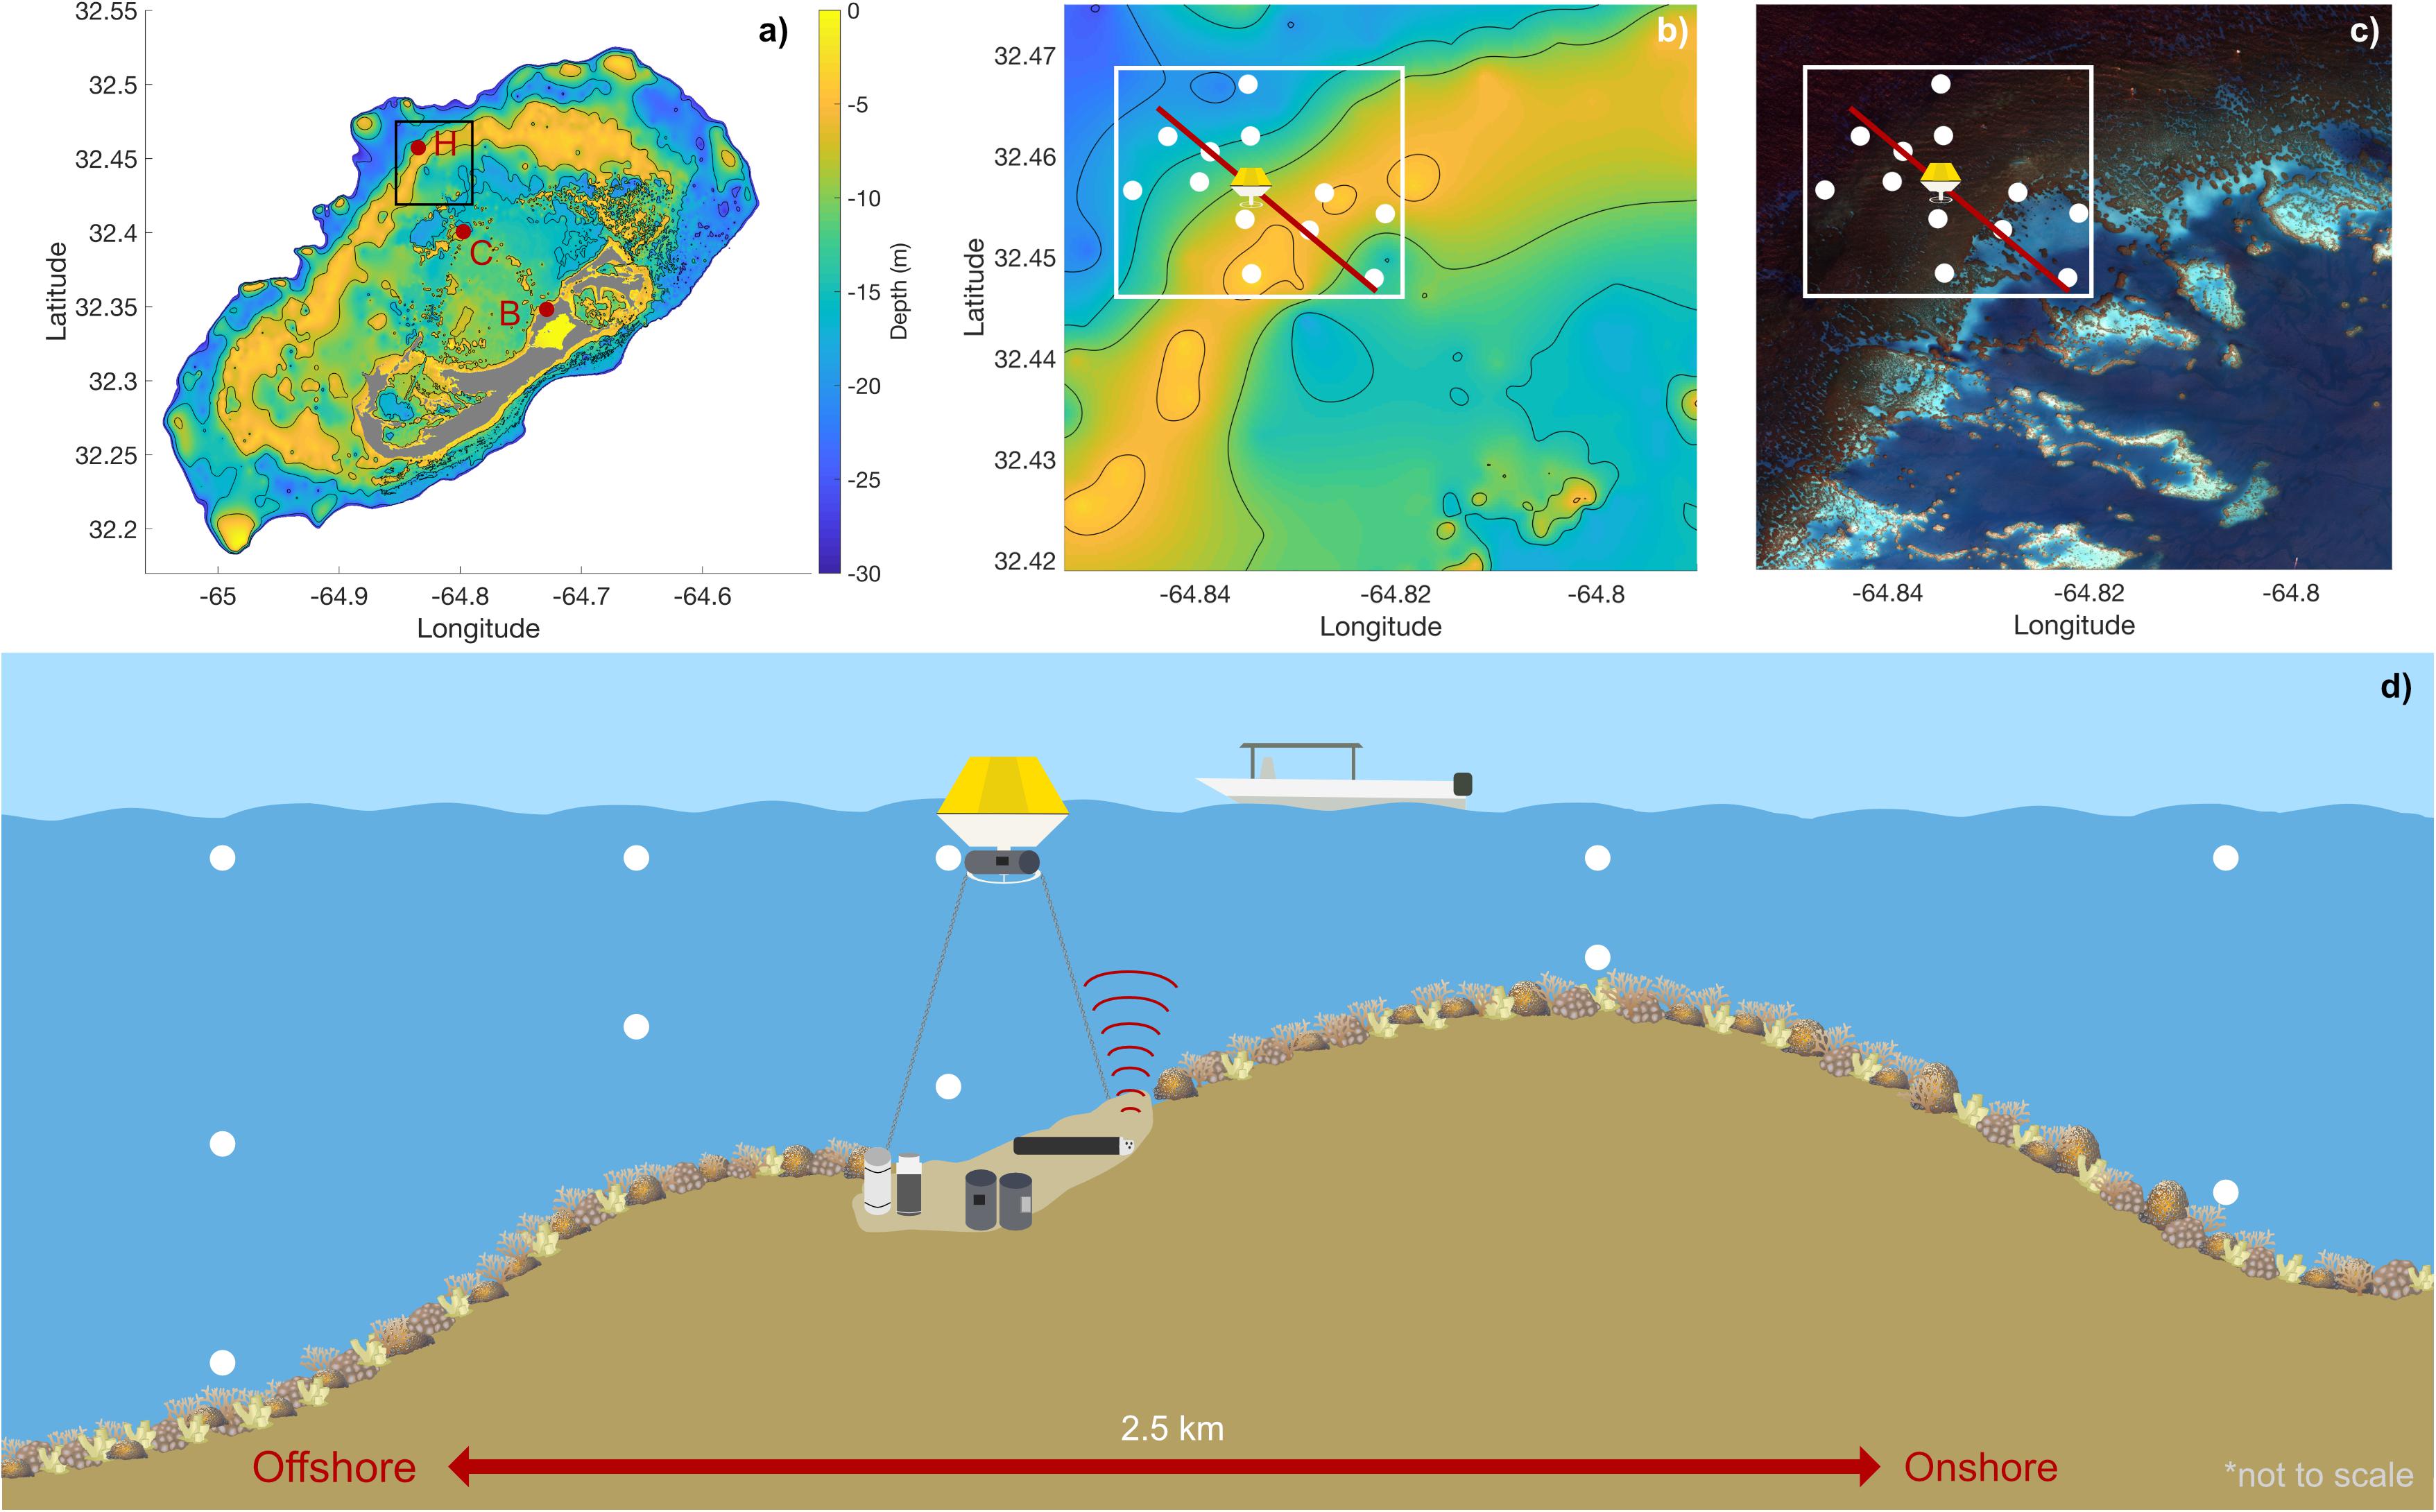
Figure 1. Details of study site: (a) Depth contour map of the Bermuda platform, indicating Hog Reef (H), Crescent Reef (C), and Bailey’s Bay (B) (letters and red circles) with a section of the rim reef including Hog Reef boxed in black (b,c); (b) Depth contour map of Hog Reef from black box in (a) with spatial survey locations (white circles), buoy location, onshore-offshore reef transect (red line), and spatial survey area in white (see Figures 5–7); (c) High-resolution satellite image of Hog Reef, Bermuda processed by Dr. Tyler Cyronak under an imagery grant from the DigitalGlobe Foundation from black box in (a) with spatial survey locations (white circles), buoy location, onshore-offshore reef transect (red line), and spatial survey area in white (see Figures 5–7); (d) Conceptual diagram of the onshore-offshore transect and sampling scheme with the Hog Reef buoy, 6 autonomous sensors, and boat spatial survey water sampling locations (white circles) on exaggerated reef contour (not to scale). Coral icon images attributed to Tracey Saxby and Diana Kleine, Integration and Application Network, University of Maryland Center for Environmental Science (ian.umces.edu/imagelibrary/).
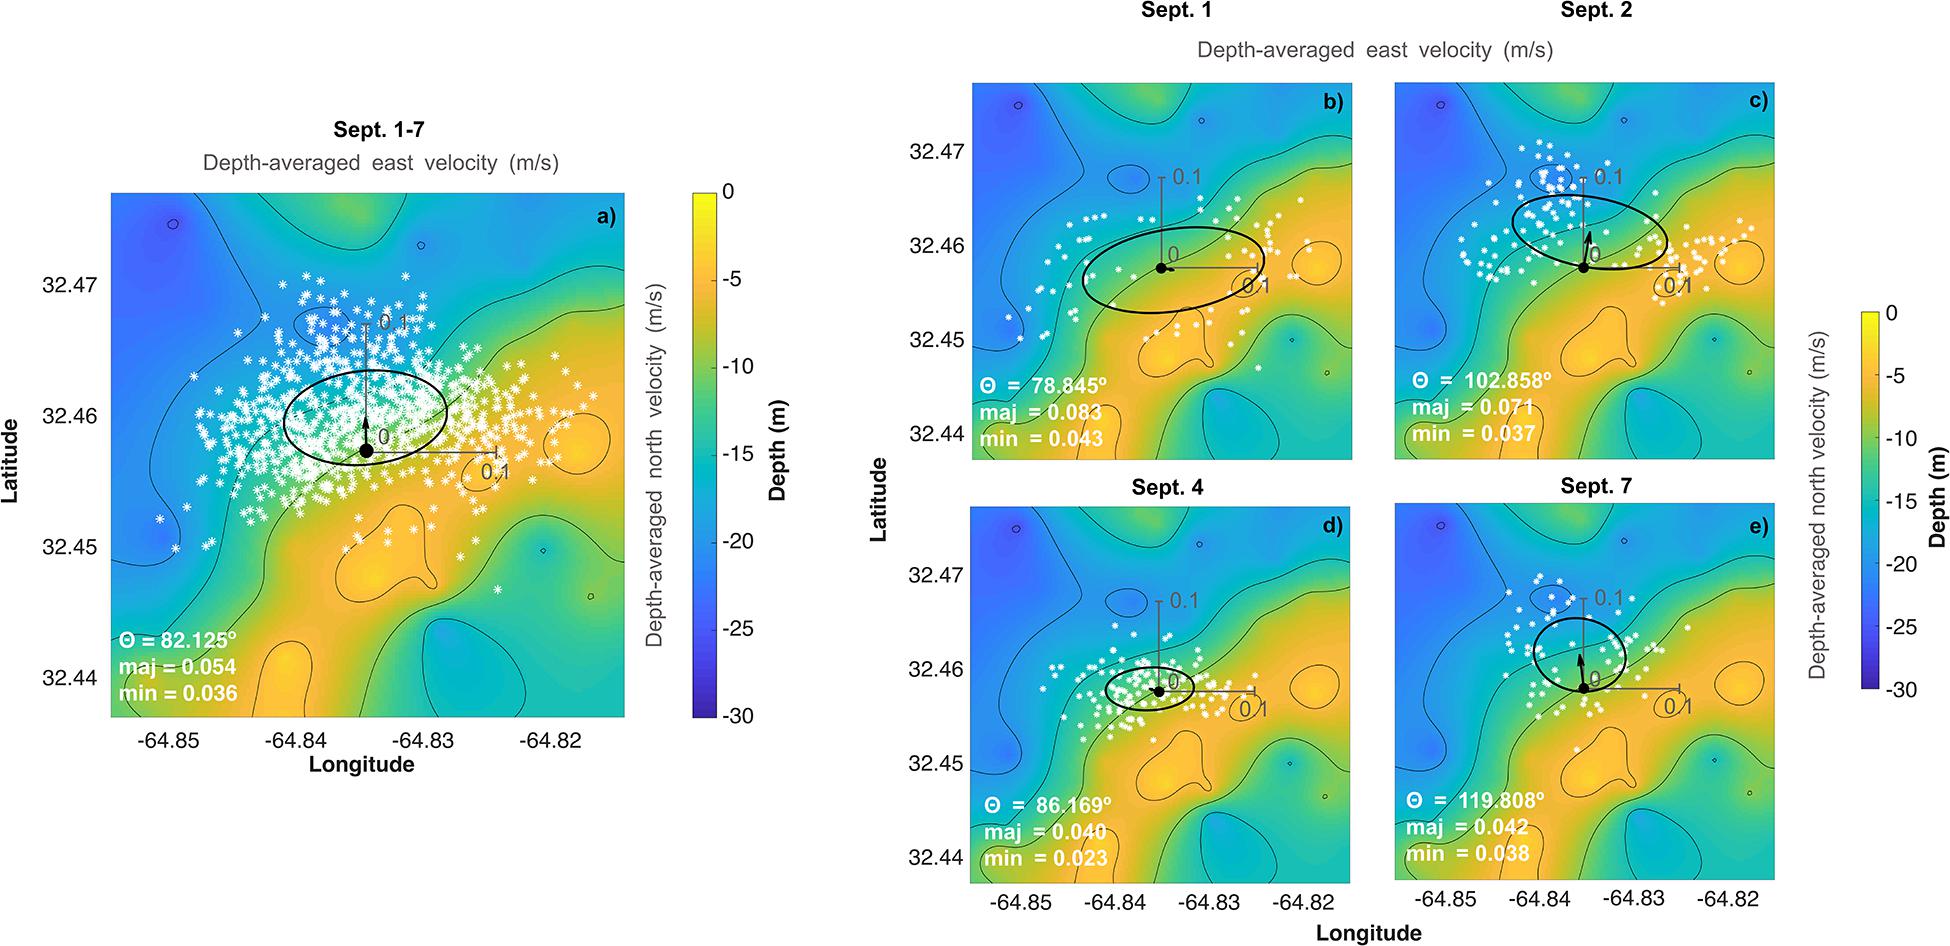
Figure 2. Depth-averaged current velocity (a) over the entire deployment (September 1–7) and for individual days corresponding to dates of the water chemistry spatial surveys (b) September 1, (c) September 2, (d) September 4, and (e) September 7 overlaid on the bathymetry of the deployment site. White stars correspond to individual velocity measurements over that time period and the arrow beginning at the black dot corresponds to the mean velocity vector. The ellipse represents the variability (1 SD) of the velocity on that day (i.e., the velocity variability (1 SD) traces out an ellipse starting at the black dot pointing toward the ellipse—for example, over the full deployment period, the mean flow is approximately off-reef to the north but varies strongly in the east/west direction, with minimal variability southwards). The origin for the velocity plots (individual measurements, ellipse, and mean velocity vector) is at the mooring represented by the black circle on each plot and x and y-axis scales of 0.1 m/s are included in light gray.
Autonomous Sensors
In order to capture high frequency variability and diel cycles on the reef, a suite of autonomous sensors was deployed at Hog Reef (Figure 1d and Table 1). To characterize water flow, an Aquadopp acoustic doppler current profiler (ADCP, 1 MHz; Nortek) was deployed at the bottom (∼7 m water depth) from September 1–7, 2017. The Aquadopp measured current speeds and directions in 0.5 m depth bins from 0.4 m above the profiler to 5.4 m above the profiler. However, due to interference in the first two cells by nearby biota and reef structures, only cells from 1.4 to 5.4 m above the profiler were analyzed. Averages of 1 Hz data over 1 min were stored at 10 min intervals.
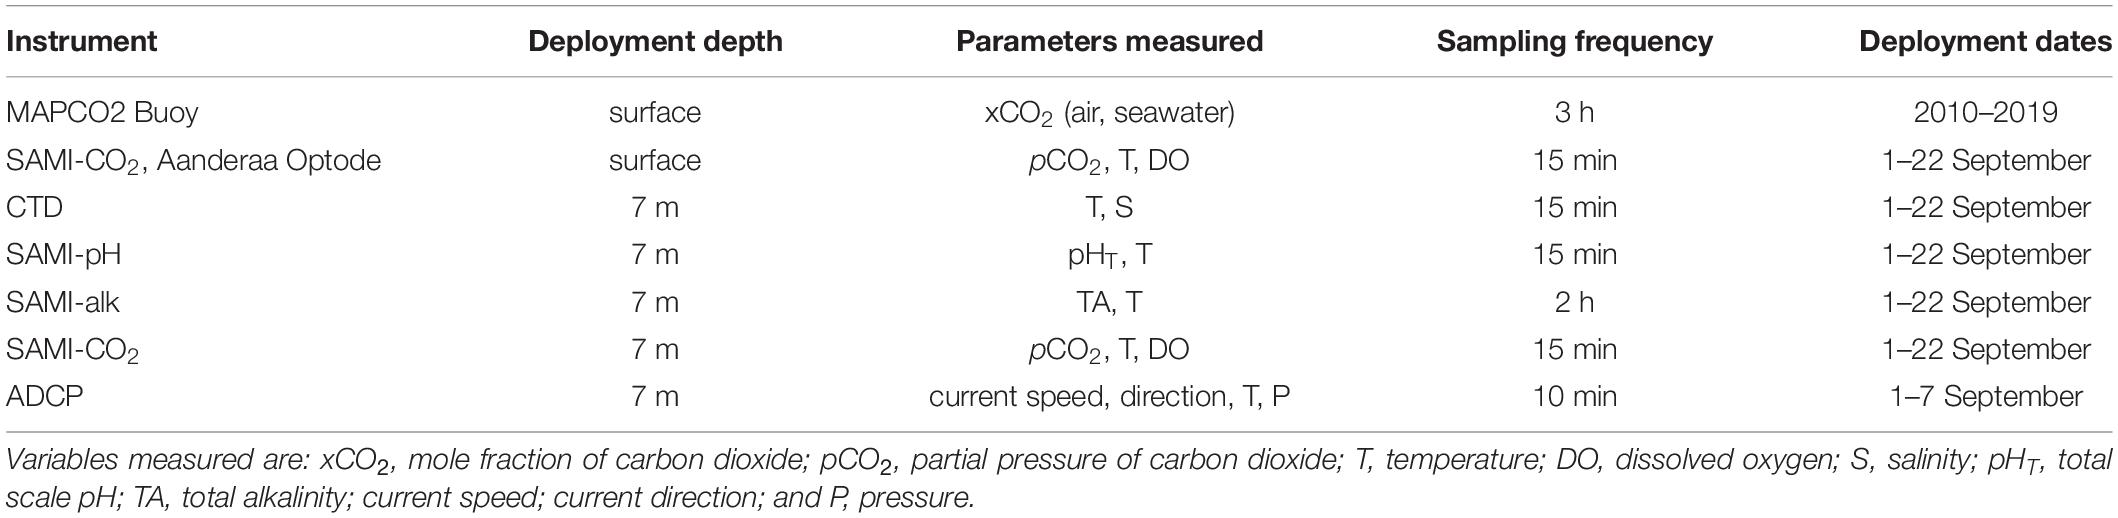
Table 1. Summary of instrument deployment configuration at Hog Reef.
Seawater pHT (defined on the total H+ scale), pCO2, and TA were measured with a suite of instruments from Sunburst Sensors between September 1–22, 2017, including a Submersible Autonomous Moored Instrument for pH (SAMI-pH), two SAMI-CO2 that also recorded temperature and dissolved O2 with Aanderaa 4531 Oxygen Optodes, a CTD (Microcat, Sea-Bird Scientific), and the recently developed SAMI for Alkalinity (SAMI-alk), which is one of the first in situ instruments for autonomous measurements of total alkalinity (Spaulding et al., 2014). SAMI-pH accuracy and precision are ± 0.005 and ± 0.001, respectively, based on repeat analyses of tris buffer. SAMI-CO2 accuracy and precision are ± 5 and ± 1 μatm, respectively, based on comparisons with an infrared CO2 analyzer. The Aanderaa Oxygen Optode accuracy is reported as < 1 μM. Accuracy for the CTD temperature and conductivity is ± 0.002°C and ± 0.0003 S m–1, respectively. Spaulding et al. (2014) found an accuracy and precision for SAMI-alk of −2 ± 13 μmol kg–1 based on comparison with discrete samples collected during a deployment. All instruments collected measurements every 15 minutes, except the SAMI-alk which collected measurements every 2 h (with one measurement omitted per day due to in situ calibrations at varying times, i.e., 11 measurements per day). Initial offsets of sensor data were corrected based on water samples collected at the time of deployment and no other offsets were applied. Initial SAMI-CO2 calibrations are referenced to an infrared method calibrated with NOAA certified gases. See Table 1 for a summary of the deployment specifics.
In addition to the Sunburst Sensors instruments, time series data for air and seawater pCO2 were obtained from a NOAA PMEL MAPCO2 buoy moored on Hog Reef (32.457°N, 64.835°W). The MAPCO2 buoy measures the mole fraction of CO2 (xCO2) in seawater and air equilibrated with seawater every 3 h using a LI-COR LI-820 CO2 infrared gas analyzer calibrated with a reference gas that meets World Meteorological Organization standards (Sutton et al., 2014, 2019). Accuracy and precision of these xCO2 measurements are estimated to be < ± 2 and < ± 0.7 μmol mol–1, respectively (Sutton et al., 2014). The buoy is also equipped with a Sensirion SHT71 sensor to measure relative humidity and temperature (Sutton et al., 2014). Sea surface temperature and salinity were also continuously recorded by a Sea-Bird Electronics 16 plus V2, with accuracies of ± 0.005°C and ± 0.0005 S/m for temperature and conductivity, respectively. Air and seawater pCO2 were calculated from these parameters using equations from Zeebe and Wolf-Gladrow (2001), with uncertainty estimated to be < 2.0 μatm (Sutton et al., 2014).
Spatial Surveys of Carbonate Chemistry
Autonomous moored sensor measurements were coupled with discrete water samples collected at 13 stations covering an area of ∼3 km2 on Hog Reef (Figure 1). A total of 4 spatial surveys were completed via boat, each over a span of ∼2 h, with afternoon surveys (∼13:00–15:00) on September 1 and September 4 and morning surveys (∼10:00–12:00) on September 4 and September 7. Spatial surveys consisted of three overlapping transects, with the PMEL MAPCO2 buoy as a common center point, and spanned the width of the rim reef (Figures 1b,c). Using a 5 liter Niskin bottle, water samples were collected at the surface (0.5–1.0 m) and bottom (4–20 m depending on the station’s local water depth) at all stations, with one intermediate sample collected at the deepest stations (Figure 1d). In situ temperature and salinity were measured with a YSI 556 Handheld Multiparameter Instrument (accuracy: temperature ± 0.15°C, salinity ± 1%). Water samples for DIC and TA (N = 114) were collected according to best practices in 250 ml Pyrex glass sample bottles and immediately fixed with 100 μl of a saturated HgCl2 solution (Dickson et al., 2007).
DIC was analyzed using an Automated Infra-Red Inorganic Carbon Analyzer (AIRICA, Marianda) with a Li-COR 7000 as detector. TA was analyzed via open-cell potentiometric acid titration system developed by the Dickson Lab at Scripps Institution of Oceanography (Dickson et al., 2007). Some samples (n = 29) were reanalyzed using a small volume, open-cell Metrohm Titrando automatic titrator system to validate results due to occasional occurrences of non-ideal titration curves. Accuracy (± precision) of TA and DIC measurements were calculated as the mean offsets (± SD) from Certified Reference Materials (CRM) provided by the Dickson Lab and were 1.3 ± 3.5 μmol kg–1 (n = 57) for DIC, −0.46 ± 1.5 μmol kg–1 (n = 24) for the Dickson TA system, and 1.76 ± 3.0 μmol kg–1 (n = 21) for the Metrohm TA system. CO2SYS for Excel (Lewis and Wallace, 1998) and MATLAB (van Heuven et al., 2011), were used to calculate additional carbonate chemistry parameters using the first and second dissociation constants of carbonic acid (K1 and K2) from Mehrbach et al. (1973) refit by Dickson and Millero (1987), the dissociation constants of bisulfate (KHSO4) from Dickson (1990) and total boron by Uppström (1974), and total scale pH (pHT).
Data Analysis and Calculations
Current Data
Current profiler data was collected in earth coordinates and corrected for the magnetic declination of the earth at the deployment site to account for differences between magnetic and true north. The magnetic declination at Hog Reef (32.457°N 64.835°W) on 1 September 2017 was 14.74°W ± 0.33° of true north2. All data are reported in compass coordinates where 0° is north and 90° is east. A principal component analysis was then performed on the corrected, depth-averaged u (east) and v (north) current velocities for both the entire duration of the deployment, as well as for individual days using the princax function in MATLAB (developed by Rich Signell, United States Geological Survey). The angle of maximum variance (θ) and the major and minor axes of a principal ellipse were computed to identify the angle containing the most variance. Mean depth-averaged flow velocity was also calculated and denoted on plots with a quiver arrow emanating from the instrument deployment location, with angle and length denoting current direction and speed, respectively.
Variability and Frequency Analyses
Variability for each parameter recorded by the autonomous sensors was calculated as the mean daily range (maximum—minimum) (from 00:00 h to 23:45 h, or as close to these times as sampling frequency would allow) ± one standard deviation. Variability in measured parameters from the spatial surveys was calculated as the mean range of a parameter ± 1 standard deviation on one sampling date over the surface or bottom (for lateral variability) across all sampling dates. Vertical variability was calculated as the mean of the absolute differences in a parameter between surface and bottom across the survey area for one sampling date ± 1 standard deviation, across all sampling dates.
Frequency analyses were performed on all parameters measured by the autonomous sensors in order to determine the dominant frequencies of variability using the plomb function in MATLAB to create Lomb-Scargle periodograms (Figure 3; raw data are shown in Supplementary Figure 1). A high-pass filter (highpass; pass band frequency of 1 day–1) was used to remove additional low frequency signals and distill the diel frequency signal in temperature at surface and bottom. A Savitzky-Golay filter (sgolayfilt; order 3 and frame length 7) and then a high-pass filter (highpass; pass band frequency of 1 day–1) was used to distill the frequency signals in total alkalinity at 7 m as well as calculated relative NCC (rNCC–TA). These filtered total alkalinity, rNCC–TA, and temperature data were only used to create the Lomb-Scargle periodograms (Figure 3, right column) which are plotted next to the raw, unfiltered time series data (Figure 3, main column; for a comparison, see Supplementary Figures 4–6).
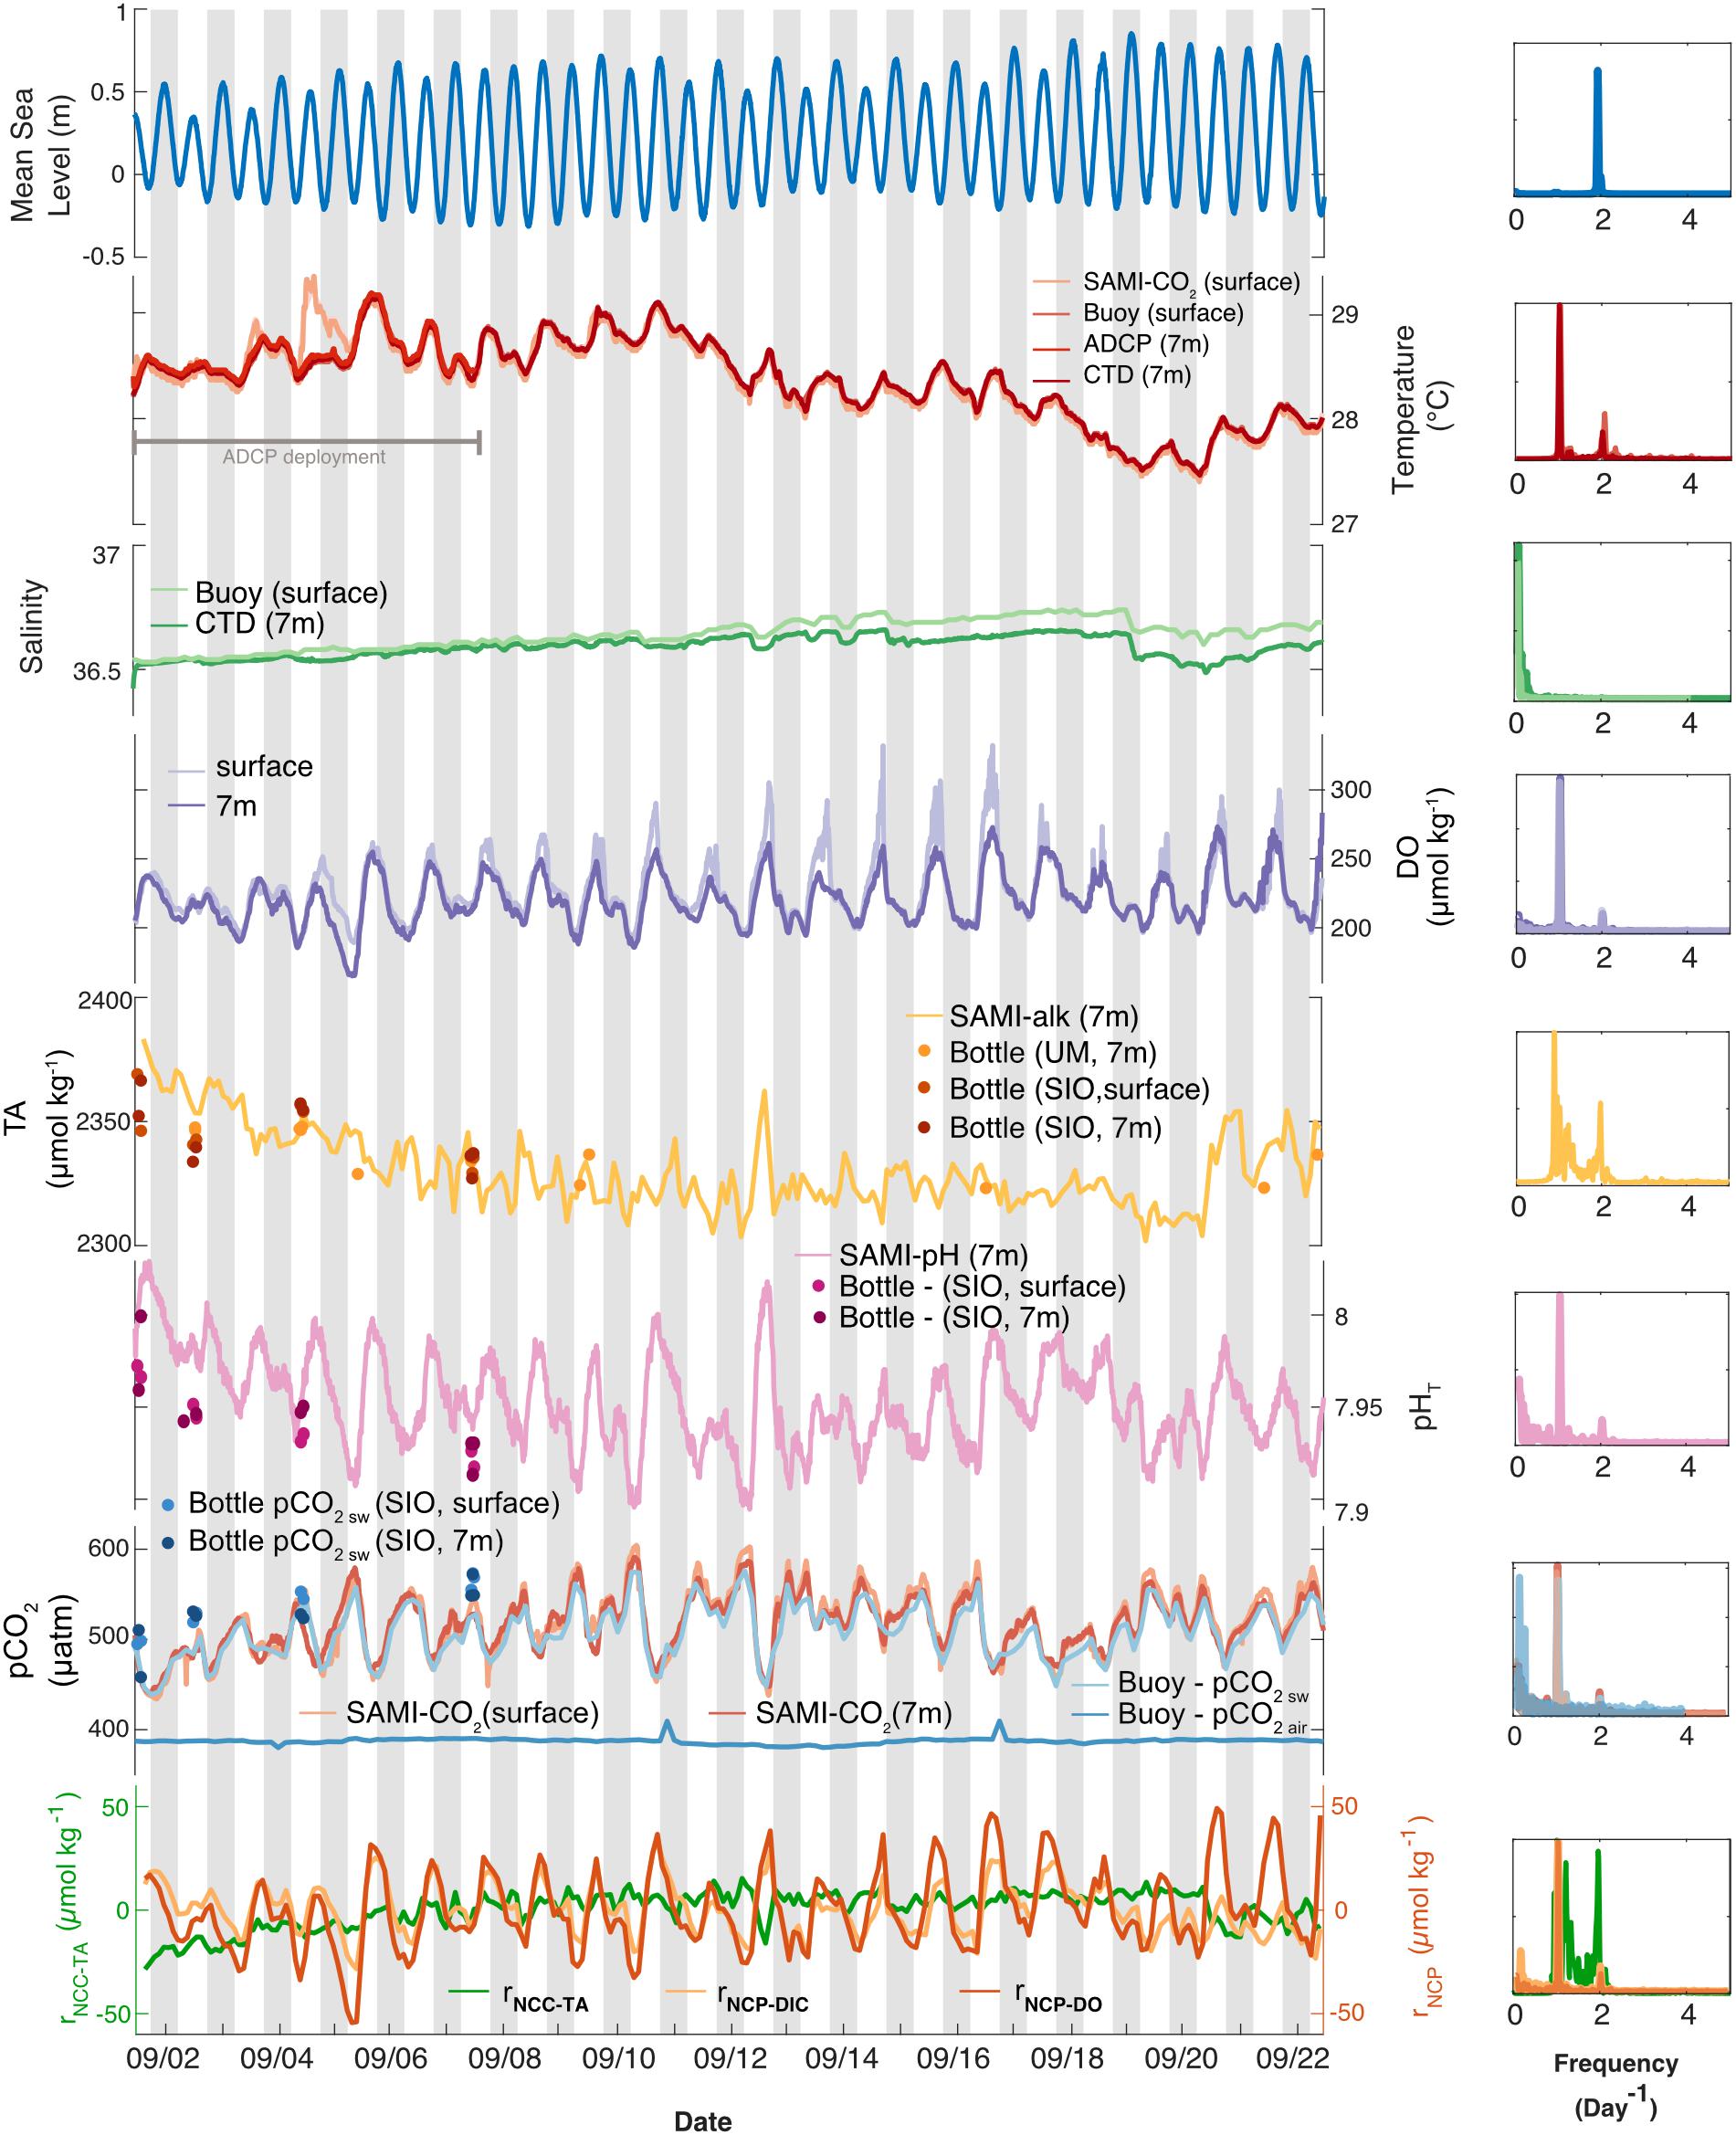
Figure 3. (Left) Temporal variability in environmental conditions and seawater chemistry on Hog Reef for September 2017 at surface (lighter colors) and bottom (darker colors). Temperature, salinity, dissolved oxygen, TA, pHT, and pCO2 were measured with autonomous moored sensors. Measurements of bottom temperature (at 7 m depth) from multiple sensors were essentially indistinguishable, thus only one was plotted. Measured TA and calculated pHT and pCO2 from discrete TA and DIC seawater samples were plotted as circles (“SIO” samples were analyzed in the Andersson Lab at Scripps Institution of Oceanography and “UM” samples were analyzed in the DeGrandpre Lab at the University of Montana Missoula). Mean sea level data were accessed from the NOAA Tides and Currents Database (St. George’s Island). Relative NCC and NCP (rNCC–TA, rNCP–DO, and rNCP–DIC) were estimated from sensor-derived water chemistry data using a mean anomaly (as described in the text). Gray bars indicate nighttime hours. (Right) Lomb-Scargle periodograms of autonomous moored sensor parameters as well as calculated rNCC–TA, rNCP–DO, and rNCP–DIC.
Biogeochemical Drivers of Variability
Instrument time series data were used to approximate the relative contribution from biogeochemical processes to the observed variability in DIC and TA at Hog Reef. A time series of DIC at 7 m was calculated from the time series of TA (from the SAMI-alk at 7 m) and pCO2 (from the SAMI-CO2 at 7 m) (Supplementary Figure 3), interpolated to a frequency of every 2 h from 1 September 2017 at 15:00 to 22 September 2017 at 11:00 in order to match the lower sampling frequency of the SAMI-alk. Note that DIC calculated from pHT and TA also gave similar DIC values. TA, DIC, and DO were normalized (nTA, nDIC, nDO) to mean salinity from the interpolated time series (36.59 PSU).
For a well-mixed reef habitat, NCC is routinely calculated based on Eulerian measurements of TA according to (e.g., Silverman et al., 2007; Langdon et al., 2010; Koweek et al., 2015a):
where ΔnTA refers to the difference between nTA on the reef and offshore, τ is the mean residence time, ρ is the seawater density, and h is the mean height of the water column. Furthermore, NCP can be calculated based on measurements of DIC and TA or DO with corrections for gas exchange:
where ΔnDIC and ΔnDO refer to the differences between the reef and offshore, and FCO2,gas and FO2,gas represent sea-air CO2 and O2 gas exchange, respectively. Relative to biogeochemical processes on coral reefs with relatively short residence times (hours to days), sea-air CO2 gas exchange is often small and therefore assumed to be negligible while O2 flux is more strongly affected (e.g., Yeakel et al., 2015).
Here, we used two different approaches to assess the biogeochemical processes underlying the observed chemical condition and variability at Hog Reef. In one approach, NCC and NCP were calculated according to Eqs 1 and 2 relative to the offshore values of TA and DIC measured at the Bermuda Atlantic Time-series Station (BATS), adopting the best estimates of the mean depth (10.3 ± 3.3 m) and residence time at Hog Reef (2.5 ± 0.4 days; Venti et al., 2012). However, because neither τ nor h were directly measured in this study and even small errors in these parameters can generate large errors in NCC and NCP (Courtney and Andersson, 2019), these calculations are admittedly uncertain. A Monte Carlo analysis was used to propagate the potential errors of τ and h through iterative calculations of NCC and NCP using randomly generated numbers (n = 10,000) within the range of uncertainties for each parameter. The resulting mean and range were used as approximations of the mean ± uncertainty in NCC and NCP. Furthermore, it is important to recognize that these estimates of NCC and NCP based on inshore-offshore chemical gradients represent integrated metabolic signals over multiple tidal cycles and habitats beyond the Hog Reef study site because currents here are not unidirectional and seawater is moving back and forth across this site multiple times before escaping (Venti et al., 2012; Takeshita et al., 2018).
In a second approach, the local biogeochemical variability was assessed based on relative changes in NCC and NCP, rather than actual rates. In the absence of detailed τ or h measurements, the relative contributions of NCC and NCP can be assessed by their ratio, termed ROI by Suzuki (1998), which represents the ratio of organic to inorganic carbon production (Suzuki, 1998; Suzuki and Kawahata, 2003):
or
However, in the present case, to highlight the diel variability and the relative magnitude of the numerator and denominator of Eqs 4 and 5 at Hog Reef, the temporal variabilities of these terms were assessed independently relative to the local mean over the sampling period rather than the offshore conditions. We refer to these terms as rNCC–TA, rNCP–DIC, and rNCP–DO:
It is important to note that rNCC–TA, rNCP–DIC, and rNCP–DO are not metabolic rates, nor do they reflect the net trophic or calcification status of the water at Hog Reef. Instead these terms simply highlight the approximate relative magnitude of variability in TA and DIC attributed to NCC and NCP at Hog Reef and its surrounding habitats on diel timescales. The spatial representation of these terms roughly corresponds to the hypothetical reef area covered by a parcel of seawater over one tidal cycle. This has previously been referred to as the “effective reef footprint” which translates to the spatial and temporal extent of the benthic communities’ influence on the overlying seawater chemistry (Courtney et al., 2016). The temporal variability in rNCC–TA, rNCP-DIC, and rNCP–DO was calculated as the mean daily range (from 00:00 h to 00:00 h, or as close to these times as sampling frequency would allow) ± 1 standard deviation.
Results
Fine Scale Temporal and Vertical Variability
Vertical profiles of current speeds and directions as well as pressure recorded at Hog Reef clearly showed the mixed semidiurnal tidal cycle, with a mean current speed of 0.08 ± 0.04 m s–1 (Supplementary Figure 2). Tide station data revealed a mean tidal range of 0.90 ± 0.11 m during the deployment (Figure 3, also measured by the ADCP, Supplementary Figure 2). From the principal component analysis of the depth-averaged velocities for the full deployment period (1–7 September), the angle of maximum variance (θ) was 82° with a flow speed of 0.054 m s–1 compared to 0.036 m s–1 for the orthogonal (352°) component. The direction of the mean quiver pointed approximately north at 0.025 m s–1. Consequently, water flowed predominantly offshore at Hog Reef (Figure 2a), with significant variance in the east/west (approximately along-reef) direction resulting in an elliptical benthic footprint with a semi-major axis of 1.2 km and semi-minor axis of 0.8 km based on the hypothetical distance traveled by a parcel of water over 6 hours. Additional principal component analyses of the depth-averaged velocities for individual days corresponding to our spatial survey sampling dates revealed that θ varied between these days, changing from 79° on September 1 (Figure 2b), 103° on September 2 (Figure 2c), 86° on September 4 (Figure 2d), and 120° on September 7 (Figure 2e). The direction of the mean quiver for each day revealed that mean flow varied from along-reef and slightly inshore on September 1 (Figure 2b), to off-reef to the northeast on September 2 (Figure 2c), to slightly off-reef to the northwest on September 4 (Figure 2d), and off-reef approximately north on September 7 (Figure 2e) with differing degrees of variance.
High frequency measurements by autonomous sensors at Hog Reef showed distinct diel variability in temperature, DO, pHT, and pCO2, but less so with respect to TA, which was confirmed by a frequency analysis of all data (Figure 3, right column). A secondary local maximum and minimum of some of these parameters were also apparent on most days (Figure 3), with secondary peaks in the power spectra at ∼2 day–1, reflecting the influence from the mixed semi-diurnal tide (Figure 3). This was particularly prominent for the TA data. Surface and bottom (7 m) temperatures generally agreed, with the exception of September 3–4 with a maximum vertical difference of 0.84°C (Figure 3). Mean temperature (± 1 SD) during the deployment was 28.38 ± 0.40°C at the surface and 28.36 ± 0.38°C at the bottom. The mean diel temperature range (± 1 SD) in surface and bottom waters over the month-long deployment was 0.38 ± 0.15 and 0.40 ± 0.11°C, respectively (Figure 3). Salinity remained relatively constant throughout the deployment with a mean (± 1 SD) of 36.64 ± 0.06 PSU at the surface and 36.59 ± 0.04 PSU at the bottom. We note that there was drift between the salinity measurements at the surface and 7 m beginning midway through the deployment resulting in higher mean salinity at the surface compared to the bottom. Calculations of density at the surface and bottom produced an unstable water column during the latter half of the deployment, with a mean density (± 1 SD) over the deployment of 1023.6 ± 0.2 kg m–3 at the surface and 1023.5 ± 0.1 kg m–3 at the bottom, suggesting that the drift was a sensor error and not a real signal. Given a lack of post-deployment cross-calibration between instruments, we cannot confirm which sensor experienced the drift, though the drift may be an artifact of potential biofouling due to the absence of a pump for the CTD deployed at the bottom.
DO concentrations at the surface during peak production hours were higher than at the bottom, though the mean (± 1 SD) concentrations at surface and bottom over the deployment were similar (226 ± 22 and 220 ± 18 μmol kg–1, respectively). The mean diel range (± 1 SD) in DO, however, appeared qualitatively different at the surface (78 ± 29 μmol kg–1) and bottom (54 ± 16 μmol kg–1) (Figure 3). Furthermore, mean TA and pHT (± 1 SD) at the bottom were 2331 ± 16 μmol kg–1 and 7.953 ± 0.025, with mean diel ranges (± 1 SD) of 26 ± 13 μmol kg–1 and 0.07 ± 0.02, respectively (Figure 3; no autonomous measurements were made at the surface of these parameters, Table 1). Changes in pHT positively tracked changes in DO (Spearman’s rank correlation coefficient, ρ = 0.61, p < 0.001) which also mirrored changes in pCO2 over the deployment (pHT and pCO2: ρ = −0.99, p < 0.001; pCO2, and DO: ρ = −0.66, p < 0.001). Mean seawater pCO2 (± 1 SD) measured by the SAMI-CO2 instruments was 518 ± 35 μatm at the surface and 516 ± 30 μatm at the bottom, with mean diel ranges (± 1 SD) of 70 ± 25 and 76 ± 28 μatm, respectively (Figure 3), the differences of which are within the instruments’ accuracy. Mean buoy seawater pCO2 measured at the surface, however, was slightly lower (508 ± 30 μatm; mean ± 1 SD) than that measured by the SAMI-CO2 at the surface, with the difference between these values outside of the buoy instrument’s accuracy. However, buoy pCO2 had a similar mean diel range (± 1 SD) of 70 ± 25 μatm compared to the SAMI-CO2 instruments. Buoy pCO2 measured in air was relatively constant (387 ± 3 μatm; mean ± 1 SD) with a small diel signal (5 ± 6 μatm; mean range ± 1 SD), which however, was disproportionally influenced by two anomalous measurements on September 11 and 16th which were outside the range of expected accuracy and precision.
Overall, parameters that were measured (TA) or calculated (pHT and pCO2) from discrete bottle samples collected at the instrument site during spatial surveys showed good agreement with instrument data for the majority of samples, though there were disagreements on a few occasions (Figure 3). The degraded precision compared to the fundamental replicate reproducibility is likely due to spatial and temporal mismatches between the sensors and discrete sampling. Bottle samples were collected as close to the sensors as physically possible from a boat, but small differences in sampling depth as well as water movement and/or potential boundary layers around the instruments may have led to these observed disagreements. In addition, there is also some error introduced to measurements of pCO2 and pHT calculated from DIC and TA that may contribute in part to these differences (Millero, 2007).
Lateral Spatiotemporal Variability
Spatial surveys over Hog Reef revealed noticeable variability in most parameters across the 3 km2 survey area. Some lateral gradients appeared to follow inshore to offshore depth gradients, but the structure of these gradients varied between sampling dates and with changes in the direction of bulk water flow as measured by the current meter (Figures 4, 5). Mean surface temperature (± 1 SD) across the four surveys was 28.38 ± 0.15°C at the surface and 28.28 ± 0.14°C at the bottom whereas mean salinity (± 1 SD) was the same at both surface and bottom (36.6 ± 0.0 PSU) at the precision of the YSI. The mean ranges (± 1 SD) of these parameters were 0.41 ± 0.14°C and 0.1 ± 0.0 PSU across the surface, and 0.38 ± 0.12°C and 0.1 ± 0.0 PSU across the bottom across the four surveys, respectively (Figures 4, 5). Temperature was lower on the northwestern side of the survey area over the deeper reef drop off, and higher in the southeast above the shallow reef lagoon area (Figures 4, 5) as would be expected due to depth-dependent heating.
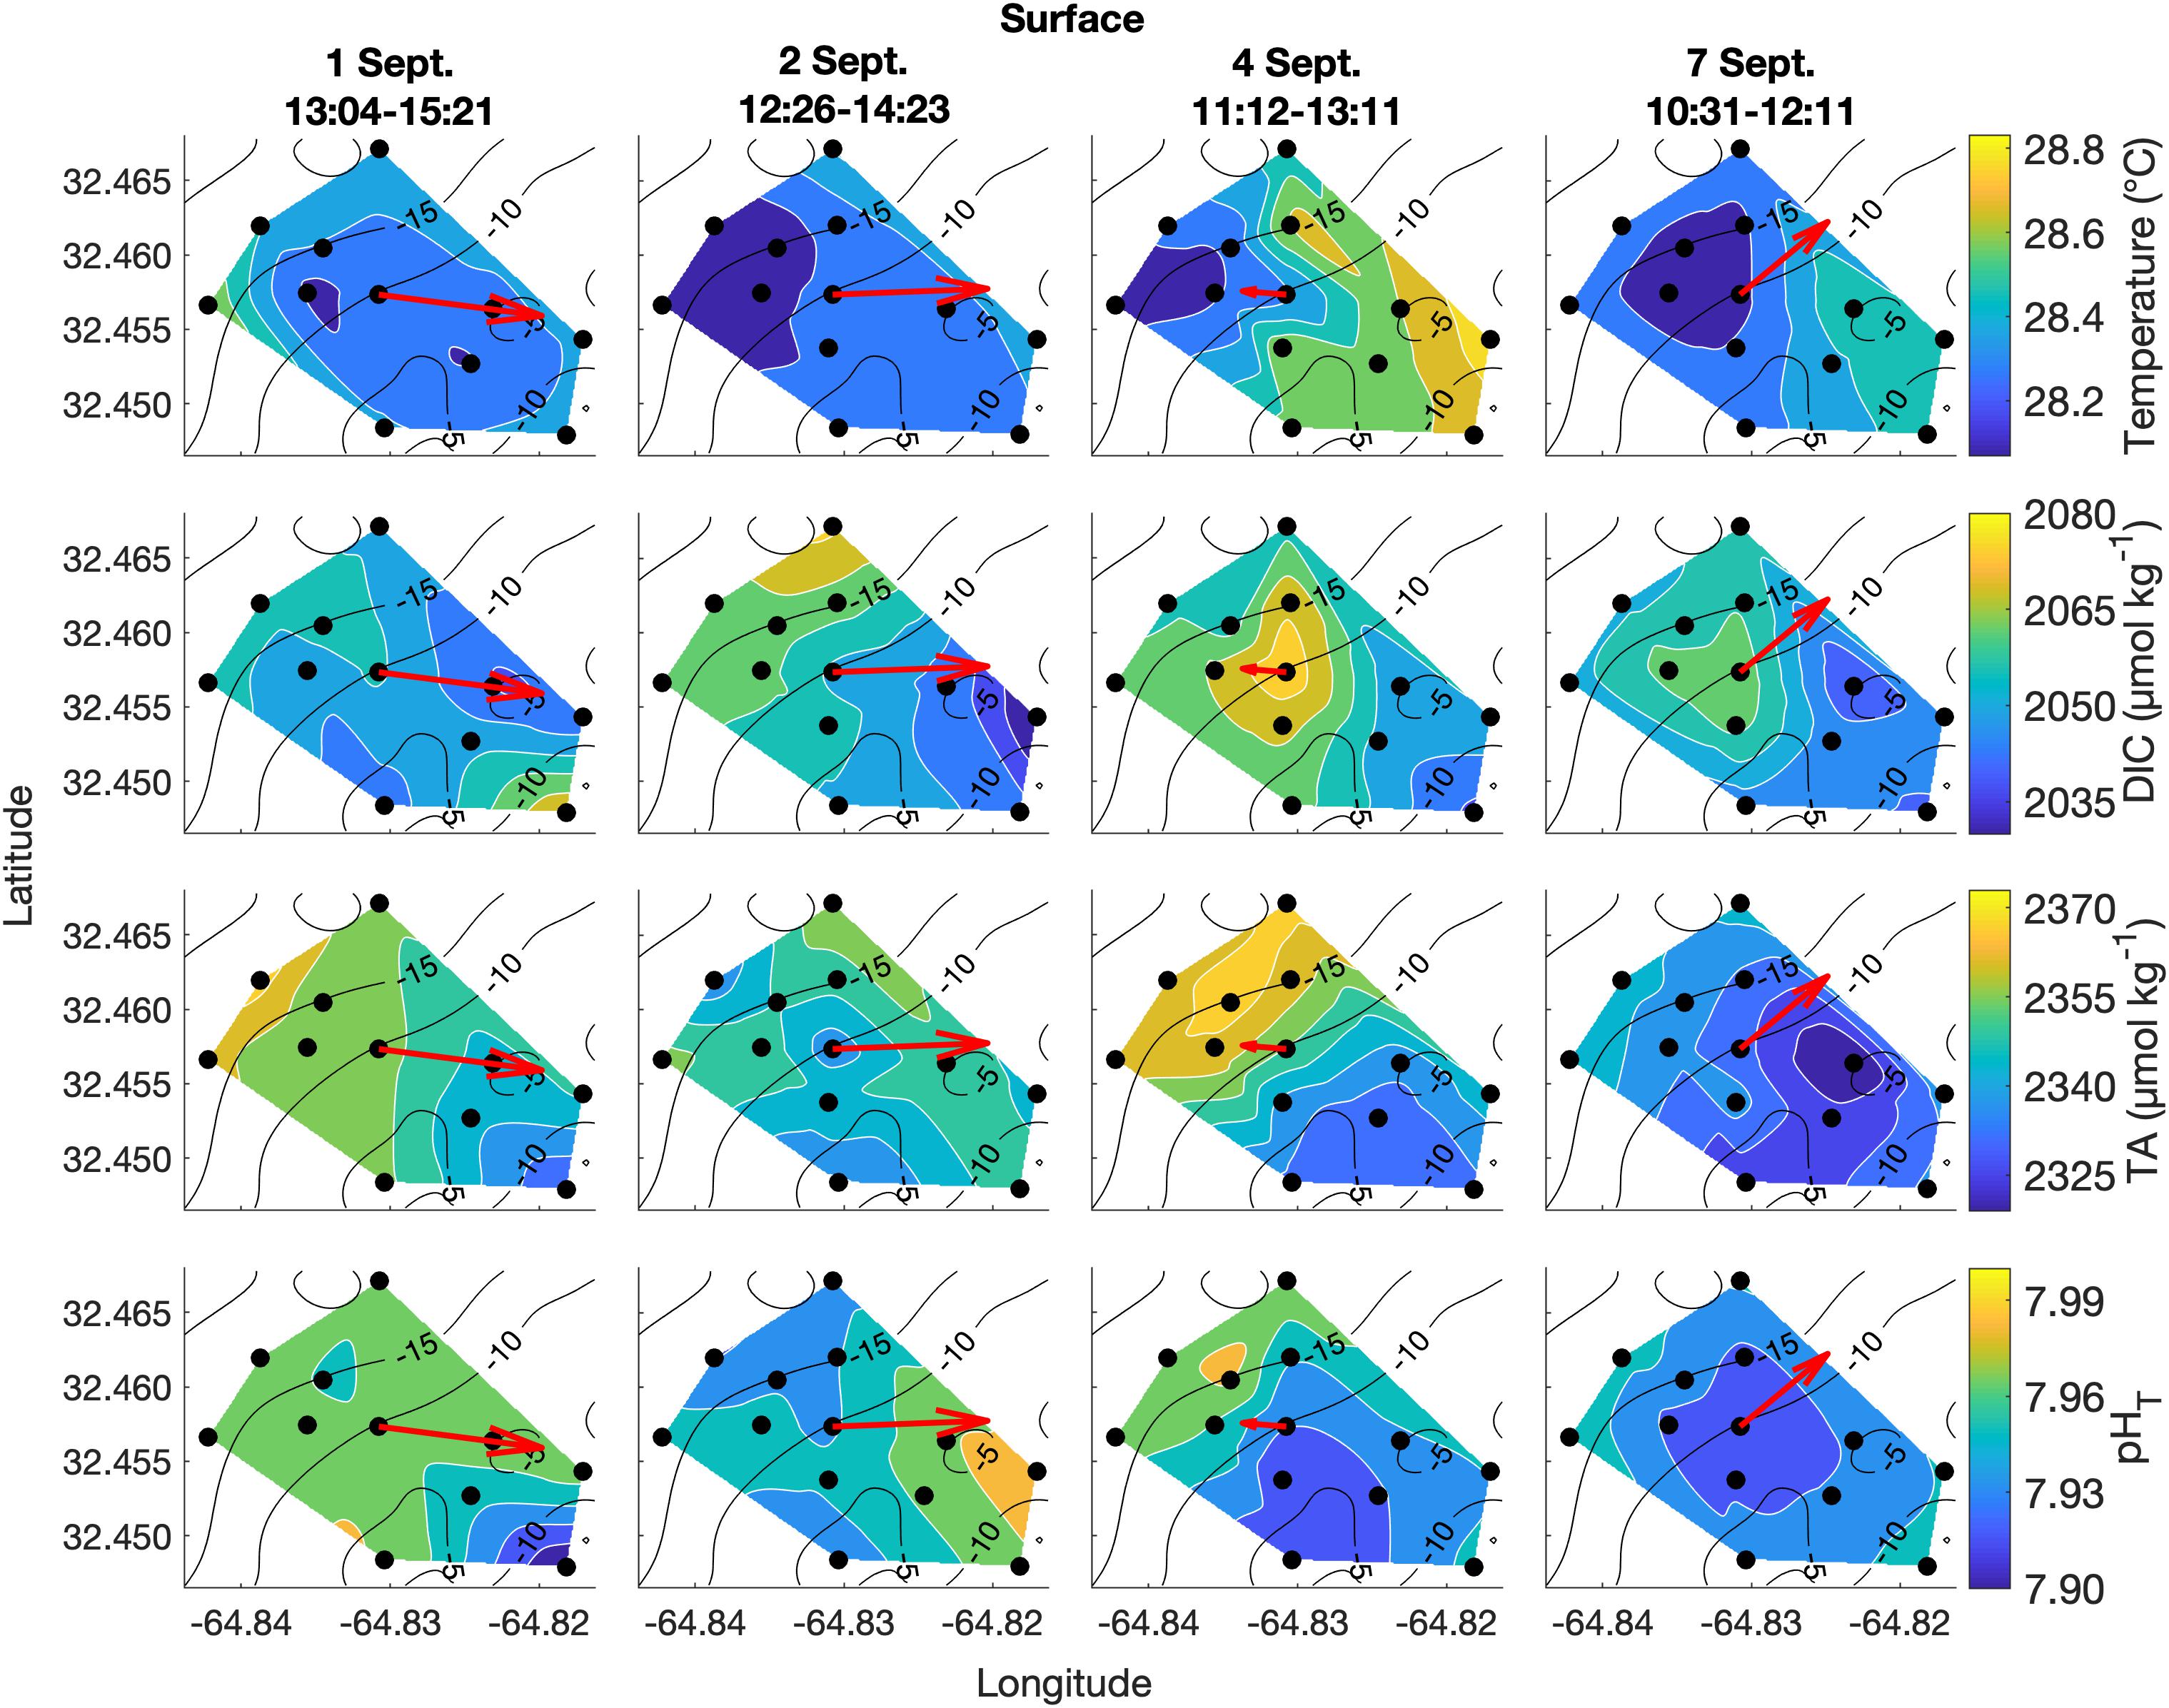
Figure 4. Lateral spatiotemporal variability at the surface in temperature, DIC, TA, and pHT (calculated from measured DIC and TA) on September 1, 2, 4, and 7. Plots also contain bathymetry contours (black) and the mean depth-averaged velocity vector averaged over the sampling period (red).
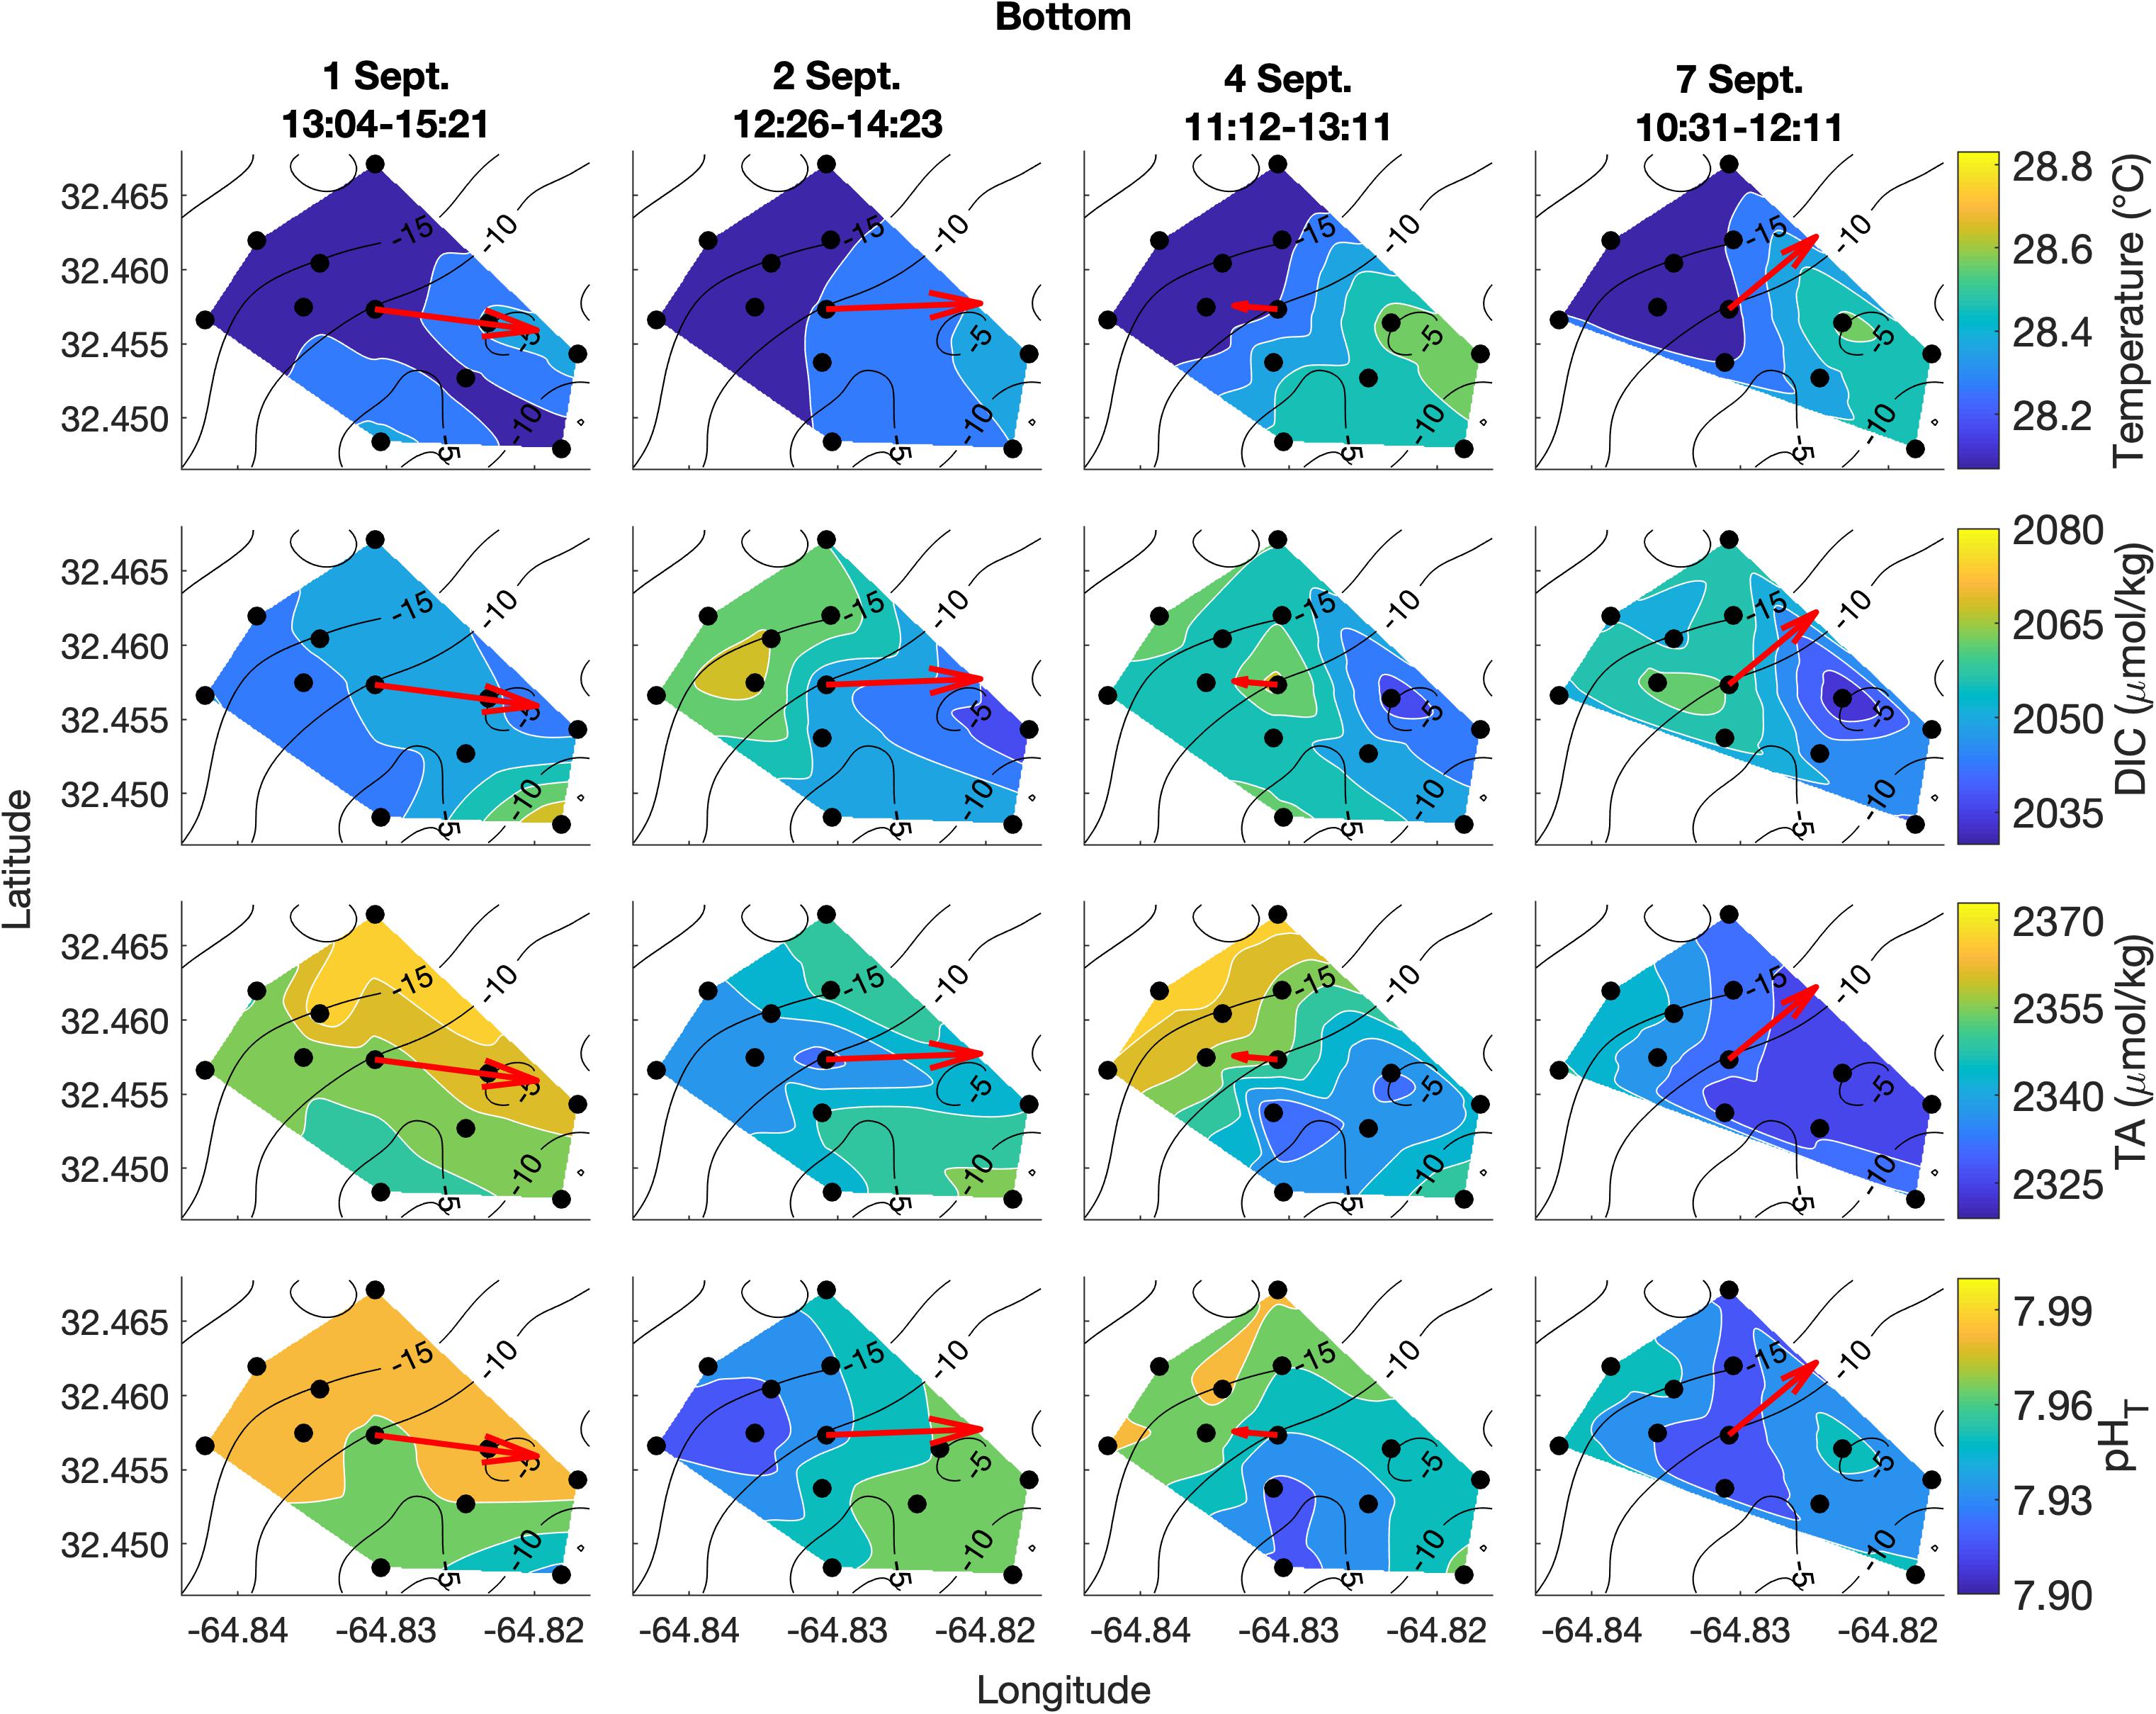
Figure 5. Lateral spatiotemporal variability at the bottom in temperature, DIC, TA, and pHT (calculated from measured DIC and TA) on September 1, 2, 4, and 7. Plots also contain bathymetry contours (black) and the mean depth-averaged velocity vector averaged over the sampling period (red).
DIC and TA were lower over the shallower, inshore areas of the reef, and higher over the deeper drop off (Figures 4, 5). Mean DIC (± 1 SD) at the surface and bottom was 2058 ± 9 and 2056 ± 8 μmol kg–1 with a lateral mean range (± 1 SD) of 32 ± 7 and 27 ± 1 μmol kg–1, respectively. Mean surface TA (± 1 SD) was 2347 ± 12 μmol kg–1 whereas mean bottom TA was 2349 ± 13 μmol kg–1 with a mean lateral range (± 1 SD) of 31 ± 7 and 27 ± 7 μmol kg–1, respectively (Figure 3). Seawater pHT calculated from measurements of DIC and TA was similar across the four surveys, with a mean surface value (± 1 SD) of 7.95 ± 0.02 and mean bottom value of 7.96 ± 0.02, but tended to be lower above the shallower reef areas (Figures 4, 5) compared to deeper areas. The lateral mean ranges (± 1 SD) in pHT were similar for surface (0.06 ± 0.01 pHT units) and bottom (0.06 ± 0.00 pHT units).
Vertical Spatiotemporal Variability
Vertical variability was small for all parameters of the spatial survey area and with no clear spatial trend (Figure 6). The mean temperature and salinity differences (± 1 SD) between surface and bottom were 0.11 ± 0.07°C and 0.0 ± 0.0 PSU, respectively, across the four surveys, which are less than the precision of the YSI 556 Handheld Multiparameter Instrument measurements themselves (Figure 6). Mean absolute differences (± 1 SD) in carbonate chemistry parameters between surface and bottom were 5 ± 2 μmol kg–1 for DIC, 6 ± 3 μmol kg–1 for TA, and 0.01 ± 0.01 for pHT across the four surveys (Figure 6) and were close to the precision of the respective measurements.
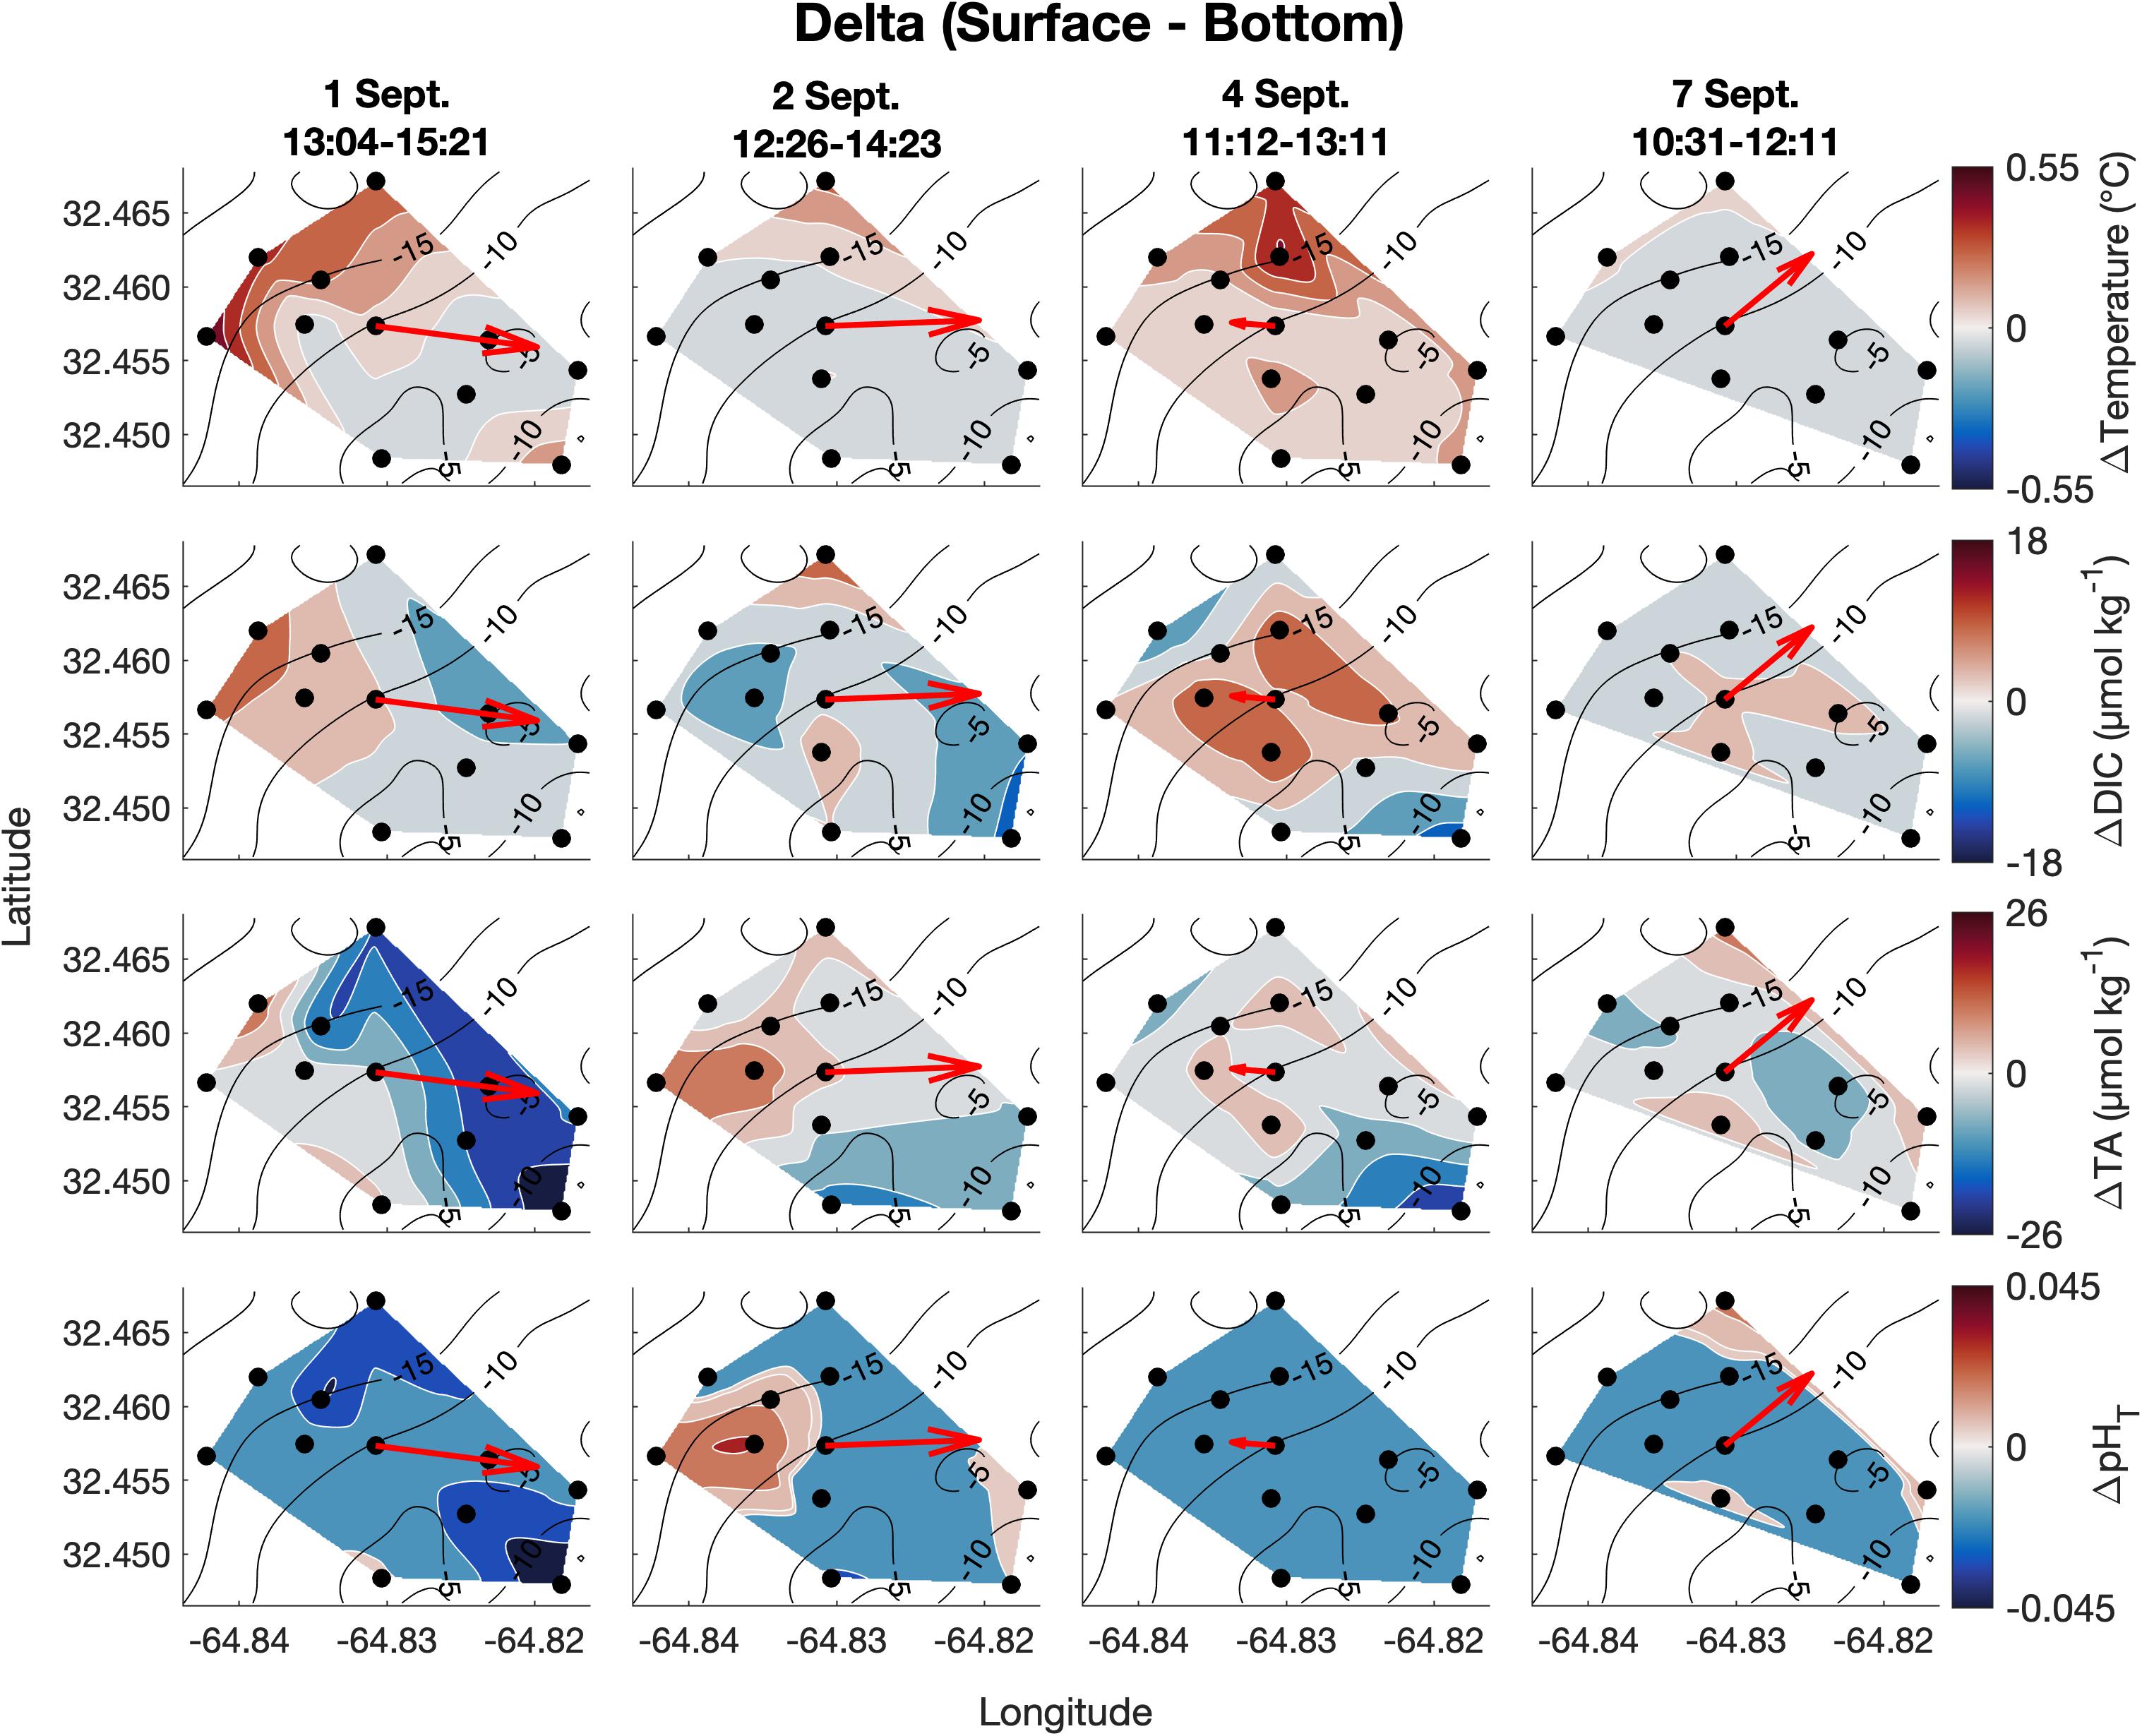
Figure 6. Vertical spatiotemporal variability of the difference between surface and bottom temperature, DIC, TA, and pHT (calculated from measured DIC and TA; bottom values subtracted from surface values) on September 1, 2, 4, and 7. Plots also contain bathymetry contours (black) and the mean depth-averaged velocity vector averaged over the sampling period.
Biogeochemical Drivers of Carbonate Chemistry Variability
On the local scale, rNCP–DIC, rNCP–DO, and rNCC–TA were calculated relative to a nDICmean of 2043 μmol kg–1, nDOmean of 220 μmol kg–1, and nTAmean of 2331 μmol kg–1. The variability of rNCP–DO and rNCP–DIC followed a diel cycle, with maximum values in the late afternoon and minimum values in the early morning (as confirmed by the frequency analysis; Figure 3). However, the mean diel range (± 1 SD) in rNCP–DO (51 ± 15 μmol kg–1) was larger than the mean diel range for rNCP–DIC (32 ± 11 μmol kg–1) (Figure 3). The diel variability in rNCP–DO and rNCP–DIC also corresponded to the diel cycle of pHT measured independently at Hog Reef, i.e., peaks in rNCP–DIC and rNCP–DO corresponded to peaks in pHT (Figure 3). Diel variability in rNCC–TA was smaller than both rNCP–DO and rNCP–DIC (13 ± 6 μmol kg–1; mean range ± 1 SD) and rNCC–TA did not show any strong correlation to either rNCP–DO or rNCP–DIC with a correlation coefficient (r) < 0.1 in both cases. The local diel variabilities in rNCP–DIC and rNCC–TA were also clearly evident in biogeochemical assessments based on inshore-offshore chemical gradients (Figures 7B,C). Offshore TA and DIC at the surface at BATS3 in September 2017 was 2396 and 2046 μmol kg–1, respectively, which combined with the mean depth and residence time of the Hog Reef area, revealed NCP of −118 ± 51 mmol m–2 day–1 (mean ± 1 SD) and NCC of 150 ± 37 mmol CaCO3 m–2 day–1. Consequently, these calculations indicate that the integrated metabolic signals encompassing multiple tidal cycles and potentially multiple habitats were net heterotrophic and net calcifying, with the diel variabilities characterized on Hog Reef superimposed on these larger scale net metabolic signals (Figure 7).
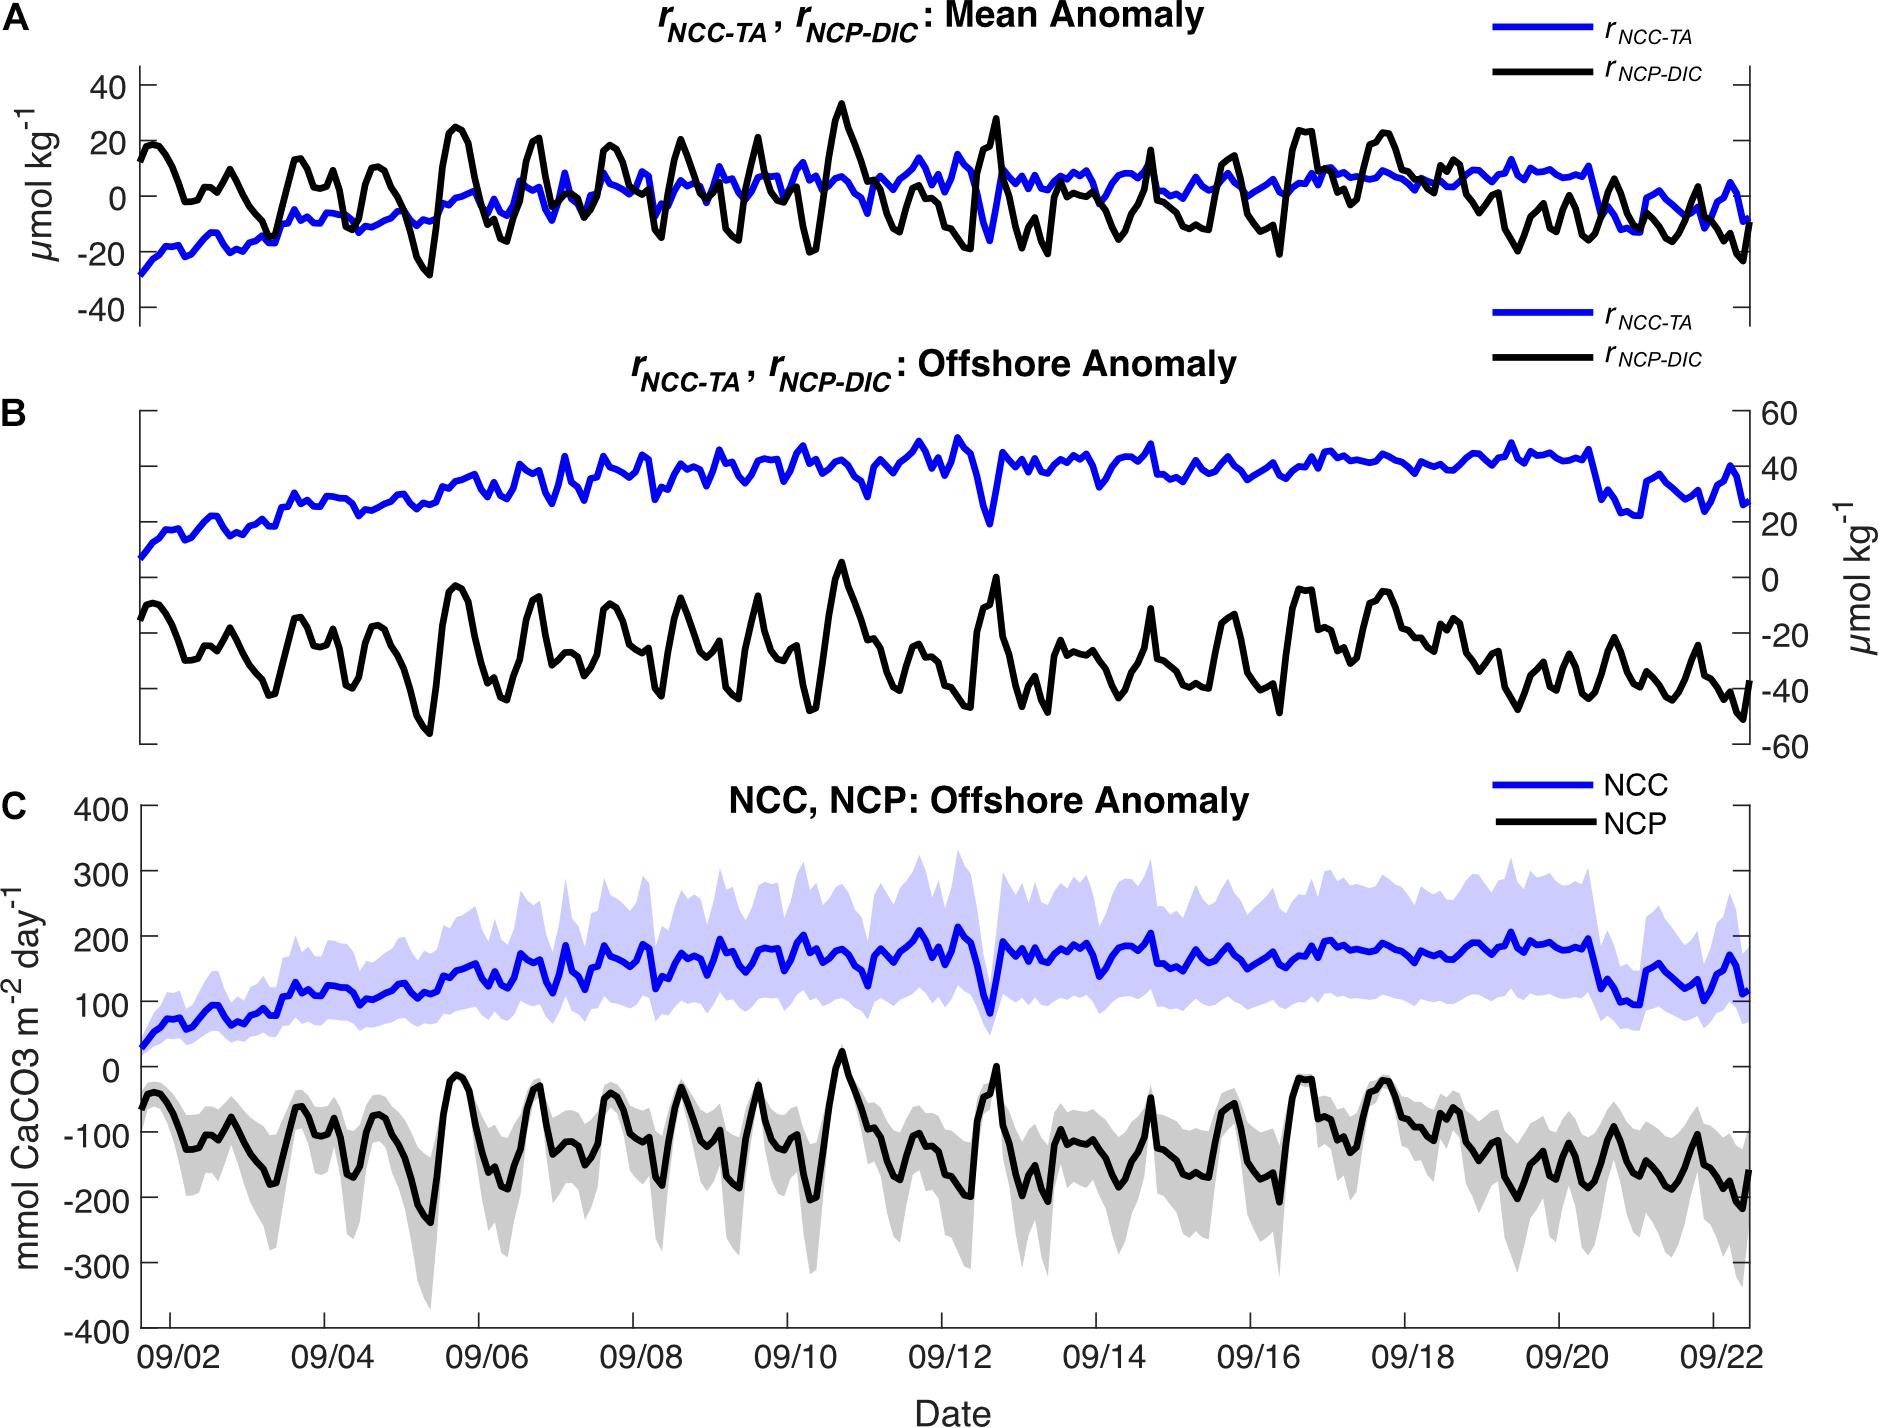
Figure 7. (A) rNCC–TA (blue) and rNCP–DIC (black) calculated relative to the local means; (B) rNCC–TA (blue) and rNCP–DIC (black) calculated relative to the offshore value at the BATS Station; (C) Rates of NCC (blue) and NCP (black) (mean ± shaded uncertainty) calculated relative to the offshore value at the BATS Station.
Discussion
Fine Scale Temporal and Vertical Variability
The results of this study suggest that variability in the parameters measured at Hog Reef was mainly diel, and was likely influenced by a combination of light, benthic and water column production, calcification and dissolution, and local tidal flow. In particular, temperature, DO, pHT, and pCO2 exhibited distinct local extremes in the afternoon and after midnight each day. This dominant frequency of variability of ∼ 1 day–1 was linked to the daily light cycle and its effects on seawater temperature and primary production (Figure 3). Seawater pCO2 variability was inverse to that of DO and pHT, reflecting CO2 uptake by primary production during the day and release via respiration at night. These diel patterns are ubiquitous for shallow marine systems and have been documented for many reef systems in Bermuda (Bates et al., 2001, 2010; Sutton et al., 2014; Page et al., 2017; Takeshita et al., 2018) and around the globe (e.g., Hofmann et al., 2011; Gray et al., 2012; Guadayol et al., 2014; Koweek et al., 2015a, b; DeCarlo et al., 2017; Page et al., 2018; Cyronak et al., 2020).
In contrast to the autonomous measurements of temperature, DO, pHT, and pCO2, which revealed distinct diel trends, autonomous measurements of TA revealed higher frequency temporal variability and a less distinct diel trend (Figure 3). This may be related to the fact that the relative magnitude of the diel variability in calcification and CaCO3 dissolution (rNCC) was small compared to that of photosynthesis and respiration (rNCP–DO and rNCP–DIC) at Hog Reef, making changes in seawater TA less pronounced compared to changes in DIC, DO, pHT, and pCO2 (Figure 3 and Supplementary Figure 3; Takeshita et al., 2018). Furthermore, frequency analyses revealed that TA varied strongly at frequencies of both 1 day–1 (diel light cycle) as well as 2 day–1 (relating to the tidal cycle) (Figure 3, right). This suggests that flow dynamics had a strong influence on the temporal variability in TA, which depending on the flow trajectory and history, would reveal a chemical signature that did not necessarily track the diel light cycle, and led to the prominence of variability at a higher frequency (Figure 3). We hypothesize that the reason other parameters (i.e., DO, pHT, and seawater pCO2) revealed a strong diel trend that was not muddled by the tidal cycle is because photosynthesis and respiration were also quantitatively important in the water column, as opposed to just the benthos, whereas calcification and CaCO3 dissolution mainly occurred on the benthos. Consequently, changes in the seawater TA appeared to mainly reflect biogeochemical processes that predominantly occurred in the benthos (calcification and dissolution) with the chemical signal modified by hydrodynamics, while changes in DIC, DO, pHT, and pCO2 were also strongly influenced by water column photosynthesis and respiration. This hypothesis is supported by the fact that there were notable differences in the magnitude of DO variability at the surface and the bottom throughout the deployment period. While DO minima at night were similar for surface and bottom, daytime maxima were much higher in the surface, suggesting that there was higher total net primary productivity measured at the surface compared to the benthos during the day. Furthermore, the largest differences between surface and bottom DO occurred during neap tides, potentially indicating amplified gradients during times of reduced water flow and mixing (e.g., Falter et al., 2013; Lowe and Falter, 2015). Long et al. (2019) reported that water column production at Hog Reef accounted for more than half (58%) of the total oxygen flux, compared to just 39% from the benthos, during an overlapping study interval with our observations (Long et al., 2019), lending further support to the hypothesized contribution from water column productivity compared to the benthos.
The observed gradient in DO between surface and bottom was at times partly corroborated by independent pCO2 measurements by the SAMI-CO2 at the bottom and the MAPCO2 buoy at the surface. Surface pCO2 measured by the buoy was consistently lower than pCO2 measured at 7 m by the SAMI-CO2, as would be expected given the DO gradient between surface and 7 m. However, because of inconsistencies between measurements of pCO2 by the MAPCO2 and SAMI-CO2 at the surface, it is difficult to make any strong conclusions based on these observations. It should also be noted that variations in seawater temperature and NCC between day (net calcification) and night (decreased calcification and increased CaCO3 dissolution) influence seawater pCO2 opposite to changes resulting from the day-night cycle in NCP (Cyronak et al., 2020), resulting in a dampened pCO2 diel amplitude. Consequently, pCO2 measurements are less sensitive relative to the DO measurements as a measure of net productivity differences between the surface and bottom. On coral reefs in general, the benthos is assumed to be the main contributor to coral reef organic carbon production with only minor influence from the water column. Few studies have actually quantified the relative contributions of each (e.g., Long et al., 2019), but based on the present observations and the Long et al. (2019) study, it is clear that this needs to be assessed in more detail in future studies. The relative contributions from the water column and benthos to NCP are likely to change as a function of depth so that the contribution from the benthos becomes increasingly important as the depth decreases. This may in fact explain the observations from Cyronak et al. (2020) that coral reef pHT variability can be largely predicted based on depth and mean pHT conditions.
Compared to our observations at Hog Reef, other studies that have characterized TA autonomously on coral reef environments in Kāne’ohe Bay, Hawai’i (Spaulding et al., 2014, same sensor as this study; Briggs et al., 2020, solid-state sensor) and Heron Island, Australia (McMahon et al., 2018, VINDTA 3c) observed more distinct diel variability and a greater daily amplitude in TA that closely tracked the diel variability in other carbonate chemistry parameters (i.e., pHT and pCO2). These study locations were characterized by much shallower depths than Hog Reef, and thus, higher benthic biomass to water volume ratio, resulting in greater influence by benthic processes on water chemistry and consequently larger changes in seawater TA. The higher biomass to water volume ratio was also evident from greater daily changes in seawater pHT and pCO2 at these locations (Drupp et al., 2013; McMahon et al., 2018; Page et al., 2018). It should be noted that making high quality autonomous measurements of TA on coral reefs is an important and active area of research since it provides an additional master variable to constrain the carbonic acid system. Furthermore, because calcification and CaCO3 dissolution are central processes on coral reefs, and strongly influenced by global environmental change (Hoegh-Guldberg et al., 2007; Hughes et al., 2018), these processes are critical to monitor. Direct measurements of TA (as opposed to calculated TA) offer the most accurate and precise approach to estimate NCC. Thus, high frequency measurements of TA are important for understanding the drivers and dynamics of calcification and dissolution processes on coral reefs and could reveal temporal trends, relationships, and the effects of episodic events (e.g., storms) otherwise not detected from low frequency measurements (Spaulding et al., 2014; McMahon et al., 2018; Briggs et al., 2020).
Lateral and Vertical Spatiotemporal Variability
Lateral spatial gradients in carbonate chemistry across Hog Reef appeared to be influenced by the bathymetry and the general direction of water flow across or along the reef (Figures 5, 6). The observed gradients in DIC, TA, and pHT generally decreased from offshore to inshore as a result of the uptake of TA and DIC via calcification and primary production, with an exacerbated signal in shallower areas where smaller volumes of water were being modified by the reef community (such as in Falter et al., 2013; Takeshita et al., 2018). The current data and spatial survey data together highlight the influence of hydrodynamics on the structure of the observed gradients (Figures 5, 6). On most days, the mean direction of depth-averaged flow was oriented in line with the irregularities in the structure of the inshore-offshore gradients observed (e.g., September 2, 4, 7 in Figures 5, 6). It should also be noted that September 4 was an extremely calm and sunny day, and thus, favorable for generating strong chemical gradients. While current speed and direction do not fully account for the gradients observed, the present results highlight the need to combine spatial water chemistry surveys with complementary hydrodynamic data, in order to better interpret observed chemical gradients. Furthermore, given the much larger gradients observed laterally compared to vertically, we find that the general assumption of a well-mixed water column over coral reefs is mostly a reasonable assumption at the spatial scale and depth of the current study, but the presence of stratification and/or disparate contributions from the benthos and water column biogeochemical processes, may invalidate this assumption. Furthermore, this assumption varies from place to place and needs to be given site-specific considerations.
Lateral spatial gradients in seawater carbonate chemistry have previously been characterized in Bermuda (e.g., Andersson et al., 2014; Venti et al., 2014; Takeshita et al., 2018) and in many other reef systems (e.g., Watanabe et al., 2006; Shamberger et al., 2011; Albright et al., 2015; Courtney et al., 2018; Page et al., 2018). Combined with mean residence time and depth, these gradients provide the information required to calculate rates of NCC and NCP, but accurately characterizing residence time is a non-trivial task associated with large uncertainties (Lowe et al., 2009; Venti et al., 2012; Teneva et al., 2013; Courtney and Andersson, 2019). The present data highlight the potential challenges in quantifying local rates of NCC and NCP based on spatial chemical gradients, as the water on the reef flows in different directions depending on the time of day and depth. In addition, the history of any given water parcel flowing over different habitats depends on the tide, current speeds and directions, and benthic composition. Compared to Hog Reef, there are clearly other locations that are more suitable for this task where even-depth and quasi-unidirectional flow or no flow (e.g., slack tide) may assist in quantifying rates of NCC and NCP. Other approaches based on gradients in the benthic boundary layer (e.g., benthic gradient flux or eddy covariance: Long et al., 2013; Takeshita et al., 2016, 2018) may also provide a way to accurately characterize rates at locations such as Hog Reef but are limited to a small benthic footprint (∼100 m2). Although the objective of this study was not to quantify metabolic rates, the different approaches explored here to assess biogeochemical drivers (local temporal variability, inshore-offshore gradients, and TA-DIC relationships) revealed the importance of the temporal and spatial scales considered, and how they might be related (Figures 7, 8).
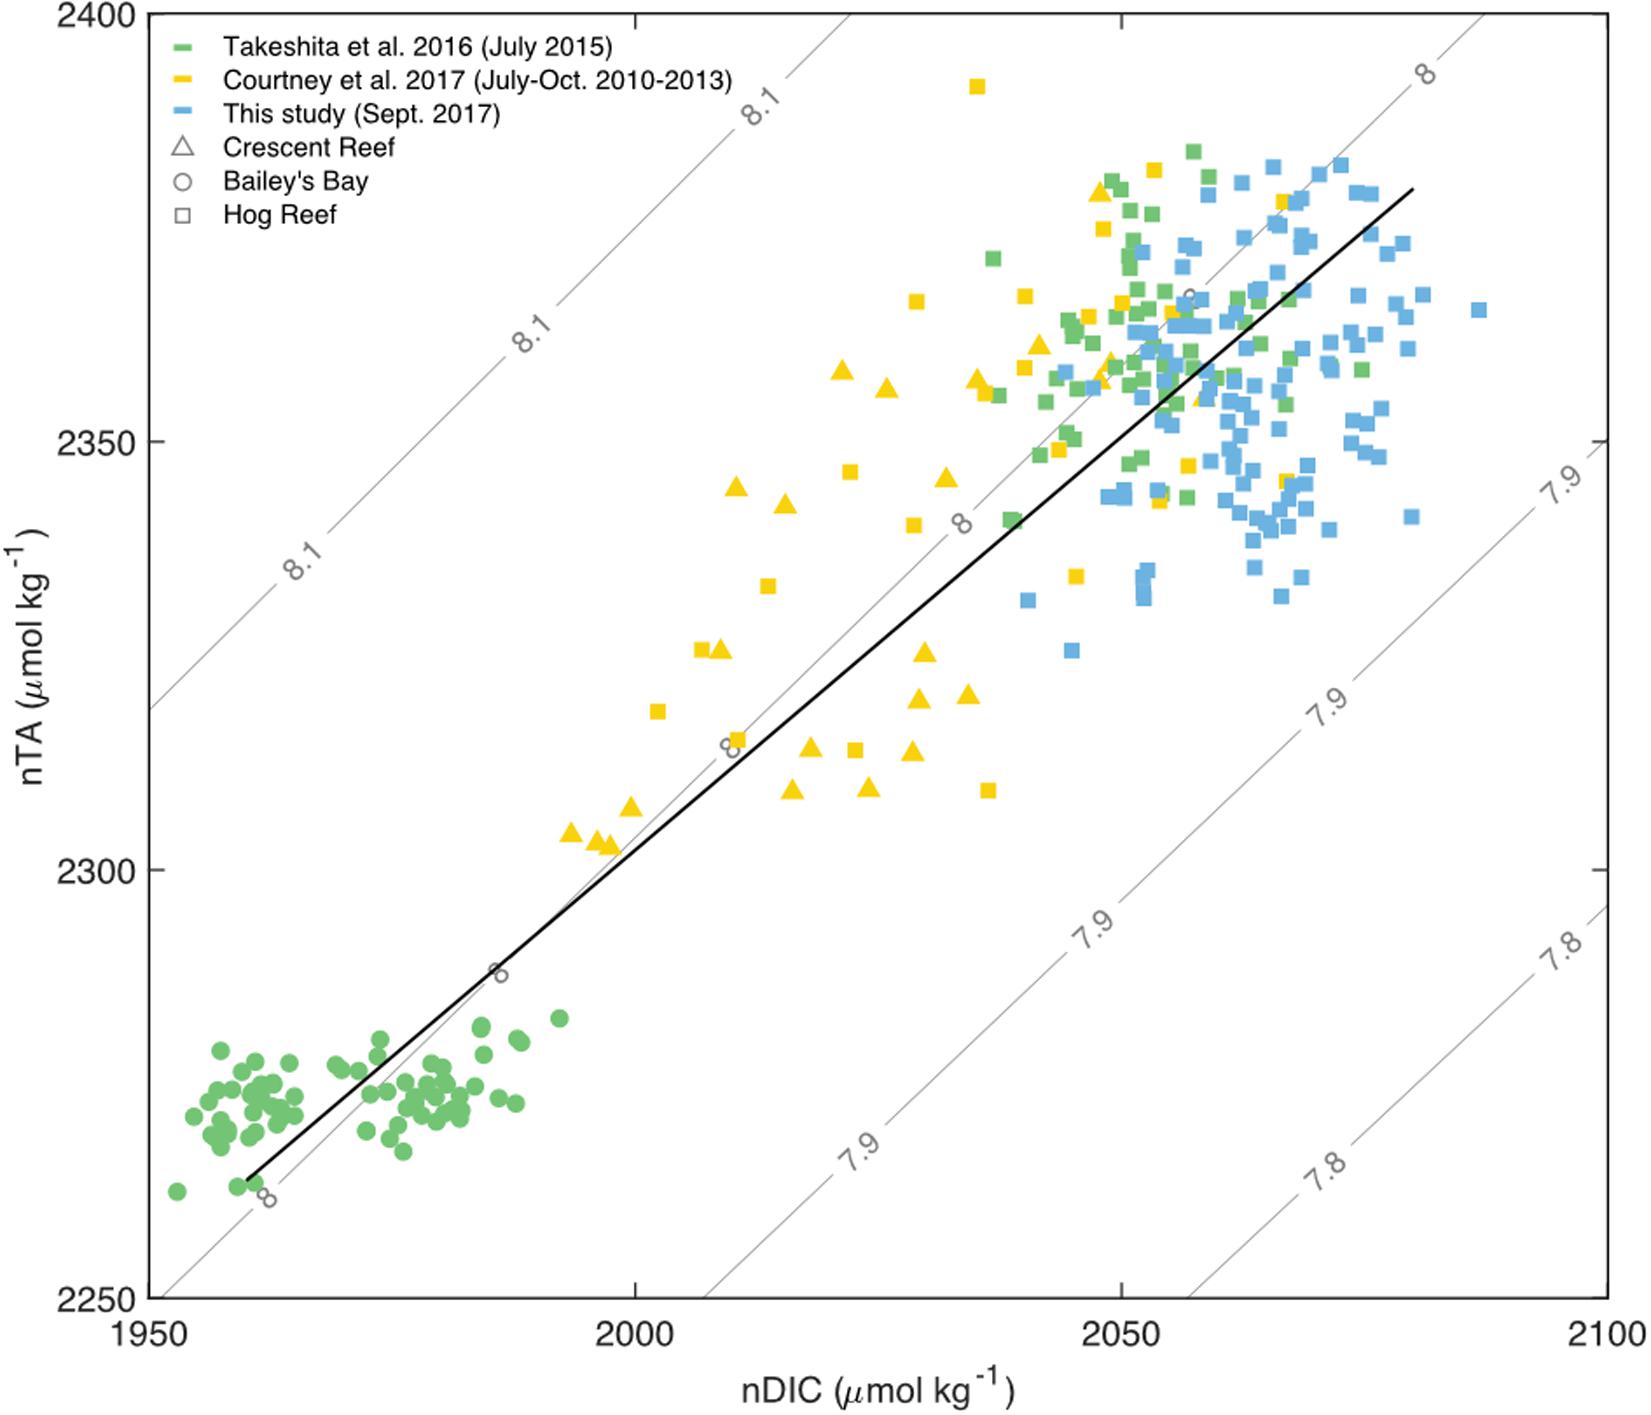
Figure 8. Salinity normalized (36.7 PSU) TA and DIC for water sample data from sites across the Bermuda carbonate platform: Crescent Reef (triangles), Bailey’s Bay (circles), and various expeditions to Hog Reef (squares) ranging from 2010 to 2017 with a Type II linear regression for all data (black) and pH contours. Only data from July to October of each year were used from Courtney et al. (2017; yellow). All data from Takeshita et al. (2016; green) were collected in July 2015. All bottle sample data from the present study were collected in September 2017 (blue).
Biogeochemical Drivers of Carbonate Chemistry Variability
Calculations of rNCP–DIC, rNCP–DO, and rNCC–TA using a mean anomaly highlighted the variability of localized processes occurring on Hog Reef and adjacent habitats (i.e., habitat-specific biogeochemical processes and the respective mixing between offshore, rim reef, and lagoon seawater). On average, these terms roughly represented a benthic reef area on the order of 3 km2, but there were times when the footprint may have been larger (Figure 2). The magnitude of the local, short-term variability in organic carbon processes (rNCP–DIC and rNCP–DO) was greater than that of inorganic carbon processes (rNCC–TA) occurring at Hog Reef during the study period with the diel range of both rNCP–DO and rNCP–DIC exceeding that of rNCC–TA (4.6 ± 2.4 μmol kg–1 for rNCP–DO : rNCC–TA and 2.8 ± 1.4 μmol kg–1 for rNCP–DIC : rNCC–TA; mean ratio ± SD) (Figure 3). This was in agreement with a previous study at the same site that measured benthic NCC and NCP based on chemical gradients in the benthic boundary layer (Takeshita et al., 2018). Furthermore, the temporal variability in rNCP–DIC agreed well with rNCP–DO calculated from changes in DO, though the amplitude of the diel variability in rNCP–DO was larger than that of rNCP–DIC. This disagreement may be in part due to deviation from the assumed photosynthetic quotient of 1 (Smith and Marsh, 1973; Takeshita et al., 2018; Bolden et al., 2019) with a Type II linear regression between rNCP–DO and rNCP–DIC yielding a slope of 1.8 (p < 0.001), but could also arise from other factors (e.g., sea-air gas exchange was not accounted for and DIC was not measured directly but calculated from pCO2 and TA; Supplementary Figure 3).
Direct estimates of NCP and NCC based on the chemical gradients between Hog Reef and offshore (BATS), showed substantial net heterotrophy and net calcification (Figure 7C). These estimates reveal the cumulative influence on seawater chemistry from a reef area potentially larger than Hog Reef and for seawater residence time extending multiple tidal cycles, with the influence from the local daily metabolism superimposed on this larger scale reef metabolic signal. The generality of these results (i.e., heterotrophy and calcification) is probably robust, but the absolute values need to be viewed with caution since the flow trajectory, mean depth, and residence time are associated with substantial uncertainty (Courtney and Andersson, 2019). Nonetheless, the estimated mean rates of NCC and NCP are comparable to previous estimates from Bermuda in September (NCC: ∼50–200 mmol m–2 day–1, NCP: ∼ 0–−250 mmol m–2 day–1; (Bates et al., 2010; Yeakel et al., 2015; Courtney et al., 2016, 2017; Takeshita et al., 2018), although several of these estimates used similar methodology and are thus not quite independent comparisons (Yeakel et al., 2015; Courtney et al., 2016, 2017), and Takeshita et al. (2018) only measured NCP and NCC over 3 days.
The importance of scale, illuminated by the different approaches used to assess the importance of biogeochemical processes on Hog Reef, was also evident from graphical assessment and correlation analysis of TA-DIC data. In contrast to many other studies that have characterized TA and DIC on coral reefs over temporal or spatial scales (e.g., Cyronak et al., 2018 and references therein), the current study did not observe a strong correlation between TA and DIC across space (Figure 8), which was also the case in Takeshita et al. (2018). The lack of a clear TA-DIC relationship could be explained by both the local dominance of rNCP over rNCC as well as the differences between surface and benthic production (see previous discussion). However, when placed in context with TA and DIC data collected at other reef sites in Bermuda, covering inshore waters from Bailey’s Bay to the rim reef at Hog Reef, the data from this study fit well along a linear relationship of nTA and nDIC (normalized to a salinity of 36.7, the mean salinity across data from all studies) with a slope close to 1 (slope = 0.97, R2 = 0.86; Figure 8). This implies that NCC and NCP are closely balanced at this larger spatial and temporal scale, and that relatively small changes in mean pHT occur as a function of time and space (Suzuki and Kawahata, 2003; Andersson and Gledhill, 2013; Andersson et al., 2014; Cyronak et al., 2018). However, this does not mean that pHT is invariable; for a given habitat, seawater pHT may vary largely on diel timescales depending on the relative importance of the organic to inorganic carbon cycle (Cyronak et al., 2018; Takeshita et al., 2018). These observations are directly related to the functional scale (biological, temporal, and spatial) of the study and has been discussed extensively in Cyronak et al. (2018) and Takeshita et al. (2018).
Concluding Remarks
The results of this study highlight that seawater carbonate chemistry on coral reefs varies considerably over time and space, with variability linked to diel cycles and local hydrodynamics. By measuring variability in carbonate chemistry and other parameters simultaneously over time and at multiple spatial scales, we showed that physical and biological processes interact on a reef on different scales to result in the net variability in carbonate chemistry and environmental parameters. The general assumption of a well-mixed water column with small vertical chemical gradients (compared to lateral or temporal gradients) over shallow coral reefs may be a reasonable assumption for many reefs, but is site dependent and needs to be assessed on a case-by-case basis. Notably, the present study showed a decoupling between the variability of TA and other carbonate chemistry parameters, which could be attributed to different contributions from benthic and water column biogeochemical processes as well as hydrodynamics. This observation deserves additional attention in other reef locations characterized by different depth, flow, and community compositions. In general, because of their relatively high latitude (32°N), Bermudan reefs experience higher seasonal variability in many properties compared to more tropical reefs. It has been predicted that future changes in ocean pH may increase the variability, and thus the range, of extreme pCO2 values that reefs are exposed to due to reduced seawater buffering capacity (Jury et al., 2013; Shaw et al., 2013). However, whether naturally more variable reef environments extend protections to corals and reef organisms under a regime of changing ocean pH is unclear (Dufault et al., 2012; Comeau et al., 2014; Camp et al., 2016; Rivest et al., 2017; Kapsenberg and Cyronak, 2019). Characterizing the present-day variability of carbonate chemistry at multiple scales, as well as the interactions between hydrodynamics, geomorphology, and biogeochemistry, on reefs such as those in Bermuda will help us better predict how reefs will change as a result of future acidification.
Data Availability Statement
The datasets presented in this study can be found in online repositories. The names of the repository/repositories and accession number(s) can be found below: BCO-DMO Dataset #783568 https://www.bco-dmo.org/dataset/783568 and BCO-DMO Project #73787 https://www.bco-dmo.org/project/737878.
Author Contributions
AA, TC, HP, and MD designed the study. TC, HP, AA, and CB deployed the instruments and collected the data. AP performed the laboratory work and analyzed the data with inputs from AA, TC, and SG. AP wrote the first draft of the manuscript with input from AA. All authors contributed to subsequent drafts of the manuscript.
Funding
This study was supported by funding from the NSF GRFP (AP, TC, and HP), NSF OCE 18-29778 (AP), NSF OCE 14-16518 and 12-55042 (AA), and NSF OCE 14-59255 (MD).
Conflict of Interest
The authors declare that the research was conducted in the absence of any commercial or financial relationships that could be construed as a potential conflict of interest.
Acknowledgments
We thank Dr. Matthew Long and Jennie Rheuban (Woods Hole Oceanographic Institution) for assistance during sensor deployment and recovery and Dr. Tyler Cyronak for processing and providing imagery of Hog Reef.
Supplementary Material
The Supplementary Material for this article can be found online at: https://www.frontiersin.org/articles/10.3389/fmars.2021.562267/full#supplementary-material
Footnotes
- ^ https://tidesandcurrents.noaa.gov/stationhome.html?id=2695540#info
- ^ https://www.ngdc.noaa.gov/geomag/calculators/magcalc.shtml#declination
- ^ http://bats.bios.edu/bats-data/
References
Albright, R., Benthuysen, J., Cantin, N., Caldeira, K., and Anthony, K. (2015). Coral reef metabolism and carbon chemistry dynamics of a coral reef flat. Geophys. Res. Lett. 42, 3980–3988. doi: 10.1002/2015GL063488
Andersson, A. J., Bates, N. R., and Mackenzie, F. T. (2007). Dissolution of carbonate sediments under rising pCO2 and ocean acidification: observations from Devil’s Hole, Bermuda. Aquat. Geochem. 13, 237–264. doi: 10.1007/s10498-007-9018-8
Andersson, A. J., and Gledhill, D. (2013). Ocean acidification and coral reefs: effects on breakdown, dissolution, and net ecosystem calcification. Annu. Rev. Mar. Sci. 5, 321–348. doi: 10.1146/annurev-marine-121211-172241
Andersson, A. J., Venn, A. A., Pendleton, L., Brathwaite, A., Camp, E. F., Cooley, S., et al. (2019). Ecological and socioeconomic strategies to sustain Caribbean coral reefs in a high-CO2 world. Reg. Stud. Mar. Sci. 29:100677. doi: 10.1016/j.rsma.2019.100677
Andersson, A. J., Yeakel, K. L., Bates, N. R., and de Putron, S. J. (2014). Partial offsets in ocean acidification from changing coral reef biogeochemistry. Nat. Clim. Chang. 4, 56–61. doi: 10.1038/nclimate2050
Anthony, K. R. N., Diaz-Pulido, G., Verlinden, N., Tilbrook, B., and Andersson, A. J. (2013). Benthic buffers and boosters of ocean acidification on coral reefs. Biogeosci. Discuss. 10, 1831–1865.
Anthony, K. R. N., Kleypas, A. J., and Gattuso, J.-P. (2011). Coral reefs modify their seawater carbon chemistry - implications for impacts of ocean acidification. Glob. Change Biol. 17, 3655–3666. doi: 10.1111/j.1365-2486.2011.02510.x
Bates, N. R. (2017). Twenty years of marine carbon cycle observations at Devil’s Hole, Bermuda provide insights into seasonal hypoxia, coral reef calcification, and ocean acidification. Front. Mar. Sci. 4:36. doi: 10.3389/fmars.2017.00036
Bates, N. R., Amat, A., and Andersson, A. J. (2010). Feedbacks and responses of coral calcification on the Bermuda reef system to seasonal changes in biological processes and ocean acidification. Biogeosciences 7, 2509–2530. doi: 10.5194/bg-7-2509-2010
Bates, N. R., Samuels, L., and Merlivat, L. (2001). Biogeochemical and physical factors influencing seawater fCO2 and air-sea CO2 exchange on the Bermuda coral reef. Limnol. Oceanogr. 46, 833–846. doi: 10.4319/lo.2001.46.4.0833
Bolden, I. W., Sachs, J. P., and Gagnon, A. C. (2019). Temporally-variable productivity quotients on a coral atoll: implications for estimates of reef metabolism. Mar. Chem. 217:103707. doi: 10.1016/j.marchem.2019.103707
Brander, L. M., Van Beukering, P., and Cesar, H. S. J. (2007). The recreational value of coral reefs: a meta-analysis. Ecol. Econ. 63, 209–218. doi: 10.1016/j.ecolecon.2006.11.002
Briggs, E. M., De Carlo, E. H., Sabine, C. L., Howins, N. M., and Martz, T. R. (2020). Autonomous ion-sensitive field effect transistor-based total alkalinity and pH measurements on a barrier reef of Kāne’ohe Bay. ACS Earth Space Chem. 4, 355–362. doi: 10.1021/acsearthspacechem.9b00274
Camp, E. F., Smith, D. J., Evenhuis, C., Enochs, I., Manzello, D., Woodcock, S., et al. (2016). Acclimatization to high-variance habitats does not enhance physiological tolerance of two key Caribbean corals to future temperature and pH. Proc. R Soc. B Biol. Sci. 283:20160442. doi: 10.1098/rspb.2016.0442
Chan, N. C. S., and Connolly, S. R. (2013). Sensitivity of coral calcification to ocean acidification: a meta-analysis. Glob. Change Biol. 19, 282–290. doi: 10.1111/gcb.12011
Comeau, S., Edmunds, P. J., Spindel, N. B., and Carpenter, R. C. (2014). Diel pCO2 oscillations modulate the response of the coral Acropora hyacinthus to ocean acidification. Mar. Ecol. Prog. Ser. 501, 99–111. doi: 10.3354/meps10690
Costanza, R., de Groot, R., Sutton, P., van der Ploeg, S., Anderson, S. J., Kubiszewski, I., et al. (2014). Changes in the global value of ecosystem services. Glob. Environ. Change 26, 152–158. doi: 10.1016/j.gloenvcha.2014.04.002
Courtney, T. A., and Andersson, A. J. (2019). Evaluating measurements of coral reef net ecosystem calcification rates. Coral Reefs 38, 997–1006. doi: 10.1007/s00338-019-01828-2
Courtney, T. A., Andersson, A. J., Bates, N. R., Collins, A., Cyronak, T., de Putron, S. J., et al. (2016). Comparing chemistry and census-based estimates of net ecosystem calcification on a rim reef in Bermuda. Front. Mar. Sci. 3:181. doi: 10.3389/fmars.2016.00181
Courtney, T. A., De Carlo, E. H., Page, H. N., Bahr, K. D., Barro, A., Howins, N., et al. (2018). Recovery of reef-scale calcification following a bleaching event in Kāne’ohe Bay, Hawai’i: post-bleaching recovery of reef-scale calcification. Limnol. Oceanogr. Lett. 3, 1–9. doi: 10.1002/lol2.10056
Courtney, T. A., Lebrato, M., Bates, N. R., Collins, A., de Putron, S. J., Garley, R., et al. (2017). Environmental controls on modern scleractinian coral and reef-scale calcification. Sci. Adv. 3:e1701356. doi: 10.1126/sciadv.1701356
Cyronak, T., Andersson, A. J., Langdon, C., Albright, R., Bates, N. R., Caldeira, K., et al. (2018). Taking the metabolic pulse of the world’s coral reefs. PLoS One 13:e0190872. doi: 10.1371/journal.pone.0190872
Cyronak, T., Schulz, K. G., Santos, I. R., and Eyre, B. D. (2014). Enhanced acidification of global coral reefs driven by regional biogeochemical feedbacks. Geophys. Res. Lett. 41, 5538–5546. doi: 10.1002/2014GL060849
Cyronak, T., Takeshita, Y., Courtney, T. A., DeCarlo, E. H., Eyre, B. D., Kline, D. I., et al. (2020). Diel temperature and pH variability scale with depth across diverse coral reef habitats. Limnol. Oceanogr. Lett. 5, 193–203. doi: 10.1002/lol2.10129
DeCarlo, T. M., Cohen, A. L., Wong, G. T. F., Shiah, F.-K., Lentz, S. J., Davis, K. A., et al. (2017). Community production modulates coral reef pH and the sensitivity of ecosystem calcification to ocean acidification. J. Geophys. Res. Oceans 122, 745–761. doi: 10.1002/2016JC012326
Dickson, A. G. (1990). Thermodynamics of the dissociation of boric acid in synthetic seawater from 273.15 to 318.15 K. Deep Sea Res. Part Oceanogr. Res. Pap. 37, 755–766. doi: 10.1016/0198-0149(90)90004-F
Dickson, A. G., and Millero, F. J. (1987). A comparison of the equilibrium constants for the dissociation of carbonic acid in seawater media. Deep Sea Res. Part Oceanogr. Res. Pap. 34, 1733–1743. doi: 10.1016/0198-0149(87)90021-5
Dickson, A. G., Sabine, C. L., Christian, J. R., Bargeron, C. P., North Pacific Marine Science, and Organization (eds) (2007). Guide to Best Practices for Ocean CO2 Measurements. Sidney, BC: North Pacific Marine Science Organization.
Drupp, P. S., De Carlo, E. H., Mackenzie, F. T., Sabine, C. L., Feely, R. A., and Shamberger, K. E. (2013). Comparison of CO2 dynamics and air-sea gas exchange in differing tropical reef environments. Aquat. Geochem. 19, 371–397. doi: 10.1007/s10498-013-9214-7
Dufault, A. M., Cumbo, V. R., Fan, T.-Y., and Edmunds, P. J. (2012). Effects of diurnally oscillating pCO2 on the calcification and survival of coral recruits. Proc. R. Soc. B Biol. Sci. 279, 2951–2958. doi: 10.1098/rspb.2011.2545
Eyre, B. D., Cyronak, T., Drupp, P., De Carlo, E. H., Sachs, J. P., and Andersson, A. J. (2018). Coral reefs will transition to net dissolving before end of century. Science 359, 908–911. doi: 10.1126/science.aao1118
Falter, J. L., Lowe, R. J., Zhang, Z., and McCulloch, M. (2013). Physical and biological controls on the carbonate chemistry of coral reef waters: effects of metabolism, wave forcing, sea level, and geomorphology. PLoS One 8:e53303. doi: 10.1371/journal.pone.0053303
Gagliano, M., McCormick, M. I., Moore, J. A., and Depczynski, M. (2010). The basics of acidification: Baseline variability of pH on Australian coral reefs. Mar. Biol. 157, 1849–1856. doi: 10.1007/s00227-010-1456-y
Gray, S. E. C., DeGrandpre, M. D., Langdon, C., and Corredor, J. E. (2012). Short-term and seasonal pH, pCO2 and saturation state variability in a coral-reef ecosystem. Glob. Biogeochem. Cycles 26:2011GB004114. doi: 10.1029/2011GB004114
Guadayol, Ò, Silbiger, N. J., Donahue, M. J., and Thomas, F. I. M. (2014). Patterns in temporal variability of temperature, oxygen and pH along an environmental gradient in a coral reef. PLoS One 9:e85213. doi: 10.1371/journal.pone.0085213
Hoegh-Guldberg, O., Mumby, P. J., Hooten, A. J., Steneck, R. S., Greenfield, P., Gomez, E., et al. (2007). Coral reefs under rapid climate change and ocean acidification. Science 318, 1737–1742. doi: 10.1126/science.1152509
Hofmann, G. E., Smith, J. E., Johnson, K. S., Send, U., Levin, L. A., Micheli, F., et al. (2011). High-frequency dynamics of ocean pH: a multi-ecosystem comparison. PLoS One 6:e28983. doi: 10.1371/journal.pone.0028983
Hughes, T. P., Baird, A. H., Bellwood, D. R., Card, M., Connolly, S. R., Folke, C., et al. (2003). Climate change, human impacts, and the resilience of coral reefs. Science 301, 929–933. doi: 10.1126/science.1085046
Hughes, T. P., Kerry, J. T., Baird, A. H., Connolly, S. R., Dietzel, A., Eakin, C. M., et al. (2018). Global warming transforms coral reef assemblages. Nature 556, 492–496. doi: 10.1038/s41586-018-0041-2
Jackson, J. B. C., Kirby, M. X., Berger, W. H., Bjorndal, K. A., Botsford, L. W., Bourque, B. J., et al. (2001). Historical overfishing and the recent collapse of coastal ecosystems. Science 293, 629–637. doi: 10.1126/science.1059199
Jury, C. P., Thomas, F. I. M., Atkinson, M. J., and Toonen, R. J. (2013). Buffer capacity, ecosystem feedbacks, and seawater chemistry under global change. Water 5, 1303–1325. doi: 10.3390/w5031303
Kapsenberg, L., and Cyronak, T. (2019). Ocean acidification refugia in variable environments. Glob. Change Biol. 25, 3201–3214. doi: 10.1111/gcb.14730
Kleypas, J. A., Anthony, K. R. N., and Gattuso, J.-P. (2011). Coral reefs modify their seawater carbon chemistry - case study from a barrier reef (Moorea, French Polynesia). Glob. Change Biol. 17, 3667–3678. doi: 10.1111/j.1365-2486.2011.02530.x
Kleypas, J. A., Buddemeier, R. W., Archer, D., Gattuso, J.-P., Langdon, C., and Opdyke, B. N. (1999). Geochemical consequences of increased atmospheric carbon dioxide on coral reefs. Science 284, 118–120. doi: 10.1126/science.284.5411.118
Kleypas, J. A., and Yates, K. K. (2009). Coral reefs and ocean acidification. Oceanography 22, 108–117.
Koweek, D. A., Dunbar, R. B., Monismith, S. G., Mucciarone, D. A., Woodson, C. B., and Samuel, L. (2015a). High-resolution physical and biogeochemical variability from a shallow back reef on Ofu, American Samoa: an end-member perspective. Coral Reefs 34, 979–991. doi: 10.1007/s00338-015-1308-9
Koweek, D. A., Dunbar, R. B., Rogers, J. S., Williams, G. J., Price, N., Mucciarone, D., et al. (2015b). Environmental and ecological controls of coral community metabolism on Palmyra Atoll. Coral Reefs 34, 339–351. doi: 10.1007/s00338-014-1217-3
Langdon, C., Gattuso, J.-P., and Andersson, A. (2010). “Measurements of calcification and dissolution of benthic organisms and communities,” in Guide to Best Practices for Ocean Acidification Research and Data Reporting, eds U. Riebesell, V. J. Fabry, L. Hansson, and J.-P. Gattuso (Luxembourg: Office for Official Publications of the European Communities), 213–232.
Langdon, C., Takahashi, T., Sweeney, C., Chipman, D., Goddard, J., Marubini, F., et al. (2000). Effect of calcium carbonate saturation state on the calcification rate of an experimental coral reef. Glob. Biogeochem. Cycles 14, 639–654. doi: 10.1029/1999GB001195
Lewis, E., and Wallace, D. (1998). CO2SYS - Program Developed for the CO2 System Calculations. Oak Ridge, TE: Oak Ridge National Laboratory, US Department of Energy: Carbon Dioxide Information Analysis Center.
Long, M. H., Berg, P., de Beer, D., and Zieman, J. C. (2013). In situ coral reef oxygen metabolism: an eddy correlation study. PLoS One 8:e058581. doi: 10.1371/journal.pone.0058581
Long, M. H., Rheuban, J. E., McCorkle, D. C., Burdige, D. J., and Zimmerman, R. C. (2019). Closing the oxygen mass balance in shallow coastal ecosystems. Limnol. Oceanogr. 64, 2694–2708. doi: 10.1002/lno.11248
Lowe, R. J., and Falter, J. L. (2015). Oceanic forcing of coral reefs. Annu. Rev. Mar. Sci. 7, 43–66. doi: 10.1146/annurev-marine-010814-015834
Lowe, R. J., Falter, J. L., Monismith, S. G., and Atkinson, M. J. (2009). A numerical study of circulation in a coastal reef-lagoon system. J. Geophys. Res. Oceans 114:C005081. doi: 10.1029/2008JC005081
Marine Environmental Program (2007). Marine Environmental Program Annual Report, 2006-2007. St.George’s: Bermuda Insitute of Ocean Sciences.
McMahon, A., Santos, I. R., Schulz, K. G., Cyronak, T., and Maher, D. T. (2018). Determining coral reef calcification and primary production using automated alkalinity, pH and pCO2 measurements at high temporal resolution. Estuar. Coast. Shelf Sci. 209, 80–88. doi: 10.1016/j.ecss.2018.04.041
Mehrbach, C., Culberson, C. H., Hawley, J. E., and Pytkowicx, R. M. (1973). Measurement of the apparent dissociation constants of carbonic acid in seawater at atmospheric pressure. Limnol. Oceanogr. 18, 897–907. doi: 10.4319/lo.1973.18.6.0897
Moberg, F., and Folke, C. (1999). Ecological Goods and Services of Coral Reef Ecosystems. Ecol. Econ. 29, 215–233.
Morris, B., Barnes, J., Brown, F., and Markham, J. (1977). The Bermuda Marine Environment: A Report of the Bermuda Inshore Waters Investigations, 1976-1977. St.George’s: Bermuda Biological Station.
Nelson, H. R., and Altieri, A. H. (2019). Oxygen: the universal currency on coral reefs. Coral Reefs 38, 177–198. doi: 10.1007/s00338-019-01765-0
Page, H. N., Courtney, T. A., Collins, A., De Carlo, E. H., and Andersson, A. J. (2017). Net community metabolism and seawater carbonate chemistry scale non-intuitively with coral cover. Front. Mar. Sci. 4:161. doi: 10.3389/fmars.2017.00161
Page, H. N., Courtney, T. A., De Carlo, E. H., Howins, N. M., Koester, I., and Andersson, A. J. (2018). Spatiotemporal variability in seawater carbon chemistry for a coral reef flat in Kāne‘ohe Bay, Hawai‘i. Limnol. Oceanogr. 64, 913–934. doi: 10.1002/lno.11084
Pelejero, C., Calvo, E., McCulloch, M., Marshall, J. F., Gagan, M. K., Lough, J. M., et al. (2005). Preindustrial to modern interdecadal variability in coral reef pH. Science 309, 2204–2207. doi: 10.1126/science.1113692
Rivest, E. B., Comeau, S., and Cornwall, C. E. (2017). The role of natural variability in shaping the response of coral reef organisms to climate change. Curr. Clim. Change Rep. 3, 271–281. doi: 10.1007/s40641-017-0082-x
Schönberg, C. H. L., Fang, J. K. H., Carreiro-Silva, M., Tribollet, A., and Wisshak, M. (2017). Bioerosion: the other ocean acidification problem. ICES J. Mar. Sci. 74, 895–925. doi: 10.1093/icesjms/fsw254
Shamberger, K. E. F., Feely, R. A., Sabine, C. L., Atkinson, M. J., DeCarlo, E. H., Mackenzie, F. T., et al. (2011). Calcification and organic production on a Hawaiian coral reef. Mar. Chem. 127, 64–75. doi: 10.1016/j.marchem.2011.08.003
Shaw, E. C., McNeil, B. I., Tilbrook, B., Matear, R., and Bates, M. L. (2013). Anthropogenic changes to seawater buffer capacity combined with natural reef metabolism induce extreme future coral reef CO2 conditions. Glob. Change Biol. 19, 1632–1641. doi: 10.1111/gcb.12154
Silverman, J., Lazar, B., Cao, L., Caldeira, K., and Erez, J. (2009). Coral reefs may start dissolving when atmospheric CO2 doubles. Geophys. Res. Lett. 36:L036282.
Silverman, J., Lazar, B., and Erez, J. (2007). Effect of aragonite saturation, temperature, and nutrients on the community calcification rate of a coral reef. J. Geophys. Res. Oceans 112:C003770. doi: 10.1029/2006JC003770
Smith, S. V., and Marsh, J. A. Jr. (1973). Organic carbon production on the windward reef flat of Eniwetok Atoll. Limnol. Oceanogr. 18, 953–961. doi: 10.4319/lo.1973.18.6.0953
Spaulding, R. S., DeGrandpre, M. D., Beck, J. C., Hart, R. D., Peterson, B., De Carlo, E. H., et al. (2014). Autonomous in situ measurements of seawater alkalinity. Environ. Sci. Technol. 48, 9573–9581. doi: 10.1021/es501615x
Spurgeon, J. P. G. (1992). The economic valuation of coral reefs. Mar. Pollut. Bull. 24, 529–536. doi: 10.1016/0025-326X(92)90704-A
Sutherland, M. G., McLean, S. H., Love, M. R., Carignan, K. S., and Eakins, B. W. (2014). Digital Elevation Models of Bermuda: Data Sources, Processing and Analysis. Washington, DC: NOAA.
Sutton, A. J., Feely, R. A., Maenner-Jones, S., Musielwicz, S., Osborne, J., Dietrich, C., et al. (2019). Autonomous seawater pCO2 and pH time series from 40 surface buoys and the emergence of anthropogenic trends. Earth Syst. Sci. Data 11, 421–439. doi: 10.5194/essd-2018-114
Sutton, A. J., Sabine, C. L., Maenner-Jones, S., Lawrence-Slavas, N., Meinig, C., Feely, R. A., et al. (2014). A high-frequency atmospheric and seawater pCO2 data set from 14 open-ocean sites using a moored autonomous system. Earth Syst. Sci. Data 6, 353–366.
Suzuki, A. (1998). Combined effects of photosynthesis and calcification on the partial pressure of carbon dioxide in seawater. J. Oceanogr. 54, 1–7. doi: 10.1007/BF02744376
Suzuki, A., and Kawahata, H. (2003). Carbon budget of coral reef systems: an overview of observations in fringing reefs, barrier reefs and atolls in the Indo-Pacific regions. Tellus B Chem. Phys. Meteorol. 55, 428–444. doi: 10.3402/tellusb.v55i2.16761
Takeshita, Y., Cyronak, T., Martz, T. R., Kindeberg, T., and Andersson, A. J. (2018). Coral reef carbonate chemistry variability at different functional scales. Front. Mar. Sci. 5:175. doi: 10.3389/fmars.2018.00175
Takeshita, Y., McGillis, W., Briggs, E. M., Carter, A. L., Donham, E. M., Martz, T. R., et al. (2016). Assessment of net community production and calcification of a coral reef using a boundary layer approach. J. Geophys. Res. Oceans 121, 5655–5671. doi: 10.1002/2016JC011886
Teneva, L., Dunbar, R. B., Mucciarone, D. A., Dunckley, J. F., and Koseff, J. R. (2013). High-resolution carbon budgets on a Palau back-reef modulated by interactions between hydrodynamics and reef metabolism. Limnol. Oceanogr. 58, 1851–1870. doi: 10.4319/lo.2013.58.5.1851
Uppström, L. R. (1974). The boron/chlorinity ratio of deep-sea water from the Pacific Ocean. Deep Sea Res. Oceanogr. Abstr. 21, 161–162. doi: 10.1016/0011-7471(74)90074-6
van Heuven, S., Pierrot, D., Rae, J. W. B., Lewis, E., and Wallace, D. (2011). MATLAB Program Developed for CO2 System Calculations. Oak Ridge, TN: Carbon Dioxide Information Analysis Center, Oak Ridge National Laboratory, US Department of Energy.
Venti, A., Andersson, A., and Langdon, C. (2014). Multiple driving factors explain spatial and temporal variability in coral calcification rates on the Bermuda platform. Coral Reefs 33, 979–997. doi: 10.1007/s00338-014-1191-9
Venti, A., Kadko, D., Andersson, A. J., Langdon, C., and Bates, N. R. (2012). A multi-tracer model approach to estimate reef water residence times: a multi-tracer residence time model. Limnol. Oceanogr. Methods 10, 1078–1095. doi: 10.4319/lom.2012.10.1078
Watanabe, A., Kayanne, H., Hata, H., Kudo, S., Nozaki, K., Kato, K., et al. (2006). Analysis of the seawater CO2 system in the barrier reef-lagoon system of Palau using total alkalinity-dissolved inorganic carbon diagrams. Limnol. Oceanogr. 51, 1614–1628. doi: 10.4319/lo.2006.51.4.1614
Wei, G., Wang, Z., Ke, T., Liu, Y., Deng, W., Chen, X., et al. (2015). Decadal variability in seawater pH in the West Pacific: Evidence from coral d11B records. J. Geophys. Res. Oceans 120, 7166–7181. doi: 10.1002/2015JC011066
Yeakel, K. L., Andersson, A. J., Bates, N. R., Noyes, T. J., Collins, A., and Garley, R. (2015). Shifts in coral reef biogeochemistry and resulting acidification linked to offshore productivity. Proc. Natl. Acad. Sci. U.S.A. 112, 14512–14517. doi: 10.1073/pnas.1507021112
Zeebe, R. E., and Wolf-Gladrow, D. (2001). CO2 in Seawater: Equilibrium, Kinetics, Isotopes. Houston, TX: Gulf Professional Publishing.
Keywords: carbonate chemistry, ocean acidification, calcification, coral reef, Hog Reef, Bermuda, reef metabolism
Citation: Pezner AK, Courtney TA, Page HN, Giddings SN, Beatty CM, DeGrandpre MD and Andersson AJ (2021) Lateral, Vertical, and Temporal Variability of Seawater Carbonate Chemistry at Hog Reef, Bermuda. Front. Mar. Sci. 8:562267. doi: 10.3389/fmars.2021.562267
Received: 14 May 2020; Accepted: 11 January 2021;
Published: 11 February 2021.
Edited by:
Hajime Kayanne, The University of Tokyo, JapanReviewed by:
Daniel Aagren Nielsen, University of Technology Sydney, AustraliaAtsushi Watanabe, Ocean Policy Research Institute, Japan
Copyright © 2021 Pezner, Courtney, Page, Giddings, Beatty, DeGrandpre and Andersson. This is an open-access article distributed under the terms of the Creative Commons Attribution License (CC BY). The use, distribution or reproduction in other forums is permitted, provided the original author(s) and the copyright owner(s) are credited and that the original publication in this journal is cited, in accordance with accepted academic practice. No use, distribution or reproduction is permitted which does not comply with these terms.
*Correspondence: Ariel K. Pezner, apezner@ucsd.edu