the Creative Commons Attribution 4.0 License.
the Creative Commons Attribution 4.0 License.
 | 11 Feb 2021
Study on the influence of the seafloor soft soil layer on seismic ground motion
Jingyan Lan
Juan Liu
Xing Song
In the complex medium system of the sea area, the overlying seawater and the surface soft soil have a significant impact on the seafloor ground motion, which brings great seismic risk to the safety of offshore-engineering structures. In this paper, four sets of typical free-field models are constructed and established, comprising a land model, land model with surface soft soil, sea model and sea model with surface soft soil. The dynamic finite-difference method is used to carry out two-dimensional seismic response analysis of a typical free field based on the input forms of P and SV waves. By comparing the seismic response analysis results of four groups of calculation models, the effects of overlying seawater and soft soil on the peak acceleration and acceleration response spectrum are studied. The results show that when an SV wave is input, the peak acceleration and response spectrum of the surface of soft soil on the surface and the seabed surface can be amplified, while the overlying seawater can significantly reduce the ground motion. When the P wave is used, the effect of overlying seawater and soft soil on the peak acceleration and response spectrum of the surface and seabed can be ignored. The peak acceleration decreases first and then increases from the bottom to the surface, and the difference of peak acceleration calculated by four free-field models is not obvious. The results show that the overlying seawater and the surface soft soil layer have little effect on the peak acceleration of ground motion below the surface.


Both empirical and theoretical studies of earthquake damage show that the site conditions, especially the conditions of the soft soil, are the important factors that affect the aggravation of surface earthquake damage and the significant amplification of theoretical ground motion (Celebi, 1991; Huang et al., 2009; Kubo et al., 2019; Wang et al., 2019). With the development of offshore engineering in recent years, some of them, such as offshore oil platforms, cross-sea bridges and subsea tunnels, have been developed rapidly. Therefore, dynamic characteristics of subsea soft soil and its influence on the ground motion are paid more and more attention. The current research mainly focuses on the simulation of land-based ground motion. In the seismic response analysis of the actual sea area engineering site, the influence of the self-weight stress of the overlying seawater and the action of the overlying saturated soft soil are ignored (Fan et al., 2018), and the one-dimensional frequency domain or time domain seismic response analysis method consistent with the land area engineering is still used (Idriss and Sun, 1992; Streeter et al., 1974; Bardet et al., 2000; Hashash and Park, 2001; Bardet and Tobita, 2001), which is inconsistent with the actual sea area saturated two-dimensional complex medium system. Contemporary studies have shown that the pore water saturation of the underwater soil layer has a great influence on the amplitude of vertical in-plane motion (Yang and Sato, 2000; Yang, 2001; Wang and Hao, 2002; Zhang et al., 2012). However, none of these studies considered the effect of the seawater layer on the seismic ground motion in the offshore environment. Boore and Smith (1999) analyzed the seismic records obtained from the undersea seismic survey system deployed off the coast. The theoretical calculation shows that the influence of the seawater layer on the horizontal component of the ground motion can be ignored. Since there are few records of the seafloor movement, some methods have been proposed to simulate the spatial changes of the seafloor movement (Meng, 2007; He et al., 2015). Petukhin et al. (2010) analyzed two real seabed models with and without a seawater layer and concluded that when the thickness of seawater is within 5 km, the effect of the seawater layer on a Rayleigh wave is significant; when the thickness of seawater is greater than 10 km, the effect of seawater on ground motion can be ignored. Nakamura et al. (2014) used the strong earthquake data recorded on the surface of the Kii Peninsula and near the Nankai Trough to study the abnormally large earthquake amplification in the seabed area. Zhang et al. (2019) deduced the analytical expression of the wave of the seabed foundation site when the P wave or SV wave is incident and thought that the water depth had little influence on the peak value of the horizontal displacement, but the resonance frequency increased with the increase of the thickness of the water layer.
In view of this, in order to study the influence of the self-weight stress of the overlying seawater, based on the second development of the finite-difference software FLAC3D (Fast Lagrangian Analysis of Continua in 3 Dimensions), this paper constructs four typical two-dimensional dynamic calculation models of the free field; carries out two-dimensional seismic response analysis of the free field; and systematically studies the influence of the self-weight stress of the overlying seawater and the soft soil layer on the peak value and acceleration response spectrum of the ground motion, through comparative analysis. The difference of seismic response analysis results in the land free field in the sea area. The research results are helpful for revealing the influence mechanism of the saturated soil site on the ground motion and further deepening and enriching the research progress and achievements in this field.
The quadrilateral element is utilized to divide the dynamic calculation area; the Mohr–Coulomb criterion is used for the nonlinear constitutive model of soil; the free boundary is used for the artificial boundary; and the Rayleigh damping is selected for the damping. The dynamic Eqs. (1) and (2) are formed according to the node equilibrium condition. After the earthquake load is input, the fast Lagrangian finite-difference method is used to solve the equation. The node velocity of Eqs. (3) and (4) and node displacement of Eqs. (5) and (6) are obtained, and then the next node is calculated. The above process is reiterated until the end of calculation.
where M is the mass matrix, C is the damping matrix, K is the stiffness matrix, ui and vi are the node displacement, , is the node speed, and are the node acceleration, and Fi(t) is the external force on the node.
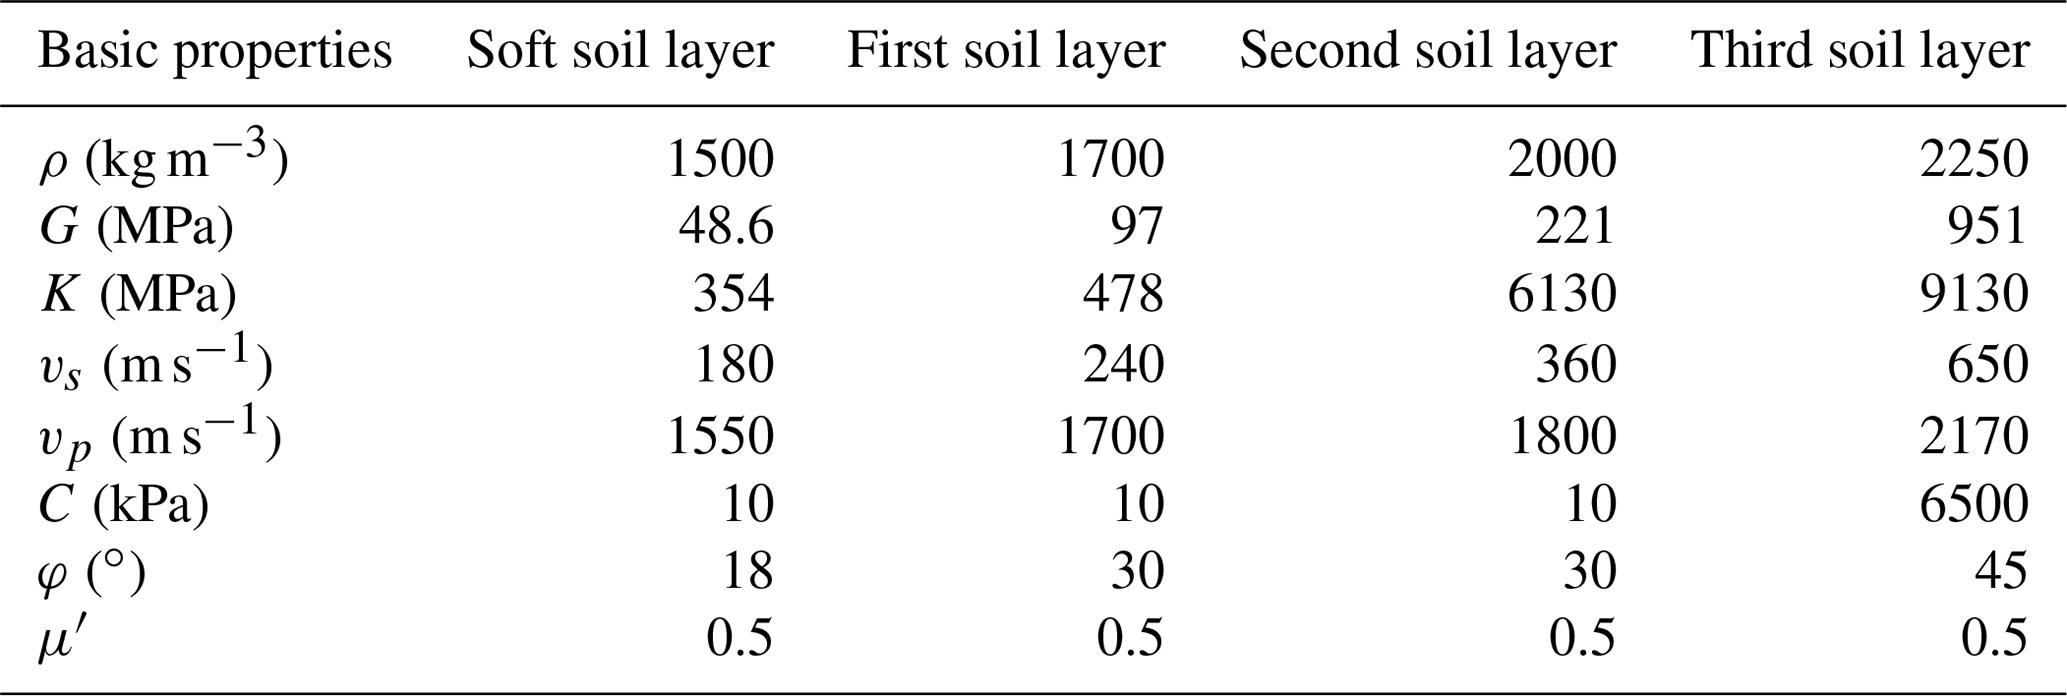
Four groups of free-field calculation models are designed and constructed, including a land layered site model, land layered site model with surface soft soil, sea layered site model and sea layered site model with surface soft soil. The layer thickness and seawater depth of each group of calculation models are presented in Fig. 1. In order to effectively analyze the influence of the overlying seawater and soft soil layer on ground motion, the layered soil in the four calculation models in this paper refers to the calculation model of Chen (2016). In order to simplify the calculation model and improve the simulation accuracy and efficiency, this paper regards seawater as an ideal fluid and ignores its viscosity and realizes the influence of overlying-seawater self-weight stress by setting dynamic water pressure. The horizontal layered free field of the seawater saturated seabed basement is established. Layered soil in the four groups of calculation models uses the same physical and mechanical property parameters (Lan et al., 2012), and the calculation results are shown in Table 1 by using Eqs. (7) to (9).
where G is the shear modulus, VP is the compression wave velocity, K is the bulk modulus, μ′ is Poisson's ratio of soil skeleton, α is the compression parameter of soil and M is the compression parameter of water.

Four groups of free-field calculation models (Fig. 1) are meshed by FLAC3D. According to the principle that the size of the grid element should not be greater than of the minimum wavelength in the input seismic wave, the wave propagation in the soil layer can be more accurately simulated, i.e.,
where Δl is the maximum grid size, λ is the minimum input wavelength, f is the highest frequency of the seismic wave and V is the wave velocity of the seismic wave.
By substituting the soil parameters into the above formula, we can get the value of Δl=3 m in the form of SV-wave input and Δl=17 m in the form of P-wave input. In order to improve the simulation accuracy, the mesh size of SV-wave input is 2 m × 2 m, and that of P-wave input is 5 m × 5 m.
4.1 Base input of ground motion
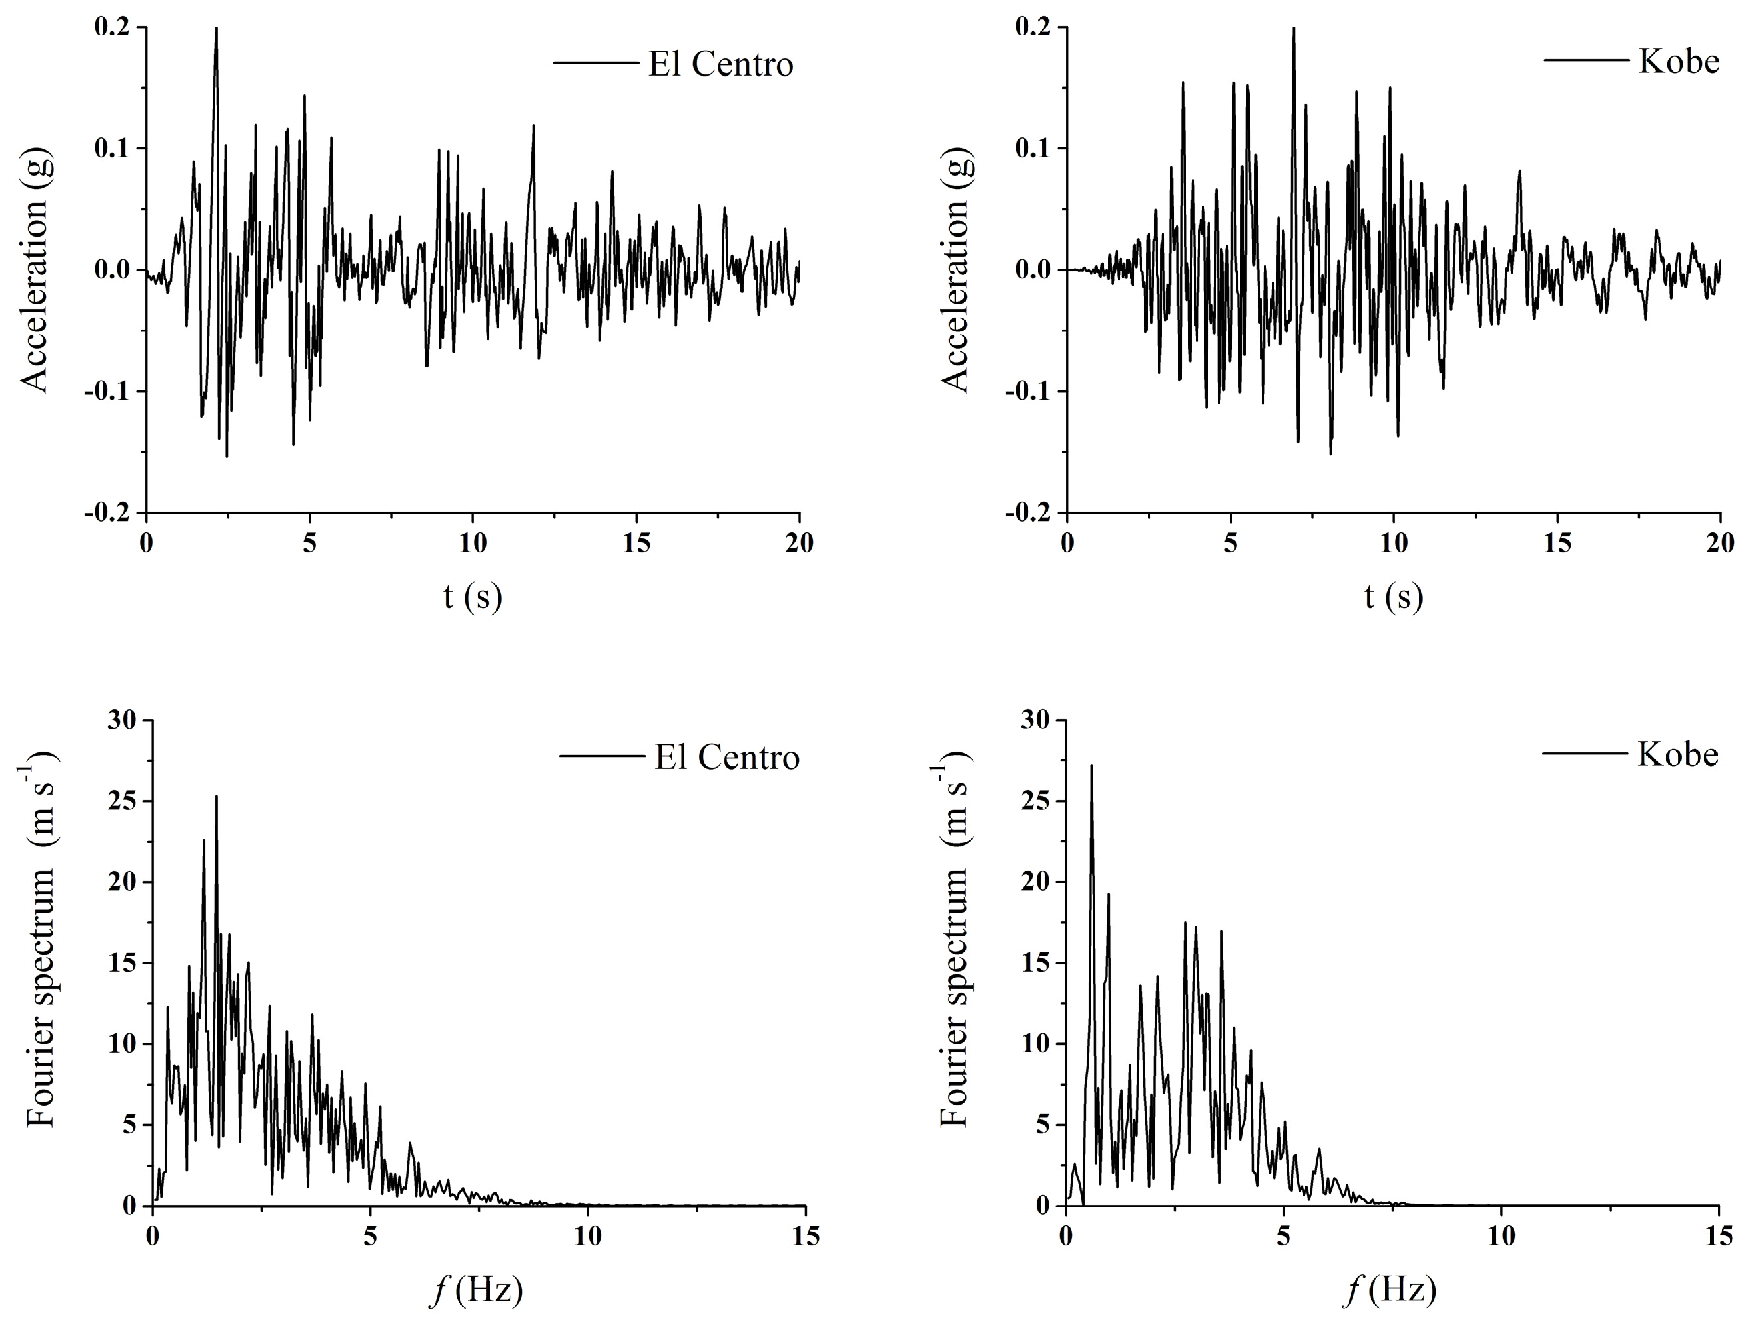
Two representative natural ground motion time histories, the El Centro wave and Kobe wave, are selected for the input seismic wave of the basement. In order to enhance the calculation efficiency, the time window of the input base time history is reduced; the first 20 s of the time history curve is intercepted and retained; and the amplitude is scaled at the same time. The two peak values of seismic-wave input are adjusted to 0.20 g, which can simulate the seismic response under the action of a medium-strength earthquake. The acceleration time history curve and the Fourier spectrum of the El Centro wave and Kobe wave adjusted by the peak value and duration are given in Fig. 2.
4.2 Effect of overlying seawater and soft soil on the peak acceleration and amplification coefficient
Taking the El Centro wave and Kobe wave as the basic input, the SV wave and P wave are used respectively, and the finite-difference method introduced in Sect. 1 is used to carry out the numerical simulation of two-dimensional free-field seismic response analysis. The peak acceleration of ground motion at point A of the surface and seabed surface of four groups of the free-field models is calculated. At the same time, we define a peak amplification coefficient β, which is expressed as the ratio of the surface peak ground acceleration PGAsurface to the base input peak ground acceleration of PGAbedrock, i.e.,
Then, we get the peak acceleration and peak amplification coefficient of point A, as showed in Table 2 and Table 3.
Table 2Surface peak ground acceleration PGAsurface of monitoring point A (unit: g).
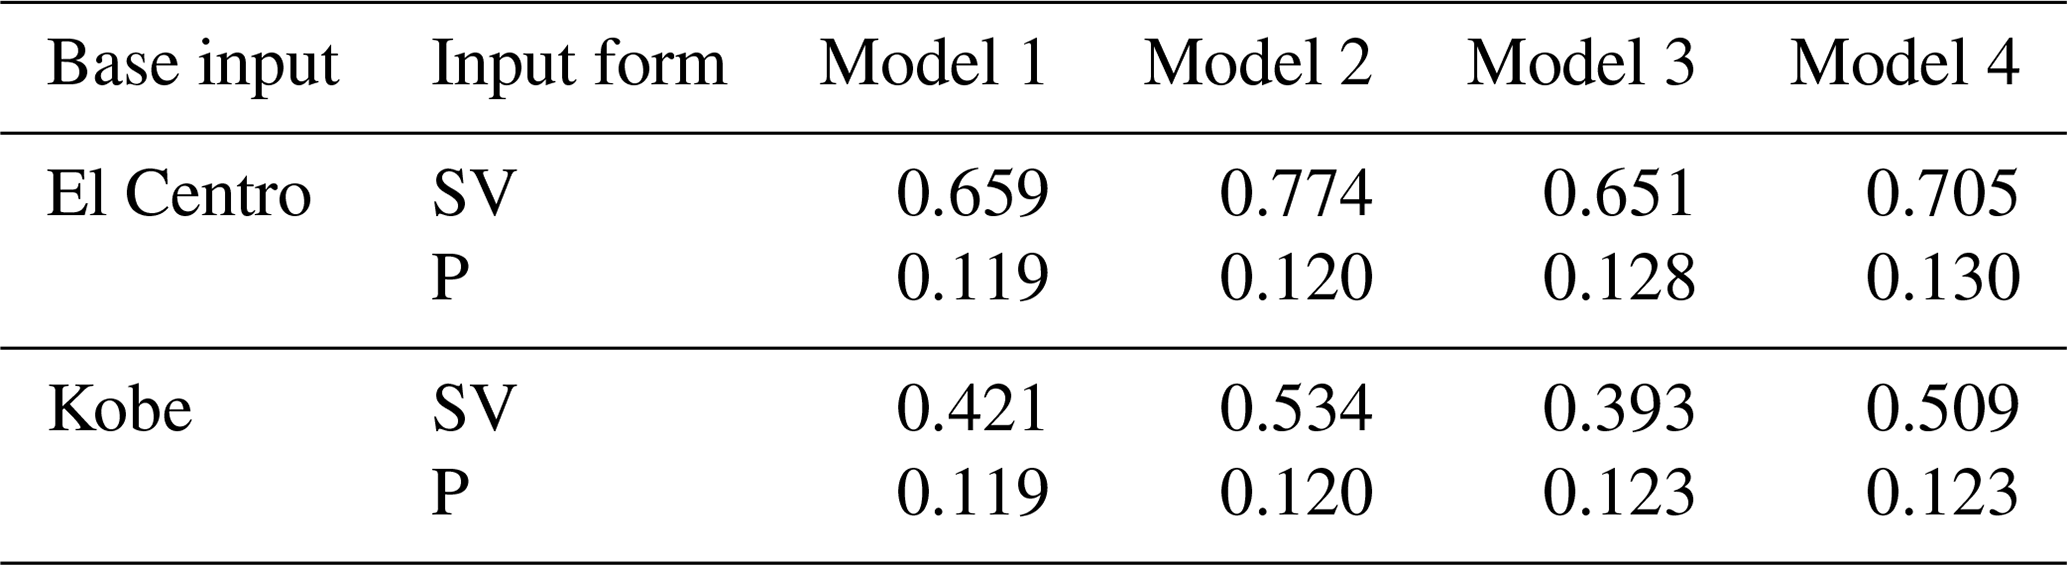
Table 3Peak amplification coefficient β of monitoring point A.
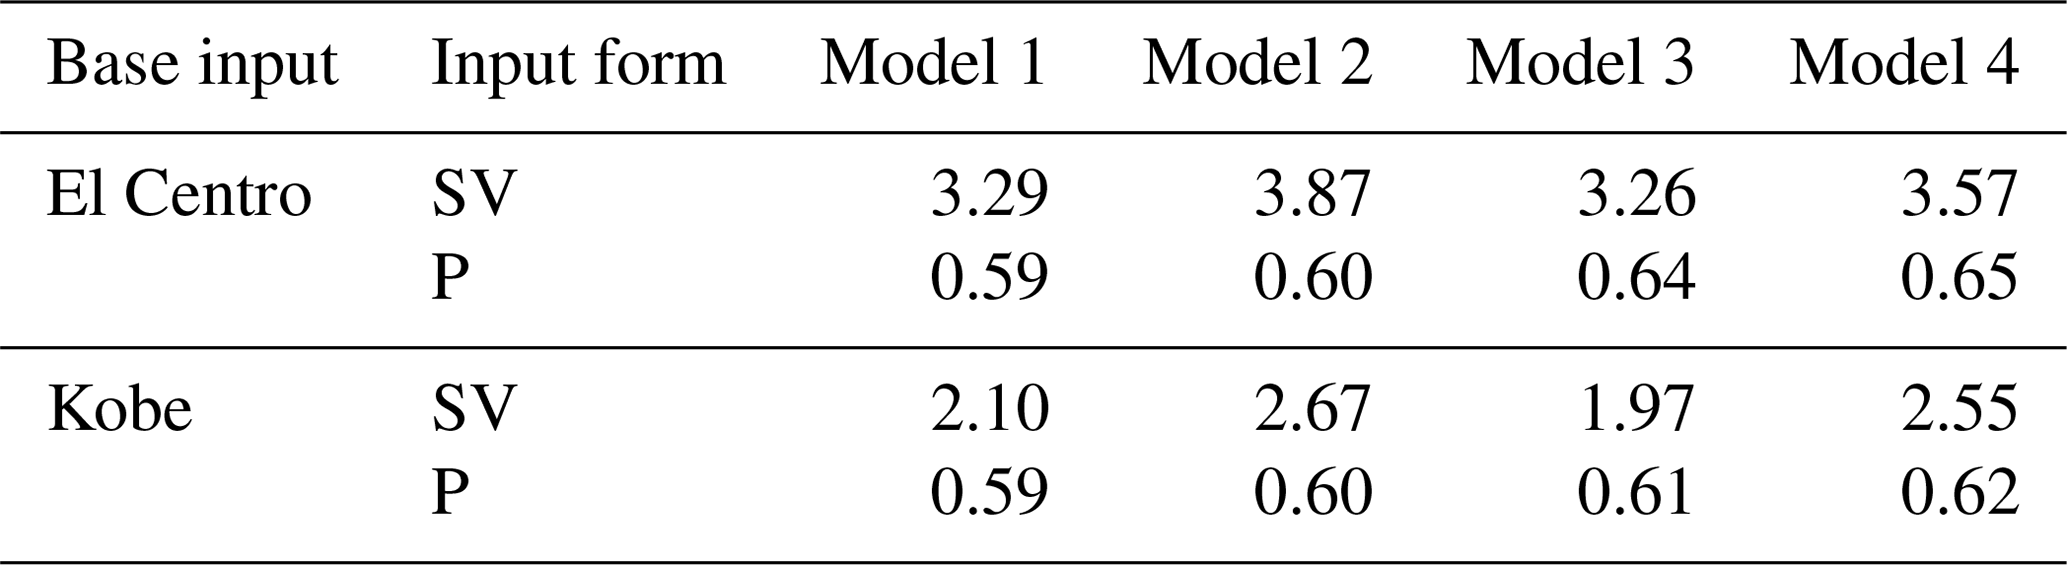
It can be seen from the above results that when the seismic wave is input at the base in the form of an SV wave, the peak acceleration and amplification coefficient β of point A of the four calculation models is obviously different. The results of the largest peak value and amplification coefficient to the smallest are as follows: the land model with surface soft soil, followed by the sea model with surface soft soil, then the land model and finally the sea model. Therefore, it can be concluded that the surface soft soil can amplify the peak acceleration of the surface and the seabed surface, while the overlying seawater can significantly reduce the ground motion. It can also be seen from the results in Tables 2 and 3 that under the same set of calculation model conditions, the calculation results for the El Centro wave as the basic input are higher than those with the Kobe wave input.
When the seismic wave is input as a base in the form of a P wave, the peak acceleration and amplification coefficient β of point A of the four calculation models is almost the same. The main reason for this phenomenon may be that the overlying seawater and the self-weight of the soil layer restrain the seismic response and amplification effect of the P wave as vertical input. At the same time, because of the property of P waves and the direction of vibration propagation, the vertical seismic action of a P wave is small. However, the SV wave is a horizontal input and perpendicular to the propagation direction, which can cause soil shear deformation. Furthermore, it can also be shown that in the seismic design and time history analysis of practical projects, the shear effect of horizontal ground motion is still the primary consideration and demands attention.
4.3 Effect of overlying seawater and soft soil on the acceleration response spectrum
After calculation and analysis, the acceleration response spectra of four groups of free-field models at point A of the surface and seabed surface under the input of the El Centro wave and Kobe wave in the form of P and SV waves are given, as shown in Figs. 3 and 4.

Figure 3Acceleration response spectrum of point A of four free-field models in the form of SV input.
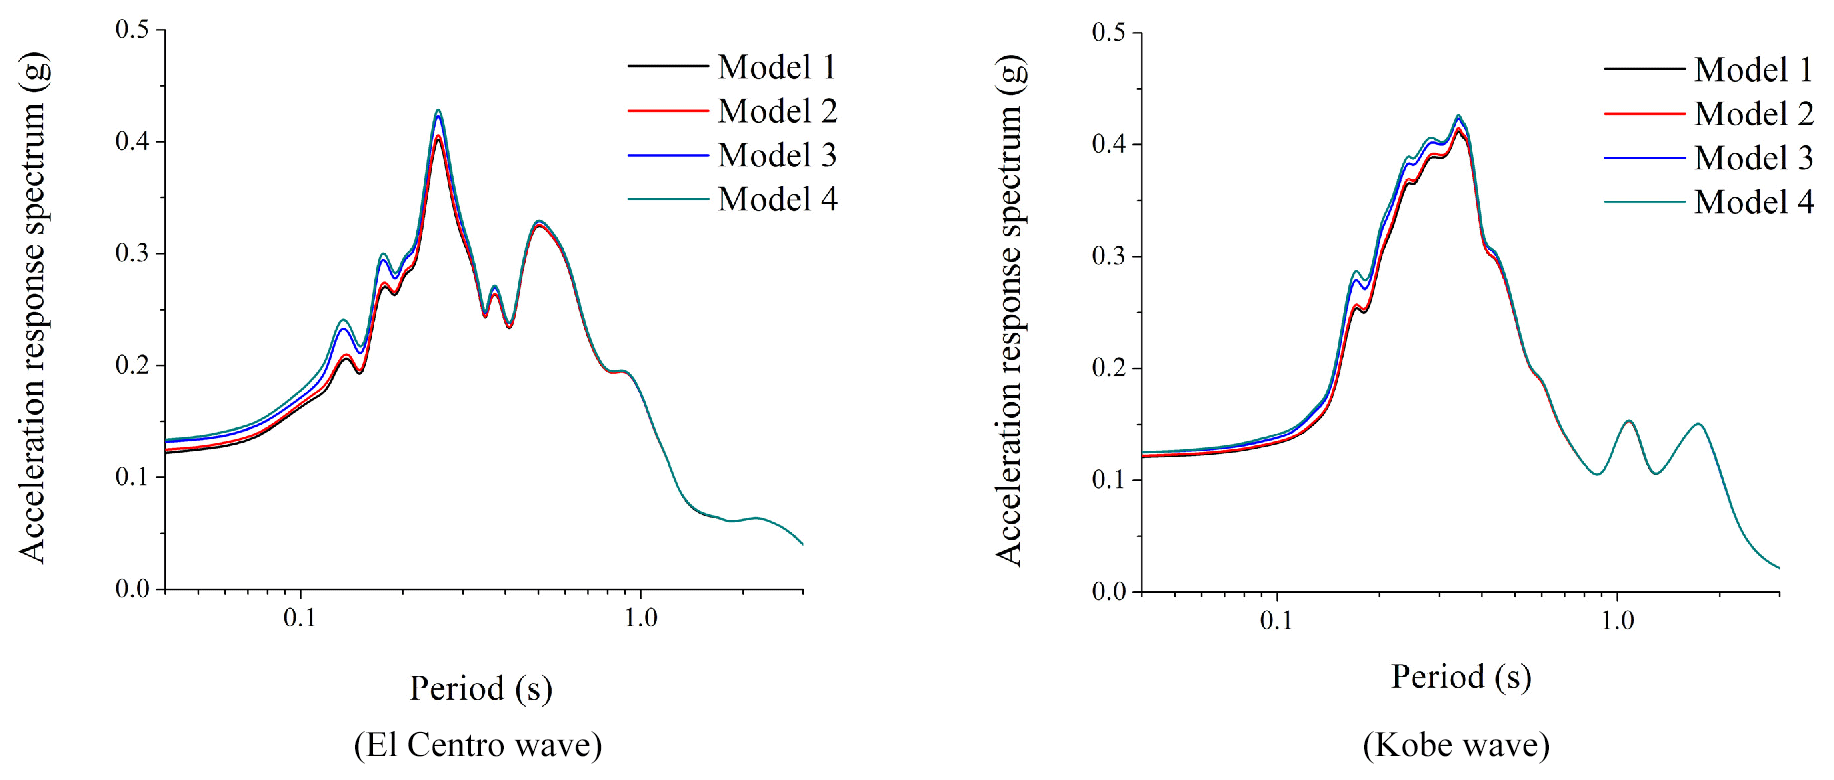
Figure 4Acceleration response spectrum of point A of four free-field models in the form of P-wave input.
It can be seen from Fig. 3 that when the El Centro wave is input in the form of an SV wave, the acceleration response spectrum reaches the maximum value when the period is 0.6 s; the acceleration response spectrum results of the two groups of sea free-field models are generally higher than those of the land model; and the response spectrum results of model 4 are slightly higher than those of model 3. When the Kobe wave is input in the form of an SV wave, there are two obvious peaks in the acceleration response spectrum, and the long-period components of the acceleration response spectrum of the two groups of sea free-field models are generally higher than that of the land model.
In order to investigate the amplification effect of the surface acceleration response spectrum in each period, the result of the acceleration response spectrum is divided by the base input response spectrum, and the result of the response spectral ratio is obtained, as shown in Figs. 5 and 6, in which the input form of ground motion in Fig. 5 is an SV wave and the input form of base ground motion in Fig. 6 is a P wave.

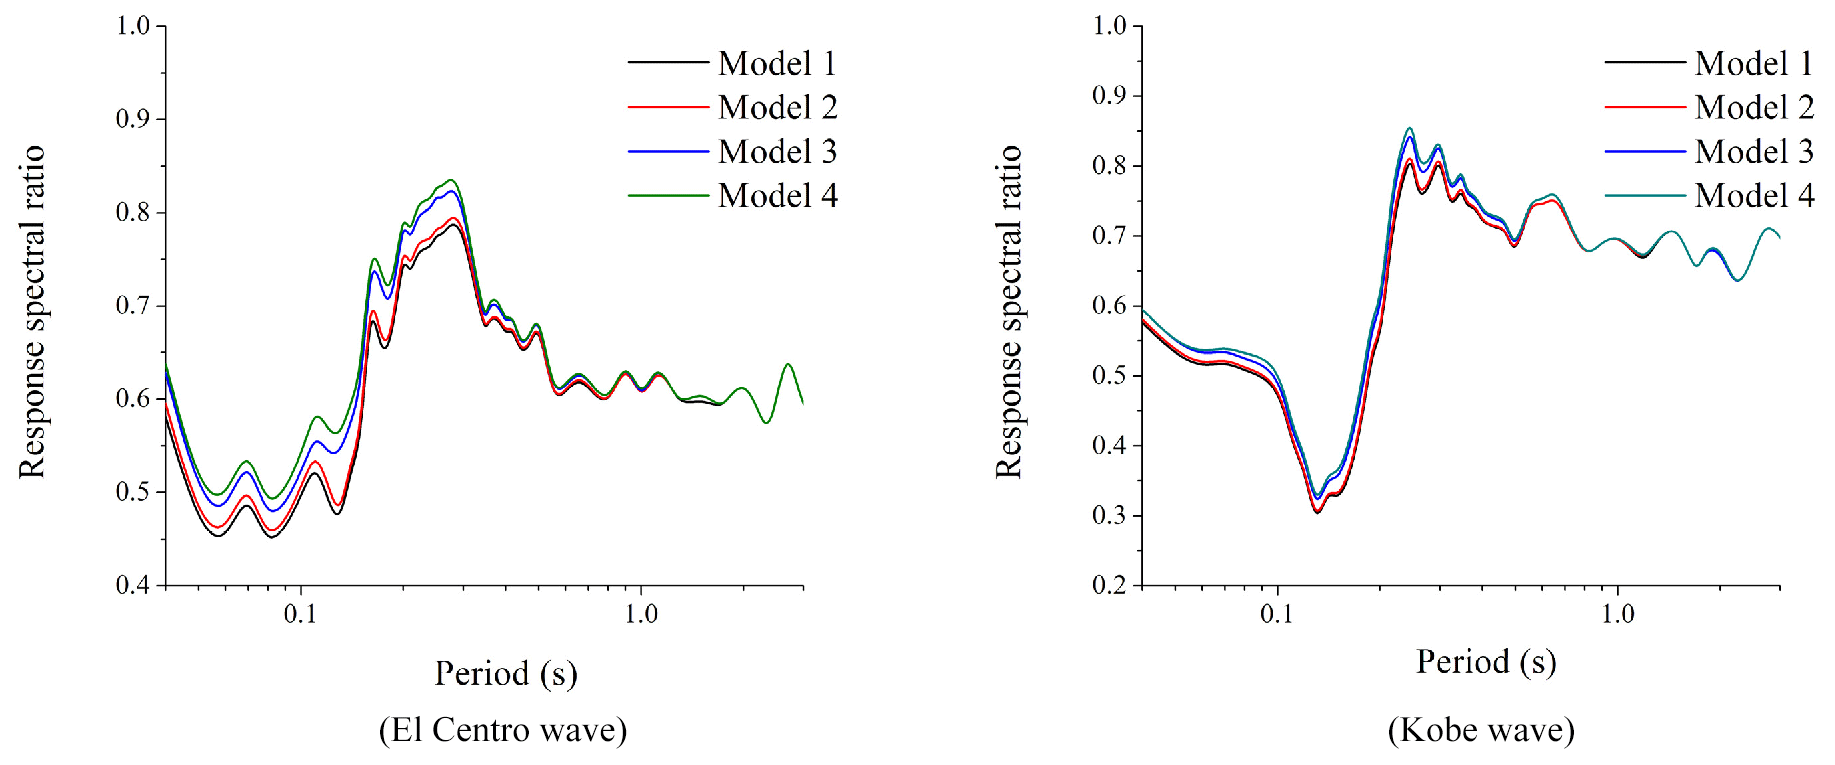
According to Figs. 3 and 5, it can be found that the maximum value of the reaction spectral ratio appears at the periodic point of the maximum value of the response spectrum for the SV wave as input; the amplification effect is very obvious; and the maximum amplification factor is about 8 to 10. As the result of the input form of P waves, we find that the period of the maximum acceleration response spectrum of Fig. 4 is inconsistent with that of the maximum response spectral ratio of Fig. 6, and the result of the response spectral ratio shows an undulating shape. Generally speaking, the surface response spectrum is not magnified compared with the base response spectrum and shows a shrinking result in each period.
4.4 Variation trend of the amplification effect of ground motion along depth
In order to analyze the propagation characteristics and attenuation law of seismic waves from the bottom of a typical free field to the surface, in addition to monitoring point A of the surface and seabed surface, monitoring calculation points are set every 10 m for the above four groups of free-field models, and the relationship curve of peak acceleration of four groups of free-field models with the depth of soil layer is given. Figure 7 shows the results of SV-wave input, and Fig. 8 shows the results of P-wave input result. It can be seen from Fig. 7 that the peak acceleration of the ground motion from the bottom to the surface decreases first and then increases, which shows that the ground motion changes at 50 m underground and generally enlarges at the surface, as shown in Table 4. At the same time, Fig. 7 also shows that the peak acceleration difference of four groups of free-field models under the surface of 10 m is small. Because there is no difference in the calculation parameters and physical and mechanical properties of the calculated model site soil, it shows that under the input condition of an SV wave, the impact of the overlying seawater and surface soft soil layer on the peak acceleration of ground motion under the surface is small.
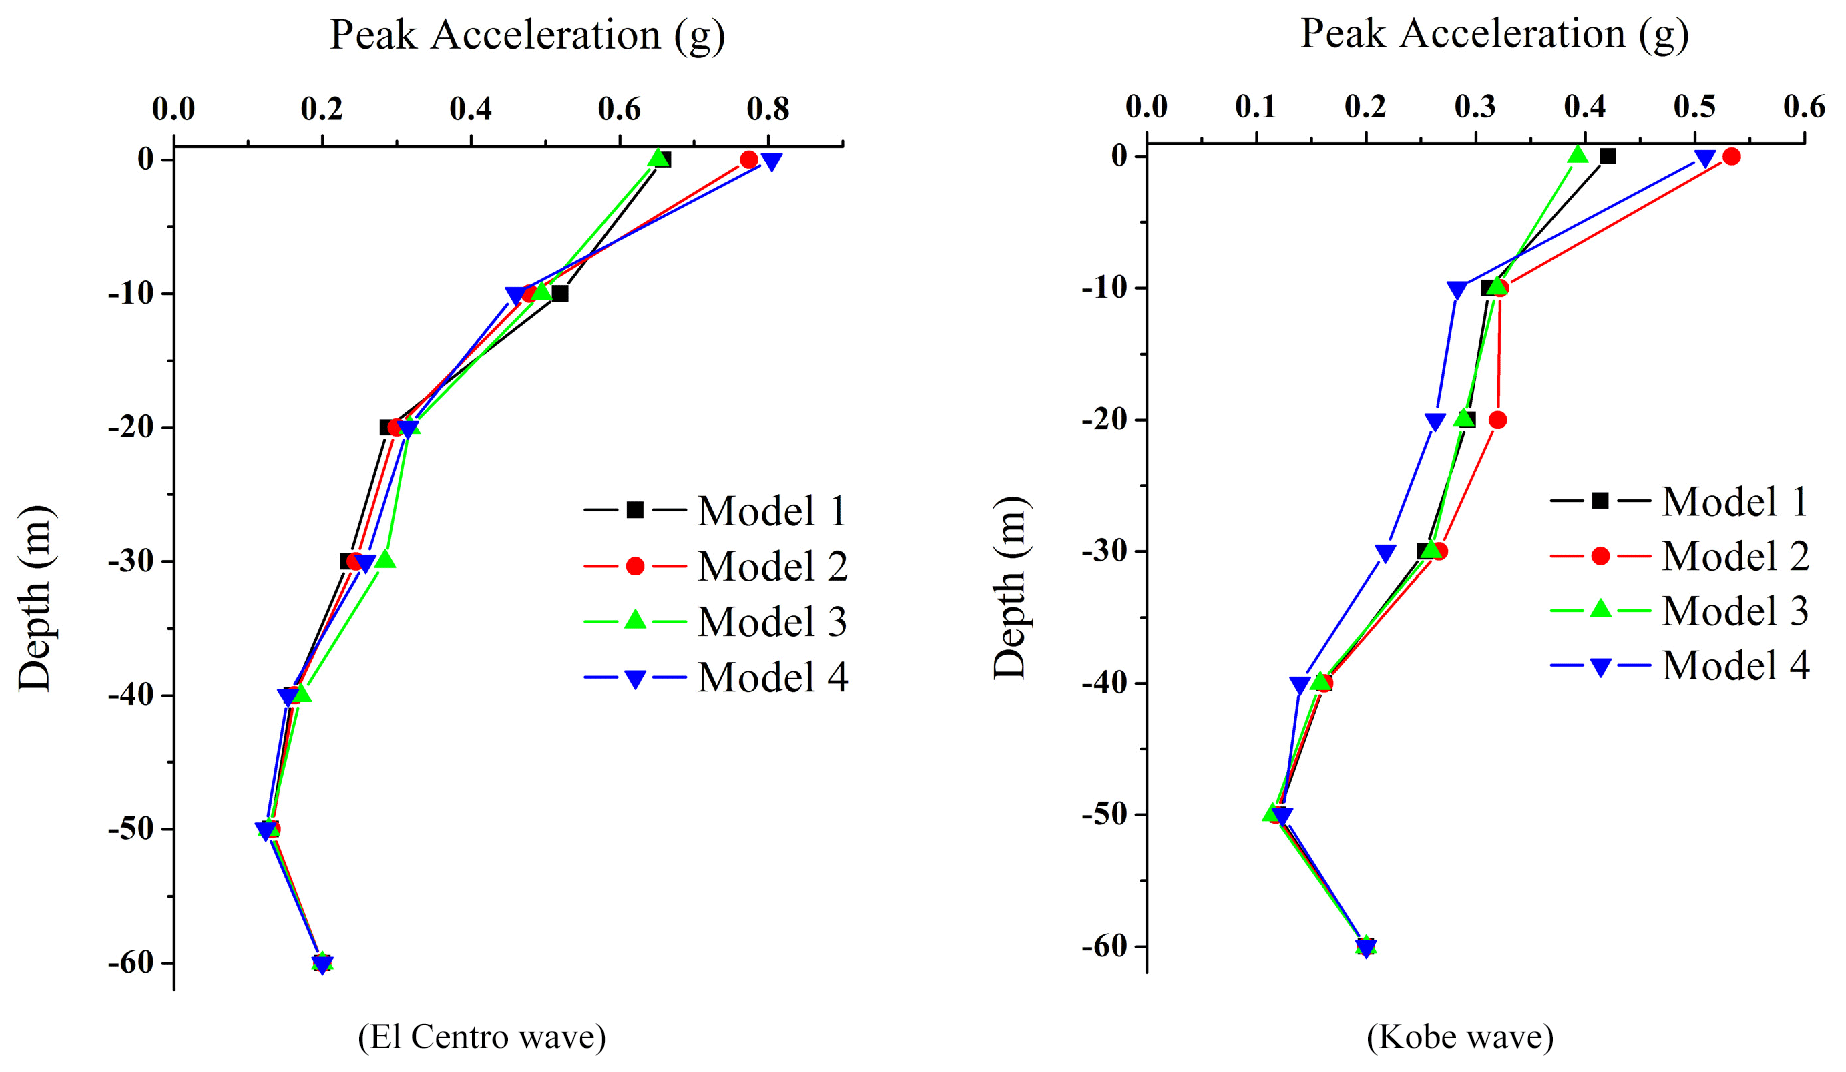

For the case of P-wave input, the difference of peak acceleration among the four groups of free-field models is small, and the peak acceleration decreases first and then increases from the bottom to the surface, which shows that there is a change at 50 m underground and shows a reduction effect on the surface as a whole. Similarly, under the condition of P-wave input, the effect of the overlying seawater and soft soil layer on the peak acceleration of ground motion under the surface is unimportant.
In this paper, FLAC3D is used to construct four sets of typical free-field calculation models. Natural seismic waves of SV and P waves are used as the base input, and the finite-difference method is used to carry out two-dimensional seismic response analysis. Four sets of calculation results of the peak acceleration and acceleration response spectrum of a typical free field are obtained, and the following preliminary conclusions are summarized:
-
When the seismic wave is input in the form of an SV wave, the surface soft soil can amplify the peak acceleration of the surface and seabed surface, while the overlying seawater can significantly reduce the ground motion. When the seismic wave is newly input as a base in the form of P waves, the effect of overlying seawater and soft soil on the peak acceleration of the surface and seabed surface is small and can be ignored.
-
When the El Centro wave is input as the base in the form of an SV wave, the acceleration response spectrum results of the two groups of sea free-field models are generally higher than those of the land model, and the response spectrum results of model 4 are slightly higher than those of model 3. When the Kobe wave is input as the base in the form of an SV wave, the long-period component of the acceleration response spectrum of the two groups of sea free-field models is generally higher than that of the land model. Similar to the peak acceleration results, when the seismic wave is input in the form of P waves, the difference between the four groups of free-field models is small.
-
The peak acceleration decreases first and then increases from the bottom to the surface. In addition to the results of the peak acceleration of the surface, the peak acceleration difference between the layers of the underground obtained by each model is not obvious. For the input of an SV wave, the overlying seawater and soft soil layer have little effect on the peak acceleration of ground motion below the surface and show an amplification effect on the whole at the surface. For the P-wave input, the difference of peak acceleration between the underground layers is small, and the effect of reduction on the surface is overall.
In conclusion, the comparative analysis of the two-dimensional seismic response analysis results of four typical free-field models shows that the overlying seawater and the surface soft soil layer have certain influence on the ground motion, which is an important factor that cannot be ignored in the actual engineering seismic design analysis and checking of calculations. Therefore, the conclusion of this paper is helpful for improving the understanding of the dynamic characteristics of saturated soft soil and the amplification effect of site ground motion and has certain reference value for the seismic design of sea area engineering.
The FLAC3D computing scripts used for the present study are available on https://github.com/wywwgk/Study-on-the-influence-of-the-seafloor-soft-soil-layer-on-seismic-ground-motion/blob/main/code of FLAC3D (Lan et al., 2021).
The data used to support the findings and results of this study are available from the corresponding author upon request.
All authors (JiL, JuL and XS) contributed to this paper. JiL and JuL discussed and wrote the initial draft of the paper. JuL collected calculating data and established the different models. JiL and XS ran the simulations, formal analysis and data curation. JiL made all the figures and prepared the writing with contributions from all co-authors.
The authors declare that they have no conflict of interest.
This research has been supported by the National Natural Science Foundation of China (grant no. 51408559) and the Guangxi Natural Science Foundation (grant no. 2018GXNSFAA281183).
This paper was edited by Maria Ana Baptista and reviewed by two anonymous referees.
Bardet, J. P. and Tobita, T.: NERA, A computer program for nonlinear earthquake site response analyses of layered soil deposits, Department of Civil Engineering, University of Southern California, 2001.
Bardet, J. P., Ichii, K., and Lin, C. H.: EERA, A computer program for equivalent-linear earthquake site response analyses of layered soil deposits, Department of Civil Engineering, University of Southern California, 2000.
Boore, D. M. and Smith, C. E.: Analysis of earthquake recordings obtained from the Seafloor Earthquake Measurement System (SEMS) instruments deployed off the coast of southern California, B. Seismol. Soc. Am., 89, 260–274, 1999.
Celebi, M.: Topographical and geological amplification: case studies and engineering implications, Structural Safety, 10, 199–217 https://doi.org/10.1016/0167-4730(91)90015-2, 1991.
Chen, B.: Characteristics of Offshore Ground Motions and Seismic Response Analysis of Sea-crossing Bridges. Ph.D. Thesis, Dalian Unversity of Technology, Dalian, 2016
Fan, S., Shi, Y., Liu, C., and Li, W.: Simulation of spatially varying seafloor ground motions with random seawater layer and complex terrain, Soil Dyn. Earthq. Eng., 111, 110–118, https://doi.org/10.1016/j.soildyn.2018.02.007, 2018.
Hashash, Y. M. A. and Park, D.: Non-linear one-dimensional seismic ground motion propagation in the Mississippi embayment, Eng. Geol., 62, 185–206, https://doi.org/10.1016/S0013-7952(01)00061-8, 2001.
He, C., Wang, J., Zhang, C., and Jin, F.: Simulation of broadband seismic ground motions at dam canyons by using a deterministic numerical approach, Soil Dyn. Earthq. Eng., 76, 136–144, https://doi.org/10.1016/j.soildyn.2014.12.004, 2015.
Huang, Y., Ye, W., and Chen, Z.: Seismic response analysis of the deep saturated soil deposits in Shanghai, Environ. Geol., 56, 1163–1169, https://doi.org/10.1007/s00254-008-1216-1, 2009.
Idriss, I. M. and Sun, J. I.: SHAKE91: A computer for conducting equivalent linear seismic response analyses of horizontally layered soil deposits, Department of Civil and Environmental Engineering, University of California Davis, 1992.
Kubo, H., Nakamura, T., Suzuki, W., Dhakal, Y. P., Kimura, T., Kunugi, T., Takahashi, N., and Aoi, S.: Ground-Motion Characteristics and Nonlinear Soil Response Observed by DONET1 Seafloor Observation Network during the 2016 Southeast Off-Mie, Japan, Earthquake, Bull. Seismol. Soc. Am., 109, 976–986, https://doi.org/10.1785/0120170296, 2019.
Lan, J., Liu, H., and Lyu, Y.: Dynamic nonlinear parameters of soil in the Bohai Sea and their rationality, Journal of Harbin Engineering University, 33, 1079–1085, https://doi.org/10.3969/j.issn.1007-7043.201202036, 2012.
Lan, J., Liu, J., and Song, X.: The FLAC3D code of the NHESS paper, GitHub, available at: https://github.com/wywwgk/Study-on-the-influence-of-the-seafloor-soft-soil-layer-on-seismic-ground-motion/blob/main/code of FLAC3D, 2021.
Meng, J.: Earthquake ground motion simulation with frequency-dependent soil properties, Soil Dyn. Earthq. Eng., 27, 234–241, https://doi.org/10.1016/j.soildyn.2006.07.002, 2007.
Nakamura, T., Nakano, M., Hayashimoto, N., Takahashi, N., Takenaka, H., Okamoto, T., Araki, E., and Kaneda, Y.: Anomalously large seismic amplifications in the seafloor area off the Kii peninsula, Mar. Geophys. Res., 35, 255–270, https://doi.org/10.1007/s11001-014-9211-2, 2014.
Petukhin, A., Iwata, T., and Kagawa, T.: Study on the effect of the oceanic water layer on strong ground motion simulations, Earth Planet, Space, 62, 621–630, https://doi.org/10.5047/eps.2010.07.014, 2010.
Streeter, V. L., Wyliem, E. B., and Richart, F. E.: Soil motion computation by characteristic method, J. Geotech. Eng. Div., 100, 247–263, 1974.
Wang, S. and Hao, H. Effects of random variations of soil properties on site amplification of seismic ground motions, Soil Dyn. Earthq. Eng., 22, 551–564, https://doi.org/10.1016/S0267-7261(02)00038-6, 2002.
Wang, Z., Carpenter, N. S., and Woolery, E. W.: Horizontal-to-vertical spectral ratio of S-waves and SH-wave transfer functions at the vertical seismic and strong-motion arrays in the central United States, J. Appl. Geophys., 162, 64–71, https://doi.org/10.1016/j.jappgeo.2018.10.017, 2019.
Yang, J.: Saturation effects on horizontal and vertical motions in a layered soil–bedrock system due to inclined SV waves, Soil Dyn. Earthq. Eng., 21, 527–536, https://doi.org/10.1016/S0267-7261(01)00015-X, 2001.
Yang, J. and Sato, T.: Influence of water saturation on horizontal and vertical motion at a porous soil interface induced by incident SV wave, Soil Dyn. Earthq. Eng., 19, 339–346, https://doi.org/10.1016/S0267-7261(00)00023-3, 2000.
Zhang, D., Xie, W., and Pandey, M. D.: Synthesis of spatially correlated ground motions at varying sites based on vector-valued seismic hazard deaggregation, Soil Dyn. Earthq. Eng., 41, 1–13, https://doi.org/10.1016/j.soildyn.2012.04.009, 2012.
Zhang, K., Zhao, C., and Li, W.: Study of the seismic response of the seafloor ground containing soft soil, Rock Soil Mech., 40, 2456–2468, https://doi.org/10.16285/j.rsm.2018.1165, 2019.
- Abstract
- Introduction
- Brief introduction of the seismic response method based on the finite-difference method
- Dynamic calculation model
- Analysis of numerical simulation results of earthquake response
- Conclusions
- Code availability
- Data availability
- Author contributions
- Competing interests
- Financial support
- Review statement
- References