Application of Phase-Only Correlation to Travel-Time Determination in GNSS-Acoustic Positioning
 Chie Honsho
 Motoyuki Kido
 Toshihito Ichikawa3
  Toru Ohashi
 Taichi Kawakami
 Hiromi Fujimoto
- 1Research Center for Prediction of Earthquakes and Volcanic Eruptions, Graduate School of Science, Tohoku University, Sendai, Japan
- 2International Research Institute of Disaster Science, Tohoku University, Sendai, Japan
- 3Kaiyo Denshi Co., Ltd., Tsurugashima, Japan
The GNSS-acoustic technique is a geodetic method for oceanic areas that combines GNSS positioning of a sea-surface platform and acoustic ranging of seafloor stations. Its positioning accuracy is typically a few and several centimeters for the horizontal and vertical positions, respectively. For further accuracy enhancement, we examined the errors in travel time, the most fundamental data in acoustic ranging. The reference signal used in our observations is a series of sinusoidal waves modulated by binary phase-shift keying with a maximal length sequence whose auto-correlation has a clear main peak at zero lag. However, cross-correlation between the actual returned signal and reference signal is often accompanied by many large sidelobes and looks very different from the synthetic auto-correlation. As a practical measure, we have chosen empirically one peak among several comparable peaks in the cross-correlation, though that is likely to lead to systematic errors in travel time. In this study, we revealed that a variety of cross-correlation waveform primarily depends on the incident angle of acoustic paths and that sidelobes were significantly reduced by substituting phase-only correlation (POC) for conventional cross-correlation. We therefore developed a template-matching technique using POC for the peak detection. POC templates were prepared by stacking actual POCs with certain ranges of the incident angle for each campaign. In the application of this method to actual data, we achieved successful results of our numerous campaign data to date. We consider that POC is advantageous in identifying the main peak uniquely and performing template matching more robustly, because POC enhances short-period components and thus highlights the timing of phase changes further than conventional cross-correlation.
Introduction
The GNSS-acoustic (GNSS-A) technique is a geodetic method for ocean areas that combines GNSS positioning of a sea-surface platform and acoustic ranging of seafloor stations (Spiess, 1985). The accuracy of GNSS-A positioning has been enhanced with advances in observation technology and is reaching a few and several centimeters for horizontal and vertical positions, respectively (e.g., Ishikawa, 2016; Yokota et al., 2018). The positioning error arises mainly from undersea acoustic ranging rather than the GNSS positioning of a sea-surface platform. The slant range is calculated from the two-way travel time of the acoustic wave and the sound speed of seawater along the ray path. Although the both can have significant errors, the scope of this study is the former, that is, the error in travel time.
Two-way travel times are determined with a resolution of a few microseconds by calculating the cross-correlation between a reference waveform generated by an onboard transducer and a signal returned from a seafloor transponder. A series of sinusoidal waves modulated by binary phase-shift keying with a maximal length sequence (MLS) is often used as the reference signal because its auto-correlation has a clear main peak at zero lag. The cross-correlation between the actual returned signal and the reference signal is, however, often accompanied by large sidelobes and looks very different from the synthetic auto-correlation. Possible causes for the distortion of the cross-correlation are the degradation of the signal due to the frequency and phase characteristics of acoustic devices through electro-acoustic transformation, distortion of the returned signal caused by frequency-dependent absorption in seawater, and reflected waves from the surface of a glass sphere of the seafloor transponder or the ship bottom.
To cope with such ill-distorted cross-correlations, we had to take a semi-empirical approach to the detection of the main peak as follows (Azuma et al., 2016). A variety of cross-correlation waveforms are first classified using the K-means algorithm, and then a representative cross-correlation is chosen as a template for each group. Although several comparable peaks commonly exist in the template waveform, the main peak is chosen empirically from among them. Subsequently, the main peak in other cross-correlations is determined by template matching for each group. Although this approach was developed as a practical measure, the arbitrary and individual choice of the main peak is a serious problem, meaning that the correspondence of the main peak among the groups is not ensured. If a wrong peak is chosen as the reference of a certain group, the same error would arise in the travel times determined from cross-correlations in the group, leading to systematic errors depending on the waveform.
In this study, we revised the present method to determine the main peak more objectively and identically. First, we show that the cross-correlation waveform primarily depends on the incident angle of an acoustic wave to a transponder. This means that various waveforms can be the generality and scope of the method sorted out and related to each other systematically. Second, we demonstrate that the phase-only correlation (POC) has much simpler waveform than the conventional cross-correlation and present a peak detection method based on a template matching technique using POC. Finally, we discuss the generality and scope of the presented method.
Analysis Method
Characteristics of Actual Cross-Correlation
We used a series of sinusoidal waves modulated by binary phase-shift keying with a 7-th order MLS of 27−1 bins for the reference signal (Figure 1A). There are two sinusoids at a frequency of 10 kHz per bin; the signal length thus becomes 25.4 ms. The auto-correlation of the reference signal has a clear maximum peak and a moderate second peak on each side corresponding to the two sinusoids per bin (Figure 1B).
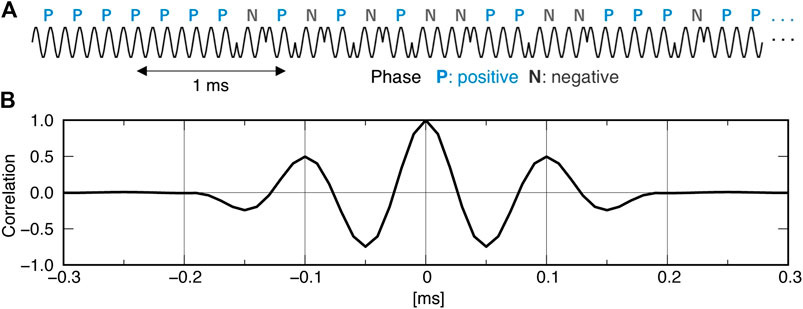
FIGURE 1. Reference acoustic signal used for our GNSS-A observations. (A) Waveform of the beginning 5 ms of the entire, 25.4 ms-long signal. The carrier wave frequency is 10 kHz. (B) Auto-correlation of the reference signal.
As previously mentioned, the actual cross-correlation between the synthetic reference signal and a returned signal is severely distorted and has large sidelobes. However, it has been found that the cross-correlation waveform is strongly related to the incident angle of an acoustic wave to a transponder. Figure 2 shows examples of the cross-correlation of actual signals returned from one seafloor transponder (shown by an orange circle in Figure 2A), obtained while the ship was approaching from a distance (cross labeled “1” in Figure 2A) to above the transponder (labeled “20”). The incident angle, indicated by blue figures, denotes the angle of ship-transponder straight path to the vertical. Although actual ray paths draw a curve according to the structure of the sound speed in seawater, the change of angles due to ray bending is less than 2° and does not affect the classification significantly. When the ship is far and the incident angle is high (>∼40°), cross-correlation has a relatively simple waveform similar to the synthetic auto-correlation (correlogram #1–5 in Figure 2B). However, the subsequent wave groups grow as the incident angle decreases, and become even larger than the first main peak group when the incident angle becomes lower than 30° (correlogram #11 in Figure 2B); they continue to grow as the incident angle decreases further.
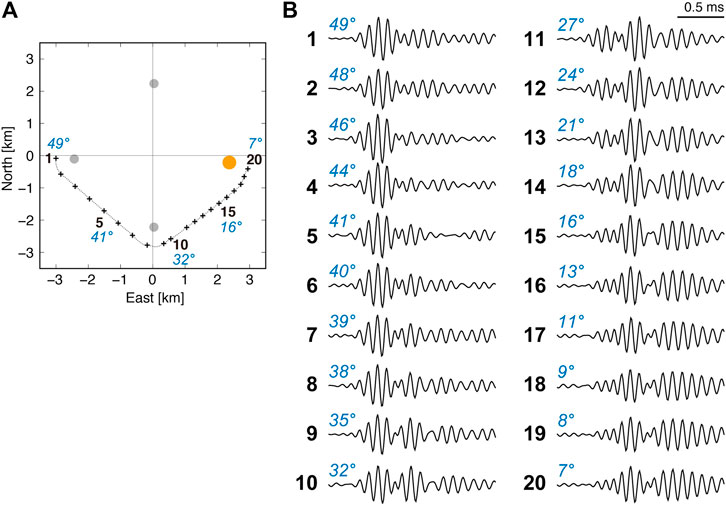
FIGURE 2. Examples of actual cross-correlation between the reference and returned signals. (A) Part of ship tracks (small gray dots) of a campaign in a benchmark, which is settled on the seafloor at ∼4.8 km water depth and consists of four transponders (gray or orange circles) forming a ∼3.3 km square. (B) Cross-correlations of the reference and returned signals from the eastern transponder (orange). The numbers in black bold indicate ship’s positions shown by crosses in (A). The figures in blue indicate incident angles of acoustic waves to the transponder (a vertical acoustic path has 0° incident angle).
We examined the cross-correlation of a number of actual returned signals obtained from different transponders or different onboard transducers and confirmed that the cross-correlation waveform primarily depends on the incident angle in general, although it also depends on the ship (transducer) or water depth to a certain degree. This means that although there are a variety of waveforms, they vary continuously with gradually varying incident angles, and thus the same peak can be tracked from one waveform to another.
Preparation of Cross‐Correlation Templates
As the cross-correlation waveform primarily depends on the incident angle of acoustic waves, we first prepared the templates by stacking cross-correlations with certain incident angle ranges. Figure 3A shows an example set of templates; five-degree bins of incident angle were adequate for our data but the lowest bin was taken 10° wide. A hundred cross‐correlations were stacked to form a template for each incident angle zone; however, in some zones, less than 100 data were available. Signals from all the transponders were used without distinction because no significant difference in waveform among transponders was recognized.
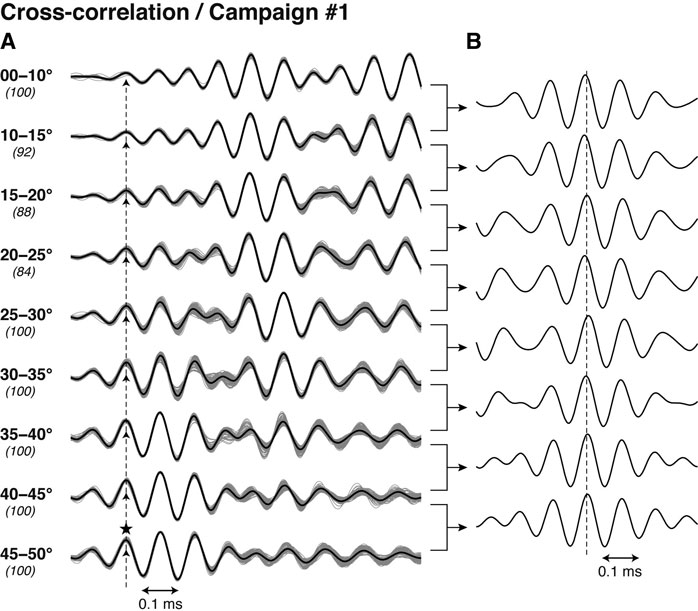
FIGURE 3. Example of cross-correlation templates created from the data of the same campaign as shown in Figure 2. (A) Templates (bold lines) obtained by stacking ∼100 cross-correlation waveforms (gray thin lines) for each zone of incident angle. Figures in bold and italics indicate incident angle ranges and the number of stacked lines, respectively. The main peak was first chosen for the template at the highest incident angle zone (a star on the bottom template). Dashed upward arrows indicate the corresponding peak in the other templates determined in order from higher to lower incident angle zones. (B) Cross-correlation between the adjacent templates. A vertical dashed line indicates position of the zero lag.
As recognized in Figure 2, cross‐correlation has a relatively simple waveform at high (>∼40°) incident angles. First, we chose the first prominent peak in the waveforms at high angles as the true peak to be detected (star on the bottom correlogram in Figure 3A). Then, the corresponding peaks were determined in order from highest to lowest angles (dashed upward arrows in Figure 3A) by calculating the cross-correlation between adjacent templates (Figure 3B). Although it is not the main subject, one may find it strange that the highest peaks slightly deviate from the zero lag in Figure 3B. This is because the templates were finally aligned so that the main peak, which is not necessarily large, should be exactly lined up, while the highest correlation generally occurs at a lag between largest peaks. Generally in our data, the main peak is prominent at high incident angles but diminishes as the incident angle decreases, where, instead, a few subsequent peaks grow at low incident angles. If the continuous variation of waveforms by the incident angle is not correctly considered, a prominent peak behind the true main peak may be wrongly chosen when the incident angle is low. Such systematic error in travel times depending on the incident angle can significantly affect positioning.
When a set of templates is prepared, the main peak in the POC of each returned signal is determined by a template-matching technique for each zone of the incident angle. We prepared a template set for each campaign, that is, for each benchmark and cruise, thereby enhancing the results of template matching. As shown in Figure 3A, the POC waveform is highly similar if the incident angle is similar. Consequently, generally high (>0.9) maxima of the normalized cross-correlation were obtained between a template and an individual POC. The results of template matching are shown in the next section in comparison with those using conventional cross-correlation.
Introducing Phase-Only Correlation
Herein, we introduce the POC, which is widely used as a high-accuracy image matching technique (e.g., Ito et al., 2004) and also came into use in seismic wave identification (Moriya, 2011). Letting
where
POC only has information on the phase difference between
We examined the POCs of the reference and returned acoustic signals and found that its waveform also strongly depends on the incident angle, as it is with the cross-correlation. Therefore, templates of POC can be prepared following the same procedure. Figure 4 shows the resulting POC templates (Figure 4A) and the cross-correlation between the adjacent templates (Figure 4B). Similar to the case of cross-correlation, POC templates also show simpler waveforms at higher incident angles, although they still greatly differ from the delta function, which is expected as a phase‐only auto‐correlation of any function. Nevertheless, the POC waveform is obviously more compact than the conventional cross‐correlation waveform (Figure 3A), which has a large later phase growing in middle‐to‐low (<∼25°) incident angles and forming a long‐winded signal lasting for >1 ms after the true peak. Because it was confirmed that POC is more advantageous for identifying the main peak uniquely than cross-correlation, as will be shown in the next section, we decided to adopt POC for the peak detection.
When a set of templates is prepared, the main peak in the POC of each returned signal is determined by a template-matching technique for each zone of the incident angle. We prepared a template set for each campaign, that is, for each benchmark and cruise, thereby enhancing the results of template matching. As shown in Figure 4A, the POC waveform is highly similar if the incident angle is similar. Consequently, generally high (>0.9) maxima of the normalized cross-correlation were obtained between a template and an individual POC. The results of template matching are shown in the next section in comparison with those using conventional cross-correlation.
Results and Discussion
Comparison With Conventional Cross-Correlation
In our data, the waveform of conventional cross-correlation is generally more distorted and less compact than that of POC. Nevertheless, the cross-correlation templates also worked well regarding that campaign; cross-correlation between adjacent templates has a clear peak (Figure 3B) and thus can uniquely identify the true peak. Nearly the same results of travel-time determination could be obtained regardless of whether cross-correlation or POC was used for the campaign. However, in the analyses of other campaigns, we often experienced a serious problem utilizing cross-correlation: templates have so many (and large) sidelobes that several comparable peaks occur when taking the cross-correlations between templates. Figure 5A shows an example of such problematic templates created using data from another campaign. The templates (the left column) generally have a succession of large peaks, and consequently, the cross-correlation between the templates (the right column) also has several comparable peaks. The maximum peak is not readily apparent because several peaks have nearly the same height. This means that there is uncertainty in matching adjacent templates and that it is less confident whether an identical peak is chosen among the templates. If a wrong peak is chosen for a certain template, this would lead to systematic errors in the travel time obtained with a corresponding incident angle. The same problem also arises in template matching, which brings uncertainty in peak identification by an integral multiple of the wave period. It turned out that such a troublesome waveform of cross-correlation, having successive large peaks, occurred commonly for particular cruises or for benchmarks with relatively small water depths (<∼2,000 m).
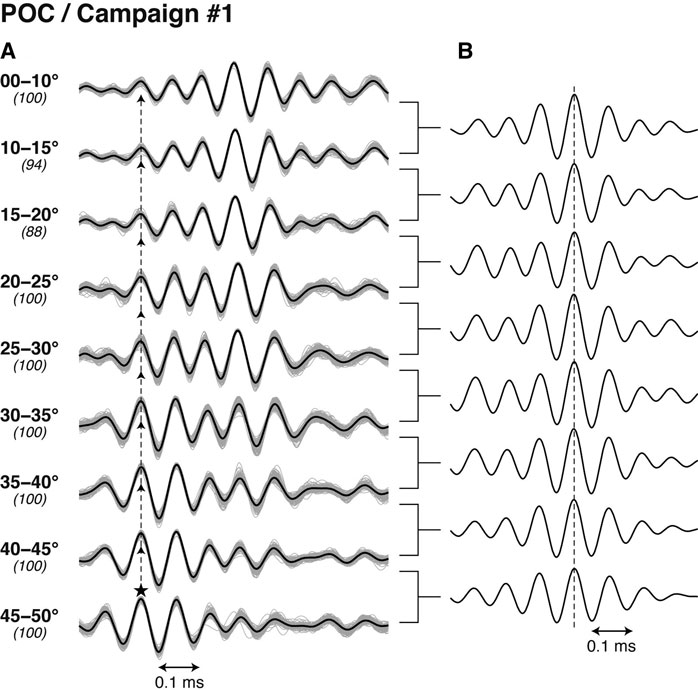
FIGURE 4. POC templates created from the data of the same campaign as shown in Figures 2 and 3. (A) Templates for each zone of incident angle. A vertical dashed line indicates the position of the main peak. (B) Cross-correlation between the adjacent templates. A vertical dashed line indicates position of the zero lag.
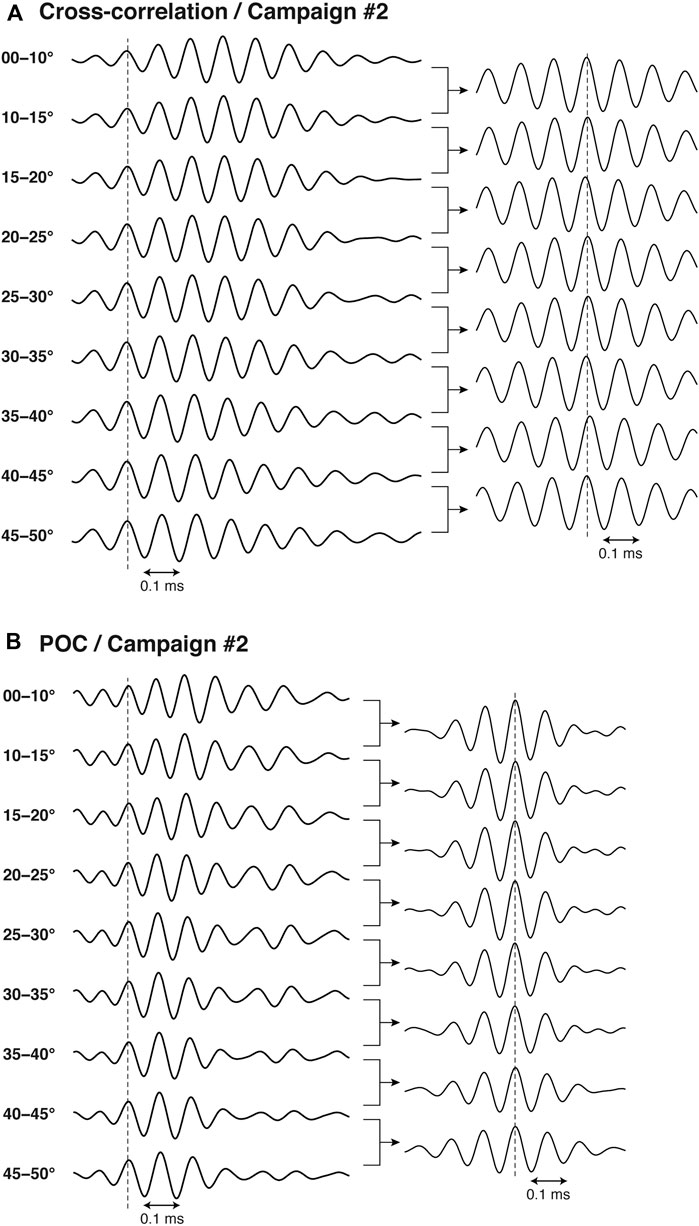
FIGURE 5. Another example of templates using (A) conventional cross-correlation or (B) POC, created for a campaign conducted in a benchmark off the northeast Japan, located ∼2,050 m in water depth. Graphs in the left and right columns are the templates and the cross-correlation between adjacent templates, respectively.
An exceptional advantage of POC is that its waveform remains simple enough to uniquely identify the main peak, even for the previously mentioned cruises or shallow benchmarks. Figure 5B shows the POC templates for the same campaign as Figure 5A; sidelobes are generally reduced in the templates, and the cross-correlation between adjacent templates exhibits a remarkable peak, which ensures that an identical peak is chosen among the templates despite its variation in waveform. Consequently, POC works more stably in template matching. Figure 6 shows the results of template matching for the two campaigns mentioned thus far: the histograms of the maximum peak value of the normalized correlation (left panels: Figures 6A and C) and its difference from that of the second maximum peak (right panels: Figures 6B and D). In general, the maximum correlation using POC templates becomes slightly lower than that using conventional cross-correlation templates (Figures 6A and C), probably because a larger number of sidelobes are likely to result in higher cross-correlation. However, the maximum correlation of POC templates is still high (>∼0.90) enough for template matching. The major advantage of POC is that template matching can be performed more robustly with a higher uniqueness; the differences in normalized correlation between the maximum and 2nd maximum peaks are generally large (>∼0.2) when POC is used (Figures 6B and D) even for Campaign #2, in which nearly comparable (<0.1 in difference) peaks generally appeared when the conventional cross-correlation was used (Figure 6D).
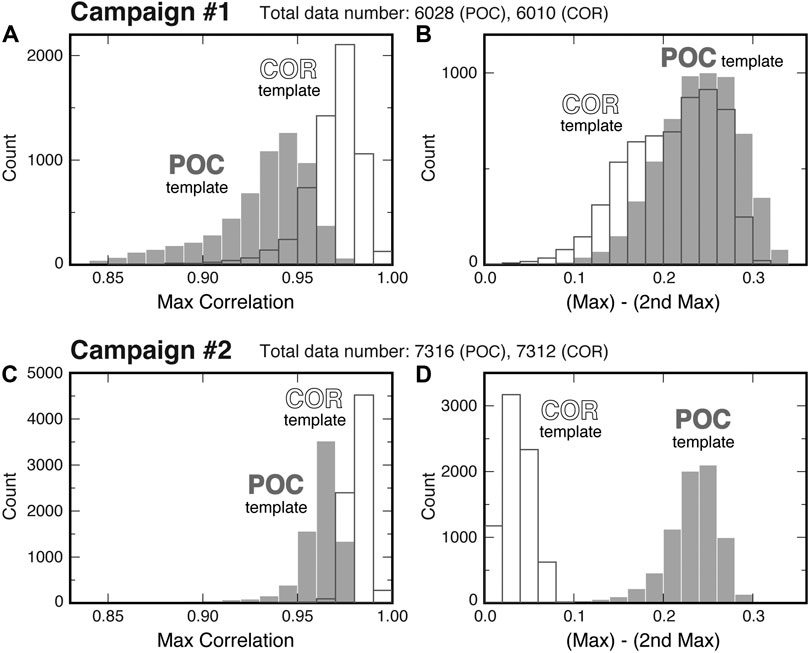
FIGURE 6. Results of template matching for the two campaigns. (A) Histograms of values of the maximum peak of normalized correlation obtained using the POC template (gray bars) or the conventional cross-correlation template (white bars) for Campaign #1. (B) Histograms of differences between the maximum and second maximum peak values for Campaign #1. Bar colors mean the same as (A). (C) and (D) show the same as (A) and (B), respectively, but for Campaign #2.
In Figure 7A, we compared travel times of Campaign #2 determined using the cross-correlation templates (Figure 5A) and POC templates (Figure 5B). The differences took discrete values, indicating that different peaks were chosen. It was found that the dominant periods in the cross-correlation or POC were generally 0.08–0.09 ms, though the period of the carrier wave of the reference signal was to be 0.1 ms. Accordingly, the difference took values every ∼0.085 ms. Nearly the same (within 0.03 ms difference) travel times were obtained for only 33% of the total data (Figure 7A). The remaining 67% had differences of −0.4 to +0.1 ms, which correspond to the difference of 1–4 periods. The travel-time difference apparently depends on the transponders (shown by color), indicating that slight difference in the cross-correlation waveform by transponders seriously affected the results of peak detection. Using these two sets of travel-time data, we performed the array positioning analysis (Kido et al., 2006; Honsho and Kido, 2017) and compared the results. Figure 7B shows the resulting travel-time residuals in a time series. When the travel-time data determined with the cross-correlation templates were used (upper panel of Figure 7B), it results in large and scattered residuals as much as ∼0.3 ms (0.15 ms in RMS). On the other hand, when the data determined with the POC templates were used (lower panel), the residuals were greatly reduced to less than ∼0.1 ms (0.04 ms in RMS). This indicates that the travel times determined by the POC were correct. The obtained array positions also differ by 5–6 cm both in the horizontal and vertical components. This example demonstrates that a simple waveform of POC has the advantage of reducing systematic and random errors in travel time arising from the wrong choice of main peak in templates and errors in template matching.
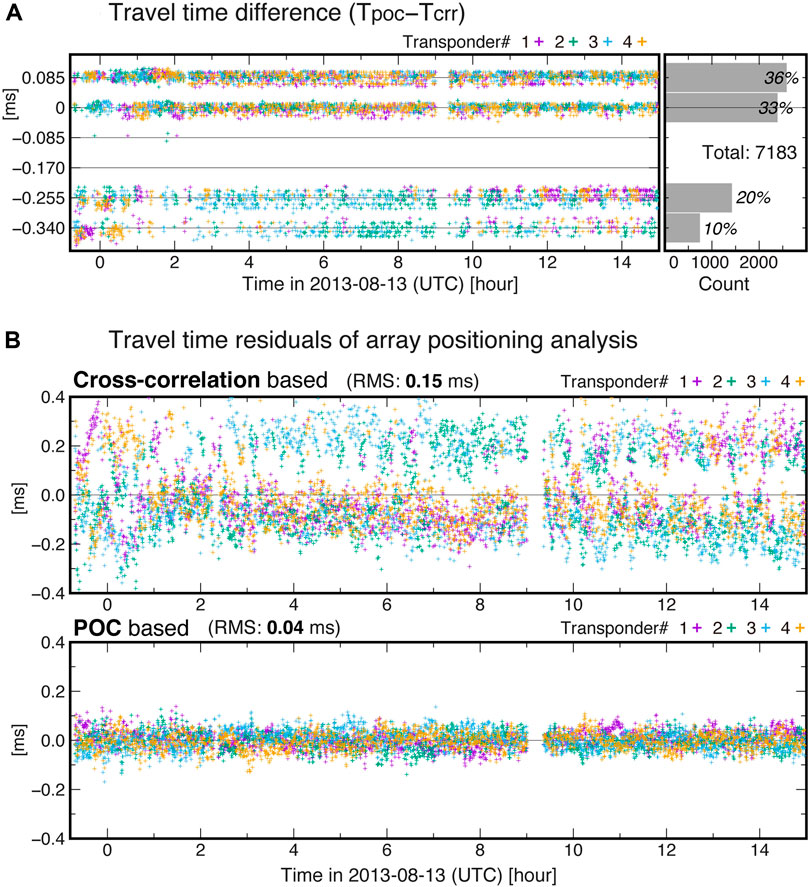
FIGURE 7. Comparison of travel times determined using the cross-correlation and POC templates. (A) Difference of travel times, shown in a time series during the ∼15 h observation period of Campaign #2 (left) and in a histogram (right). There were 4 transponders in the array, which are indicated by color. (B) Travel-time residuals (vertically normalized values) resulting from the array positioning analysis using the travel-time data determined with the cross-correlation (upper) or those with the POC (lower). Color indicates the transponder number.
Generality and Scope of Application of the Method
We have applied the method presented in this study to our data in numerous (>100) campaigns to date and achieved successful results of peak detection. The method is based on the two characteristics actually confirmed: the dependency of cross-correlation or POC waveform on the incident angle, and the superiority of POC to conventional cross-correlation. In this section, we consider their possible reasons to discuss the generality and scope of the method.
Our transponders installed in the seafloor unit are the identical product type, manufactured by Kaiyo Denshi Co., Ltd. (Figure 8). The in-water admittance vs. frequency plot (Figure 8B) shows that the resonance frequency is ∼14.3 kHz, keeping sufficient sensitivity around 10 kHz (Figure 8C: zones 9–11 kHz are shown by yellow filled boxes). On the other hand, onboard transducers were different both in its shape (hemispherical or cylindrical element) and installation (hull-mounted or fixed on the vessel's side) among campaigns, because we have used several vessels. We summarized possible causes for the distortion of acoustic waves in Figure 9A: distortion of emitted (or returning) signals due to degradation of an input signal in electroacoustic transduction and its directivity for the onboard transducer (or seafloor transponder) side, the frequency-dependent attenuation by viscous and chemical absorption in sea water, and superposition of reflected waves from a glass sphere of the seafloor unit. Geometric attenuation is not considered here, because it lessens the signals uniformly without changing the waveform. As measures against the transmission loss, the recording gain of onboard transducers was adjusted according to the water depth at each site, and seafloor transponders were designed to fully amplify acoustic signals when mirroring, and thereby achieving measurable slant ranges up to ∼9 km. Among those causes for the distortion, attenuation through absorption is a general, device-independent process. We simulated deformation of the reference signal through a round trip to a depth of 4 km along a vertical path (Figure 10A), using the equation presented by Ainslie and McColm (1998). Typical depth-profiles of temperature and salinity (Figure 10C), obtained from our oceanographic observations off the northeast Japan, were tentatively used as input to the equation. The result did not significantly differ from the one calculated using the simpler equation by Thorp (1967) which depends only on frequency. Because acoustic waves at higher frequency are more attenuated through absorption, it results in a smoother waveform (black line in Figure 10A) than the original one (gray line). However, it turned out that the correlation was little affected by absorption; the cross-correlation between the original and deformed reference signals (a bold purple line in Figure 10B) differs only slightly from the auto-correlation of the reference signal (a thin purple line). This indicates that the attenuation through absorption does not have a negative effect on its own. However, it may contribute to the deformation of the POC waveform from a spike of the theoretical delta function (a thin green line) to a peak of some width (a bold green line).
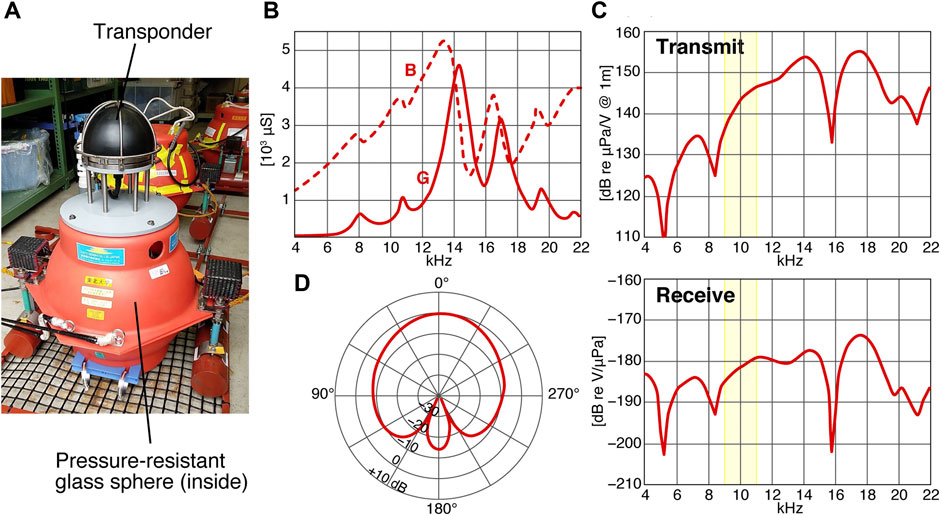
FIGURE 8. Appearance of the seafloor station (A) and product specifications of the transponder: in-water admittance (G: conductance; B: susceptance) vs. frequency (B), transmitting (top) and receiving (bottom) sensitivity (C), and directivity pattern at 10 kHz (D).
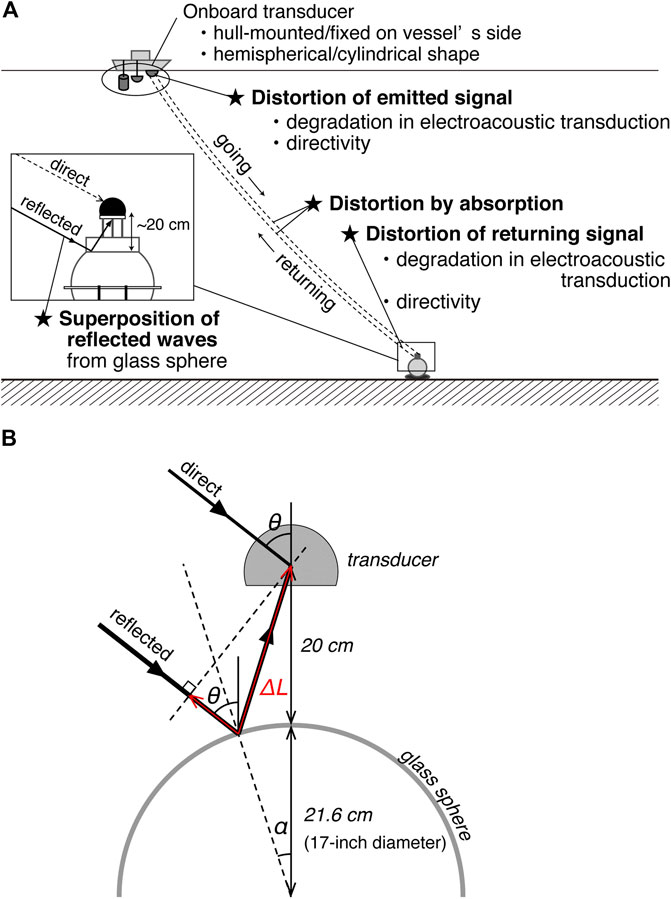
FIGURE 9. Schematic drawing of acoustic ranging. (A) Possible causes for the distortion of acoustic signals. (B) The path of reflected waves from the glass sphere surface. The path length difference
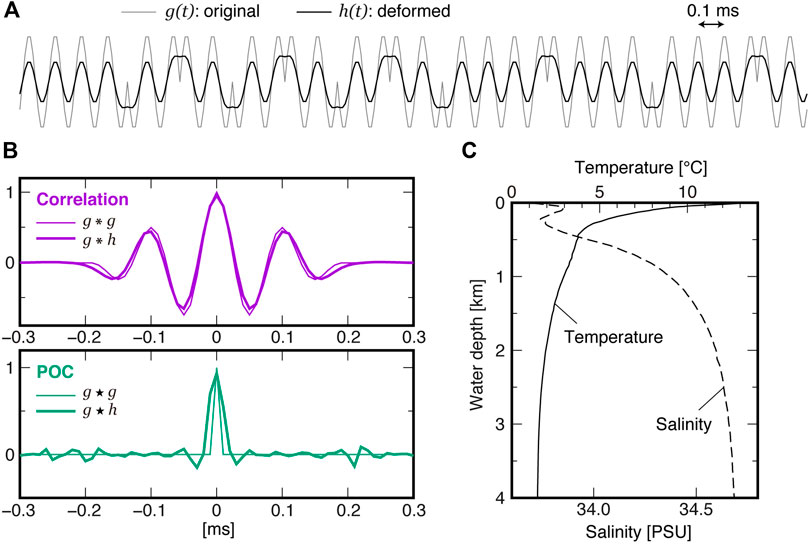
FIGURE 10. Effect of the frequency-dependent signal attenuation by absorption in seawater. (A) A part of the deformed reference signal through a round trip to a depth of 4 km along a vertical path. (B) The cross-correlation (top) and POC (bottom) between the original and deformed signals (bold lines). The auto-correlation of the reference signal is shown by thin lines. (C) Depth-profile of temperature and salinity used for the calculation of the signal attenuation by absorption.
We also examined the effect of reflected waves, because our transponder has wide directivity extending to backward (Figure 8D). We calculated the path of acoustic waves coming with a certain incident angle
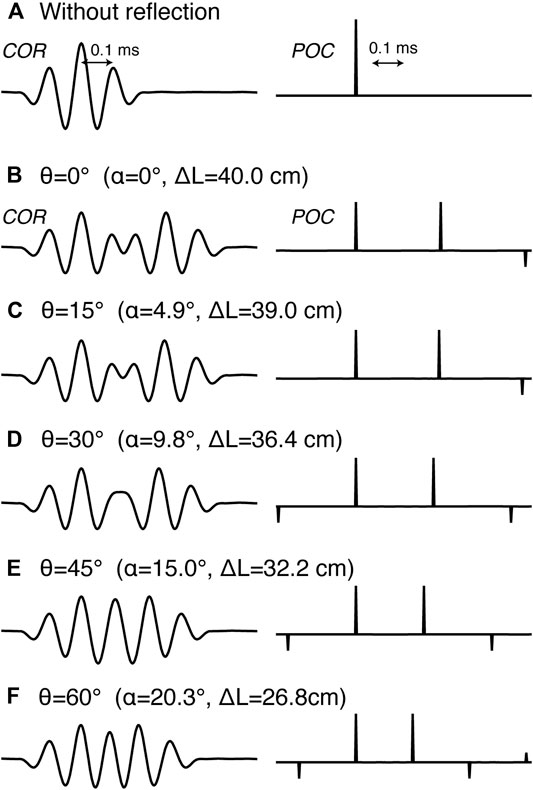
FIGURE 11. Cross-correlation (left) and POC (right) between the reference signal and simulated signals superimposed by reflected waves, calculated for incident angles
We have demonstrated from the actual application examples that POC generally works more effectively than the conventional cross-correlation for peak detection. The formulation of POC (Eq. 2) can be rewritten as
where
This means that POC is a cross-correlation of
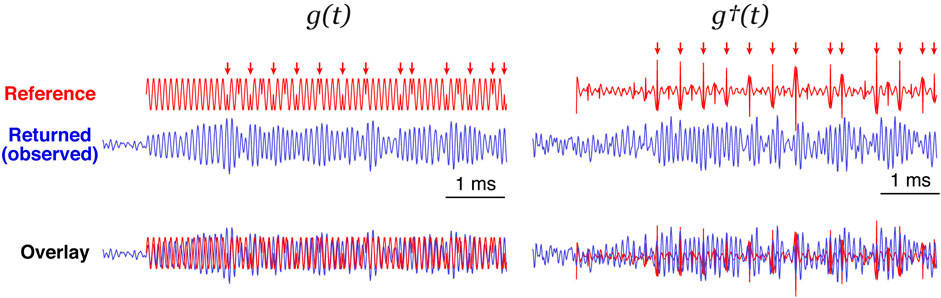
FIGURE 12. Comparison of the original signal g(t) (left) and the transformed one g†(t) obtained by equalizing amplitudes of all period components (right). The reference signal and an example of actual returned signal are shown by red and blue, respectively (the beginning ∼6 ms-long part is shown). Phase shifts in the reference signal are indicated by red arrows. The reference signal is overlaid on the returned signal (bottom) according to the peak detection results.
Conclusion
We examined numerous actual cross-correlations of the reference and returned acoustic signals and revealed that the waveform of cross-correlation strongly depends on the incident angle of the acoustic waves. By following gradual changes in the waveform with continuously varying incident angles, an identical peak can be detected among a variety of waveforms. It is supposed that device-dependent directivity as well as superposition of reflected waves result in the dependency of cross-correlation waveform on the incident angle. We also demonstrated that sidelobes were significantly reduced by taking advantage of the phase-only correlation (POC) instead of the conventional cross-correlation. The simpler waveform of POC gives us the advantage of identifying the main peak uniquely and performing template matching more robustly. Although the distortion of cross-correlation waveform is probably caused by device-dependent degradation of signals, the effectiveness of POC which emphasizes the timing of phase shift would be general as long as employing phase-shift keying pulse compression.
Data Availability Statement
The raw data supporting the conclusions of this article will be made available by the authors, without undue reservation.
Author Contributions
CH and MK designed the study and wrote the manuscript. TI and TO suggested the key idea of utilizing POC. TK and HF continuously supported the study and participated in discussion.
Funding
CH acknowledge financial support from JSPS KAKENHI Grant Number JP19H05596: “Head and tail of massive earthquakes: Mechanism arresting growth of interplate earthquakes”. The research was funded by activity of the Core Research Cluster of Disaster Science in Tohoku University (a Designated National University).
Conflict of Interest
Authors TI, TO, and TK were employed by the company Kaiyo Denshi Co., Ltd.
The remaining authors declare that the research was conducted in the absence of any commercial or financial relationships that could be construed as a potential conflict of interest.
Acknowledgments
We thank F. Tomita for providing us fundamental data of the GNSS-A observations used in this study. All the figures in the manuscript were produced using GMT software, developed by P. Wessel and W. H. F. Smith.
References
Ainslie, M. A., and McColm, J. G. (1998). A simplified formula for viscous and chemical absorption in sea water. J. Acoust. Soc. Am. 103 (3), 1671–1672. doi:10.1121/1.421258
Azuma, R., Tomita, F., Iinuma, T., Kido, M., and Hino, R. (2016). Development and examination of new algorithms of traveltime detection in GPS/acoustic geodetic data for precise and automated analysis. Earth Planets Sp. 68, 143. doi:10.1186/s40623-016-0521-2
Honsho, C., and Kido, M. (2017). Comprehensive analysis of traveltime data collected through GPS‐acoustic observation of seafloor crustal movements. J. Geophys. Res. Solid Earth 122, 8583–8599. doi:10.1002/2017JB014733
Ishikawa, T. (2016). Statistical method for accuracy evaluation of seafloor geodetic observatio [in Japanese with English abstract]. Rep. Hydrogr. Oceanogr. Res. 53, 57–81. doi:10.1534/genetics.104.031153
Ito, K., Nakajima, H., Kobayashi, K., Aoki, T., and Higuchi, T. (2004). A fingerprint matching algorithm using phase-only correlation. IEICE Trans. Fundam. E87-A3, 682–691. doi:10.1016/j.cviu.2015.09.004
Kido, M., Fujimoto, H., Miura, S., Osada, Y., Tsuka, K., and Tabei, T. (2006). Seafloor displacement at Kumano-nada caused by the 2004 off Kii Peninsula earthquakes, detected through repeated GPS/acoustic surveys. Earth Planets Sp. 58 (7), 911–915. doi:10.1186/BF03351996
Moriya, H. (2011). Phase-only correlation of time-varying spectral representations of microseismic data for identification of similar seismic events. Geophysics 76 (6), 21. doi:10.1190/geo2011-0021.1
Spiess, F. N. (1985). Suboceanic geodetic measurements. IEEE Trans. Geosci. Rem. Sens. GE- 23 (4), 502–510. doi:10.1109/TGRS.1985.289441
Thorp, W. H. (1967). Analytic description of the low-frequency attenuation coefficient. J. Acoust. Soc. Am. 42, 270. doi:10.1121/1.381574
Keywords: seafloor geodesy, acoustic ranging, travel-time determination, phase-only correlation, template matching
Citation: Honsho C, Kido M, Ichikawa T, Ohashi T, Kawakami T and Fujimoto H (2021) Application of Phase-Only Correlation to Travel-Time Determination in GNSS-Acoustic Positioning. Front. Earth Sci. 9:600732. doi: 10.3389/feart.2021.600732
Received: 31 August 2020; Accepted: 06 January 2021;
Published: 10 February 2021.
Edited by:
Keiichi Tadokoro, Nagoya University, JapanReviewed by:
Tadashi Ishikawa, Japan Coast Guard, JapanChau-Chang Wang, National Applied Research Laboratories, Taiwan
Copyright © 2021 Honsho, Kido, Ichikawa, Ohashi, Kawakami and Fujimoto. This is an open-access article distributed under the terms of the Creative Commons Attribution License (CC BY). The use, distribution or reproduction in other forums is permitted, provided the original author(s) and the copyright owner(s) are credited and that the original publication in this journal is cited, in accordance with accepted academic practice. No use, distribution or reproduction is permitted which does not comply with these terms.
*Correspondence: Chie Honsho, chie.honsho.b7@tohoku.ac.jp