
Development of a novel computational method using computed tomography images for the early detection and severity classification of COVID-19 cases
Abstract
BACKGROUND:
Recent occurrence of the 2019 coronavirus disease (COVID-19) outbreak, caused by the severe acute respiratory syndrome coronavirus 2 (SARS-CoV-2), has highlighted the need for fast, accurate, and simple strategies to identify cases on a large scale.
OBJECTIVE:
This study aims to develop and test an accurate detection and severity classification methodology that may help medical professionals and non-radiologists recognize the behavior and propagation mechanisms of the virus by viewing computed tomography (CT) images of the lungs with implicit materials.
METHODS:
In this study, the process of detecting the virus began with the deployment of a virtual material inside CT images of the lungs of 128 patients. Virtual material is a hypothetical material that can penetrate the healthy regions in the image by performing sequential numerical measurements to interpret images with high data accuracy. The proposed method also provides a segmented image of only the healthy parts of the lung.
RESULTS:
The resulting segmented images, which represent healthy parts of the lung, are classified into six levels of severity. These levels are classified according to physical symptoms. The results of the proposed methodology are compared with those of the radiologists’ reports. This comparison revealed that the gold-standard reports correlated with the results of the proposed methodology with a high accuracy rate of 93%.
CONCLUSION:
The study results indicate the possibility of relying on the proposed methodology for discovering the effects of the SARS-CoV-2 virus in the lungs through CT imaging analysis with limited dependency on radiologists.
1Introduction
The pandemic caused by the spread of the severe acute respiratory syndrome coronavirus 2 (SARS-CoV-2, also known as 2019-nCoV) has become a major challenge for all countries of the world due to the virus’ rapid spread and the lack of a specific, widely-available vaccine to date [1]. Achieving accurate and early detection of the 2019 disease caused by this virus (COVID-19) has become one of the most important goals in understanding the performance of this virus and positioning medical practitioners to handle the caseload. One of the methods used to detect the progression of this virus is thoracic computed tomography (CT) imaging. A number of tests and experiments have emerged focusing on using these images to detect the presence of the virus in the airways or the lungs. For example, a study assessed the chest CT scans of 121 symptomatic sufferers with SARS-CoV-2 infections from four regions in China to confirm the presence of COVID-19. This study showed that symptoms like convergence, bilateral disease, higher overall lung involvement, and peripheral lung division surpassed the post-symptom span in CT-image patients. Non-chest CT findings included lymphadenopathy, pleural effusions, lung nodules, and lung cavitation. However, this form of analysis has many drawbacks. Due to insufficient clinical records, some patients were excluded from infection evaluation, especially unfortunate because symptoms often have vague beginnings. In addition, patients may have received medical attention after suspected or confirmed infections (antimicrobial, fluid, or steroid therapy could affect chest CT) not included in this study [2].
The research by [3] presented a comparison between diagnoses made using thoracic CT scans and RT-PCR screening for COVID-19 among 1,014 patients infected in Wuhan, China. The overall performance of chest CT scans in diagnosing COVID-19 was then evaluated in comparison with that of RT-PCR as the reference standard. From the results of 1,014 patients, 59% (601/1014) had positive RT-PCR and 88% had positive CT scans. Among patients with positive RT-PCR results, chest CT sensitivity was found among 97% of the patients. In patients with negative RT-PCR results, 75% had positive CT findings in the chest; of 308, 48% were extremely likely cases, and 33% were likely cases. By comparing RT-PCR serial assays with CT scans, the mean time from initial negative to positive RT-PCR results was 5.1±1.5 days; initial negative RT-PCR results were 6.9±2.3 days. Initially, 60–93% of cases had positive CT scans, consistent with earlier positive initial RT-PCR performance. In addition, 42% had better CT scans before negative RT-PCR. Recognizing COVID-19 requires a chest CT scan. In [4], SARS-CoV-2 infection in 21 symptomatic sufferers from China was confirmed using CT imaging, with findings including the presence of bilateral pulmonary parenchyma and standardized pulmonary anomalies with circular morphology and peripheral lung distribution. Typical CT findings included bilateral pulmonary parenchymal ground-glass and consolidative pulmonary opacities, sometimes with a rounded morphology and a peripheral lung distribution. However, no lung cavitation, nodules, or lymphadenopathy were observed. Beyond this, follow-up images in a subset of patients showed mild to moderate disease progression during the study time window, manifested by increasing opacity and density. Elsewhere, 61 adult patients’ chest CT images were reviewed at four hospitals in the Northeastern United States by a skilled thoracic radiologist. The chest CT signs of SARS-CoV-2 infection were compared with those formerly confirmed for adenovirus, influenza, human metapneumovirus, adenovirus, and breathing syncytial virus. Of these patients, 11 (18%) showed bronchial thickening, 15 (25%) experienced GGO, 12 (20%) showed lung consolidation, and 13 (21%) suffered from tree-in-bud opacity. Twenty-eight (46%) had no immediate chest-related results, showing the virus to share traits with both influenza PIV [5].
In addition, a preliminary file from Korea on chest radiographic and CT consequences of COVID-19 pneumonia is presented in [6]. Three of nine patients (33.3%) registered parenchymal chest anomalies, while others observed peripheral consolidations. In eight of nine patients, chest CT images revealed bilateral movement, reversing the patient’s halo. Furthermore, 77 patients displayed lung lesions, including patchy lesions (39%), large confluent lesions (13%), and tiny nodular lesions (48 %), and 78% had peripheral and post-lung (67%) areas affected. However, mixed opacity was unclear. Other research [7] has shed light on the analysis of the results of radiography and CT imaging of COVID-19 pneumonia, especially where Fisher’s test was used to assess the consequences of CT scans while considering the shapes of lung lesions. Many COVID-19 CT images have been published, including those of patients who are asymptomatic or who have mild signs and poor CT results. In one case, a 73-year-old woman who had lesions in the liver and bones that progressed to a small, advanced-level cancer was infected with SARS-CoV-2 yet tested negative. For this case, a recent high-quality CT scan confirmed opacity (GGOs). The test showed several bilateral areas of subpleural GGOs, a finding that showed that in addition to pleural effusions, COVID-19 may occur in the early phases of coronavirus disease 2019 (COVID-19). The patient then requested another test and subsequently reported a positive outcome of SARS-CoV-2.
Thus, standard CBCT can detect COVID-19 in asymptomatic or medium-symptomatic patients [8]. A system has also been introduced with extensive two- and three-dimensional CT images to enhance current artificial intelligence patterns. In this study, two repeated trials were performed to obtain the degree of human immunodeficiency virus infection, assessing disease progression using a three-dimensional range evaluation in each patient. Coronavirus versus classification findings per thoracic CT studies were 0.996 AUC (95% CI: 0.989–1.00) using Chinese datasets of patients infected. Possible job: 98.2% sensitivity, 92.2% accuracy. For coronavirus patient research, system output tests showed smaller opacities, volumes, and diameters. In addition, they yielded visualizations of larger opacities in a slice-based heat map or 3D display [9].
A number of comparative studies were presented to account for the identity and category of pneumonia caused by the SARS-CoV-2 virus. Meanwhile, in another study, quantitative evaluations were performed using chest X-rays and CT scans for datasets of 6,087 images. Experiments were performed using 6,087 X-ray & CT chest images (2,780 for bacterial pneumonia, 1,493 for corona virus, 231 for COVID-19, and 1,583 standard images) and confusion matrices to test model performance. The results showed that Resnet V2 and Densnet201 yield better results than the other models used in this work (92.18% accuracy for Resnet V2 and 88.09% accuracy for Densnet201) [10].
Meanwhile, in another study, quantitative evaluations were performed using chest X-rays and CT scan datasets of 6,087 images. COVID-19’s most discriminatory attributes are its percentage of airspace opacity, ground-glass opacity, consolidation, peripheral opacity, and basal opacity. In the unmonitored clustering COVID-19cohort, sensitivity was first measured to be 0.85, 0.81, and 0.77 and then 0.90, 0.86, and 0.81. The greatest ambiguity was detected in non-COVID-19 cases, COVID-19 cases, and early COVID-19 cases [11]. An easy, efficient CT imaging technique has been proposed for diagnosing COVID-19. These CT scans of COVID-19 patients tend to show small patches of shadows and intermittent changes, especially at the edges of the lungs. This technique has adopted the ResNet Architecture Convolution neural network to train the footage provided via CT means to effectively diagnose patients with SARS-CoV-2 infections. In this method, the patient correctly identifies test images with training images. Accuracy and precision have been obtained at 95.09% and 81.89%, respectively, without additional data such as geographic location, population density, and so forth. In addition, this technique has achieved 100% sensitivity [12].
Different systematic techniques to fight COVID-19 have been reported by the radiology branch at Tongji Hospital in Wuhan, China, including employee arrangements, safety parameters and configurations, radiological imaging, and disinfection methods. Furthermore, contaminated screeners become high-risk doctors, and cross-infection radiological matters. This article will address Tongji Hospital, Wuhan, regarding China’s detailed COVID-19 techniques, including staff arrangements, environmental adjustment, levels and configurations, radiological imaging (CT and X-ray), and disinfection methods. This hospital could advise other COVID-19 radiology departments on how to reduce radiological technologists’ risk of infection [13]. In this research, the magnitude of pulmonary involvement in COVID-19 was studied using quantitative CT (QCT) and thus the degree of disturbance in chest radiographs was evaluated. The average QCT was 72.4±120.8g (a range of 0.7–420.7) and 3.2±5.8 percent and 139±180 percent for all patients (a range of 0.1–19.8). There was an error range of 0.5–57.8. Radiologists reported a 25% median sensitivity and 90% specificity. Of the 186 chest X-rays, 19 were visible, and 55.8% were exposed by X-rays. An analysis of the logistic regression revealed the greatest effect on X-ray visibility of QCT mass (p < 0.001) and combined opacity (p < 0.001).
The chest CT scan pixels of the affected person were combined to provide an explanation of the signs and symptoms apparent on the CT scan [14]. Multiangle vitreous opacities were detected in bilateral lungs, mainly in the subarachnoid regions. Beyond this, several punchy floor glass opacities were found, particularly in sub pleural areas, in the bilateral lung. The development of nodular GGOs and sub-pleural GGOs took three days. A number of bilateral pulmonary subplastic GGOs were observed with pneumonia, along with rapid development and nodular chest CT GGOs. These findings were consistent and could be useful for the early detection and testing of pneumonia for COVID-19 [15]. There was a probability of significant statistical differences between both the CT results and the results of the RT-PCR testing, meaning that the results of these comparisons were not completely reliable. In addition, the number of patients mentioned in certain previous studies and in the study, sample was less than the number of patients in this study. For example, in [5], there were 61 patients, and in [7], there were 77 patients, whereas in this study, there were128 patients. Furthermore, some previous studies, including [10], dealt with the study of a number of viruses, including the corona virus. Additionally, previous research spoke about its ability to identify and discover diseases without addressing their degrees of severity. Certain studies have not been able to identify COVID-19 in its early stages, as in [11]; instead, the disease is normally identified and diagnosed in its middle and advanced stages.
The current study aimed to detect COVID-19 and determine its severity degree by utilizing a novel, prototyped auto detection algorithm with the ability to scan the provided lung CT images. This proposed method relies on spreading a virtual material in the CT images. It is well-known that the parts of a single substance are similar in physical and chemical properties, so the parts of this single hypothetical substance are also similar in properties. Nevertheless, these properties do not have a physical existence that can be touched—they have a hypothetical existence that can be only virtually recognized. Thus, the scientific community has named these hypothetical substances “virtual materials,” which have various applications in simulating elasto-plastic materials and in virtually evaluating the potential of material fractures [16].
In this study, we relied on deploying a virtual material within a lung CT image. We programmed this virtual substance accurately with different parts in the provided CT images, depending on its ability to move in a small range of pixels. This study simultaneously considered the detection and the severity staging for COVID-19 patients. It was characterized by providing a methodology capable of identifying the disease in all its stages: primary, intermediate, and advanced. At this point, we sought to confirm the presence of SARS-CoV-2 in the lungs using CT images and then determine the degree of severity of the disease with a limited need for the involvement of medical imaging specialists. The recognizable changes in the gray-scale for CT images were the main indicators for classifying specific abnormalities, and the healthy and infected parts of both lungs could be determined based on such changes. The strategy of the presented method is to outline healthy regions of the lungs and then display them so that non-specialists can visualize and potentially address them while both confirming and classifying the degree of severity of the viral infection.
2Materials and methods
The SARS-CoV-2 virus enters the body via the air passages and infects the lining of the respiratory system, causing inflammation and potentially irritating the nerves in the lining of the airway. It appears on a CT scan like a spot of dust, whereas the healthy parts of the lung appear as a dark-black area. In some cases, the virus travels to gas-exchange units (i.e., alveoli) located at the ends of the air passages. If these units become infected, they pour inflammatory material into the air sacs at the base of the lungs. This causes inflammatory material to flow into the lungs, causing pneumonia. This inflammation may be severe and can affect all parts of the lungs. Consequently, the lungs become unable to inject a sufficient amount of oxygen into the bloodstream, which could lead to multisystem failure or even death.
The proposed methodology aims to identify the healthy places in the lungs that have not yet been infected by SARS-CoV-2 by way of identifying the dark areas on the CT scan and excluding the infected areas so that only the healthy parts appear in the final image. These resulting images are then characterized by a high degree of clarity that non-medical specialists can easily understand. In addition, this method can help to classify the degree of severity of the disease based on these resulting images, which helps with diagnosing the current lung situation of the patient.
This study was approved by the Research Ethics Committee at King Khalid University–Saudi Arabia (HAPO-06-B-001), and it was a retrospective study involving 128 patients using the proposed methodology, which relies on thoracic CT scans. All the patients in this study had confirmed cases of COVID-19, and 14 of these patients entered the intensive care. Six of them died. The proposed methodology relies on the Chan–Vese algorithm to divide objects without specific limits. This algorithm is a powerful, versatile method capable of segmenting many types of images, including those that would be difficult to segment by “classical” segmentation—using thresholding or gradient-based methods. This algorithm is based on the Mumford–Shah segmentation function and is commonly used in the field of medical imaging, especially for brain, heart, and trachea segmentation [20]. The model is based on virtual energy minimization that can be reformulated in a level-set formulation, making it easier to detect specific regions in the provided medical image.
The aim of splitting the image into several parts is to provide separate components with a set of pixels that are identical in grayscale. Similarity at the gray-scale level implies similarity with a high degree of color accuracy. The diagnosis of a disease is associated with color changes in medical images. Therefore, this technique can be used with great success to differentiate a particular component, separating the abnormality from healthy components. In this study, this method was used to extract healthy portions of the lung in a very precise, efficient manner. The suggested technique begins with the detection of just one pixel in the image that has the characteristics of a dark color reflecting a very small portion of a healthy lung. This small pixel reflects the default building material device being built.
The methodology continues by examining the vicinity of this pixel on another pixel that is similar in gray-scale level and thus similar in tone. Next, the virtual material move is done to this adjacent pixel that is similar to the starting pixel. This virtual motion continues to similar adjacent pixels, representing the flow of virtual material inside the image. It was evident from this movement in this study that the transition from one pixel to another would continue as long as a similar gray-scale neighboring pixel can be found. Continuing this movement, this hypothetical material will surround all the dark black pixels that represent a healthy lung in the image. This technique allows the algorithm to determine the healthy lung region with a high level of accuracy. The proposed methodology not only defines the healthy region but extracts it in a separate image by disregarding all other pixels of different gray-scale levels.
2.1Materials
This section begins with an explanation of what hypothetical materials are and their importance in applied science. The material used in this research was implicit. The concept of using latent substances is extraordinarily powerful, offering data on parameters like elasticity, plasticity, melting, tearing, and breakage in real time [17]. In addition, it is viable to study the use of partial substances and partial differential equations. Thus, it is warranted to study cracks in substances that might be hard enough to influence simple linear and nonlinear models. In this process, implicit substances are used, and alternate readings are taken of unique substances while they are subdivided into smaller components to a degree as minute as the nanoscale. The latter supports a critical step forward in nanotechnology. However, this is not the first time that latent fabric has been used as a device in research.
The importance of virtual materials lies in their ability to simulate physical materials, which are difficult to test in practice, such as simulating fractures and cracks that occur in plastic in real time. The latter simulations require tracking the movement of the hypothetical material, represented as a continuous displacement of the fractions of the virtual materials. The movement of pixels in the virtual materials is accompanied by a force specific to each pixel called the Kauchi force or the flexible pressure force that causes this shift. That compressive force is what forces similar pixels to move, and it is also one of the variables on which the Shan phys logarithm will depend. Furthermore, the proposed method uses this logarithm to segment the CT images, expressed in the following equation:
(1)
where Ve is the volume of the element, Beis a constant 6×12 matrix that can be pre-computed for every tetrahedron, and E is a 6×6 matrix for isotropic materials, the Young modulus, and therefore the Poison ratio.
This equation is important in the proposed methodology. It is used to express the driving forces of the displacement process assisting the initiation of movement of the hypothetical particles of matter. Moreover, this equation supplies a manner for constantly shifting and breaking the special floor grid along the underlying quadruple grid. The above technique defines the elastic pressure operating at the nodes of a component. Using the Kauchi approach, the forces can be definitively hooked into the vertex displacements as follows:
The cases studied in this research involved 128 people, all of whom were positive for COVID-19 but none of whom had other health issues. That is, these individuals all presented with COVID-19 but no apparent symptoms of the disease. Second, there was a woman with cystic fibrosis who had symptoms such as a high fever and a mild cough. Third, one person diagnosed with Covid-19 experienced symptoms such as a high temperature, moderate coughing, and trouble breathing. Fourth, there was a patient with cancer, whose symptoms included excessive coughing, trouble breathing, and symptoms of pneumonia. Fifth, a patient with COVID-19 had the appearance of advanced symptoms, such as a lack of oxygen in the blood, acute respiratory failure, and a compromised immune system with problems regarding the functions of other organs, such as the kidneys. Sixth, one patient was suffering from cancer with and thus needed to be put under artificial ventilation to stay alive.
2.2Methods
This section will provide details of the proposed methodology with an explanation of how to use it to obtain a clear picture of the healthy part of the lungs in people with COVID-19. The proposed methodology in this research aims to achieve an accurate, easy, and rapid method for identifying the degree of lung infection resulting from the presence of SARS-CoV-2 in the lung passages and alveoli. Figure 1 shows the proposed methodology in detail. To reach the goal of the methodology, the concept of hypothetical materials was used, which could easily penetrate all of the healthy parts of the lungs not yet affected by the virus. The figure shows the steps for the proposed methodology, beginning with the selection of a CT image. Based on the black color restriction, the interior contours are automatically detected. In turn, the distributed curves evolve on the basis of the initial region selected in the first stage. Each curve is moving toward its usual interior and is evolving in its area, ending at the boundary of an entity where all regions of the lungs are detected. At this point, a black-and-white image is produced, containing only the segmented lung, and the level of severity is assessed. Two ways of showing the segmented lung have emerged: using one image and showing the left and right lungs divided into two images.
Fig. 1
The proposed methodology for detecting SARS-CoV-2 in human lungs.
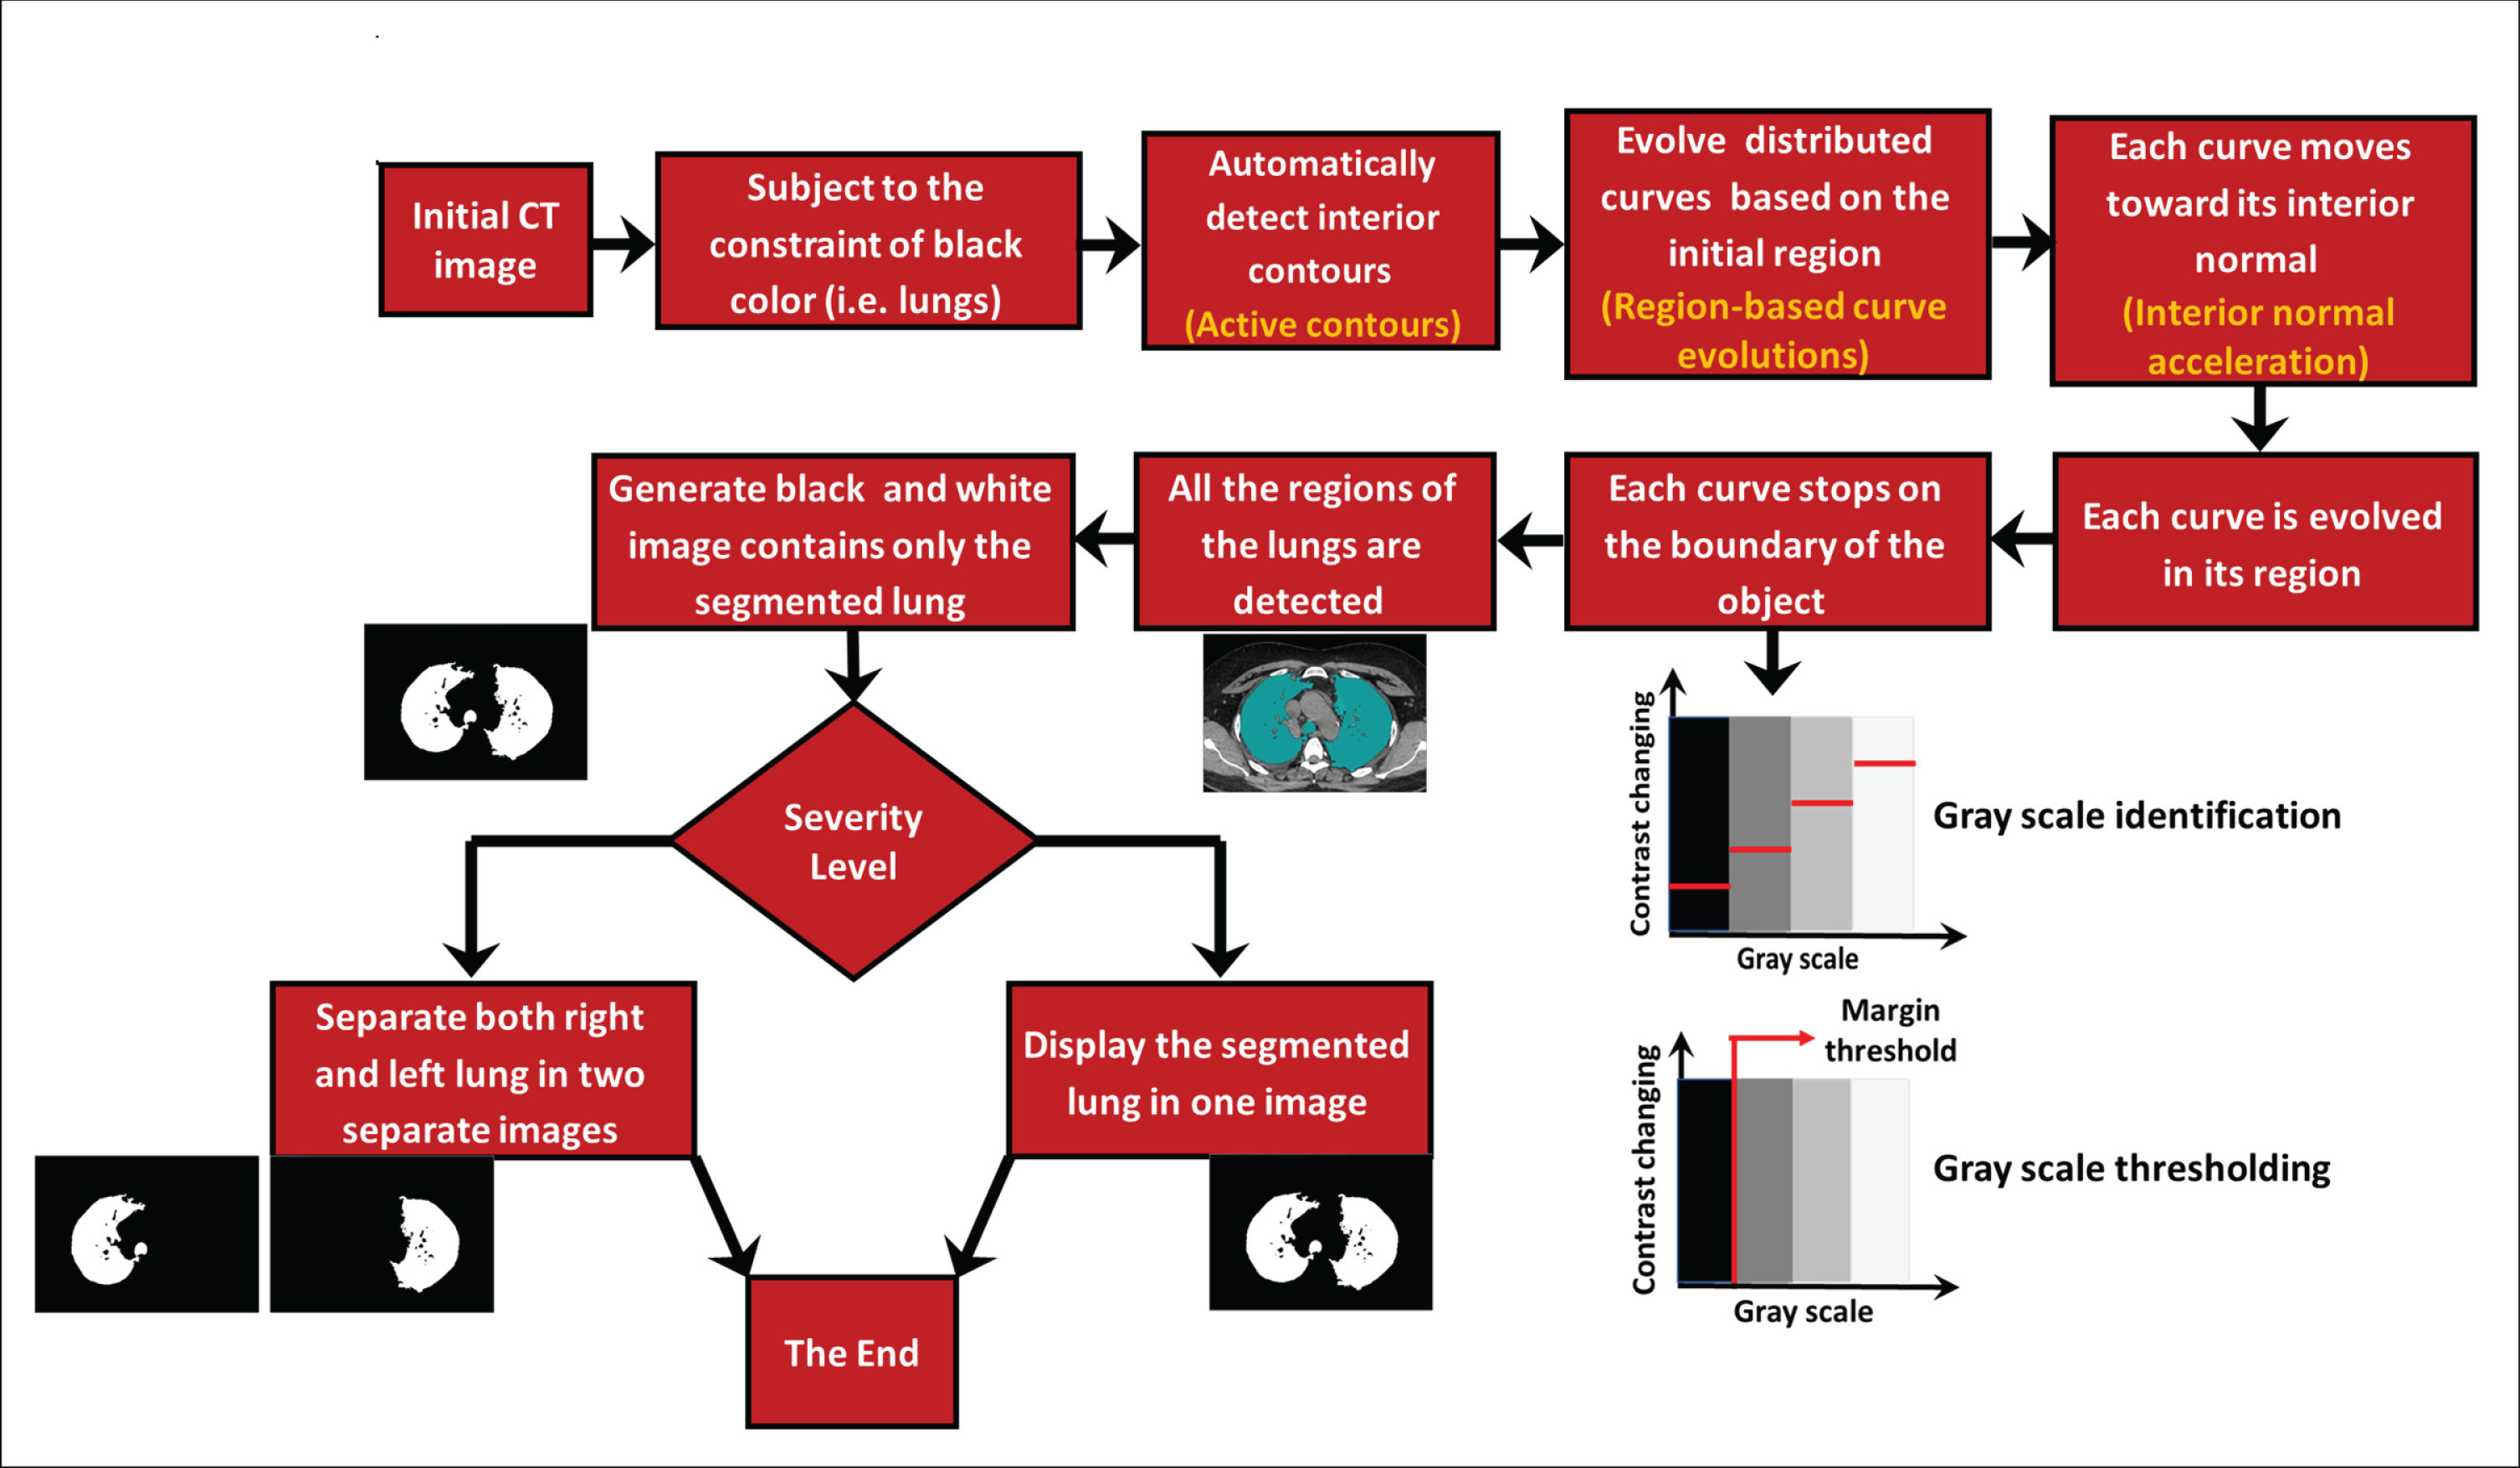
This penetration can, with high accuracy, elucidate the healthy parts of a lung, which appear in black on a CT scan. The methodology begins with selecting the CT image to be tested and then determining an initial area from which the hypothetical material will begin to move and spread. Importantly, this region must be in an area of healthy lung tissue so that the hypothetical substance might spread only to other similar spaces. Next, the prototyped model begins spreading the hypothetical material by gradually moving its outer boarder, referred to as the curve. This movement is accompanied by changes in levels of greyscale pixels, represented as a force in the Chan-Vese logarithm. In order to simulate the implicit material, this study used the active contours in MATLAB (Mathworks, Natick, MA, USA).
2.2.1Evolution of the curves in the initial region
To track the movement of curves in the first step, a conceptual model for this movement must be developed, and this model is called the geometric active-contour model. This model is based on the mean curvature motion is given by the following evolution equation. Suppose Chan and Vese [16] introduced an energy function F(c1,c2,C) defined by the following:
(2)
where
where v is consistent and can be interpreted as a force pushing the curve closer to the item, while the curvature will become null or negative; μ ⩾ 0, ν ⩾ 0, > 0 are fixed parameters, where C is any other variable curve; and the constants c1, c2, depending on C, are the averages of u inside C and outside C, respectively; and u is the input image. The minimization problem is expressed by inf c1, c2, c F(c1, c2, C) and can be solved by applying the level set method introduced by Osher and Sethian [17].
At the same time, the curve C is implicitly represented by the zero-level set of a Lipschitz function ϕ (x, y, t) c (t) ={ ϕ (x, y, t) = 0 }, where t is an artificial time variable. For t = 0, ϕ (x, y, 0) denotes the initial contour.
After further derivation, Chan and Vese proposed a gradient flow as follows:
(3)
with
In the CT images, the roughness or the surface complexity and the Lipschitz classes of the black regions should be considered.
2.2.2Lung texture detection
To assess the effect of the virus on the lungs, the structure of the virus must be identified to locate the infection. The relationship between Lipschitz classes and image roughness using the main concepts explained in [18] should be taken into consideration. Suppose the image of the lung in the CT is lung (x, y), which displays edges, localized sharp features, and other significant fine-scale details or texture to satisfy the following:
(4)
where
The image lung (x, y) is now viewed as originally defined on the unit square from which it is extended by periodicity to all of R2. Next, the image can be redefined by Fourier transform luf (ξ, τ) as follows:
(5)
By substituting Equation 4 into Equation 2, the following equations can be considered:
(6)
(7)
(8)
Next, Equation 6 should be reformulated as follows:
(9)
If considering M =
(10)
From Equations 8 and 9,
(11)
In Equations 1 and 11, the terms f and v, respectively, refer to the force pushing the curve toward the object.
2.2.3Virtual material continuous movements
The continuous motion method of hypothetical matter plays an important role in this model [19]. This section will introduce the equations that form the basis of the proposed methodology. By the substituting the variable f for v into Equation 11, the latter can be reformulated as follows:
(12)
Equation 12 represents a direct relationship between the evolution of the curve and the force of the implicit material operating at the nodes of a component.
2.2.4Determining the degree of severity of the disease
In the proposed methodology, severity is determined by comparing the number of black pixels with the number of white pixels. Let L denote the number of gray levels in a grayscale picture (i.e., the number of possible intensity values). In other words, every pixel has 0,..., L–1, L for the 8-bit image L = 256 so that a value of each pixel ranges from 0 to 255. One essential definition is a one-dimensional histogram that stores the number of pixels with this value for each gray level: h [k] = nk, k = 0,..., L–1, 1, where nk is the number of gray-level k pixels in the image. The pixel set, with the intensity k (i.e., nk = |p: i(p) = k|), is defined mathematically by nk, where p = (x,y) is a pixel on image I. Next, the degree of severity S could be written as follows:
(13)
This stage can be termed the active frame stage because the movement mechanism is the result of the activity of the external frame of the hypothetical material. This step is applied to more than one healthy black area in the image with the aim of spreading to all healthy areas that appear to be isolated as a result of the potentially spreading inflammation. Each curve moves in a direction perpendicular to its initial movement until it covers all of the surrounding black space (i.e., 360°).
The spread of each curve stops at the boundaries of the lungs and does not go beyond them, thus ending the diffusion of the hypothetical substance that has covered the lung area. However, the purpose of this method does not stop there; next, a segmented image of the lung in black-and-white form is created in which the white coloring is the lung, and the black coloring is infected tissues. Notably, this black coloring may also be seen in other body parts that appear around the lung in addition to parts of the lung that are affected. This methodology is also distinguished by its ability to obtain separate images for both the left and right lungs, which could facilitate accurate evaluation of each lung individually and determine the degree of viral infection in both the air passages and the alveoli in each lung.
In this experiment, the shape of the lung changed on a CT scan according to the degree of severity. For example, in the first degree of disease, the vast area of the picture was dark black due to the absence of inflammation. But this did not prevent the presence of some white pixels expressing very mild lung infections that could be caused by the coronavirus or any other lung disease. Therefore, the rating indicator here cannot be based on the black space only in the image. However, one must take these simple white spaces into account. Thus, the ratio between black-and-white pixels in the segmented images was used as an indicator to assess the severity of the disease. In addition, the proposed methodology accounts for the presence of six stages based on disease symptoms. The ratio between the number of black pixels and the number of white pixels has been divided into different proportions as well from the total ratio. If this percentage were greater than 90%, it would indicate first-degree severity. If it were between 80 and 90%, this would indicate second-degree severity. If the ratio were between 70–80%, it would indicate third-degree severity, 60–70% would indicate fourth-degree severity, and 50–60% would indicate fifth-degree severity. Lastly, if the percentage were less than 50%, this would be an indication of sixth-degree severity. Thus, the lower this percentage, the greater the indication of the severity of the disease. That is, as the condition progresses, lung infection increases, and the white pixels increase at the expense of the black pixels. In this way, the ratio between the number of black pixels and the number of white pixels decreases. It is clear from this that this ratio is an effective indicator of the severity of the COVID-19 virus.
The severity of COVID-19 was classified in this study by referring to the symptoms and the reported CT findings of the patients recruited in the study, and this was the basis on which the severity of the disease was classified into six levels. Three experienced radiologists (each with at least five years’ experience working in reporting CT cases) classified the cases and reflected on the CT findings. Using these, the developed scheme of the disease appeared as follows:
Stage 0: A healthy lung (no trace of infection, indicating a patient with COVID-19 with no visible signs of the disease).
Stage 1: A lung with minimal signs of infection (a relatively healthy lung that began to show slight effects of the virus, indicating a patient with COVID-19 with the onset of the symptoms of the disease such as a high temperature and slight coughing).
Stage 2: A lung with a mild rate of infection (an infected lung that began to show mild inflammatory signs, indicating a patient with COVID-19 with the onset of symptoms of the disease such as a high temperature, mild coughing, and difficulty breathing).
Stage 3: A lung with a moderate rate of infection (an infected lung that began to show moderate signs of inflammation, indicating a patient with COVID-19 with the onset of symptoms of the disease such as moderate coughing, shortness of breath, and pneumonia).
Stage 4: A lung with high rate of infection (an infected lung that began to show a high level of inflammation in the lung, indicating a patient with COVID-19 with the emergence of advanced symptoms, such as a lack of oxygen in the blood, acute respiratory distress, and immune system and other organ complications).
Stage 5: A lung with severe signs of infection that cannot perform its function well (a lung with major tissue inflammation, indicating a patient with COVID-19 suffering from advanced symptoms of the disease, in which case the patient must be placed on artificial ventilation).
The three radiologists who participated in this study have a wide range of experience in using medical imaging technologies to evaluate various medical conditions. All of them have passed they Saudi residency program in radiology, and each one has at least three years of experience in diagnosing and reporting various chest CT scans. Using their experience and the medical conditions for the confirmed COVID-19 cases involved in this study, they helped categorize the recruited patients based on the proposed severity classification scheme, as explained earlier. The radiologists were heavily involved in the evaluation process of the patients’ medical reports, and they were fully aware of the patients’ progress, treatment, and the monitoring processes during the course of the disease.
3Results
This section will present the results of the proposed technique for differentiating between healthy and diseased sites caused by infections resulting from the presence of the virus within the air passages and alveoli. The CT images of these patients were divided into six levels of severity, numbered from Level 0 to Level 5, as explained earlier in the Methods section.
Figure 2 presents six study cases, where each case is an example of one level of severity. Figure 3 illustrates the methodology’s ability to separate the right and left lungs in two separate forms. Figure 4 illustrates the relationship between the opinions of the three radiologists and the classification results of the proposed methodology. Figure 5 shows the division of the six severity levels from zero to five, based on this ratio for all CT images of patients in the study sample. Next, Fig. 6 shows a classification scheme for the severity of the disease using the box plot method, which supports the analysis of the minimum and maximum values of the ratio of white to black pixels for each severity level. Table 1 represents the Statistical quantitative numbers of the cumulative white-pixels-to-black-pixels ratio.
Fig. 2
The capability of the output results to classify the severity level into five disease categories.
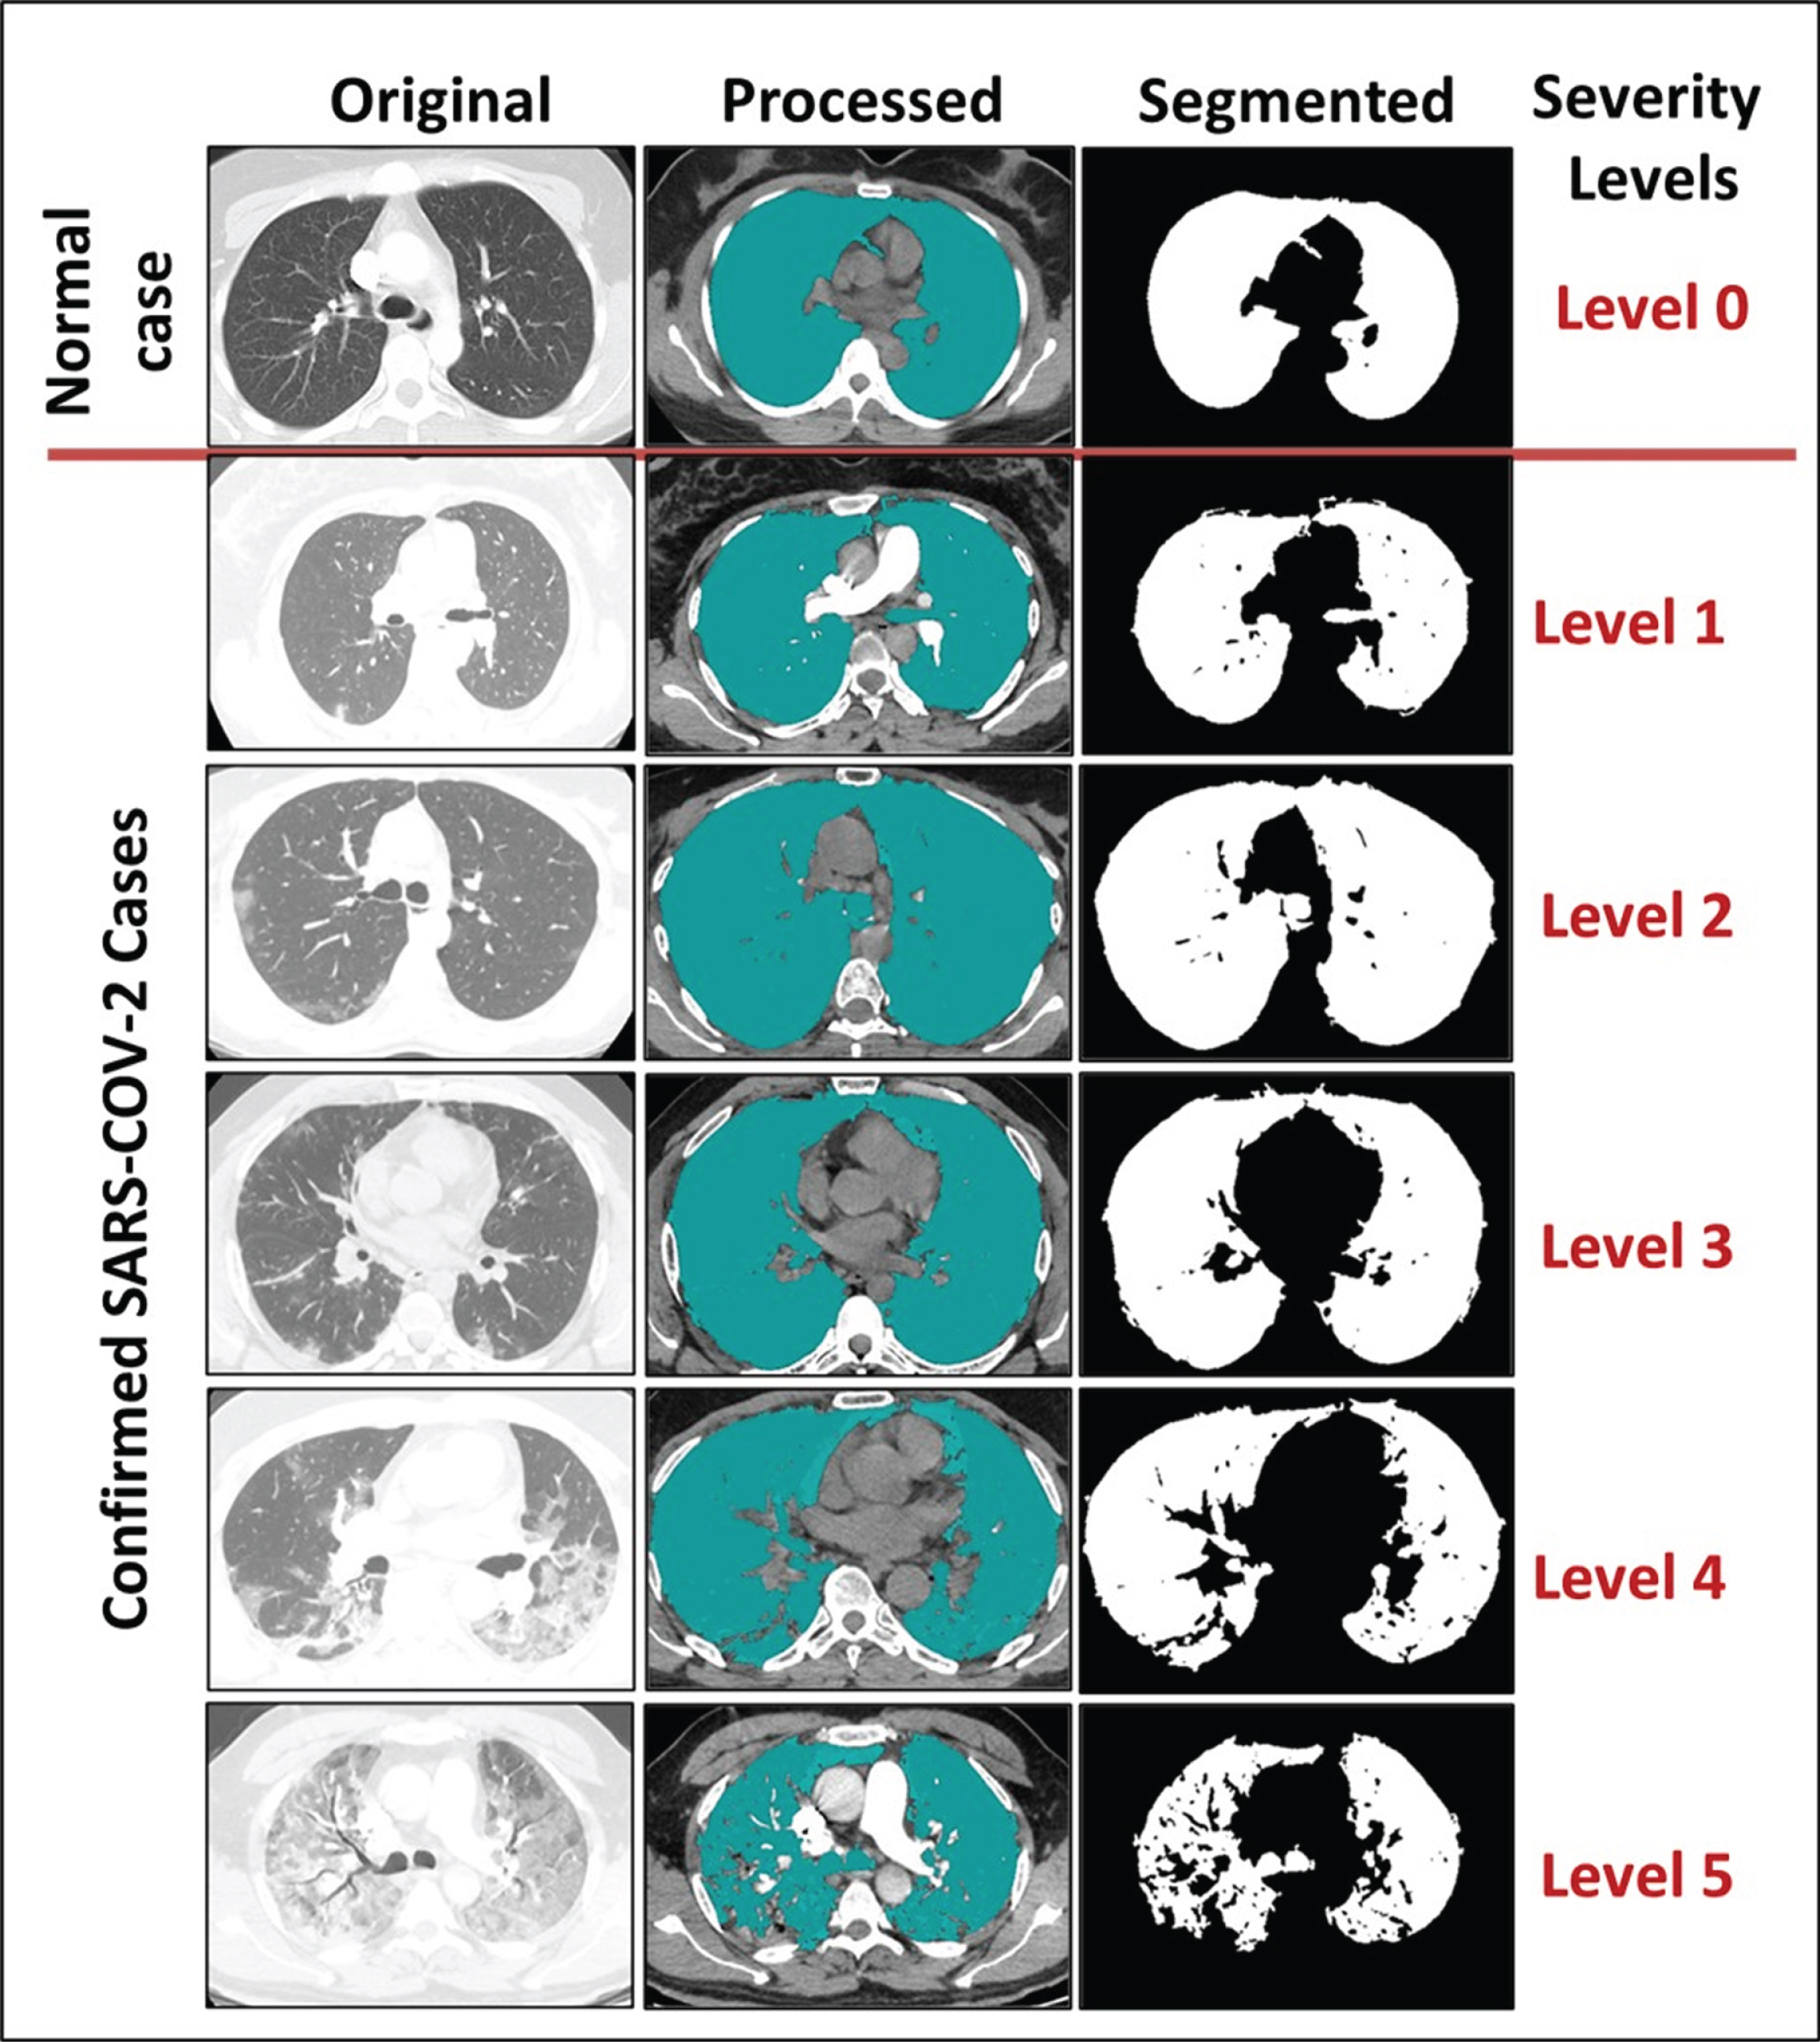
Fig. 3
The capability of the output results following auto-separation of the infected right and left lungs.
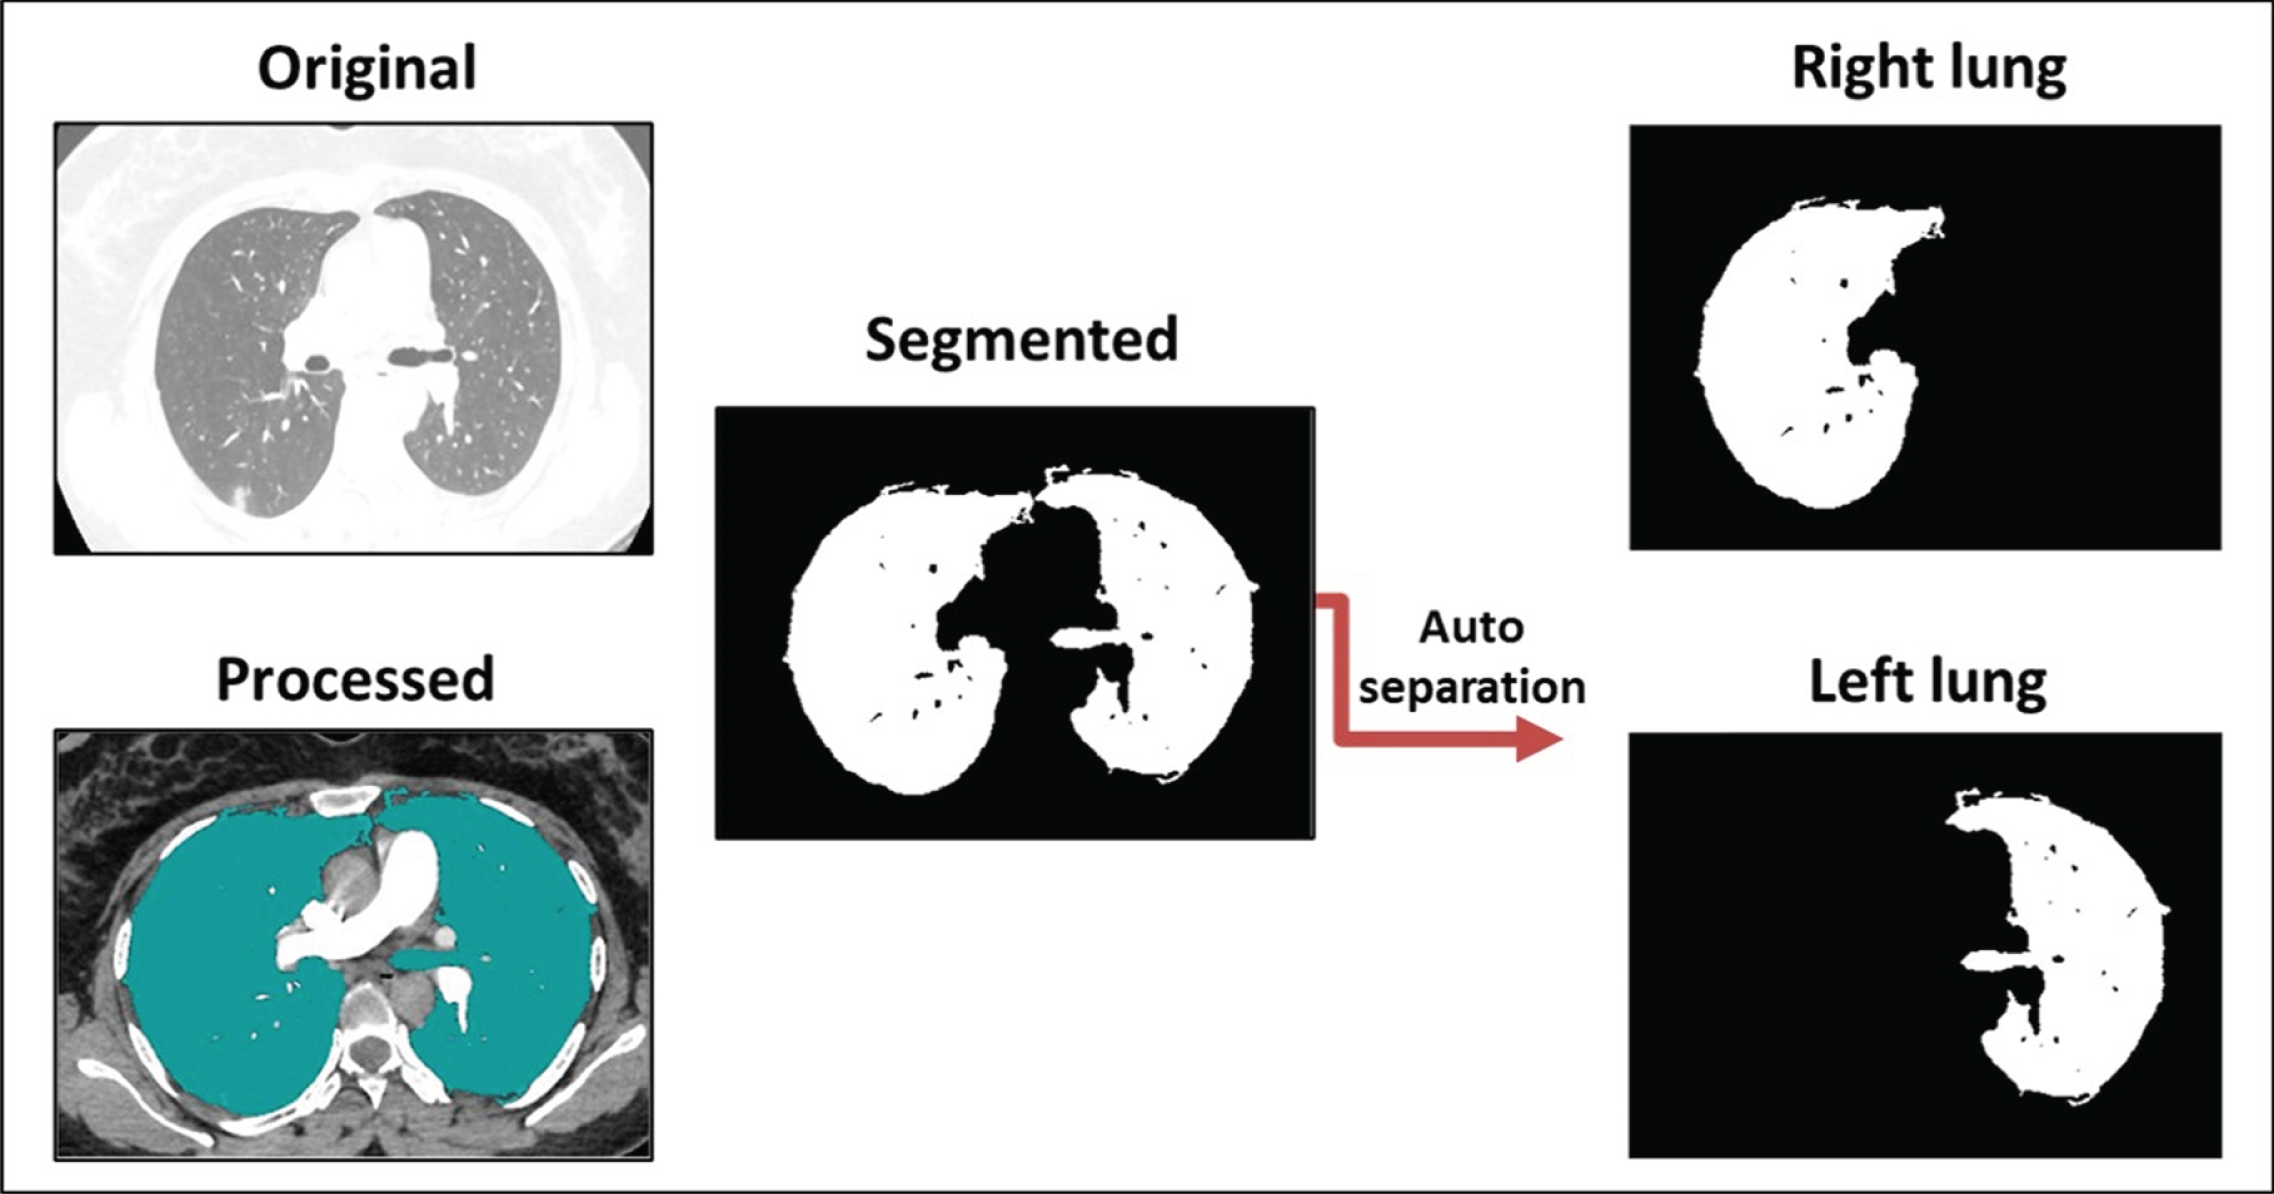
Fig. 4
Comparisons between the output of the proposed prototyped software and the views of three radiologists.
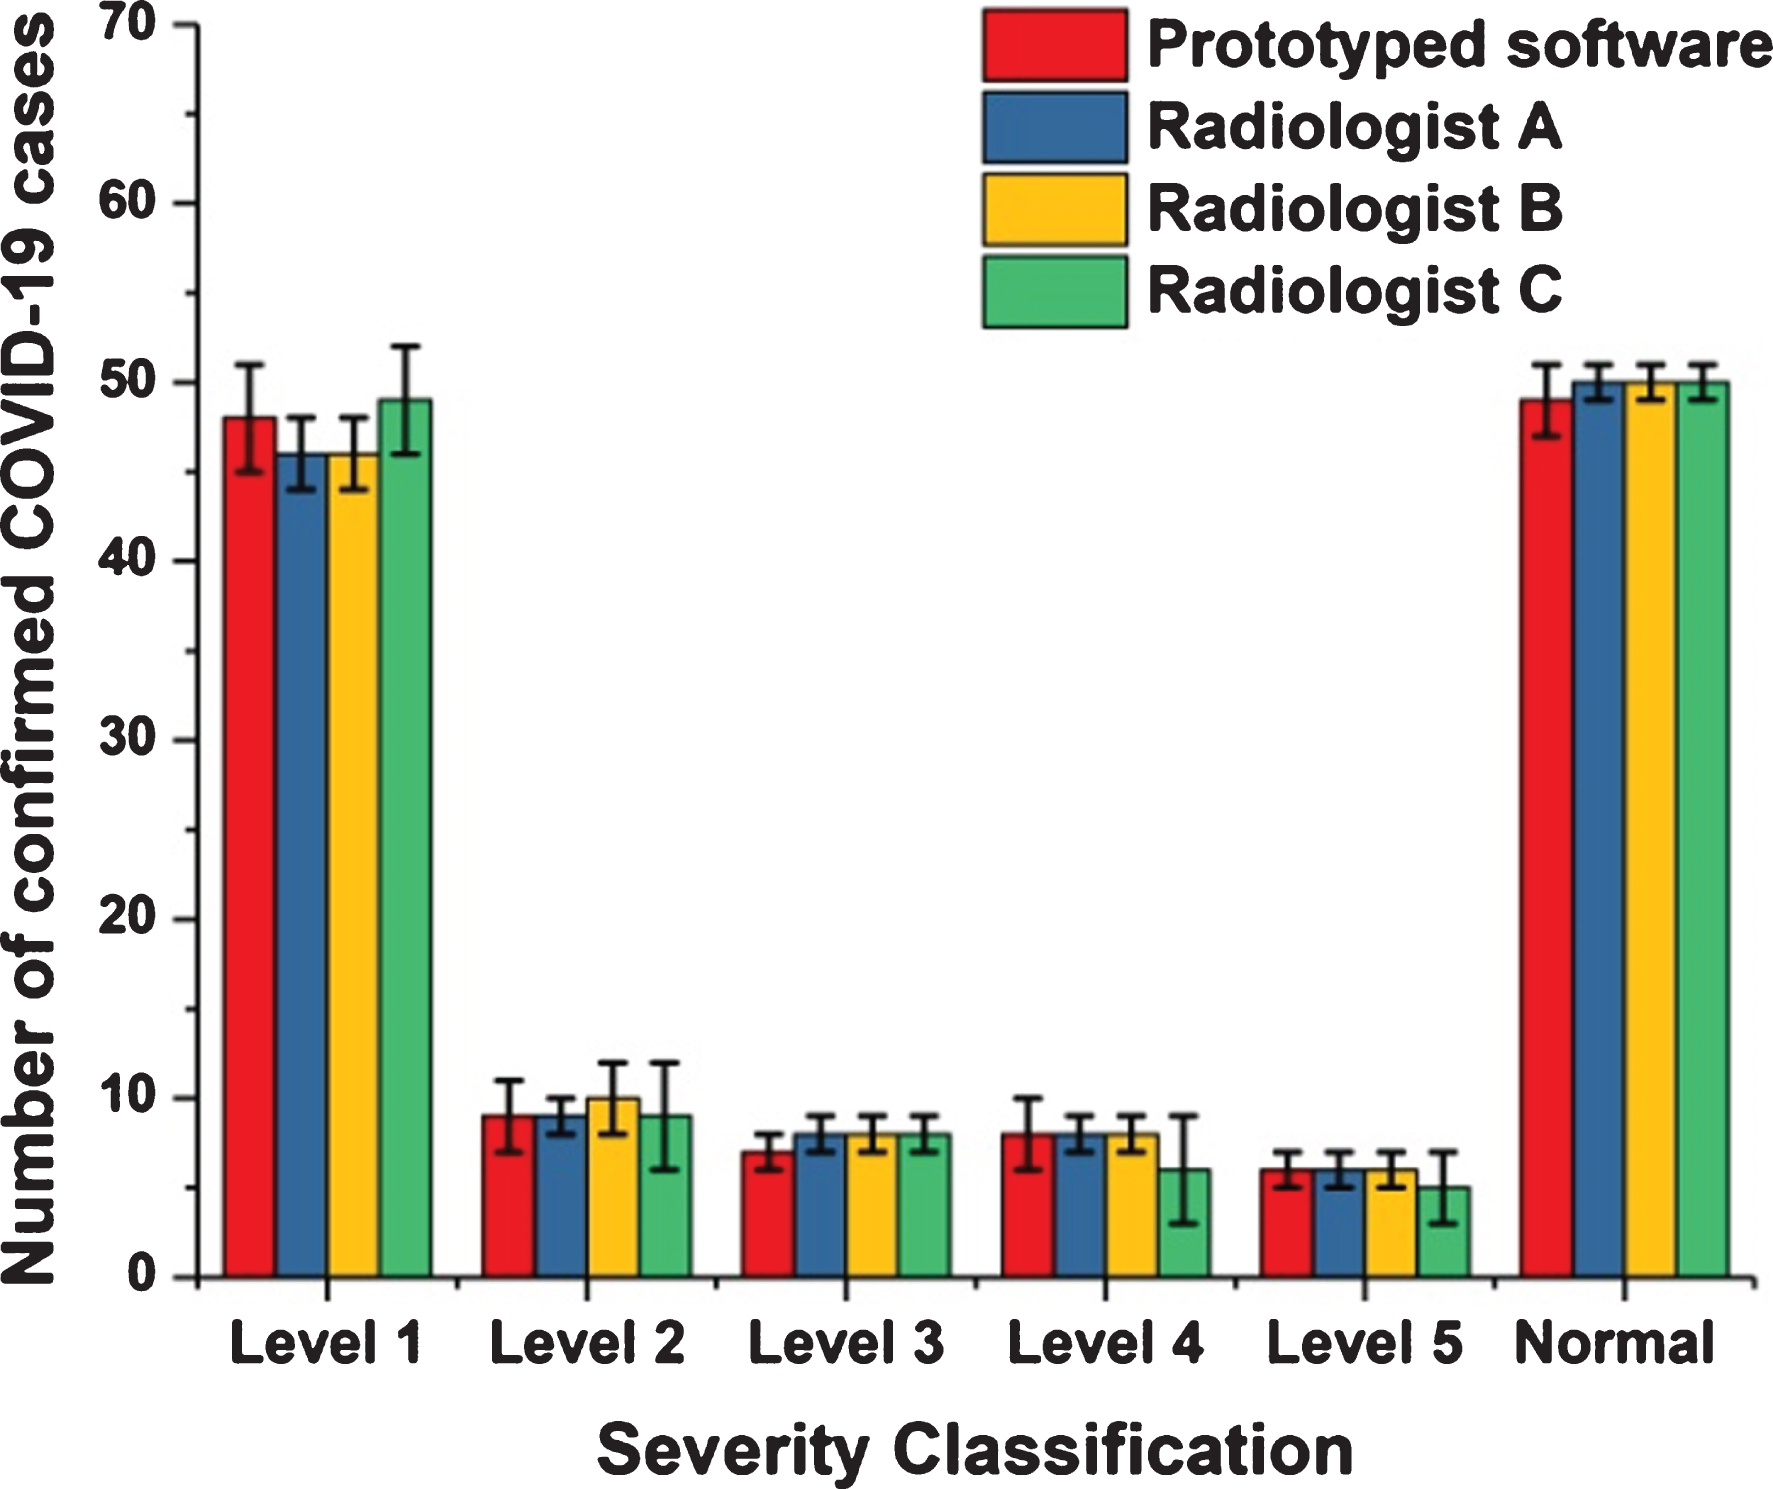
Fig. 5
The six severity levels based on the cumulative ratio of white pixels to black pixels for all study cases.
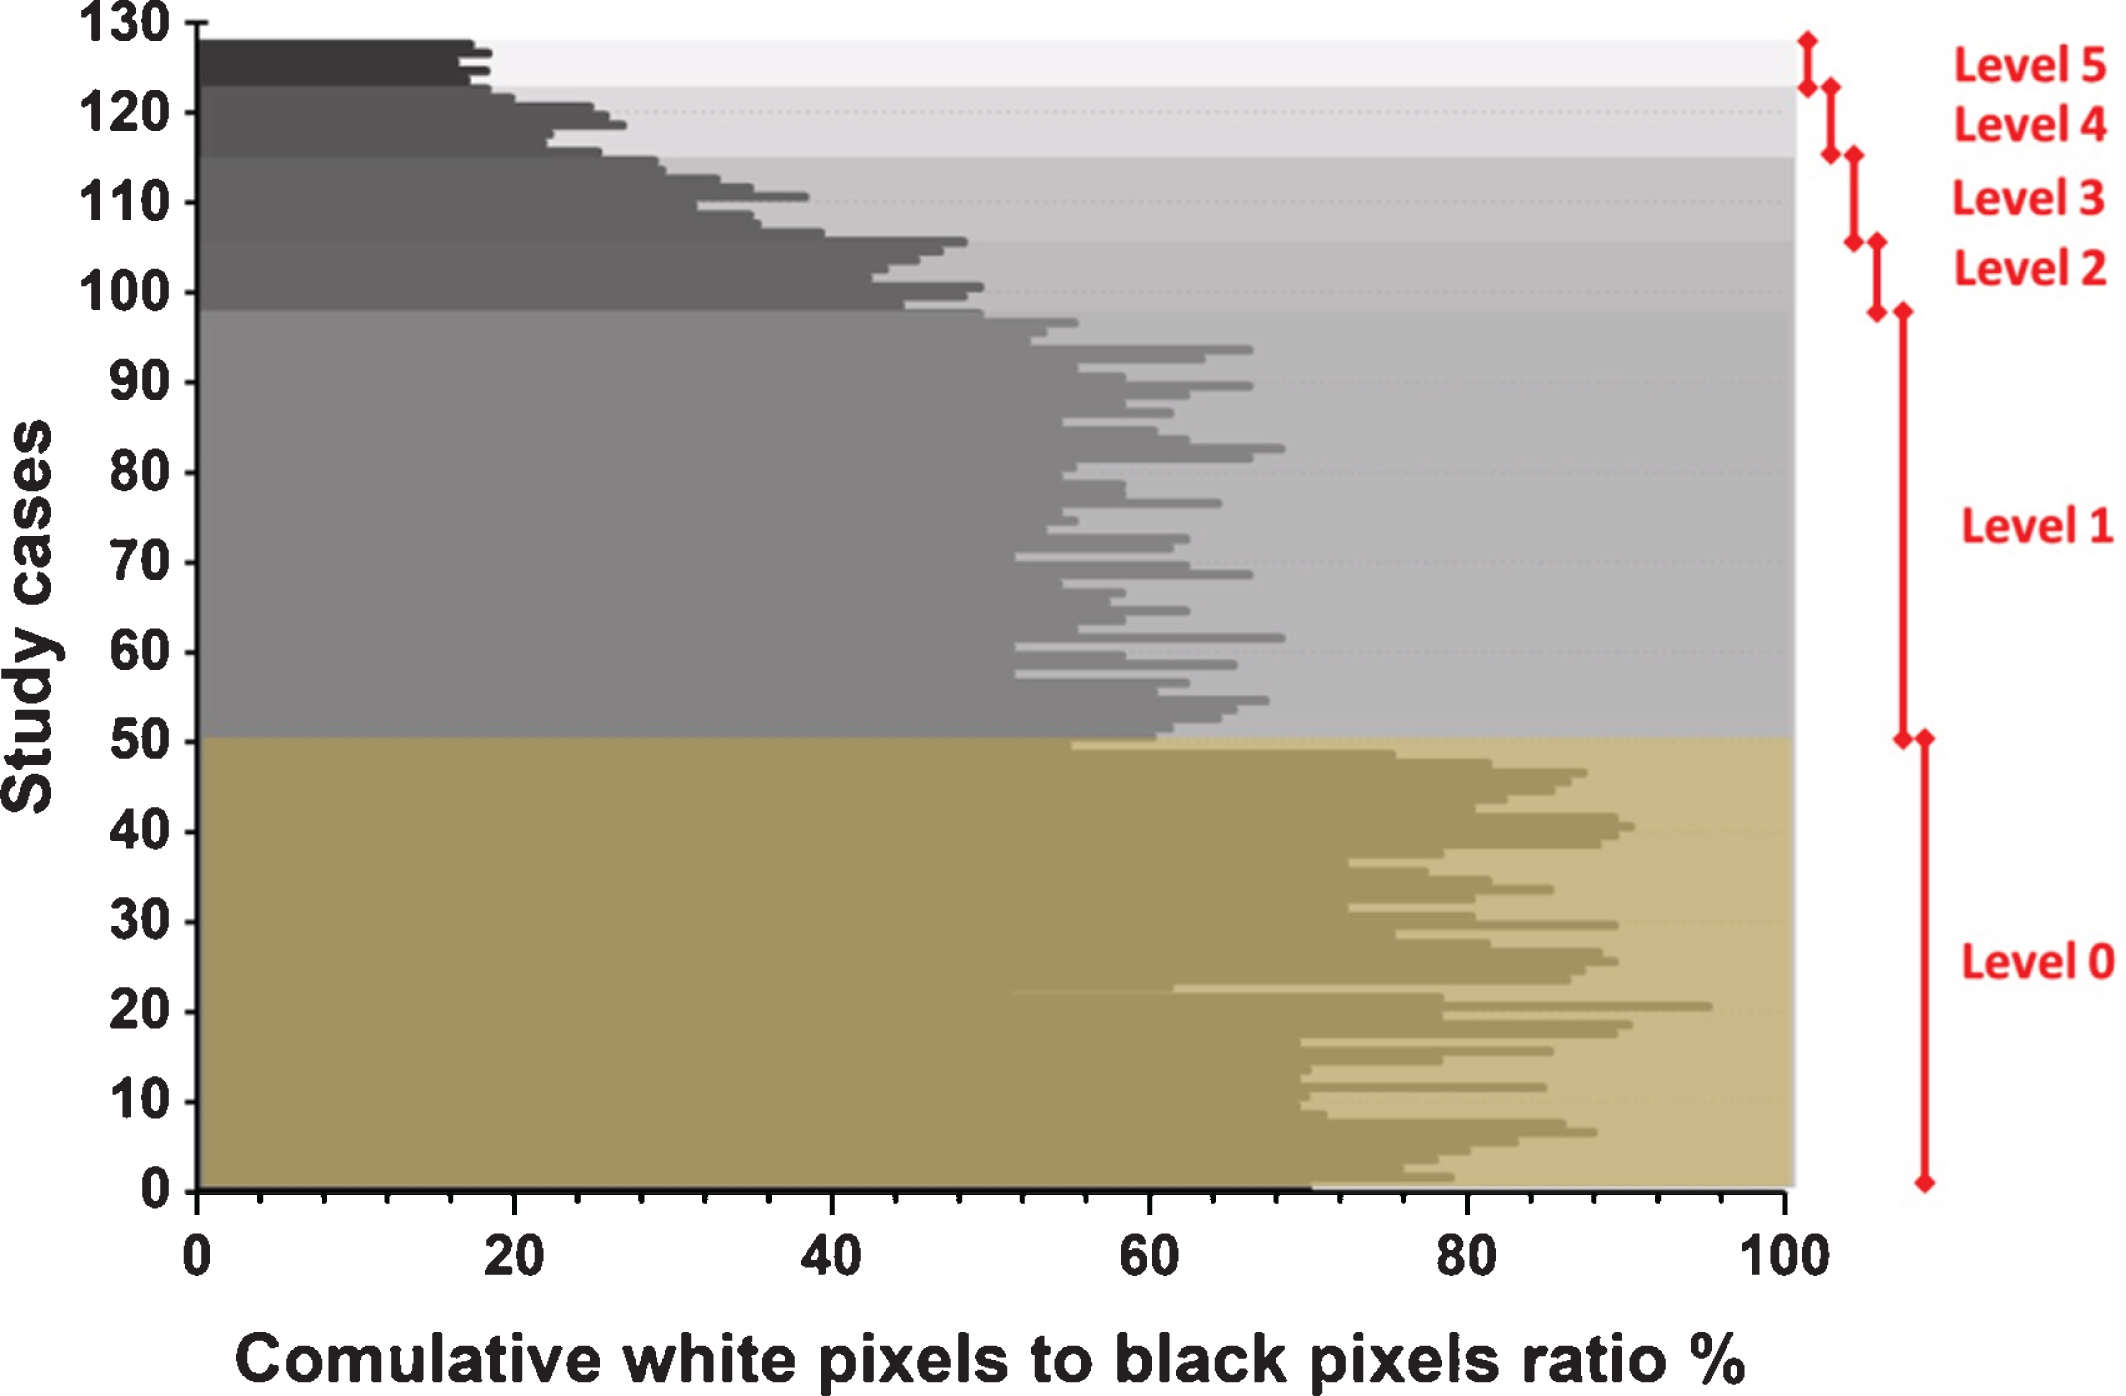
Fig. 6
The box plot for the degree of severity based on the average ratio of white to black pixels in the segmented image for each level of disease severity.
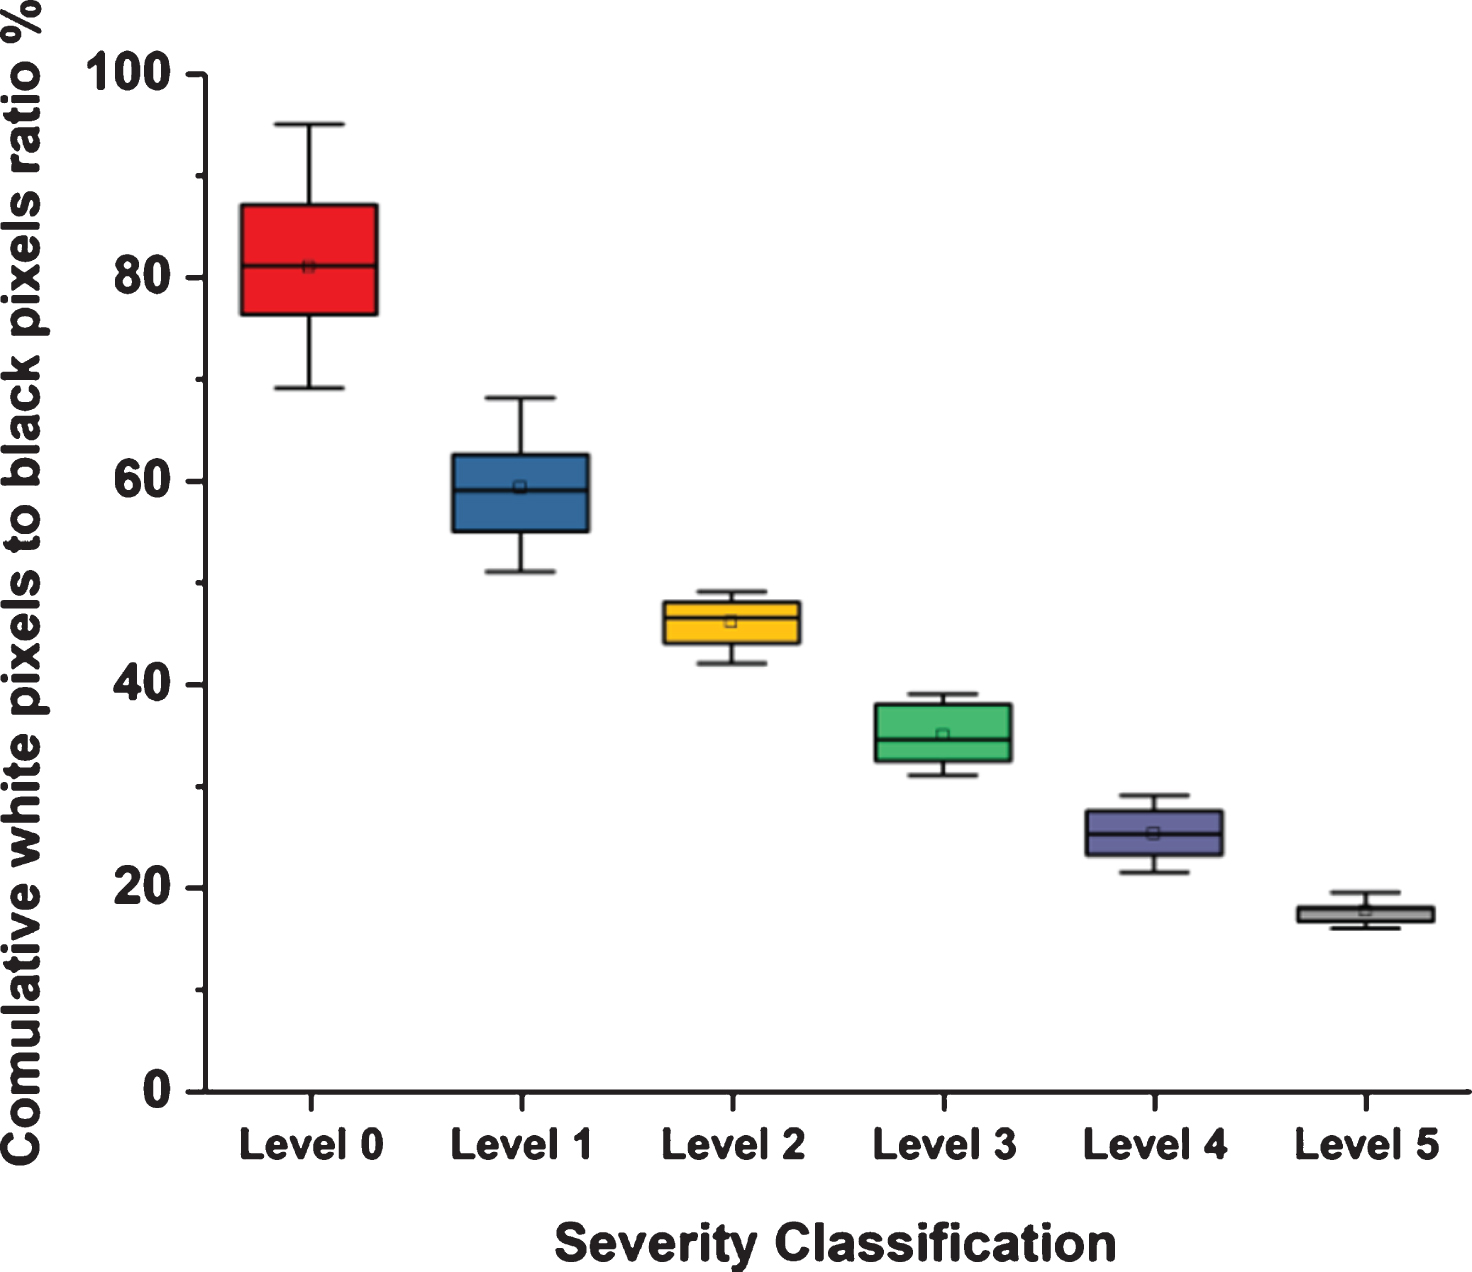
Table 1
Quantitative numbers of cumulative white-pixels-to-black-pixels ratio
| Statistical quantitative numbers of cumulative white-pixels-to-black-pixels ratio | Value | Conclusion |
| Mean | 2.205882 | The central tendency of the cases in the second degree of severity |
| Standard deviations | 1.320684 | This value represents low∼standard deviation, meaning data are clustered around the mean. |
| T-test | 0.899024 | The value of t test < 1 means there is not a significant difference between the outputs of the proposed methodology and the radiologists. |
| p-value | 0.370341 | A p-value > 0.05 means there is not a significant difference between the outputs of the proposed methodology and the radiologists. |
| Cohen’s Kappa | 0.921061 | The value of Cohen’s Kappa is between 0.81 and 1.00. This means there is perfect agreement between the outputs of the proposed methodology and the radiologists. |
4Discussion
The severity level was decided by three expert radiologists based on the provided normal and abnormal thoracic CT scans. Next, the outcome of the prototyped model was compared to the gold standard, as shown in Fig. 2. The first case study, representing Level 0 or a normal person who has not been infected with SARS-CoV-2, presented the lung in its normal shape, with a clean appearance and regions in a darkish black shade with no or minimal grey regions, indicating the presence of infections. The normal state was confirmed by the spread of the hypothetical substance over the entire area of the lung, since the spread occurs in the black space that indicates healthy lung tissue. After this, the healthy lung appears partially in black and white only, where the white part represents the entire healthy lung without any black abnormalities inside it indicating the presence of infections. The second case was an example of Level 1 severity for a person infected with the SARS-CoV-2 virus, in which the lungs are not significantly affected, as regions of infection are not clearly visible. The third case was an example of Level 2 severity in a patient suffering from some inflammation due to infection with SARS-CoV-2. Some symptoms could appear outwardly in such a patient, such as a cough or a high temperature. The fourth case was an example of Level 3 severity, a patient suffering severely from the virus. In this case, the white space representing the area of the lung that was still healthy was small. Due to the severity of this case, the left and right lungs appeared separately. The fifth case showed Level 4 severity in a patient with COVID-19. This was clearly evident when comparing the size of the white areas of the lung in this case and the previous one. The black gaps had increased in the left and the right lungs as an indication of increased lung infection and virus dissemination. Next, the sixth case presented an example of Level 5 severity in a patient, revealing a high degree of infection in the left lung. The segmented image of this patient shows severe damage in the left lung, which appears as a small white area containing many dark gaps and nonexistent borders. This is in conjunction with the presence of dark holes in the left lung. Since both the left and right lungs of this patient suffered, both appeared separately, and the area connecting them similarly suffered from infection with the SARS-CoV-2 virus.
Figure 3 shows one confirmed case of infection of the SARS-CoV-2 virus. The automatic separation of images enabled the proposed methodology to move forward with comparing the levels of disease severity in the right and left lungs. This process paves the way to knowing which parts of the lung are most vulnerable to infections resulting from the presence of the virus. This could enable researchers to determine the behavior of the virus in the pathways and the alveoli and any related genetic links, helping researchers seeking to better understand the virus and develop an effective treatment method to combat it. At this point, the proposed methodology has been able to determine the degree of infection of a patient with SARS-CoV-2 through a CT scan of the lung. In addition, this method can perform automatic separation of the left and right lung images for closer analysis.
This could provide an accurate determination of how virally compromised a specific lung is, facilitating a clear conceptualization of the best treatment approach. In addition, even a non-radiologist can easily discern the degree of injury since the method presents images that show the healthy regions of the lung only, and changes within the shape of this area are indicative of the extent of severity of the disease. Beyond this, handling a white image of the lung does not require knowledge of images of other parts of the body to differentiate them from the lung, which similarly facilitates a diagnosis of the severity of the disease. As previously mentioned, the proposed methodology measures the severity of the disease and classifies it into five levels. To ensure the reliability of the results, all CT scans of the 128 patients included in this study were evaluated by three expert radiologists. In addition, they were asked to classify the provided CT images into normal and abnormal categories and then to classify degrees of apparent disease severity to the abnormal cases. Finally, a comparison was performed between the opinions of the radiologists and the results obtained using the proposed methodology.
Figure 4 shows that the distinction between the reviews of radiologists and the outcomes of the method did not exceed 7% as a mean percentage for all stages of disorder severity. Thus, the degree of conformity between the opinions of the experts and the outcomes of the novel method was 93%. This ratio permits us to more readily count on the proposed method when calculating out the level of severity and be reasonably assured of its accuracy.
As mentioned previously, the increase in black gaps in the segmented image—and thus the reduced size of the white space in the image—indicated an increase in the level of lung infection. That is, the black space inside or around the lung is an indication of SARS-CoV-2 infection, and the white space is an indication of healthy lung tissue. The proposed methodology for determining the severity of the disease depends on discerning the ratio between white pixels to black pixels within the segmented image. The higher this percentage is, the healthier the imaged lungs are. Conversely, if this percentage is reduced to a large degree, this means that the patient is suffering greatly from the SARS-CoV-2 virus in the airways. This, together with the presence of multiple infections in the lungs, greatly impedes effective breathing function. In Fig. 5, the fifth level is the highest level of disease severity, where the percentage of white space is very little, meaning that healthy tissue in the lungs is almost nonexistent.
Figure 6 shows the distribution of the numerical data and the deviation by displaying the quartile data and averages. This figure clearly displays the average ratio of white to black pixels in the segmented images for all six severity levels that were established as part of the proposed methodology. Table 1 confirms that for the central trend of cases to the second degree of severity, the standard deviation is low, meaning that the data is clustered around the mean. The t test value < 1 means that there was no substantial difference between the outputs of the suggested technique and those of the radiologists. The p-value value > 0.05 signifies that there was no substantial difference between the outputs of the suggested technique and the radiologist outputs. Cohen’s Kappa is between 0.81 and 1.00, meaning that there was complete harmony between the performance of the proposed technique and the radiologists.
The results presented herein indicated that the proposed methodology was able to accurately determine the severity of the disease by means of CT imaging of the lungs and to easily classify case severity. In addition, this method allows one to discern risk level without needing to involve radiologists. Overall, this would allow other medical professionals to obtain clear, accurate indications of the behavior of the SARS-CoV-2 virus in the airways of the lungs. In this study, we proved that the proposed novel virtual material could be utilized for medical imaging analysis purposes. This hypothetical material has an important property, which is the ability of its parts to virtually move. That is, these particles have physical structure but only virtual properties.
The results of the study proved the ability of the proposed methodology to identify and determine the degree of severity of COVID-19 cases using a novel, unconventional way for diagnosing and screening medical imaging datasets. The sample size of this study was larger than the samples of other studies. However, the results of the study were considered accurate since the sample was large. This was shown by the periodic statistical data, which is outlined in Table 1. In addition, the study examined only cases of COVID-19 and not of any other viruses. It investigated how to simultaneously diagnose and determine the severity of the disease and focused on providing a methodology capable of diagnosing and assigning stages to COVID-19 cases.
5Conclusion
The ongoing COVID-19 pandemic represents a health and economic threat to all countries of the world. Researchers have attempted to study the natural state and behavior of this virus so that that we can confront and possibly mitigate its effects by other means while waiting for a vaccination or miracle drug to limits its spread. A number of studies have emerged that have investigated methods of detection to arrive at a diagnostic method and clarify the way the virus spreads inside the airways of the lungs.
This research provided an effective methodology for detecting the SARS-CoV-2 virus using CT imaging and then classifying its severity into six levels. This methodology is characterized by a high level of accuracy, as it relies on understanding the nature of pixels in a CT scan. As a virtual substance penetrates these points, it can quickly and efficiently locate healthy sites in the imaged lung. Next, this research presented a comparison between the results of the proposed methodology and the opinions of experts and specialists in the field of radiology. The results of the comparison showed that the opinions of specialists and the results of the methodology in classifying the stages of the disease by means of CT scans were a 93% match. This is a high percentage, indicating the possibility of relying on the proposed methodology for discovering and classifying the degree of severity of COVID-19 cases without the need for involving experts in this field. Similarly, this would help researchers and scientists to further study the nature of the spread of this dangerous virus that causes infections hindering the functioning of the lungs and makes patients suffer from other symptoms and diseases that may cause death.
Acknowledgments
The authors are thankful to the Institute of Research and Consulting Studies at King Khalid University of supporting this research through grant number # 4-N-20/21.
References
[1] | Zheng Q. , Lu Y. , Lure F. , et al., Clinical and radiological features of novel coronavirus pneumonia, Journal of X-ray Science and Technology 28: (3) ((2020) ), 391–404. |
[2] | Bernheim A. , Mei X. , Huang M. , et al., Chest CT findings in coronavirus disease-19 (COVID-19): Relationship to duration of infection, Radiology 295: ((2020) ), 685–691. |
[3] | Ai T. , Yang Z. , Hou H. , et al., Correlation of Chest CT and RT-PCR Testing in Coronavirus Disease (COVID-19) in China: A Report of Cases, Radiology 296: (2) ((2020) ), E32–E40. |
[4] | Chung M. , Bernheim A. , Mei X. , et al., CT Imaging Features of Novel Coronavirus -nCoV), Radiology 295: (1) ((2020) ), 2020–2207. |
[5] | Marinari L.A. , Danny M.A. and Miller W.T. , Sporadic coronavirus lower respiratory tract infection in adults: chest CT imaging features and comparison with other viruses, European Respiratory Journal 54: ((2019) ), PA4547. |
[6] | Yoon S.H. , Lee K.Y. , Kim J.Y. , et al., Chest Radiographic and CT Findings of the Novel Coronavirus Disease (COVID-19): Analysis of Nine Patients Treated in Korea, Korean Journal of Radiology 21: ((2020) ), 494–500. |
[7] | Xu R. , Du M , Li L. , et al., CT imaging of one extended family cluster of corona virus disease (COVID-19) including adolescent patients and silent infection, Quantitative Imaging in Medicine and Surgery 10: (3) ((2020) ), 800–804. |
[8] | Sepulcri M. , Paronetto C. and Khouzai B.E. , Effectiveness of cone beam computed tomography imaging during radiation therapy for the detection of initial coronavirus lung disease, Advances in Radiation Oncology 5: (4) ((2020) ), 697–699. |
[9] | Gozes O. , Frid-Adar M. , Greenspan H. , et al., Rapid AI development cycle for the Coronavirus (COVID-19) pandemic: initial results for automated detection & patient monitoring using deep learning CT image analysis. ArXiv, abs/2003.05037 (2020). |
[10] | Asnaoui K.E. , Chawki Y. , Using X-ray images and deep learning for automated detection of coronavirus disease, Journal of Biomolecular Structure & Dynamics (2020), 1–12. |
[11] | Georgescu B. , Chaganti S. , Alemán G.B. , et al., Machine learning automatically detects COVID-19 using chest CTs in a large multicenter cohort. ArXiv, abs/2006.04998 (2020). |
[12] | Raajan N.R. , Lakshmi V. , Prabaharan N. , Non-invasive technique-based novel corona (COVID-19) virus detection using CNN, National Academy Science Letters, National Academy of Sciences, India, (2020), 1–4. |
[13] | Zhao Y. , Xiang C. , Wang S. , et al., Radiology department strategies to protect radiologic technologists against COVID19: Experience from Wuhan, European Journal of Radiology 127: ((2020) ), 108996. |
[14] | Shen C. , Yu N. , Cai S. , et al., Evaluation of dynamic lung changes during coronavirus disease (COVID-19) by quantitative computed tomography, Journal of X-ray Science and Technology 28: (5) ((2020) ), 863–873. |
[15] | Su Y. , Han Y. and Liu J. , Tailoring steroids in the treatment of COVID-19 pneumonia assisted by CT scans: Three case reports, Journal of X-ray Science and Technology 28: (5) ((2020) ), 885–892. |
[16] | Müller M. , Gross M.H. , Interactive Virtual Materials, Proceedings of Graphics Interface (2004), 239–246. |
[17] | Chan T.F. and Vese L.A. , Active contours without edges, IEEE Transactions on Image Processing 10: (2) ((2001) ), 266–277. |
[18] | Osher S. and Sethian J.A. , Fronts propagating with curvature dependent speed: algorithms based on Hamilton-Jacobi formulations, Journal of Computational Physics 79: (1) ((1988) ), 12–49. |
[19] | Carasso A.S. and Vládar A.E. , Calibrating image roughness by estimating lipschitz exponents, with applications to image restoration, Optical Engineering 47: ((2008) ), 037012. |

