


It has long been known that people vary considerably in their ability to process spoken language, even if their objective hearing sensitivity is taken into account (Jerger, Jerger, & Pirozzolo, Reference Jerger, Jerger and Pirozzolo1991; Middelweerd, Festen, & Plomp, Reference Middelweerd, Festen and Plomp1990; van Rooij & Plomp, Reference van Rooij and Plomp1990, Reference van Rooij and Plomp1992). These individual differences may already exist when listening is relatively easy for all participants, but come out more clearly when listening is more challenging, as is the case when speech is spoken rapidly and in a conversational manner or when target speech is masked by environmental noise. Individual-differences research can inform us about the nature of spoken word recognition and its underlying mechanisms in that it shows which listener capacities are important and which are not. As such, studying individual differences can “bring us closer to a detailed mechanistic understanding of human language” (Kidd, Donnelly, & Christiansen, Reference Kidd, Donnelly and Christiansen2018).
Recently, much research attention has been devoted to individual differences in younger and older adults’ ability to understand speech in noisy listening conditions, as evidenced by meta-analyses on the association between cognitive performance and speech-in-noise performance (e.g., Dryden, Allen, Henshaw, & Heinrich, Reference Dryden, Allen, Henshaw and Heinrich2017; Füllgrabe & Rosen, Reference Füllgrabe and Rosen2016). Both meta-analyses are in line with an earlier literature overview by Akeroyd (Reference Akeroyd2008) in stressing that working memory is the cognitive capacity that has most often been related to the perception of speech masked by noise, particularly for those with hearing impairment (Füllgrabe & Rosen, Reference Füllgrabe and Rosen2016). As speech perception can already be challenging in the absence of noise if the speech itself is articulated fast and casually, we investigated if working memory capacity is similarly involved in the recognition of fast speech. While listening in noise may impose challenges because of the incomplete nature of the information, fast speech presents a somewhat different challenge given the fast speed of information delivery. Apart from evidence for working memory capacity as associated with the ability to understand speech in (various) difficult listening conditions, there is also some support for the importance of processing speed (cf. Dryden et al., Reference Dryden, Allen, Henshaw and Heinrich2017) or vocabulary knowledge (e.g., Bent, Baese-Bark, Borrie, & McKee, Reference Bent, Baese-Berk, Borrie and McKee2016). By investigating fast-speech perception, we also connect to the discussion whether specific abilities (such as processing speed) may be particularly helpful for certain adverse listening conditions (Bent et al., Reference Bent, Baese-Berk, Borrie and McKee2016; Borrie, Baese-Berk, van Engen, & Bent, Reference Borrie, Baese-Berk, van Engen and Bent2017; McLaughlin, Baese-Berk, Bent, Borrie, & van Engen, Reference McLaughlin, Baese-Berk, Bent, Borrie and van Engen2018) or, alternatively, whether listeners may possess a “global speech perception ability” that would be helpful in any kind of adverse listening condition.
In this study, we adopted a multifactor, structural equation modeling approach. We investigated how the four abilities of hearing acuity, working memory, processing speed, and vocabulary are related to the older adults’ ability to recognize fast words in acoustically undegraded and degraded conditions. As cognitive and linguistic skills may be interrelated, the use of structural equation modeling (SEM) allows us to investigate which individual (cognitive) capacity is independently associated with target performance, and which only through its association with another (cognitive) capacity. Knowing about unique predictors of spoken-language performance is critical to advance our understanding of the nature of spoken-word recognition. In the remainder of this section, we will elaborate on the importance of these abilities in relation to accounts of the nature of spoken word processing, and on the theoretically inspired question of whether their contribution increases when performance drops to (even) lower levels.
Theoretical models, such as Shortlist B (Norris & McQueen, Reference Norris and McQueen2008), TRACE (McClelland & Elman, Reference McClelland and Elman1986), the Neighborhood Activation Model (Luce & Pisoni, Reference Luce and Pisoni1998), and EARSHOT as a more recent model (Magnuson et al., Reference Magnuson, You, Luthra, Li, Nam, Escabí and Rueckl2020), posit a potential architecture for word recognition, but leave the issue of individual differences underspecified. The models agree on general principles in spoken word recognition, such as the concept of graded activation of multiple word candidates (i.e., word representations being activated depending on their similarity to the presented signal) and concepts of competition between word candidates and selection of one best fitting candidate. In principle, word recognition models leave room for individual differences “in the rate at which words accumulate activation, the strength of competition effects, and other factors” (McMurray, Samelson, Lee, & Tomblin, 2010). A way forward is to identify which sensory, cognitive, or linguistic capacities matter for spoken word recognition, and how these potentially interact with the difficulty of the listening situation. Once identified, we can start to model which capacities are drawn on when.
Several capacities have already been identified. Hearing, as the first capacity to be considered, clearly plays a role in the activation and competition processes required for spoken word recognition, and measures of hearing acuity are routinely included in speech processing studies with older adults (e.g., Humes, Reference Humes2002, Reference Humes2007). Hearing acuity determines the quality of the speech signal’s auditory representation, which in turn affects activation of word candidates and selection between them (Farris-Trimble, McMurray, Cigrand, & Tomblin, Reference Farris-Trimble, McMurray, Cigrand and Tomblin2014; McMurray, Farris-Trimble, & Rigler, Reference McMurray, Farris-Trimble and Rigler2017). Poor speech audibility due to hearing loss can be problematic particularly for the recognition of fast and reduced speech (e.g., Janse & Ernestus, Reference Janse and Ernestus2011; Picheny, Durlach, & Braida, Reference Picheny, Durlach and Braida1985) because this type of speech is less distinctive than carefully articulated speech.
Second, as mentioned above, there is abundant evidence, both from speech and text processing, that memory capacity is a robust predictor of language processing (see Daneman & Merikle, Reference Daneman and Merikle1996 for a review). Furthermore, Akeroyd’s literature review of cognitive predictors for speech perception (Reference Akeroyd2008) showed that working memory measures (reading span in particular) were the most consistent cognitive predictors of speech perception performance in noise, which was also the case for recognition of single words (but cf. evidence by Füllgrabe and Rosen (Reference Füllgrabe and Rosen2016) that this association may be stronger for older or poorer hearing populations than for young normal hearing populations). On the basis of general capacity models (Baddeley, Reference Baddeley and Pickering2006; MacDonald, Just, & Carpenter, Reference Just and Carpenter1992; Rönnberg, Rudner, Foo, & Lunner, Reference Rönnberg, Rudner, Foo and Lunner2008), working memory capacity may be involved in spoken word recognition, as resources available for processing (and hence for activation and selection processes) are assumed to be limited. The strain that limited working memory capacity puts on activation and selection processes for spoken word processing should therefore be particularly visible when processing is somehow taxing, as would be the case in adverse listening conditions. For example, in the ease of language understanding (ELU) model, working memory capacity specifically comes into play in adverse listening conditions when speech no longer “automatically” maps onto stored representations (cf. Rönnberg et al., Reference Rönnberg, Rudner, Foo and Lunner2008, Reference Rönnberg, Lunner, Zekveld, Sörqvist, Danielsson, Lyxell and Rudner2013; Zekveld, Rudner, Johnsrude, Heslenfeld, & Rönnberg, Reference Zekveld, Rudner, Johnsrude, Heslenfeld and Rönnberg2012) and the speech signal can only be interpreted through explicit resource demanding processing. The ELU model, therefore, like other general capacity models, predicts that the role of working memory will be more important as listening conditions become more challenging.
In other working memory models, working memory is more specifically defined as the ability to activate information in long-term memory and to keep it active for ongoing processing (e.g., Cowan, Reference Cowan2005; Ericsson & Kintsch, Reference Ericsson and Kintsch1995; MacDonald & Christiansen, Reference MacDonald and Christiansen2002). These models actually fit quite well with lexical access mechanisms as they argue that working memory contains or consists of activated long-term memory information. Working memory capacity may then index an individual’s ability to activate (and to keep active) multiple long-term memory representations in order to efficiently resolve the competition process between them (also cf. Sommers, Reference Sommers1996; Sommers & Danielson, Reference Sommers and Danielson1999; Taler, Aaron, Steinmetz, & Pisoni, Reference Taler, Aaron, Steinmetz and Pisoni2010), rather than capacity for more explicit, task management functions (as in the resource capacity account above). Of importance, in these long-term memory based models (Cowan, Reference Cowan2005; Ericsson & Kintsch, Reference Ericsson and Kintsch1995; Jones, Gobet, & Pine, Reference Jones, Gobet and Pine2007; MacDonald & Christiansen, Reference MacDonald and Christiansen2002), working memory capacity is thought to be domain specific and mediated by an individual’s expertise or experience. Consequently, working memory capacity would then not also reflect processing resources available for any task at hand but also would more specifically reflect memory for verbal material (as operationalized in verbal working memory measures, such as reading span, digit span, and nonword repetition).
This “verbal expertise” brings us to a third prime candidate that potentially plays a role in facilitating spoken word recognition: vocabulary knowledge. In reading research, the lexical quality hypothesis by Perfetti (Reference Perfetti, Gough, Ehri and Treiman1992) holds that a crucial determinant of skilled language processing is the precision of the language user’s lexical representations (e.g., Andrews & Hersch, Reference Andrews and Hersch2010; Yap, Balota, Sibley, & Ratcliff, Reference Yap, Balota, Sibley and Ratcliff2012; Yap, Tse, & Balota, Reference Yap, Tse and Balota2009). Yap et al. (Reference Yap, Tse and Balota2009, Reference Yap, Balota, Sibley and Ratcliff2012) suggest that as readers acquire more experience with words, they become increasingly reliant on “automatic lexical processing mechanisms,” and less on explicit attention-demanding processing. Reading skill in their work is generally operationalized by vocabulary knowledge, under the assumption that the size of an individual’s vocabulary is positively related to the precision (Perfetti, Reference Perfetti2007; Perfetti & Hart, Reference Perfetti, Hart, Verhoeven, Elbro and Reitsma2002) and stability (Kinoshita, Reference Kinoshita2006) of the underlying lexical representations. The functional consequence of representations being more precise or fully specified is argued to be that the input will fully determine the representation to be activated, such that a single correct representation is activated with minimal activation of competing candidates. In other words, experience may sharpen lexical representations to “emphasise the features of a word that distinguish it from similar words” (Andrews & Hersch, Reference Andrews and Hersch2010).
In speech research, associations have been reported between vocabulary knowledge and the ability to understand noisy speech (McLaughlin et al., Reference McLaughlin, Baese-Berk, Bent, Borrie and van Engen2018; Tamati, Gilbert, & Pisoni, Reference Tamati, Gilbert and Pisoni2013), periodically interrupted speech (Benard, Mensink, & Başkent, Reference Benard, Mensink and Başkent2014), foreign-accented speech (Bent et al., Reference Bent, Baese-Berk, Borrie and McKee2016; McLaughlin et al., Reference McLaughlin, Baese-Berk, Bent, Borrie and van Engen2018), as well as dysarthric (disordered) speech (McAuliffe, Gibson, Kerr, Anderson, & LaShell, Reference McAuliffe, Gibson, Kerr, Anderson and LaShell2013). McLaughlin et al. (Reference McLaughlin, Baese-Berk, Bent, Borrie and van Engen2018), for instance, argue that the association with vocabulary knowledge could be interpreted as either cause or effect of better adverse listening. Greater receptive vocabulary may entail that listeners have stronger lexical mappings, allowing them access to semantic representations even when input is somehow deviant or degraded. Conversely, listeners performing well in adverse conditions may be better able to acquire larger vocabularies “from a variety of talkers and in a variety of situations.”
The association between vocabulary knowledge and speech-in-noise performance (for accented as well as unaccented speech) was also investigated by Banks, Gowen, Munro, and Adank (Reference Banks, Gowen, Munro and Adank2015), whose path-analysis results provided evidence that vocabulary mediated the relationship between working memory and recognition accuracy or accented speech. In other words, vocabulary had a direct, and working memory only an indirect effect, on recognition accuracy. Note that the notion of precision and stability of lexical representation as put forward in the reading literature, as well as the primary role of vocabulary over working memory, as argued for by Banks et al. (Reference Banks, Gowen, Munro and Adank2015), is largely similar to the idea of domain-specific working memory.
Furthermore, as a fourth capacity to be considered, we asked whether processing speed plays an independent role in spoken-word processing. Processing speed was not listed as a consistent predictor of speech perception performance in Akeroyd (Reference Akeroyd2008)’s literature review. However, the more recent meta-analysis by Dryden et al. (Reference Dryden, Allen, Henshaw and Heinrich2017) mentioned a numerically higher correlation coefficient between speech-in-noise performance and processing speed (r = .39) than between speech-in-noise performance and working memory (r = .28). Processing speed may reflect the rate at which words accumulate activation, and may index how quickly individuals can derive information from an unfolding speech signal. In contrast to reading, where the reader can determine the speed of language input, listeners are at the mercy of their interlocutor’s speech rate. If processing speed plays an independent role in spoken-word recognition, we may be more likely to find it in the processing of fast speech than in the processing of carefully read aloud speech embedded in noise. In the “working memory as activated long-term memory” models (Cowan, Reference Cowan2005; Ericsson & Kintsch, Reference Ericsson and Kintsch1995; MacDonald & Christiansen, Reference MacDonald and Christiansen2002), processing speed may relate to the ability to quickly access information in long-term memory, and hence to working memory.
The present study
For each of the four abilities mentioned above, there is evidence that they are related to speech recognition. This study adopted a multifactor, SEM approach to test them in conjunction, to clarify whether hearing acuity, verbal working memory capacity, processing speed, and vocabulary knowledge can independently account for variance in the accuracy with which words taken from fast speech can be recognized, and which only indirectly relate to performance (being mediated by other constructs). As such, SEM provides pointers to which abilities can help us understand spoken-word recognition (for a primer on SEM, the reader is referred to Goodboy & Kline, Reference Goodboy and Kline2017).
Older adults were tested as these may be assumed to form a heterogeneous group, both in terms of cognitive abilities and in terms of hearing acuity, and hence in terms of how well they can cope with the input signal. In addition, this study tested speech recognition at two performance levels. This allowed us to address the hypothesis derived from the ease of language understanding model, that working memory would be drawn on more in more adverse conditions. It would also help understand for each of the other variables how or under what conditions speech recognition draws on them. The general prediction is that the association between precursor capacities and spoken word recognition is stronger when listening is more challenging, because (more) adverse listening conditions place greater demands on listeners’ capacities to recover the information in the speech signal. The strongest evidence for this comes from Heinrich and Knight (Reference Heinrich and Knight2016), who tested correlations between hearing acuity and speech-in-noise performance at two different recognition levels by manipulating signal-to-noise ratio, and found that the association with hearing acuity was stronger at the poorer recognition level.
The speech fragments for the word recognition task were taken from conversational or fast fragments. This speech is more difficult to process than clear speech, as the information presented is often less distinctive (or “acoustically reduced,” implying segments missing and vowel or consonant contrasts not being fully realized) and is presented in less time (Ernestus, Baayen, & Schreuder, Reference Ernestus, Baayen and Schreuder2002; Janse, Reference Janse2004; Janse, Nooteboom, & Quené, Reference Janse, Nooteboom and Quené2007; Ranbom & Connine, Reference Ranbom and Connine2007; Tucker, Reference Tucker2011; van Engen, Chandrasekaran, & Smiljanic, Reference van Engen, Chandrasekaran and Smiljanic2012; Koch & Janse, Reference Koch and Janse2016). As mentioned above, we also investigated whether the strength of the association between the precursor capacities and speech recognition performance changes when word recognition is made more challenging. To this end, speech audibility of the fast words was manipulated by low-pass filtering the acoustic signal. This type of filtering presents a rough estimation of high-frequency hearing loss (age-related hearing loss typically affecting the high-frequency part of the speech spectrum most), such that we can simulate dampening of high-frequency spectral information even in participants with better hearing. The same type of low-pass filtering degradation brought younger adults to the same speech recognition level as older adults in a study in which reduced words and fragments taken from conversational speech were presented (Janse & Ernestus, Reference Janse and Ernestus2011). Inclusion of this filtering manipulation in the present study thus enabled us to investigate the contribution of speech audibility to fast-word recognition from two angles: by looking at continuous variation in high-frequency hearing loss in our participant sample of older adults who are not wearing hearing aids and by low-pass filtering the signal.
Method
Participants
A total of 105 participants were tested in this study (36 male and 69 female). All of them were native speakers of Dutch, living independently in the Nijmegen area. They were all over 60 years of age. They were recruited from the Max Planck Institute participant pool and were paid for their participation (Є8 per hour). They did not report any neurological damage and did not wear hearing aids in their daily life. No other criteria were set with respect to participants’ hearing ability. Mean age was 68.26 years (SD = 6.06, range = 60–83 years).
Tasks and materials
Hearing acuity
Air-conduction hearing thresholds were assessed with an Oscilla USB-300 screening audiometer in a sound-attenuating booth. Mean thresholds are given in Figure 1 for octave frequencies from 0.25 to 8 kHz for both the left and right ear. A high-frequency pure-tone average (HFPTA) was calculated for each participant’s better ear over 1, 2, and 4 kHz as an index of high-frequency hearing loss (higher values indicating poorer hearing). Mean HFPTA was 23.44 dB HL (SD = 10.79, range = 5–51.67).
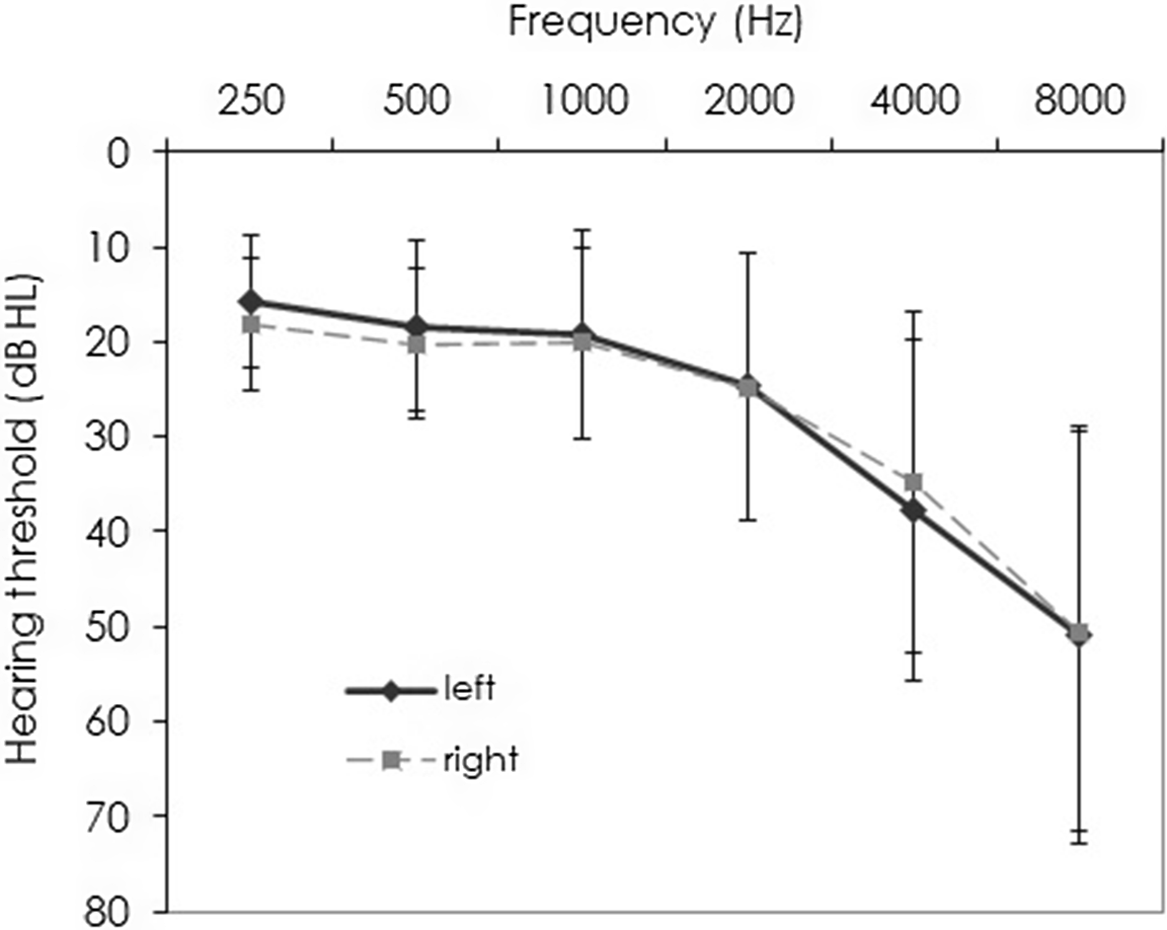
Figure 1. Mean hearing thresholds (dB HL) for both ears at octave frequencies from 250 through 8000 Hz. Error bars indicate one standard deviation.
Working memory
Backward digit span
A computerized version of the backward digit span task (a subpart of the Wechsler Adult Intelligence Test; Wechsler, Reference Wechsler2004) was used to measure individual working memory capacity (E-Prime v1.2 software was used; Schneider, Eschman, & Zuccolotti, Reference Schneider, Eschman and Zuccolotto2002). In this task, a series of digits appeared sequentially in the center of the computer screen for 1 s. The interval between consecutive digits was 1 s. Digits were presented in a large white font (Arial, font size 100) against a black background. After the presentation of a digit sequence (e.g., 3 6 2), participants were prompted to recall the digits in reversed order (e.g., 2 6 3) by typing them in on the computer keyboard. Participants first practiced with two three-digit trials, before being tested twice on sequences including 2 to 7 digits (i.e., 12 trials in total). Trials were the same for all participants regardless of their performance. Individual performance on this task was determined as the proportion of correctly recalled digit sequences out of 12 test trials, regardless of digit sequence length. Larger proportions thus indicated better working memory. Mean proportion correct in this task was 0.47 (SD = 0.18).
Auditory short-term memory
An auditory nonword repetition task was used as an index of verbal/phonological short-term memory (Gathercole & Baddeley, Reference Gathercole and Baddeley1996; Thorn & Gathercole, Reference Thorn and Gathercole1999). Researchers have also referred to it as an index of phonological storage (e.g., Gathercole, Reference Gathercole2006), phonological buffer capacity (Bates, Luciano, Montgomery, Wright, & Martin, Reference Bates, Luciano, Montgomery, Wright and Martin2011), or phonological working memory (Gathercole, Willis, Baddeley, & Emslie, Reference Gathercole, Willis, Baddeley and Emslie1994; McGettigan et al., Reference McGettigan, Warren, Eisner, Marshall, Shanmugalingam and Scott2011). The task has been widely used in research on developmental dyslexia (e.g., Ramus & Szenkovits, Reference Ramus and Szenkovits2008). The task consisted of the presentation of 50 nonwords, all of which were phonotactically legal in Dutch (de Jong & van der Leij, Reference de Jong and van der Leij1999). The speaker was a professional speech therapist and female native speaker of Dutch who spoke at a consistently slow and clear speaking rate. The nonword items were presented over headphones at a fixed mean intensity level of 80 dB SPL (E-Prime software v1.2 was used for computerized presentation). Participants were seated in a sound-attenuating booth. Each nonword was presented only once, after which participants were asked to repeat the nonword. Intertrial time was 3 s. Nonwords of different syllable lengths (two to five syllables long) were presented intermixed, but the order in which they were presented was kept constant for all participants. Responses were recorded to allow for offline scoring. Transcription and scoring was done by a native speaker of Dutch. If all syllables of a particular item were reproduced correctly, a score of 1 was obtained. If not all syllables were repeated correctly, a proportion correct was computed (number of correctly repeated syllables divided by total syllable number for that target nonword). Maximum score for the entire task was thus in principle 50 (for 50 correctly repeated nonword items). Mean score for this task was 35.82 (SD = 7.06). Higher scores reflected better auditory verbal short-term memory. As hearing sensitivity significantly correlates with performance on this auditory task (r = –.64, p < .001), individual task scores were corrected for hearing sensitivity differences by replacing them with the residuals of a linear regression model predicting nonword repetition performance as a function of hearing sensitivity.
Reading span
A computerized standard version of a reading span test was used with Dutch-language materials (van den Noort, Bosch, Haverkort, & Hugdahl, Reference van den Noort, Bosch, Haverkort and Hugdahl2008). The test was programmed in E-Prime v1.2. The test has five different versions of which two (Series 1 and 2) were administered to our participants. The participants’ task was to read each sentence aloud. When participants had finished reading a sentence, they pressed the space bar, after which another sentence appeared on the screen. If the participant could not finish the sentence within 8 s, the computer automatically presented the next sentence. When a participant had completed all the sentences of a set, the word “recall” was presented. At that point, participants had to recall the last word of each sentence in the set. The order of recall was free. When done recalling, the participant could either press the space bar or wait for the time-out of 15 s, after which the program would proceed with the next set (note that this reading span task does not involve semantic anomaly judgments as in some papers, e.g., in Rudner, Rönnberg, & Lunner, Reference Rudner, Rönnberg and Lunner2011; Zekveld et al., Reference Zekveld, Rudner, Johnsrude, Festen, van Beek and Rönnberg2011).
As in the original reading span test (Daneman & Carpenter, Reference Daneman and Carpenter1980), the sentences within each series were presented in different set sizes (2, 3, 4, 5, or 6 sentences), such that participants could not anticipate when the “recall” sign would appear. The total number of correctly remembered words was determined. Each series consisted of 20 sentences, such that in principle maximum score of correctly remembered words is 40. Mean total number of remembered words was 24.24 (SD = 5.36).
Information processing speed
Digit-symbol substitution performance
Participants completed the paper-and-pencil Digit Symbol substitution test, which measures the time needed to recode a number of digits to symbols (cf. also Deary, Johnson, & Starr, Reference Deary, Johnson and Starr2010; Hoyer, Stawski, Wasylyshyn, & Verhaeghen, Reference Hoyer, Stawski, Wasylyshyn and Verhaeghen2004, Lemke & Zimprich, Reference Lemke and Zimprich2005). This test is part of the Wechsler Adult Intelligence Scale Test (Wechsler, Reference Wechsler2004). Participants were given 90 s in which they should try and substitute as many digits for symbols (given a key at the top of the page). The mean number of correct substitutions was 48.2 (SD = 10.66), such that mean time needed to code a digit into a symbol was 2.12 s (SD = 0.62). The latter value (in milliseconds) was entered as a variable for information processing speed, such that lower numbers reflect faster processing.
Letter comparison
In this task, participants were presented with two letter strings (all consonants) on the computer screen: one centered in the top half of the screen and one string centered in the lower half. As in the other computerized experiments, E-Prime software v1.2 was used. Participants were instructed to decide as quickly as possible whether the two letter strings were the same or different by pressing buttons on a response button box labeled “same” or “different” (see Earles & Salthouse, Reference Earles and Salthouse1995; Salthouse, Reference Salthouse1996 for a paper-and-pencil version of this task as a speed measure). In the first experimental block, letter strings of both strings to be compared were made up of three letters (e.g., TZF). In the second block, six letter strings (e.g., RNHKTG) were presented. Letters were presented in a large black font (Arial 60) against a white background. If the strings were different, they would only differ in one letter in any of the three (for the three-letter strings) or six (for the six-letter strings) positions. Within each block, 12 trials contained identical strings and 12 trials contained different strings, making up 48 trials in total. In order to familiarize participants with the task, participants were first presented with six practice trials. If the procedure was clear, they would proceed to the test phase. Each trial would start with the presentation of a fixation cross, which stayed on the computer screen for 500 ms. After another 100 ms, the two letter strings would be presented. These letter strings would stay on the screen until the participant responded. The next trial would be presented after an intertrial time of 1000 ms. Mean accuracy proportion over the 48 test trials was 0.97 (SD = 0.03). For all correct responses, an RT cutoff criterion of 3 SD above the overall mean was calculated. This led to exclusion of 1.2% of the data points. On the basis of this data set (incorrect and extremely slow responses excluded), each participant’s mean RT was calculated and was entered as individual speed. Mean letter comparison RT was 1842 ms (SD = 387). As in the digit-symbol substitution task, lower values reflect faster processing speed.
Vocabulary knowledge
A 60-item receptive multiple-choice test was used to assess vocabulary size (Andringa, Olsthoorn, van Beuningen, Schoonen, & Hulstijn, Reference Andringa, Olsthoorn, van Beuningen, Schoonen and Hulstijn2012). The test by Andringa et al. (Reference Andringa, Olsthoorn, van Beuningen, Schoonen and Hulstijn2012) consists of a selection of items from Hazenberg and Hulstijn’s (Reference Hazenberg and Hulstijn1996) test for second-language speakers of Dutch and new items that make the test suitable for native speakers. Target words were presented on a computer screen (Courier, font size 15) in neutral carrier sentences (e.g., the target word mentaliteit [“mentality”] was presented in the carrier phrase “Wat een vreemde mentaliteit!” [“What a strange mentality!”]). Participants were asked to choose the best description of the word’s meaning out of five alternatives (e.g., for “mentality”: 1. Table; 2. Person; 3. Way of thinking; 4. Atmosphere; or 5. I really don’t know). The last option was always “I really don’t know.” Individual scores were defined as the number of correct items (out of 60). Higher scores indicated better vocabulary knowledge. The mean number of correct items was 52.19 (SD = 4.08). For the sake of the analyses, the vocabulary items were randomly divided over three subsets consisting of 20 items each.
Word recognition
Stimuli creation
Words to be presented as target stimuli for the present study were taken from Dutch sentences also used and described in Adank and Janse (Reference Adank and Janse2009). The sentences were translations from sentence material in the Speed and Capacity of Language Processing Test (Baddeley et al., Reference Baddeley, Emslie and Nimmo-Smith1992). In this test, which can be administered in a written or auditory form, the participant has to decide as accurately and as quickly as possible whether sentence statements are true or false (e.g., for a true sentence: People wear socks on their feet; and for a false sentence: Most cars run on apple juice). There were 180 sentences in total (90 true and 90 false statements).
The speaker was a 31-year-old male speaker of Standard Dutch who had lived in the Netherlands all his life. The true and false sentences were presented for the speaker to read on a computer screen. He was asked to read the sentences as declarative statements. The speaker had already produced all sentences at his normal rate before producing them at a fast rate. For the fast-rate recording, he was instructed to always first read the sentence silently, and to then pronounce each sentence four times in a row. This turned out to be the most efficient way to produce the sentences quickly, fluently, and accurately. The fast and acoustically reduced speech style that the speaker produced through this elicitation procedure will be referred to as fast. The recordings were made in a sound-treated room, using a Sennheiser ME64 microphone. The recordings were saved as separate sentence files and downsampled to 22050 Hz (to limit file loading time). Out of the four attempts to produce each sentence, the second sentence was selected in the majority of the cases. As noted in Adank and Janse (Reference Adank and Janse2009), mean speech rate of these fast sentences was 10.2 intended syllables/s (SD = 1.6 syllables/s) and young listeners’ sentence verification accuracy on these fast sentences was significantly poorer than on the normal-rate sentences (82% in the fast condition [chance level being 50%], versus 97% in the normal-rate condition, which had a mean speech rate of 4.7 syllables/s).
Out of the 180 sentences, 100 noun words were excised as stimuli for the present study and were stored as separate audio files. The stimuli were faded in and out with a 10-ms raised cosine window to avoid too abrupt sound onsets and offsets (all speech signal editing was done in Praat, available from www.praat.org). The nouns were taken from sentence-initial, sentence-medial and sentence-final positions. Due to the fast speaking style, some extracted items may have contained coarticulatory information about segments from preceding or following words. Nouns were one to four syllables long. Several nouns were in plural form (e.g., stoelen “chairs,” ooms “uncles,” and vleugels “wings”). Word frequencies (per million words) for these nouns were extracted from the SUBTLEX-NL corpus (Keuleers, Brysbaert, & New, Reference Keuleers, Brysbaert and New2010). Mean log word frequency of the items was 2.63 (SD = 0.89).
Stimuli were low-pass filtered with a sloping filter with a 20 dB/octave rolloff from 1 kHz onward. This filtering manipulation hardly affected the mean intensity of the stimuli (intensity difference between conditions being smaller than 1 dB).
Each participant was presented with 100 items in total, half unfiltered and half filtered. The items were divided over two stimulus lists according to a Latin-square design. Items that were filtered in stimulus list one were unfiltered in stimulus list two and vice versa. For the sake of the statistical analyses, the stimulus lists were further divided into subsets (or parcels) of 25 items (UnfilteredSetA, UnfilteredSetB, FilteredSetA, and FilteredSetB). Thus, on one list, the same set of 25 items makes up UnfilteredSetA, whereas it makes up FilteredSetA on the other list.
In order to have intelligibility reference data for the words in the two listening conditions, we presented the stimuli to a small sample of young normal-hearing adults (N=14, all native speakers of Dutch aged between 19 and 24 and students at Radboud university), following the same task procedure as outlined below. Pure-tone thresholds in the young participants’ better ear (at octave frequencies from 0.25 kHz to 8 kHz) did not exceed 15 dB HL. Mean accuracy in the unfiltered condition was 70% (SD = 5.89), and mean accuracy in the filtered condition was 56% (SD = 10.88). These data show that intelligibility of the fast words, even in the unfiltered condition, was not at ceiling for a young normal-hearing listener group either.
Task procedure
Participants were told that they would be presented with words taken from fast speech and that they would have to identify the words. The experiment was run using E-Prime software v1.2. Each trial started with a large black fixation cross, against a white background, which stayed in the center of the screen for 500 ms. The fixation cross was followed by a 200 ms blank screen, after which the auditory stimulus was presented. Participants were presented with the stimuli over closed headphones (Sennheiser HD 215) in a sound-attenuated booth at an average presentation level of 80 dB SPL (each unfiltered stimulus had been set to the same mean intensity level and the filtering manipulation had hardly affected mean intensity). All words were presented diotically. Items in the unfiltered and low-pass filtered conditions were presented intermixed as the order of items on the list was randomized for each participant. They were encouraged to guess which word had been presented if the word was unintelligible and to type in their responses using a regular computer keyboard. Whenever participants were not comfortable using a keyboard, the student assistant would type in the responses for them. After the participant had pressed the Enter key, the next trial would start (with the 500 ms fixation cross). Prior to the start of the test phase, 12 practice items were presented to familiarize participants with the talker and the task. The listening task took approximately 15 min.
All responses to the speech stimuli were scored by a human rater as being correct (coded as 1) or incorrect (coded as 0). Whenever a plural ending was added or omitted, this was scored as correct. The rater also gave full credit whenever there were obvious typos (e.g., sinmasappel for sinaasappel “orange”). Mean accuracy in the unfiltered condition was 52% (SD = 15, range: 12%–82%), and mean accuracy in the low-pass filtered condition was 25% (SD = 13, range: 4%–62%). Broken down by item set, mean performance accuracy was 51% (SD = 15) for UnfilteredSetA, 53% (SD = 17) for UnfilteredSetB, 24% (SD = 13) for FilteredSetA, and 26% (SD = 15) for FilteredSetB. There were no violations of normality in these accuracy distributions, such as skewness of kurtosis. Accuracy performance is also given in Figure 2.
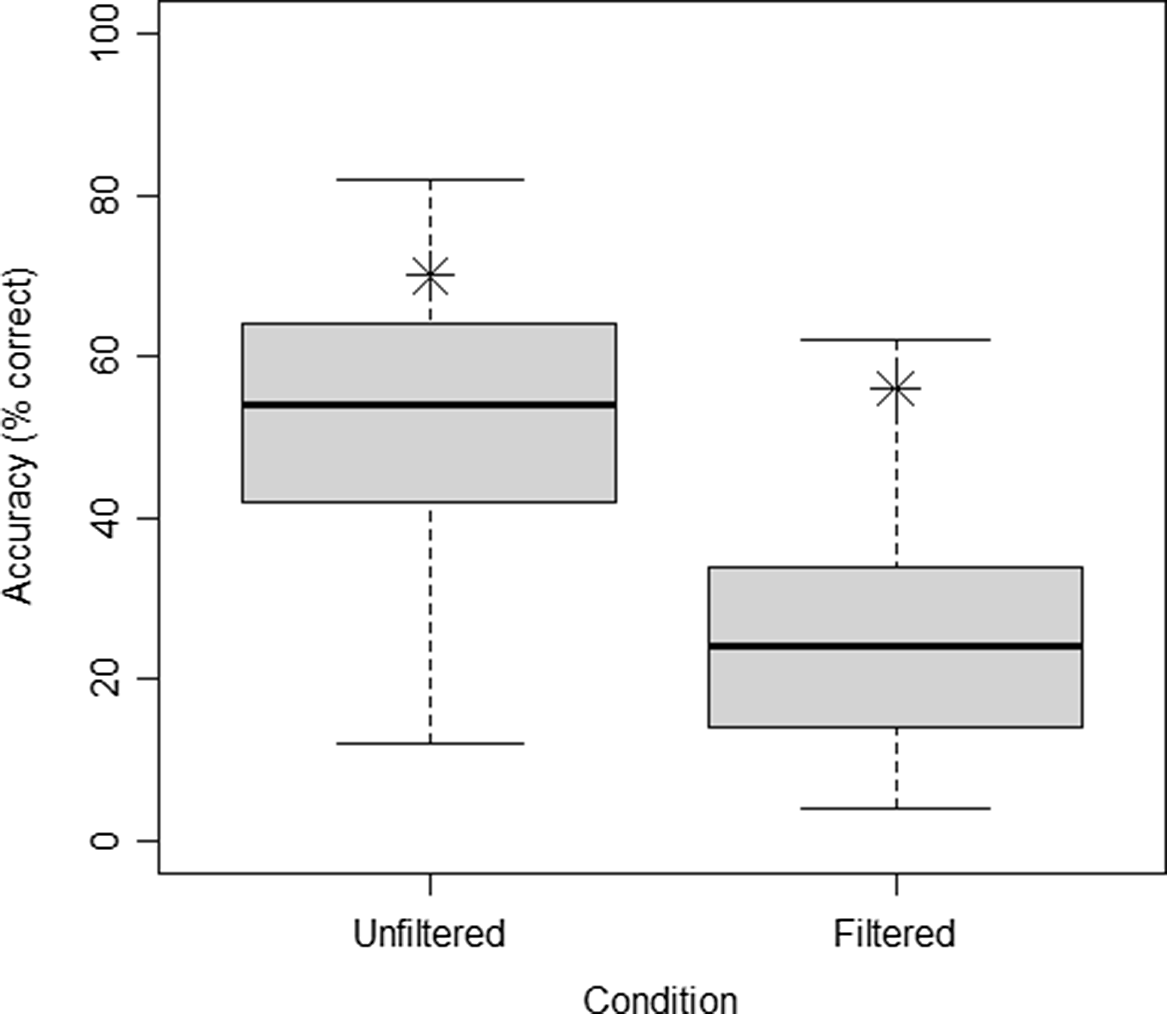
Figure 2. Boxplot of accuracy performance in the two listening conditions. Asterisks indicate mean word recognition accuracy of a young normal-hearing reference group.
Participants were first presented with the listening task (which took about 15 min) and then with the other tasks (test of hearing acuity [10 min], digit-symbol substitution task [2 min], nonword repetition [10 min], digit span task [5 min], letter comparison [8 min], vocabulary task [15 min], and reading span [10 min]). The total session, including small breaks between tests, lasted about an hour and a half.
Analyses
SEM was used to model the relationship between word recognition accuracy and the hypothesized predictors (see Goodboy & Kline, Reference Goodboy and Kline2017, for an introduction to SEM). SEM combines confirmatory factor analysis and correlation and regression, and distinguishes measurement models from structural models. At the level of measurement, the goal was to assess how well the measures described above are indicators of word recognition accuracy, hearing sensitivity, working memory, processing speed, and receptive vocabulary knowledge. At the structural level, the goal was to model how well hearing sensitivity, working memory, processing speed, and vocabulary predict individual differences in word recognition in unfiltered and low-pass filtered speech. The advantage of SEM is that it assesses the predictive value of each of the extracted factors while taking into account how these factors are themselves interrelated.
The factors that result from confirmatory factor analysis consist of the variance that each of its indicators (the observed variables) has in common. As a result, measurement error in the observed variables is partialed out and the latent variables may be considered free of measurement error. Because latent variables are preferably indicated by several observed variables, the items of the vocabulary test and the word recognition task were divided randomly into subsets or parcels (as described above), but parcels always consisted of at least 20 items. For hearing sensitivity, working memory, and processing speed no parceling was needed as we had several indicators for each.
SEM involves testing how well the observed data conform to the hypothesized model. Several indices of model fit exist. In this paper, we assessed the χ2 test, which is sensitive to sample size and model complexity, but is useful in comparing nested models. In addition, the χ²/df ratio was used, which should be smaller than < 2. In addition, we made use of two indices that make adjustments for sample size and model complexity: the comparative fit index (CFI), which is preferably larger than 0.95, and the root mean squared error of approximation (RMSEA), which should be smaller than 0.06 (cf. Hu & Bentler, Reference Hu and Bentler1999).
A step-wise approach was adopted in modeling the data. Before we evaluated any relationships at the structural level of the model, we first assessed the appropriateness of the measurement model. At the measurement level, separate analyses were conducted for word recognition and hearing acuity. For word recognition, the goal was to test the assumption that two separate factors can be distinguished for recognition in unfiltered versus low-pass filtered conditions. For hearing acuity, we implemented a model of hearing loss as presented in Rönnberg et al. (Reference Rönnberg, Danielsson, Rudner, Arlinger, Sternäng, Wahlin and Nilsson2011) based on better ear pure-tone thresholds of 0.5, 1, 2, and 4 kHz. Finally, the remaining variables, which were intended as indicators of working memory, processing speed, and vocabulary knowledge, were analyzed together in one model. In addition, not only the fit of the hypothesized model was evaluated, but also those of plausible alternative models. This was done either to confirm the appropriateness of the hypothesized model or to select the solution that fitted our data best, and is a generally recommended procedure (Goodboy & Kline, Reference Goodboy and Kline2017; Kline, Reference Kline2005).
As a final step, we modeled the structural relationships. As all predictors were hypothesised to explain variance in word recognition accuracy, a full model was constructed first containing all possible relationships. The most parsimonious model was then selected by means of a backward deletion process. In this exploratory procedure, regression weights that were not found to be significantly different from zero were set to zero, effectively removing them from the model. This was done only if their removal did not lead to significant loss of model fit in χ² points compared to the loss of degrees of freedom. At each step in the process, the quality of the data was assessed by inspecting univariate and multivariate normality on the basis of skewness, kurtosis and the Mahalanobis distance estimates. The values for skewness and kurtosis should lie below the maximum values considered acceptable for SEM analyses, that is, 3 for skewness and 10 for kurtosis (Kline, Reference Kline2005). Violations of univariate or multivariate normality were never observed in the analyses to be presented below. Note that outliers were not removed in any of the measures (apart from response time outliers in the Letter Comparison task, see description). There were no missing data.
Results
The measurement model
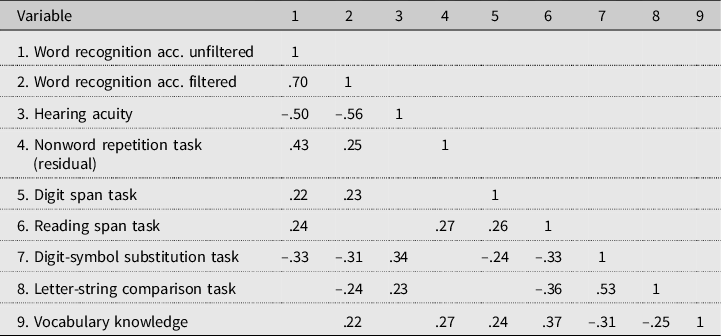
Table 1 presents the correlations between the observed variables before any parceling took place. For this purpose, hearing acuity was determined by calculating a high-frequency pure-tone average (HFPTA) over 1, 2, and 4 kHz for each individual’s better ear. The table shows that each of the independent variables correlated with either word recognition in unfiltered speech or with recognition in low-pass filtered speech, or with both. It also shows that correlations between the predictors were generally weak, with the exception of the two measures of processing speed, which correlated moderately (.53).
Table 1. Pearson correlations for all observed variables (only significant correlations are given at α < .05, 2-tailed N=105); the numbers in the top row correspond to the numbers in the first column
As a first step in the analysis, we assessed the appropriateness of extracting two factors from the Word Recognition task: recognition of unfiltered words versus recognition of low-pass filtered words. To this end, we compared two models. The first consisted of two latent variables that were each regressed onto two parcels based on the unfiltered speech items (unfiltered) and two parcels based on the low-pass filtered items (filtered). The second model consisted of one latent variable regressed onto all four parcels. The two-factor solution yielded good model fit: χ² (1) = 0.41, p = .84, χ²/df ratio = 0.41, CFI = 1.000, and RMSEA = 0.00. The one-factor model fitted poorly: χ² (2) = 28.10, p = .00, χ²/df ratio = 14.05, CFI = 0.898, and RMSEA = 0.354. Clearly, the solution that distinguishes between the factors unfiltered and filtered is to be preferred over a model that makes no allowance for the two types of listening conditions. Table 2 summarizes this model. All factor loadings are above 0.80. UnfilteredSetB has the largest error variance associated with it, but a respectable amount of 65% of its variance is still explained by the model, as indicated by the squared multiple correlation.
Table 2. Model solution for word recognition accuracy, presenting standardized (β) and unstandardized (B) factor loadings, standard errors (SE), squared multiple correlations (SMC), and error variance estimates
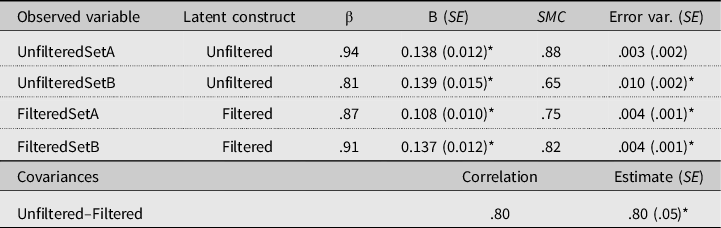
* Differs significantly from zero (p < .05).
Second, hearing acuity was modeled, following Rönnberg et al. (Reference Rönnberg, Danielsson, Rudner, Arlinger, Sternäng, Wahlin and Nilsson2011), on the basis of the observed hearing threshold values at 0.5, 1, 2, and 4 kHz in the better ear (cf. Lin, Thorpe, Gordon-Salant, & Ferrucci, Reference Lin, Thorpe, Gordon-Salant and Ferrucci2011, who refer to this frequency range as being most relevant for speech). The model consisted of one better ear hearing acuity factor regressed onto the four pure-tone threshold scores. If the residual variances at 0.5 kHz and 1 kHz were allowed to covary, the model fitted reasonably well: χ² (1) = 2.31, p = .13, χ²/df ratio = 2.31, CFI = 0.991, and RMSEA = 0.112. The results are displayed in Table 3.
Table 3. Model solution for hearing acuity based on better ear threshold values, presenting standardized (β) and unstandardized (B) factor loadings, standard errors (SE), squared multiple correlations (SMC), and error variance estimates
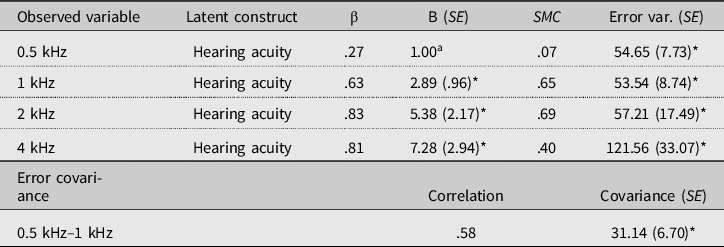
a Set to 1 to achieve model identification. *Differs significantly from zero (p < .05).
Third and finally, we tested whether the measures of nonword repetition, digit span, reading span, digit-symbol substitution, letter string comparison, and vocabulary (parceled into three subsets) were accurate representatives of working memory, processing speed, and vocabulary knowledge. Again, two alternative models were tested. First, a three-factor model was tested that conformed to the hypothesized underlying structure: a working memory factor was regressed onto the reading span, digit span, and residualized nonword repetition scores; a processing speed factor was regressed onto the digit-symbol substitution and letter comparison scores; and a vocabulary knowledge factor was regressed onto the three vocabulary subset scores. This model achieved good fit: χ² (6) =1.697, p = .89, χ²/df ratio = 0.34, CFI = 1.000, and RMSEA = 0.000. We considered a two-factor model that did not make a distinction between working memory and processing speed to be the most plausible alternative. Here one cognitive ability factor was regressed onto the five memory and speed measures. This model did not meet the criteria for good model fit on the CFI and RMSEA indices: χ² (19) = 30.363, p = .05, χ²/df ratio = 1.60, CFI = 0.937, and RMSEA = 0.076. The three-factor solution was retained and its details are presented in Table 4. As can be seen, the two processing speed variables and the vocabulary subscores were good indicators of their respective latent variables. For working memory, however, we found that reading span was by far the most important contributor. The squared multiple correlations for nonword repetition and digit span performance show that no more than 13% and 15% of their variance was explained by the model.
Table 4. Model solution for memory, processing speed and vocabulary knowledge, presenting standardized (β) and unstandardized (B) factor loadings, standard errors (SE), squared multiple correlations (SMC), and error variance estimates
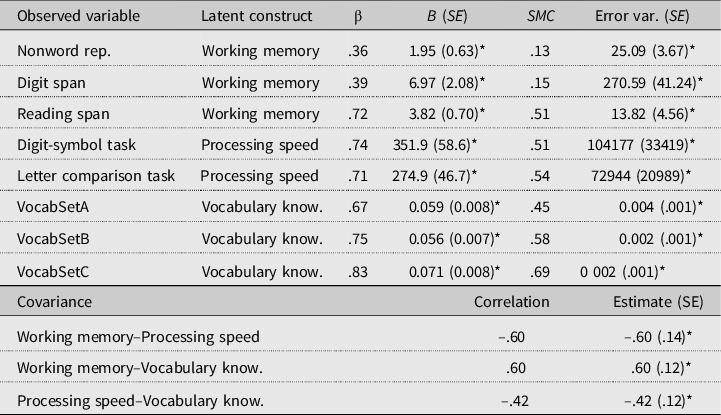
* Differs significantly from zero (p < .05)
The structural model
The results obtained in the analyses at measurement level were subsequently used to model the hypothesized relationships between word recognition in both unfiltered and filtered fast speech on the one hand, and hearing acuity, working memory capacity, processing speed, and vocabulary knowledge on the other. One can think of our data as repeated measures data, where word recognition accuracy was measured in both unfiltered and filtered conditions. Repeated measures data are often analyzed by means of analyses of covariance, where the effect of a particular treatment on a posttest is predicted from pretest results in addition to the treatment. These data were modeled in a similar fashion: All four predictors (hearing acuity, memory capacity, processing speed, and vocabulary knowledge) were regressed onto both word recognition factors (unfiltered and filtered). However, we also regressed the unfiltered speech factor onto the filtered speech factor. In setting up our model this way, we tested (a) which of the four independent factors predicted word recognition ability in unfiltered speech and (b) which of the four independent factors predicted word recognition ability in low-pass filtered speech on top of what is already explained by word recognition in unfiltered speech. The model is graphically depicted in Figure 3. It met all criteria for good model fit: χ² (88) =109.17, p = .06, χ²/df ratio = 1.24, CFI = 0.968, and RMSEA = 0.0484. As a final step, the most parsimonious model was selected. Five out of nine structural regression weights were found not to differ significantly from zero and were set to zero (see Figure 4). The loss of model of fit associated with their removal was not significant: Δχ² (5) = 6.3205.231, p = .28.
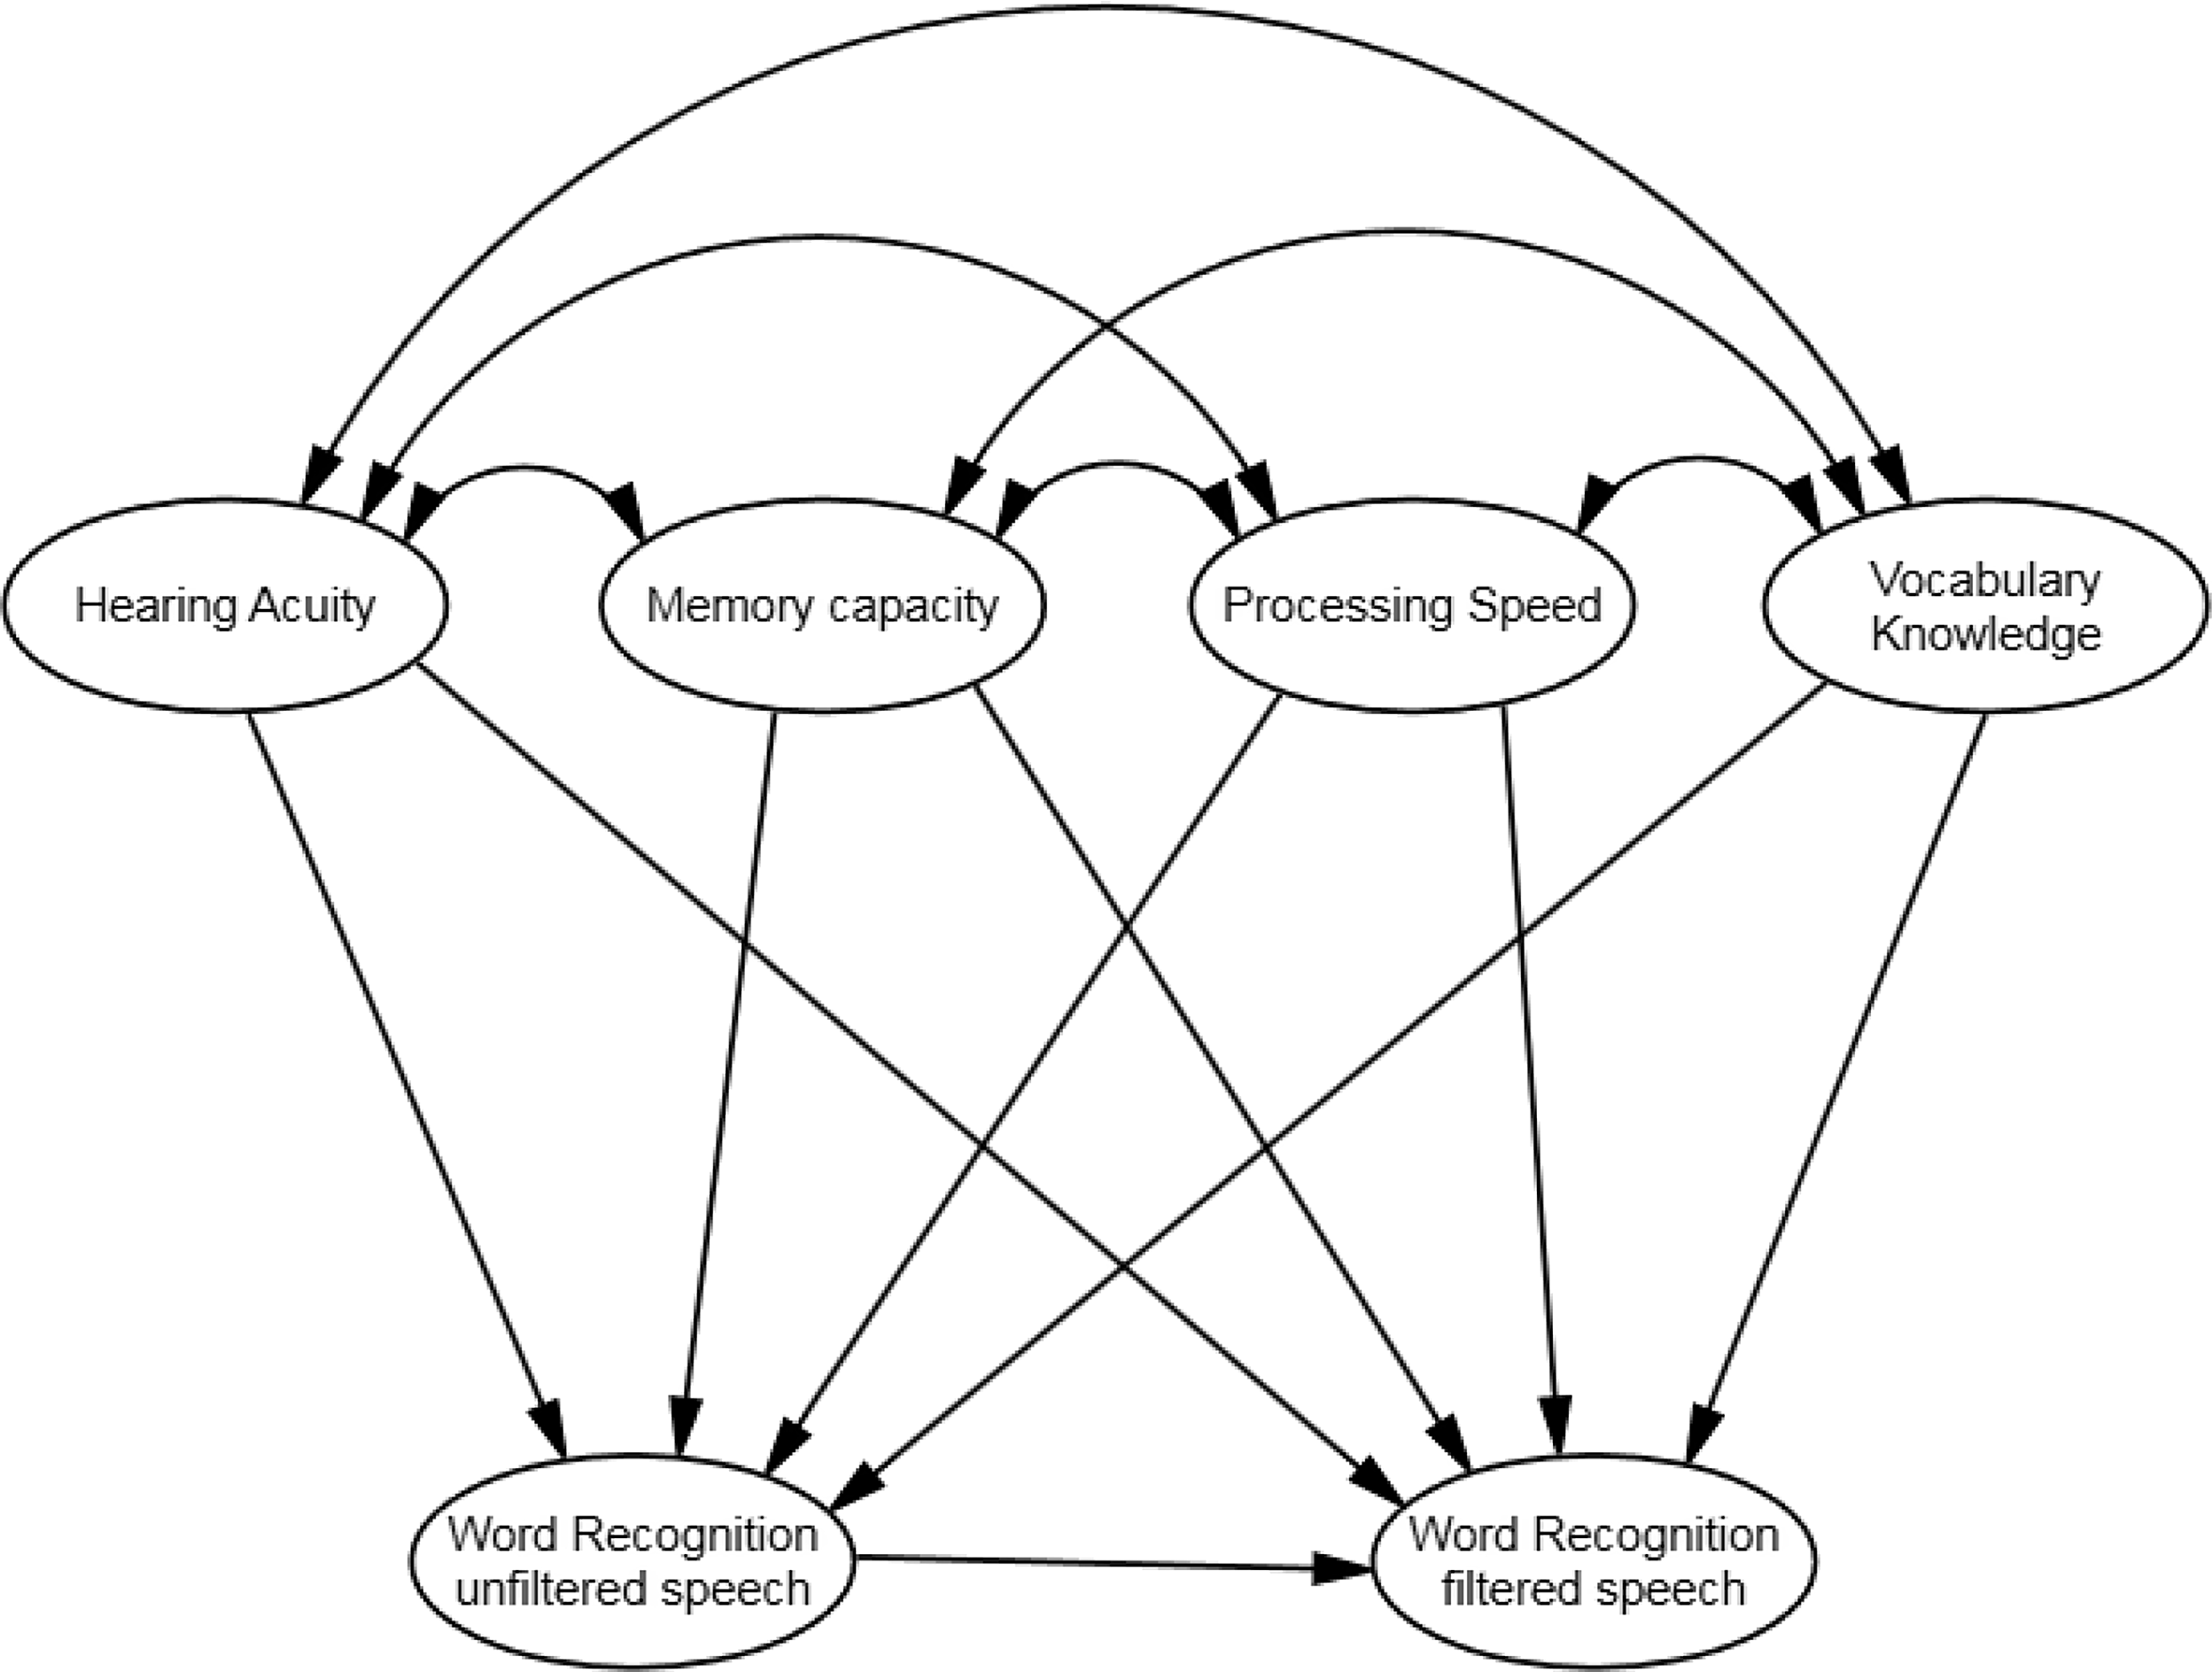
Figure 3. Tested structural model of word recognition in the two listening conditions.
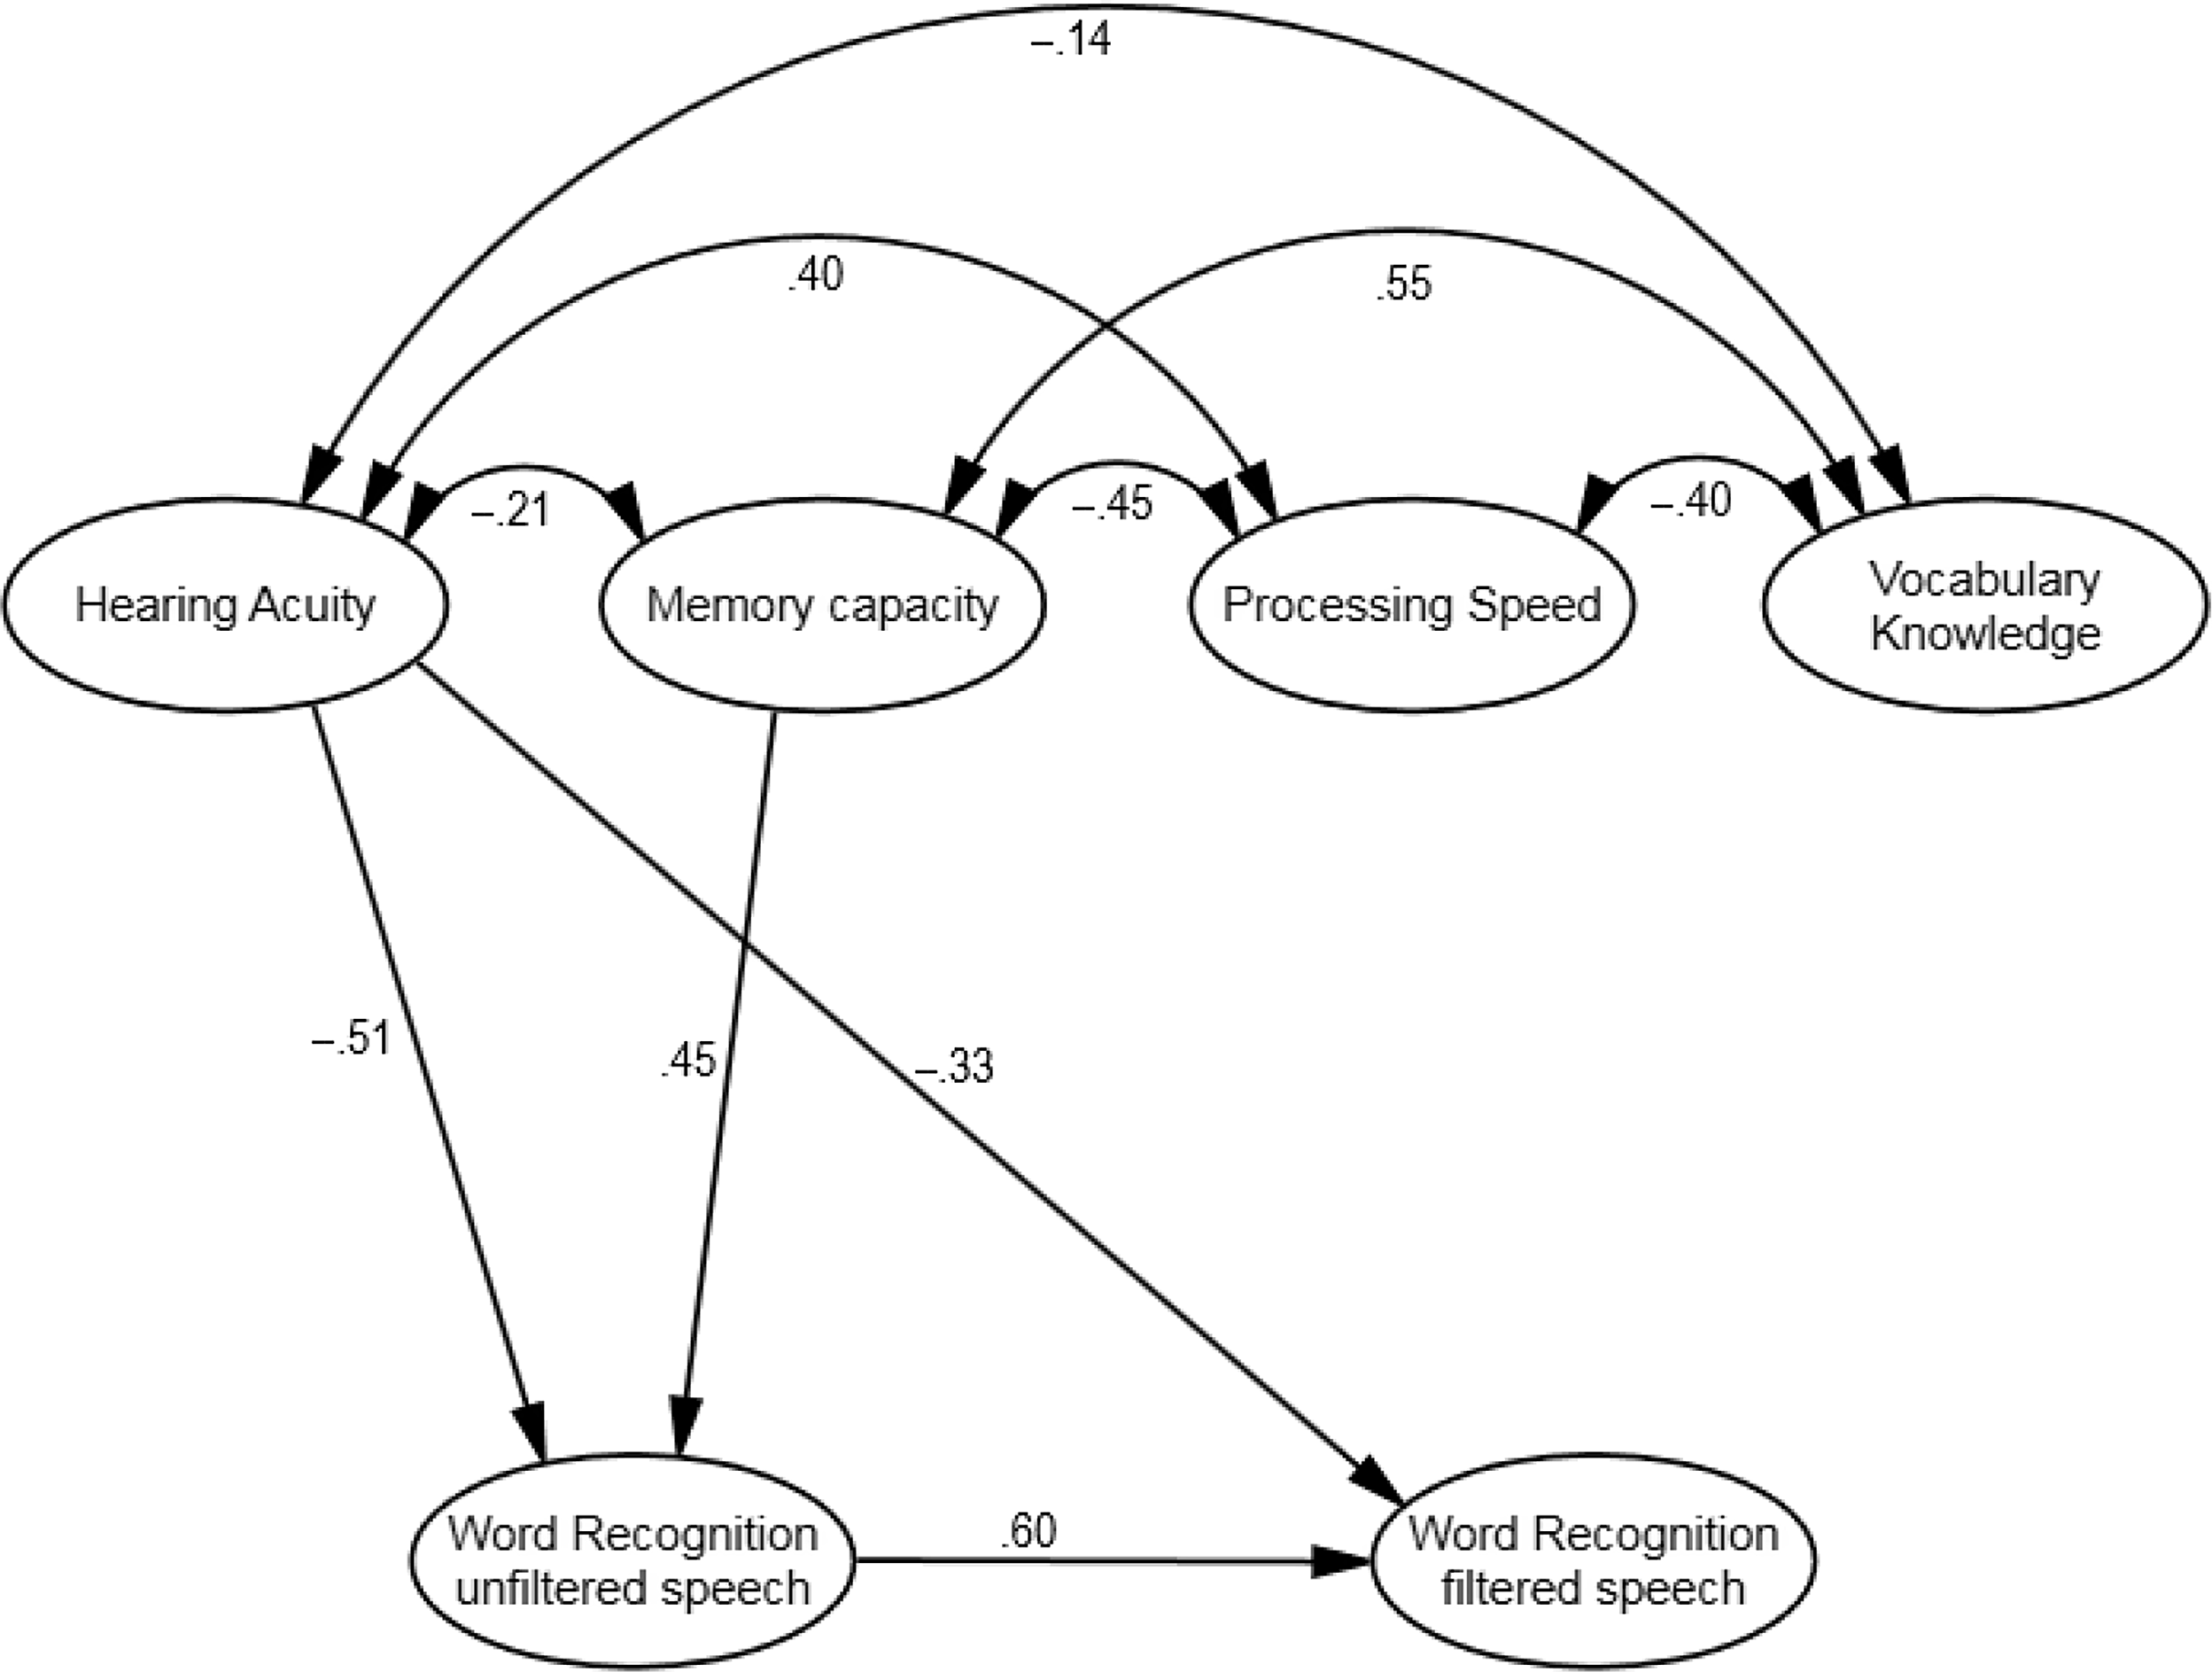
Figure 4. Observed standardised regression weights of the latent factors with Word Recognition Accuracy in filtered and unfiltered speech conditions.
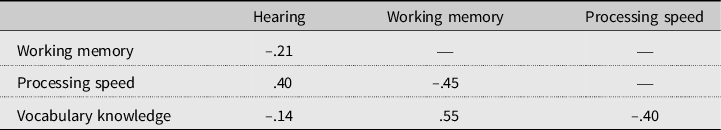
Table 5 and Figure 4 display the final model results. A similar pattern of correlations was found for the predictors with unfiltered and filtered word recognition accuracy: the strongest correlation was found for hearing acuity, the weakest for vocabulary. All correlations were in the expected direction: participants tended to perform better on the word recognition task as they experienced less hearing difficulties, as their working memory capacity was larger, as their processing speed was faster, and as their vocabulary knowledge was larger. The standardized regression weights show that neither processing speed nor vocabulary knowledge explained any unique variance in unfiltered or filtered word recognition accuracy. In total, 55% of the variance in unfiltered word recognition accuracy was explained by hearing acuity and working memory, the former accounting for a slightly larger share of the variance than the latter. In filtered word recognition accuracy, a total of 70% of the variance was explained. However, the vast majority of that variance was explained by word recognition accuracy in unfiltered speech. Hearing acuity explained a significant amount of extra variance. This latter finding should be interpreted as an interaction between hearing acuity and type of word recognition, such that hearing acuity was significantly more predictive of individual differences in filtered than in unfiltered word recognition. None of the other predictors were found to explain additional variance. Table 6 presents the correlations between the four factors (also shown in Figure 4). Hearing acuity did not correlate much with the other predictors, except for processing speed. The other three predictors correlated moderately.
Table 5. Implied correlations and standardized regression weights of the latent factors with the dependent variable word recognition accuracy as obtained in the final model
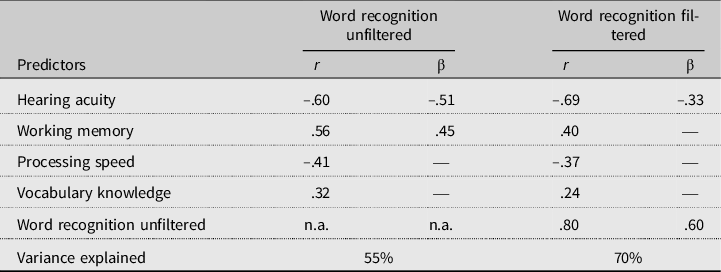
Table 6. Correlations between the four predictor factors
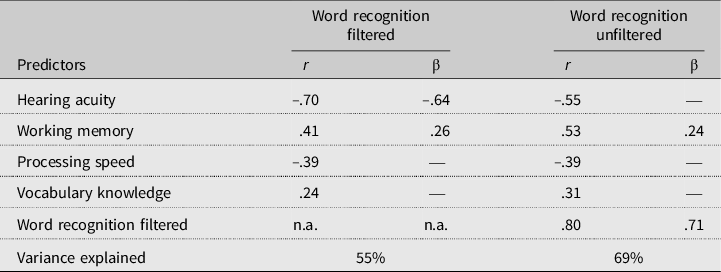
A number of additional analyses were performed. We tested a model in which the relationship between word recognition in unfiltered and filtered speech was reversed: the filtered speech factor was regressed onto the unfiltered speech factor. In this model presented in Table 7, which fitted equally well, working memory was found to explain unique variance in the unfiltered speech factor beyond what was already explained by the filtered speech factor. This indicates that there is an interaction between working memory and type of word recognition: working memory explains individual differences in unfiltered word recognition accuracy significantly better than in filtered word recognition accuracy. We also tried models in which one or more of the predictors were simply removed, for example, to test whether vocabulary knowledge did explain variance in the absence of memory. However, neither vocabulary knowledge nor speed explained additional variance in the absence of either memory or hearing acuity.
Table 7. Implied correlations and standardized regression weights of the latent factors with the dependent variable word recognition accuracy as obtained in the “reversed” model in which the relationship between word recognition in unfiltered and filtered performance was reversed
Finally, we ran a model with age as an additional, fifth predictor. This model fitted the data well, too, χ² (98) = 118.40, p = .08, χ²/df ratio = 1.21, CFI = 0.972, and RMSEA = 0.045, but the results did not change: age correlated with both word recognition factors (respectively –.54 and –.55 for recognition in unfiltered and filtered speech), but did not explain additional variance in the model. These results suggest that the effects of age on word recognition accuracy can be explained entirely by hearing acuity and working memory (as for correlations: between age and hearing construct: r = .58, p < .001; between age and working memory construct: r = –.31, p < .01).1
Discussion
This study was set up to investigate the importance of hearing acuity, information processing speed, working memory, and vocabulary knowledge for older adults’ recognition of single words taken from fast speech. Hearing acuity and working memory each predicted unique variance in word recognition accuracy, but not to the same extent in unfiltered and low-pass filtered speech. Hearing acuity was more predictive in low-pass filtered speech than in unfiltered speech, whereas working memory was more predictive in unfiltered speech than in low-pass filtered speech. Processing speed and vocabulary knowledge did not explain unique variance in word recognition, even though both correlated significantly with word recognition accuracy. Note that, even though hearing acuity and working memory accounted for a sizable part of the total variance in word recognition performance, a large part of the variance was still not accounted for (cf. Tables 5 and 7). This suggests that not all relevant factors have been captured in this study.
The contribution of stimulus audibility to word recognition was assessed in two ways: by manipulating audibility of the fast word stimuli through filtering and by relating the continuous variation in participants’ hearing acuity to word recognition. The correlations between hearing acuity and word recognition accuracy confirm that hearing plays an important role in explaining individual differences in fast-word recognition (as intensity level of stimulus presentation was fixed for all participants). Even in the unfiltered condition, the observed correlation between hearing and word recognition was quite strong (r = –.60) in our participant sample of older adults. Hearing acuity in the sample was generally relatively good with 64 (out of 105) participants having only fairly mild hearing losses (high-frequency pure-tone averages of maximally 25 dB HL), and only seven participants having pure-tone averages exceeding 40 dB HL. This suggests that fast and reduced speech may be difficult to recognize and makes a substantial demand on someone’s hearing acuity. The results also show that between-listener differences in stimulus audibility were more predictive in the filtered than in the unfiltered condition. The filtering likely removed audible information from the stimulus, compromising the ability to properly recognize the words even further. This led to poorer performance on the task, especially by those with poorer hearing. The results for the predictive power of hearing acuity thus largely follow from individual differences in stimulus audibility in the two listening conditions.
This study extends individual-differences findings by previous studies: several literature reviews (Akeroyd, Reference Akeroyd2008; Besser, Koelewijn, Zekveld, Kramer, & Festen, Reference Besser, Koelewijn, Zekveld, Kramer and Festen2013; Dryden et al., Reference Dryden, Allen, Henshaw and Heinrich2017) already showed that working memory is important for recognition of clearly articulated speech masked by noise, and our results suggest this is similarly true for the recognition of words taken from fast speech. The results also align with findings by Dryden et al. (Reference Dryden, Allen, Henshaw and Heinrich2017) on the predictive role of working memory across test materials: memory plays an important role for recognition at the lowest meaningful level, and not just at higher (sentence) levels of language processing where information needs to be integrated. However, contrary to our expectation, we did not find that working memory was more strongly implicated in acoustically more adverse listening conditions. The opposite was true: the associations between word recognition performance and memory were significantly weaker in the challenging condition, while the standard deviations of the mean recognition accuracies in both listening conditions were about equal, such that the weaker strength of the association between memory and word recognition performance in the filtered condition cannot be attributed to floor effects in performance.
A corollary of general capacity models of working memory is that working memory capacity is drawn on especially in situations when processing is more taxing (e.g., Baddeley, Reference Baddeley and Pickering2006; Just & Carpenter, Reference Just and Carpenter1992; King & Just, Reference King and Just1991; MacDonald et al., Reference MacDonald, Just and Carpenter1992). On the basis of the ELU model, one would predict that working memory capacity is more predictive of spoken language processing when listening conditions are more challenging (cf. Rönnberg, Rudner, Lunner, & Zekveld, Reference Rönnberg, Rudner, Lunner and Zekveld2010). This argument was brought up earlier by Lunner and Sundewall-Thorén (Reference Lunner and Sundewall-Thorén2007), who observed that, at matched speech recognition performance levels, working memory was only associated with listening conditions assumed to be more demanding (modulated noise rather than unmodulated noise, and specific hearing-aid settings over others). To our knowledge, few studies have actually addressed the question of whether predictive power of working memory for speech recognition performance may differ across performance levels within the same listener group, and some have provided indecisive results (e.g., Heinrich & Knight, Reference Heinrich and Knight2016, whose results show an insignificant tendency for working memory to be more strongly associated with speech recognition at poorer performance levels).
One result that might be comparable is from a study by some authors of the ELU model on differential cognitive-capacity effects for hearing-impaired listeners at different performance levels (Rudner, Rönnberg, & Lunner, Reference Rudner, Rönnberg and Lunner2011). This study investigated hearing-impaired listeners’ recognition of speech in different noise masking conditions, and with different hearing-aid settings. In unaided listening conditions (i.e., when participants were not wearing their hearing aids) and when sentences were presented in stationary noise, participants with high working memory capacity outperformed participants with low working memory capacity in that the former group could stand more noise. Critically, this (working memory capacity) group difference in stationary-noise tolerance was only found at an 80% sentence accuracy level, but not at a 50% accuracy level. Results on the predictive power of working memory were again different for different types of noise masking and different hearing-aid settings, but the unaided stationary-noise listening conditions seems closest to our listening conditions, hence providing the most straightforward comparison.
Our finding that the association between working memory and speech recognition was stronger in the less adverse condition seems to fit better with working memory models that claim that there is no structural separation between working memory and long-term memory and that argue that working memory contains activated long-term memory information (e.g., Cowan, Reference Cowan2005; Ericsson & Kintsch, Reference Ericsson and Kintsch1995; MacDonald & Christiansen, Reference MacDonald and Christiansen2002). In these models, working memory capacity reflects the ability to activate long-term memory representations and to keep them active for ongoing processes, and they are thought to be mediated by the level of one’s expertise or experience (e.g., Cowan, Reference Cowan2005; Ericsson & Kintsch, Reference Ericsson and Kintsch1995; Jones, Gobet, & Pine, Reference Jones, Gobet and Pine2007; MacDonald & Christiansen, Reference MacDonald and Christiansen2002). High working memory scores should then be seen as resulting from high levels of verbal expertise rather than vice versa: participants who process (spoken) language efficiently may be able to score better on span measures of verbal working memory (such as reading span, digit span, and nonword repetition). A degraded acoustic signal would hinder spoken word processing and result in weaker correlations with working memory. Of the three working memory tasks administered, the nonword repetition task may measure the ability to hang on to auditory representations most closely, and was the memory measure that showed the strongest correlation with word recognition (Table 1). Note that the field of developmental language disorders has known a similar debate on the nature of the association between memory and language (cf. e.g., Bishop, Hardiman, & Barry, Reference Bishop, Hardiman and Barry2012). In contrast to the widely held view that language problems in children with specific language impaiment may stem from auditory processing disorders, Bishop et al. argue, on the basis of SEM, that poor phonological memory skills (as quantified by nonword repetition performance) may be the cause, rather than the consequence, of impaired speech perception.
Vocabulary knowledge did not explain a significant amount of unique variance in fast-word recognition accuracy, and correlated significantly, but weakly. Reading research has argued that increased verbal expertise (operationalized by vocabulary size) leads to greater precision and stability of stored lexical representations (e.g., Andrews & Hirsch, Reference Andrews and Hersch2010; Yap et al., Reference Yap, Balota, Sibley and Ratcliff2012), which would be advantageous for efficiently singling out target words from their competitors. Similarly, several recent papers have shown associations between receptive vocabulary and perception of noisy, accented speech (e.g., Banks et al., Reference Banks, Gowen, Munro and Adank2015) or between vocabulary and accented or disordered speech (e.g., Bent et al., Reference Bent, Baese-Berk, Borrie and McKee2016). Whereas the latter study did not include a working memory measure, such that no conclusion can be drawn on any unique variance accounted for by vocabulary, the results by Banks et al. specifically suggest that vocabulary directly predicts speech performance, and that the link between working memory and speech performance is mediated through vocabulary. The alternative structural models we tested in the present study did not provide any evidence for such mediation. This discrepancy in results could be due to multiple factors, such as the different statistical approach, which entailed that our working memory construct was based on three working memory measures, rather than on a single one (i.e., reading span in Banks et al., Reference Banks, Gowen, Munro and Adank2015). Alternatively, different results could be due to the choice of task and speech materials (identification of sentences vs. single words) or due to a different type of adverse listening condition (fast speech vs. noisy or accented speech), suggesting that some individual capacities (i.e., vocabulary) show up mainly in specific, rather than across, adverse listening conditions, which speaks to the recent debate on similar or differential associations between listener abilities and performance across different types of listening conditions (Bent, Baese-Berk et al., Reference Bent, Baese-Berk, Borrie and McKee2016; Borrie et al., Reference Borrie, Baese-Berk, van Engen and Bent2017; McLaughlin et al., Reference McLaughlin, Baese-Berk, Bent, Borrie and van Engen2018).
Multiple studies (cf. Banks et al., Reference Banks, Gowen, Munro and Adank2015) have stressed the role of vocabulary knowledge in perceptual adaptation to novel input. Whereas working memory measures predicted accented-speech performance across trials, vocabulary was specifically related to the amount of adaptation to accented sentences across experimental trials (Janse & Adank, Reference Janse and Adank2012). Similarly, vocabulary knowledge, rather than working memory, predicted adaptation to noise-vocoded sentences in younger adults (Neger, Rietveld, & Janse, Reference Neger, Rietveld and Janse2014). Listeners may, to some degree, adapt to natural-fast speech as well (Adank & Janse, Reference Adank and Janse2009), but the present study, with its SEM approach, focused on general performance and on isolated word recognition, rather than on adaptation and sentence recognition. Further experimentation is required to find out whether vocabulary would be predictive of adaptation to fast speech.
Either way, both our results and the results by Banks et al. (Reference Banks, Gowen, Munro and Adank2015) suggest the constructs of working memory and vocabulary to be overlapping constructs. This provides further confirmation for the idea that working memory capacity is domain specific and mediated by an individual’s expertise or experience (e.g., Cowan, Reference Cowan2005). Correlations for vocabulary patterned similarly to those of working memory: the strongest correlation was found for word recognition accuracy in the unfiltered condition. Consequently, our results align with earlier observations that the contribution of cognitive/linguistic factors to speech recognition comes out more clearly once speech stimuli are sufficiently audible (e.g., Humes, Reference Humes2007).
Our study was also specifically set up to investigate whether processing speed facilitated word recognition, under the assumption that fast speech might bring out its role more clearly compared to other types of adverse listening conditions. Several studies have found that processing speed was a (substantial) predictor of word recognition accuracy (Dryden et al., Reference Dryden, Allen, Henshaw and Heinrich2017; Janse, Reference Janse2009; Janse & Newman, Reference Janse and Newman2013; van Rooij & Plomp, Reference van Rooij and Plomp1990), although this has not been a consistent result (Akeroyd, Reference Akeroyd2008). In the present study, processing speed correlated with word recognition; however processing speed did not explain variance beyond what was already explained by hearing acuity and working memory. Processing speed correlated substantially with both working memory (r = –.40) and vocabulary (r = –.45). The picture that emerges is that working memory, vocabulary, and processing speed are overlapping constructs: they could all be a proxy of verbal expertise, where working memory seems to be the most encompassing construct.
It should be noted, though, that processing speed may be more strongly related to speed of word recognition, which was not assessed in this offline study. With eye-tracking research, it has been shown that the dynamics of spoken-word recognition (lexical activation, competition and decay, as evident from eye tracking research) differ between normal-hearing and hearing-impaired listeners (McMurray et al., Reference McMurray, Farris-Trimble and Rigler2017) and between control groups and adolescents with specific language impairment (McMurray et al., Reference McMurray, Samelson, Hee Lee and Tomblin2010). Of importance, these dynamics of spoken-word recognition also change instantly when normal-hearing listeners are presented with severely degraded speech (McMurray et al., Reference McMurray, Farris-Trimble and Rigler2017). Eye tracking research would be required to assess whether individual processing speed is associated with speed of lexical activation and competition, and hence with recognition speed, possibly particularly so in listening conditions with severely degraded signal quality. Note that the choice for a different listening task (such as eye tracking) would also enable us to include recognition of normal-rate speech, such that the potential association between processing speed and speech recognition can be compared for different speech rates.
Another explanation for the lack of an association with processing speed in our study may be that processing speed becomes more crucial when listeners are presented with sentences or passages, rather than single words. Participants may have been able to keep even the longest (four-syllable) words in auditory memory, such that information that could not be processed at a first pass was available for further decoding in later passes. Further experimentation is required to investigate whether processing speed does explain unique variance in speed and the dynamics of word recognition (e.g., specifically in rate of activation gain of the target word) or in processing of longer fragments.
In sum, individual differences in memory capacity are clearly associated with the ability to recognize words spoken in a fast and reduced way. Processing speed and vocabulary knowledge do not seem to uniquely contribute to word recognition accuracy. Recognition of single fast words thus does not seem to be facilitated by quick access to long-term memory representations. Generally, our results fit best with models of working memory that do not distinguish between working memory and long-term memory. They imply that verbal expertise (as indexed by verbal working memory or vocabulary knowledge) is associated with word recognition efficiency, and that the two may be two sides of the same coin. As argued above now that we have identified which capacities relate to spoken word recognition success, a next step would be to integrate these individual differences into (computationally implemented) models of spoken word recognition (e.g., Ten Bosch, Boves, & Ernestus, Reference Ten Bosch, Boves, Ernestus, Wolters, Livingstone, Beattie, Smith and MacMahon2015; Magnuson et al., Reference Magnuson, You, Luthra, Li, Nam, Escabí and Rueckl2020). Future research is needed to investigate how cognitive capacity exactly relates to speed of candidate activation and deactivation in spoken word perception in order to specify the role of cognitive capacity in models of spoken word recognition, for those with and without hearing problems, and possibly, to specify the role of language processing in working memory models.


 Open access