

- EAER>
- Journal Archive>
- Contents>
- articleView
Contents
Citation
| No | Title |
|---|
Article View
East Asian Economic Review Vol. 24, No. 2, 2020. pp. 165-184.
DOI https://dx.doi.org/10.11644/KIEP.EAER.2020.24.2.375
Number of citation : 0View
101
Download
76
Foreign Exchange Rate Uncertainty in Korea
|
|
Hongik University |
|---|

Abstract
Applying
JEL Classification: C1, F2, F3
Keywords
Exchange Rate, Uncertainty, Currency Risk, Uncovered Interest Rate Parity, Uncertainty Index
I. INTRODUCTION
Recently, a growing macro and financial literature has drawn huge attention to measuring uncertainty.1 In the international finance literature, implied or various measures of volatility have typically been used as proxies for exchange rate uncertainty.2 As noted by Jurado et al. (2015), however, volatility can differ from uncertainty, resulting in being unable to distinguish expected from unexpected movements.3 To this end, Ismailov and Rossi (2018) newly construct the FX uncertainty index based on Rossi and Sekhposyan (2015), where the degree of uncertainty is determined according to the density distribution of historical forecast errors. Applying FX uncertainty indices to the tests of uncovered interest rate parity for five industrialized currencies, the authors show that FX uncertainty is related to the time-varying risk premia in exchange rate dynamics.4,5
In this paper, I construct the Korea FX uncertainty index using the method of Rossi and Sekhposyan (2015). Unlike Ismailov and Rossi (2018), however, I focus on examining 1) the asymmetric impacts of uncertainty associated with sudden depreciation or appreciation on Korea-U.S. exchange rate dynamics and 2) the predictability of FX uncertainty. As an emerging currency, the Korean won plunges more sharply than industrialized currencies during economic crises. Because sudden and large capital outflows are used to accelerate the depreciation of the Korean won, investors’ responses to the unpredicted situation plays a more important role in the Korean won than that in industrialized currencies. In contrast, the converse case is not often observed and is not considered crucial for Korea-U.S. exchange rate movements. I conjecture that the effects of uncertainty from rare and severe depreciation might be stronger in this case than other cases. Thus, it is necessary to estimate and evaluate the uncertainty by dividing it into two categories: unexpected appreciation and depreciation.6 Another point of interest is what derives the FX uncertainty. Finding predictors of FX uncertainty helps to prepare for the situation of currency crashes and to understand the exchange rate dynamics.
I look at the FX uncertainty in Korea over the period from January 1998 to June 2017. FX uncertainty series are computed using survey-based forecast data and a well-known predictive model, the random walk.7 This computed Korea FX uncertainty offers information that is distinctive from other global uncertainty indices, such as economic policy uncertainty (Baker et al., 2016) and U.S. monetary policy uncertainty (Husted et al., 2018), and it capture economic events, such as the 1998 Asian Financial Crisis and the 2008 Global Financial Crisis. In particular, uncertainty associated with the large depreciation of the Korean won sharply spikes during the examined period. Inserting uncertainty indices into the UIP regression adds considerable explanatory power, and most of the additional explanatory power comes from the uncertainty of the Korean won crash.
In addition, theoretical exchange rate determinants, such as interest differentials, relative inflation or output growth between home and foreign countries, and capital flows turn out to have predictive ability regarding FX uncertainties for short horizons. Compared with the other determinants, only capital flow has predictive information for the 1-month ahead FX uncertainty of unexpected depreciation. For the 3-month ahead horizon, interest rate differentials and the financial uncertainty index are selected as the key predictors of Korean FX uncertainty. Considering that FX uncertainty is associated with the exchange rate dynamics in the channel of time-varying risk premia, this result provides potential explanations for the empirical failure of tying the exchange rate and its economic determinants.
This paper is organized as follows. The following section describes the data used in this study and introduces the methodology used to estimate the FX uncertainty. The comparison to the existing global uncertainty indices is also presented. Section 3 examines whether the deviation from the UIP condition can be explained by uncertainty and offers empirical evidence of linkage between macro variables and FX uncertainty. Section 4 concludes the study.
1)Economic policy uncertainty
2)Considering volatility in currency market as the risk factor, a vast body of studies have provided analyses for estimating or predicting exchange rate volatility
3)
4)
5)A growing exchange rate literature focuses on uncertainty as the factor driving exchange rate fluctuation, currency excess return, or risk reversals
6)
7)Consensus Economics, Inc. survey forecast data is commonly used in the literature. See
II. MEASURING FX UNCERTAINTY
1. Data Description
Monthly data are obtained for the period of January 1998 to June 2017. The starting date of this analysis matches the time at which the Korean won shift to a floating exchange rate system.8 The end date of the sample period was chosen based on the availability of the survey forecast data obtained from Consensus Economics Inc. The Consensus Economics Inc. survey data contains approximately 250 professional forecasters’ forecasts at 1, 3, 12, and 24 months.9 It covers over 90 currencies, and the Korean won is one of them. Using the average values of the survey based on the 250 professional forecasters, I compute the forecast errors.
Time series data for the macro variables are collected from the Federal Reserve Economic Data, except for exchange rates and capital inflows, which are obtained from the Bank of Korea. The exchange rate is measured as the Korean won per unit of U.S. dollar, and the interest rate is a 3-month government bond rate. Inflation and output growth are calculated by using the log differences of CPI and industrial production, respectively. Since capital inflows have either positive or negative values, capital inflows and interest rates are excluded from the log process. Exchange rate data are annualized and converted to percentages.
2. Methodology
A measure of uncertainty proposed by Rossi and Sekhposyan (2015) is based on the concept that the greater the difference between the expected and realized values, the higher the uncertainty is. The criteria for the large and small forecast errors are made by comparison with their historical values. To do this more objectively, the probability function is derived by using the time series of the forecast errors. The degree of uncertainty is set as high when the value of the forecast error at a certain point of time lies far from the central part of its distribution. The extreme values of the forecast errors that rarely occur means the unpredictable part is large, and thus the uncertainty is high.
Ismailov and Rossi (2018) apply this methodology to construct the exchange rate uncertainty index for five industrialized countries. The three-month ahead forecast error is defined as follows:

where st is the log of the exchange rate at time t, and Et is the expectation conditioning on all the information up to time t. The survey forecast data are employed for constructing the Et(st+3 − st) series. Additionally, a random walk model, which is considered the best model for forecasting the exchange rate in the international finance literature, is applied to calculate the forecast errors and their distribution as a robustness check.10
The cumulative density of forecast errors, 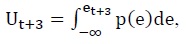 can be calculated based on the forecast error distribution, p(e). Note that uncertainty increases when unpredictable exchange rate movement occurs, either from good or bad news for the Korean won. For example, if there is a change that results in higher (lower) KRW/USD than expected, then the forecast error would have a positive (negative) value, and its cumulative density would approach one (zero). Thus, the uncertainty index can be constructed according to the positive or negative changes as follows:

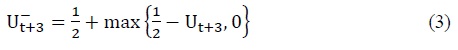
 is upside uncertainty caused by the unexpectedly higher value of the Korean won against the U.S. dollar. Similarly,
  is downside uncertainty, reflecting the uncertainty arising from the unexpected lower value of the Korean won against the U.S. dollar. By construction, both
  have values from 0.5 to 1, and one of these indices should be 0.5 when the other index scores higher than 0.5.
Combining upside and downside uncertainty, the overall uncertainty index is defined as follows:

Figure 1 displays the unconditional probability distribution function and cumulative distribution function of 3-month ahead forecast errors in Korea-U.S. exchange rate forecasts from 1998M1 to 2017M6. As shown in the left panel, the Korea-U.S. exchange rate forecast errors are distributed with a mean of zero and long right-side tail. A skewed right-side distribution reflects that the unexpected crash of the Korean won happens more frequently and pronounced than the contrary case. The overall uncertainty index has a high value when it is located far from the average occurrence (0.5), as shown in the right panel of Figure 1.
Figure 2 plots the upside and downside uncertainty indices. The upper panel shows the uncertainties where the forecast error distribution is based on the entire sample period, which is referred to as the “ex-post measure”. One might ponder that the “expost measure” is unrealistic, as investors who sell and buy currencies make decisions based on the latest available data in addition to older data. Reflecting this concern, I also display the result of updating the forecast error distribution each month starting from 1998M1 in the bottom panel, which is referred to as the “real-time measure”.11 To examine if the survey-forecast data are reliable, I compare the uncertainties obtained from the survey forecasts (left panel) with the uncertainties from the random walk model (right panel). As illustrated in the figures, all the uncertainties generated from the different data sources or sample periods show great similarity. The correlation between the ex-post measure of uncertainty and the real-time measure based on the survey-forecast data is estimated to be near one, with a value of 0.921. The correlation between the ex-post measure of uncertainty using survey forecasts and that using the random walk model is also high, with a value of 0.701.
All the measures of FX uncertainties in Figure 2 show a consistent spike during the 1998 Asian Financial Crisis and the 2008 Global Financial Crisis. In particular, the upside uncertainty, which is associated with an unexpected high KRW/USD, spikes to its highest value. Considering that a higher KRW/USD indicates a weaker Korean won against the U.S. dollar, the FX uncertainty indices capture the times of crashes in the Korean currency market well. One can also observe that upside uncertainty increases during the periods of global recession, caused by the bursting of the dot-com bubble and the European debt crisis.
3. Comparison with Other Uncertainty Measures
The recent literature has developed several uncertainty indices, such as the Jurado et al. (2015) macroeconomic uncertainty index, the Ludvigson et al. (2019) financial uncertainty index, the Baker et al. (2016) newspaper-based economic policy uncertainty index (EPU hereafter), and the Husted et al. (2018) newspaper-based monetary policy index. These uncertainties are only available for the U.S., except the EPU.12
In empirical studies, U.S. uncertainty indices are commonly used as representatives of global uncertainty, given the important role of the U.S. on the worldwide economy.13 Examples include Husted et al. (2018), who show that uncertainty in U.S. macro and financial markets are priced in the currency excess return. Ismailov and Rossi (2018) also use the above uncertainty indices as global economic uncertainty measures in their paper. Using the U.S. EPU, Lee (2018) shows that it plays a dominant and consistent role in Korean currency risk.
Figure 3 illustrates the time series of uncertainties by category. Panel A presents the U.S. macro and financial uncertainty index (Ludvigson et al., 2019), which suddenly shows a surge during the 2008 Global Financial Crisis. These two time series have consistent patterns, but the macro uncertainty appears to have smoother movement than the financial uncertainty fluctuation. In panel B, the uncertainty measures of the U.S. monetary policy (Husted et al., 2018) and those of its fiscal policy (Baker et al., 2016) are displayed. The most prominent feature is that the fiscal policy uncertainty is much higher than that of the monetary policy uncertainty during the period of 2008-2014. This might be related to the rising concerns about the effectiveness of a monetary policy at a zero-lower bound from December 2008 through December 2015. After that period, the monetary policy uncertainty increases rapidly, while the fiscal policy uncertainty decreases. Panel C compares the U.S. EPU index with Korea. These two series are highly correlated from January 1998 to December 2014 (corr = 0.727). After January 2015, however, the uncertainty of Korea rises sharply and remains higher than that of the U.S. This might be due to a country-specific situation, such as a presidential political scandal.
The upper panel of Table 1 reports the correlation matrix for the FX uncertainty and the other uncertainties. I first observe the asymmetric characteristics of FX uncertainty: U+ is positively related with all the other uncertainties, whereas U- is negatively related with most of the uncertainties with a much smaller correlation in its absolute value. This result indicates that when the global uncertainty is high, an unforeseen higher KRW/USD or a weaker Korean won is likely to occur. In addition, the estimated correlation between the FX uncertainty indices and each global uncertainty index seems to be relatively low, ranging from 0.319 to 0.006. This low correlation implies that FX uncertainty contains its own specific information, in addition to the global uncertainty being captured.
The bottom panel of Table 1 summarizes the results of Granger causality tests from the bivariate VARs. I include a constant and five lags of each variable in all the causality tests reported in this table. The null hypothesis that macro uncertainty fails to Granger-cause either U* or U+ is rejected at the 5% significance level. The null hypothesis of no Granger causality from financial uncertainty to either U*or U+ is also rejected at the 5% level. Nevertheless, Granger causality tests running in the opposite direction, i.e., whether FX uncertainties Granger-cause other uncertainty measures, cannot be rejected at the 10% level for most cases. This result indicates that global uncertainties, specifically uncertainty related to macro and financial events, influence Korea FX uncertainty, and its impact becomes stronger when the Korean won is faced with unexpectedly large depreciation.
8)Bank of Korea reports that Korean won shifts to the free-floating system since December 1997. <
9)Detailed information is on the Consensus Economics Inc. website: <
10)
11)
12)
13)
III. FX UNCERTAINTY AND EXCHANGE RATE
1. Explaining Foreign Exchange Risk Premium
Figure 4 visualizes the average annualized excess return for holding the Korean won conditional on the degree of overall FX uncertainty, U*. The “average” in this figure indicates the average of excess return and the forward premium obtained from entire sample periods, whereas the other two values are from the subsamples chosen by the degree of U*, i.e., the lower quartile (the 25th percentile) and the upper quartile (the 75th percentile). This figure shows that investors receive a negative excess return for holding the Korean won when U* is between its 75th percentile value and its maximum, whereas investors earn a high positive excess return when U* is lower than its 25th percentile value. These graphs clearly show that the unconditional expected returns change the sign between the periods of the upper quartile and lower quartile of U*. This is evidence of not only the idea that the deviations from UIP are time varying.
To explore the link between FX uncertainty and exchange rate risk premia, I start from the Fama regression (see Fama, 1984) as follows:

where st is the log of exchange rate (Korea won per U.S. dollar) at time t, it, m is the m-month Korea interest rate, and the corresponding U.S. variable is denoted with an asterisk. Under the uncovered interest rate parity (UIP) condition, the slope coefficient b should be equal to one. Most empirical studies, however, have consistently reported that the estimated coefficient is less than one and is often negative.14 The results in Table 2 show that the estimated b is -2.300 and statistically significant.
To investigate more formally whether uncertainty is a risk factor in the Korean currency market, I estimate the adjusted UIP regression as follows:

where the dummy variable, dt, is equal to one if the overall FX uncertainty,  is high and zero otherwise. Time periods of high uncertainty are identified by the situation in which
  is larger than its 50th percentile value(median) or its 75th percentile value.
Table 2 shows that the UIP condition is strongly violated when the overall uncertainty index has a high value. The slope coefficient for the interest rate differential is negative and large in absolute value, i.e., at -3.068 and -3.768 for the period when the U* is higher than its median and upper quartile, respectively. In periods when U* is lower than its median or the 75th percentile value, the estimated coefficient turns out to be smaller and insignificantly different from zero. However, it is still statistically significant at the 1% level for the UIP hypothesis, where the coefficient is equal to one. This result is inconsistent with Ismailov and Rossi (2018), who find that among 5 industrialized currencies, the UIP does not hold in highly uncertain environments, while it is more likely to hold when uncertainty is low. I conjecture that these differences are caused by emerging currency characteristics, i.e., the more frequent occurrence of sudden and large depreciations rather than appreciations. In other words, upside uncertainty might play a more important role in explaining the Korea-U.S. exchange rate than downside uncertainty or the overall uncertainty index. To assess the asymmetric impact of upside and downside FX uncertainty, I adjust the conventional UIP regression as follows:

The results are reported in Table 3. Compared to the case observed when inserting U* into the UIP regression, adding upside and downside uncertainty together into the regression raises the adjusted R-square from 0.055 to 0.541. Comparing columns (ii) and (iii) in Table 3, one can observe that most of the additional explanatory power comes from the upside uncertainty rather than the downside uncertainty. Considering that U+ is directly related to the extent of the unexpectedly high value of the KRW/USD exchange rate (unexpectedly weakening the KRW), this result supports the view that crash risk is the main source of exchange rate risk premium or UIP puzzle for the Korean won (Brunnermeier et al., 2009; Burnside et al., 2011; Farhi and Gabaix, 2016).15
The point estimates of  are both statistically significant and have the opposite sign. Significant and opposite signs indicate that the upside and downside uncertainty indices are closely related to realized depreciation and realized appreciation, respectively. In column (iii) of table 3, I find that the UIP coefficient gets much smaller in its absolute value when inserting
  This indicates that
  is negatively related to
 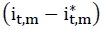 and correlated with the unobservable risk factors in the FX market. On the other hand, adding
  into the UIP regression, the estimated coefficient of
  is even more negative. This outcome implies that
  which closely reflects the depreciation of the Korean won, is positively correlated with
  It is consistent with Brunnermeier et al. (2009), which shows that FX crash risk increases with the interest rate differential. Overall, I find that FX uncertainty is at least related to the risk factors that existed in the FX market and should be taken into account to understand or predict exchange rate movement.
2. What Drives Foreign Exchange Uncertainty?
In this section, I examine the drivers of FX uncertainty. My intentions are 1) to offer supportive evidence of the link between the exchange rate and macro variables and 2) to provide information about turbulence in the FX market. Since Meese and Rogoff’s (1983) seminar paper, the exchange rate literature has focused on finding empirical evidence tying together the exchange rate and macro variables, such as inflation and output growth. Various econometric methods (Engel and Hamilton, 1990; Rossi, 2013; Wright, 2008; Kim and Lee, 2019) or relevant variables (Chen and Tsang, 2013) have been employed, yet the random walk is still known as the best predictor for exchange rate dynamics. In this section, I attempt to discover the elusive determinants of exchange rates by showing that macro variables contain predictive information for FX uncertainty. Thus, I regress the one-month ahead FX uncertainty index on several macro variables, which are commonly mentioned as the exchange rate determinants, as follows:

where i = {∗, +, −}, πt is the inflation rate, and yt is the output growth. The asterisk marks are for the corresponding U.S. variables. Following the literature, the macro variables are in the form of relative values between two countries. Capital inflow into Korea, KAt, is also included, reflecting the importance of capital flows in emerging countries’ exchange rates.16
The estimated results are summarized in Table 4. First, one can see that the macro variables contain considerable predictive information for FX uncertainty. In fact, onemonth ahead upside and downside FX uncertainty are predictable with adjusted R2 values of 0.570 and 0.509, respectively. Both upside and downside uncertainty regression have significantly estimated coefficients for economic variables, which seem to have the right sign in the intuitive sense that capital inflows into Korea reduce the crash risk of the Korean won. For example, the upside uncertainty regression results in a KAt coefficient of β4 = −4.421 and a t-statistic of -2.180. Considering that U+ relates to the extent of the crash risk of the Korean won, a significantly negative coefficient implies that increasing the nonresident investments into Korea makes its currency market more stable, while sudden capital outflows raise the possibility of currency crashes. A similar explanation can be applied to the downside uncertainty regression. The positive and statistically significant coefficient of β4 indicates that capital inflows increase the unexpectedly high value of the Korean won (i.e., a stronger Korean won against the U.S. dollar), implying that capital inflows reduce crash risk. Note that the insignificant and near zero coefficient in the overall FX uncertainty regression does not mean that FX uncertainty is disconnected from capital flows. By construction, the overall FX uncertainty index is the time series of combining U+ and U-, and thus, the effects of capital flows on upside and downside uncertainty might be canceled out.
Estimated results also show that relative inflation predicts downside uncertainty with a quantitatively and statistically significant impact. An increase in the inflation differentials between the two countries (i.e., a higher inflation in Korea) reduces the uncertainty associated with the unexpected appreciation of the Korean won. However, a rise in the relative inflation does not seem to be related to the upside uncertainty. This result indicates that FX uncertainty responds asymmetrically to macro variables in accordance with its direction. Looking at the size of the FX uncertainty, I obtain empirical evidence that macro variables, such as interest rate differential, inflation differential, and the output growth differential, provide useful information for the forthcoming exchange rate fluctuation. Keeping all else equal, rising Korean interest rates increase the unexpected movement of Korea-U.S. exchange rates. A similar explanation can be applied to the case when U.S. inflation or U.S. output growth increases relative to the corresponding Korean variables.
As a robustness check, I include additional regressors into equation (8). Among the many uncertainty indices, financial and macro uncertainty are chosen because these two variables Granger-cause FX uncertainties, as presented in table 1. The additional explanatory power from these two variables is marginal, and the coefficients for these two variables are insignificantly different from zero. In addition, the significance and size of the coefficients for the macro variables do not make a difference when other economic uncertainties are included. The results based on the additional variables confirm the importance of macro variables on FX uncertainty prediction.
Additionally, I re-estimate equation (8) in the form of three-month ahead predictive regression. As shown in table 5, the informative predictors are not the same as in the case of the one-month ahead predictive regression. Interestingly, the financial uncertainty index becomes significant and gains considerable predictive power in both the upside and downside uncertainty regression. Its estimated coefficient is 0.325 in upside uncertainty, implying that during a period in which global financial uncertainty is high, the FX uncertainty associated with the depreciation of the Korean won increases. Similarly, the coefficient of -0.265 in downside uncertainty indicates that an increase in global financial uncertainty lowers the possibility of a relatively higher value of the Korean won than expected. Moreover, relative output growth turns out to be an important predictor for upside uncertainty. This result provides the interpretation that when the Korean output growth increases relative to that of the U.S., the possibility of an unexpected Korean won crash vanishes. In the case of downside uncertainty, the interest rate differential plays a key role in predicting from one-month and three-month ahead horizons. The insignificant coefficient of capital flow in the three-month horizon implies that a relatively high interest rate subsequently attracts foreign investors, capital inflows, and FX uncertainty. In addition, the predictive power of the economic variables decreases considerably in the three-month ahead horizon. I view this outcome as an indication that current economic information has a declining effect on FX uncertainty further into the future.
These findings suggest that to predict FX uncertainty, which is closely related to the currency risk premia, one can obtain additional information from macro variables. I view this outcome as an indication that market participants can perceive macro variables as the signals by which to change their expectations, but the extent of those expectation changes can differ from that of the realized values.
14)See
15)To explain the failure of the UIP condition, extensive studies employ the various concept, such as risk premium
16)
IV. CONCLUSION
Using survey-based FX forecast data, I compute the Korea FX uncertainty index and analyze its characteristics. The Korea FX uncertainty properly captures the times of rare disaster events, such as the 1998 Asian Financial Crisis and the 2008 Global Financial Crisis. It also provides distinctive Korean currency market information, which is quite different from other uncertainty indices that have been developed in recent studies. The main contributions of this paper are 1) verifying the stronger impacts of uncertainty arising from the unexpectedly large depreciation on the Korea-U.S. exchange rate movement and 2) finding the economic variables that have predictive power regarding Korea FX uncertainty over a short horizon. Since the FX uncertainty is closely related to the disaster risk by construction, this result allows us to predict events related to sudden currency crashes and to understand the Korea-U.S. exchange rate dynamics.
Tables & Figures
Figure 1.
Distribution of 3-month ahead Exchange Rate Forecast Errors

Note: Left panel is the probability density function (pdf) of 3-month ahead Korea-U.S. exchange rates forecast errors. Right panel is cumulative distribution function (cdf) of forecast errors.
Figure 2.
Distribution of 3-month ahead Exchange Rate Forecast Errors

Note: The figure displays the upside and downside uncertainty indices obtained from Korea-U.S. exchange rate forecast error densities.
Figure 3.
Other Uncertainty Measures

Note: Financial and macro uncertainty is from
Table 1.
Correlation between FX Uncertainty and Other Uncertainties

Note: Upper panel presents the correlation between FX uncertainty and other uncertainty index. Bottom panel is the results of Granger causality test under the null hypothesis that other uncertainty measures does not cause FX uncertainty. Data are monthly from 1998M01 to 2017M06. The Granger causality test are computed from 5-order bivariate VARs. *, **, and *** indicate the significant level at 10%, 5%, and 1%, respectively.
Figure 4.
Currency Excess Returns Conditional on the Overall FX Uncertainty

Note: The “Average” indicates the excess returns and the forward premium obtaine from entire sample period. The “Lower quartile of U*” and “Upper quartile of U*” are obtained from the subsamples chosen by the degree of U*.
Table 2.
UIP Regression and the Overall Level of Uncertainty

Note: Newey-West standard errors are reported in the parentheses. *, **, and *** indicate the significant level at 10%, 5%, and 1%, respectively.
Table 3.
Adjusted UIP Regression: Overall, Upside, and Downside Uncertainty

Note: Newey-West standard errors are reported in the parentheses. *, **, and *** indicate the significant level at 10%, 5%, and 1%, respectively.
Table 4.
Predicting FX Uncertainty with Macro Variable (1-month ahead)

Note: This table reports parameter estimates in equation (7) and (8), where m = 1. Newey-West standard errors are reported in the parentheses. *, **, and *** indicate the significant level at 10%, 5%, and 1%, respectively.
Table 5.
Predicting FX Uncertainty with Macro Variable (3-month ahead)

Note: This table reports parameter estimates in equation (7) and (8), where m = 3. Newey-West standard errors are reported in the parentheses. *, **, and *** indicate the significant level at 10%, 5%, and 1%, respectively.
References
-
Andersen, T. G. and T. Bollerslev. 1998. “Deutsche Mark-Dollar Volatility: Intraday Activity Patterns, Macroeconomic Announcements and Longer Run Dependencies,”
Journal of Finance , vol. 53, no. 1, pp. 219-265.
-
Andersen, T. G., Bollerslev, T., Diebold, F. X. and P. Labys. 2001. “The Distribution of Realized Exchange Rate Volatility,”
Journal of the American Statistical Association , vol. 96, no. 453, pp. 42-55.
-
Bacchetta, P. and E. van Wincoop. 2010. “Infrequent Portfolio Decisions: A Solution to the Forward Discount Puzzle,”
American Economic Review , vol. 100, no. 3, pp. 870-904.
-
Bacchetta, P., Mertens, E. and E. van Wincoop. 2009. “Predictability in Financial Markets: What Do Survey Expectations Tell Us?”
Journal of International Money and Finance , vol 28, no. 3, pp. 406-426.
-
Baker, S. R., Bloom, N. and S. J. Davis. 2016. “Measuring Economic Policy Uncertainty,”
Quarterly Journal of Economics , vol. 131, no. 4, pp. 1593-1636.
-
Bansal, R. and I. Shaliastovich. 2013. “A Long-run Risks Explanation of Predictability Puzzles in Bond and Currency Markets,”
Review of Financial Studies , vol. 26, no. 1, pp. 1-33.
-
Berg, K. A. and N. C. Mark. 2018. “Measures of Global Uncertainty and Carry-trade Excess Returns,”
Journal of International Money and Finance , vol. 88, pp. 212-227.
-
Bloom, N. 2009. “The Impact of Uncertainty Shocks,”
Econometrica , vol. 77, no. 3, pp. 623-685. -
Brunnermeier, M. K., Nagel, S. and L. Pedersen. 2009. “Carry Trades and Currency Crashes,”
NBER Macroeconomics Annual 2008 , vol. 23, pp. 313-347.
-
Burnside, C., Eichenbaum, M., Kleshchelski, I. and S. Rebelo. 2011. “Do Peso Problems Explain the Returns to the Carry Trade?”
Review of Financial Studies , vol. 24, no. 3, pp. 853-891.
-
Chen, Y. -C. and K. P. Tsang. 2013. “What Does the Yield Curve Tell Us about Exchange Rate Predictability?”
Review of Economics and Statistics , vol. 95, no. 1, pp. 185-205.
-
Colacito, R. and M. Croce. 2011. “Risks for the Long Run and the Real Exchange Rates,”
Journal of Political Economy , vol. 119, no. 1, pp. 153-181.
-
Croushore, D. and T. Stark. 2001. “A Real-Time Data Set for Macroeconomists,”
Journal of Econometrics , vol. 105, pp. 111-130.
-
Della Corte, P. and A. Krecetovs. 2019. Macro Uncertainty and Currency Premia. at SSRN. <
https://papers.ssrn.com/sol3/papers.cfm?abstract_id=2924766 > (accessed January 21, 2020) -
Engel, C. and J. D. Hamilton. 1990. “Long Swings in the Dollar: Are in the Data and Do Markets Know It?”
American Economic Review , vol. 80, no. 4, pp. 689-713. -
Fama, E. 1984. “Forward and Spot Exchange Rates,”
Journal of Monetary Economics , vol. 14, no. 3, pp. 319-338.
-
Farhi, E. and X. Gabaix. 2016. “Rare Disasters and Exchange Rates,”
Quarterly Journal of Economics , vol. 131, no. 1, pp. 1-52. -
Husted, L., Rogers, J. and B. Sun. 2018. “Uncertainty, Currency Excess Returns, and Risk Reversals,”
Journal of International Money and Finance , vol. 88, pp. 228-241.
-
Ismailov, A. and B. Rossi. 2018. “Uncertainty and Deviations from Uncovered Interest Rate Parity,”
Journal of International Money and Finance , vol. 88, pp. 242-259.
-
Jurado, K., Ludvigson, S. C. and S. Ng. 2015. “Measuring Uncertainty,”
American Economic Review , vol. 105, no. 3, pp. 1177-1216.
-
Kim, S. and D. Y. Yang. 2009. “Do Capital Inflows Matter to Asset Prices? The Case of Korea,”
Asian Economic Journal , vol. 23, no. 3, pp. 323-348.
-
Kim, Y. M. and S. Lee. 2019. “Korean Exchange Rate Forecasts Using Bayesian Variable Selection,”
Asia-Pacific Journal of Accounting & Economics . <https://doi.org/10.1080/16081625.2019.1653777 > (accessed January 21, 2020) -
Martens, M. 2001. “Forecasting Daily Exchange Rate Volatility Using Intraday Returns,”
Journal of International Money and Finance , vol. 20, no. 1, pp. 1-23. -
Meese, R. A. and K. S. Rogoff. 1983. “Empirical Exchange Rate Models of the Seventies: Do They Fit out of Sample?”
Journal of International Economics , vol. 14, nos. 1-2, pp. 3-24.
-
Menkhoff, L., Sarno, L., Schmeling, M. and A. Schrimpf. 2012. “Carry Trades and Global Foreign Exchange Volatility,”
Journal of Finance , vol. 67, no. 2, pp. 681-718.
-
Lee, S. 2018. “Economic Policy Uncertainty in the US: Does It Matter for Korea?”
East Asian Economic Review , vol. 22, no. 1, pp. 29-54.
- Ludvigson, S. C., Ma, S. and S. Ng. 2019. “Uncertainty and Business Cycles: Exogenous Impulse or Endogenous Response?” NBER Working Paper, no. 21803.
-
Ozturk E. O. and X. S. Sheng. 2018. “Measuring Global and Country-Specific Uncertainty,”
Journal of International Money and Finance , vol. 88, pp. 276-295.
-
Rossi, B. 2013. “Exchange Rate Predictability,”
Journal of Economic Literature , vol. 51, no. 4, pp. 1063-1119.
-
Rossi, B. and T. Sekhposyan. 2015. “Macroeconomic Uncertainty Indices Based on Nowcast and Forecast Error Distributions,”
American Economic Review: Papers and Proceeding , vol. 105, no. 5, pp. 650-655.
-
Scotti. C. 2016. “Surprise and Uncertainty Indexes: Real-time Aggregation of Real-Activity Macro Surprises,”
Journal of Monetary Economics , vol. 82, pp. 1-19.
-
Verdelhan, A. 2010. “A Habit-based Explanation of the Exchange Rate Risk Premium,”
Journal of Finance , vol. 65, no. 1, pp. 123-146.
-
Wright, J. H. 2008. “Bayesian Model Averaging and Exchange Rate Forecasts,”
Journal of Econometrics , vol. 146, no. 2, pp. 329-341.