

- EAER>
- Journal Archive>
- Contents>
- articleView
Contents
Article View
East Asian Economic Review Vol. 22, No. 4, 2018. pp. 507-529.
DOI https://dx.doi.org/10.11644/KIEP.EAER.2018.22.4.352
Number of citation : 2View
94
Download
71
The Effect of Quantitative Easing on Inflation in Korea
|
|
Bank of Korea |
|---|

Abstract
This paper evaluates the whole impact of quantitative easing on inflation in Korea implemented by the central banks in four major advanced economies, the U.S., Euro Area, U.K. and Japan. According to the analysis employing a VAR-X model with the security holdings of those central banks an exogenous variable, quantitative easing is estimated to exert downward pressures on inflation in Korea. Considering the impulse responses of Korean macroeconomic variables to a quantitative easing shock, the spillover effect is transmitted through exchange rate channel while trade channel turns out to be ineffective. In an additional analysis assessing the impact of each quantitative easing program of the central banks, only those of the Fed and European Central Bank are estimated to be significant. The empirical results prove to be robust even if using long-term interest rates as an alternative indicator of quantitative easing.
JEL Classification: E31, E58, F42
Keywords
Quantitative Easing, Security Holdings, Spillover Effects, Exchange Rate and Trade Channel, Inflation in Korea, VAR-X
I. INTRODUCTION
For the purpose of providing further stimulus to the economic recovery after the U.S. sub-prime crisis in 2008 while adding corporate bonds issued by private enterprises residing in the Euro area to the list of purchasable assets. The Fed began the first round of quantitative easing (QE) as early as in November 2008, and the QE programs of the Bank of England (BOE) and European Central Bank (ECB) ensued in March and June 2009, respectively. The Bank of Japan (BOJ) started the Asset Purchase Program in October 2010. The QE programs (henceforth QEs) in those advanced economies are regarded as effective in achieving the intended aim of reducing domestic long-term interest rates.1 On the other hand, the QEs brought about unintended international spillover effects by creating excessive global liquidity (Korniyenko and Loukoianova, 2015). Continuous capital outflows from the advanced economies likely affected the financial conditions of emerging market economies (EMEs).2 The spillover effects of the QEs have been empirically substantiated by numerous studies (Takáts and Vela, 2014; Bhattarai et al., 2015; Bowman et al., 2015; Chen et al., 2016; Tillmann, 2016; Anaya et al., 2017).3
Among those studies, Anaya et al. (2017) find economic growth accelerates and real exchange rates decrease in EMEs following the Fed’s QE using data on portfolio outflows from the U.S. as a proxy for QE. Miyajima et al. (2014) estimate the effects of the Fed’s QE on five Asian economies including Korea. Their empirical results reveal that exchange rates do not respond significantly to a decline in 10-year U.S. Treasury yield while inflation pressure diminishes substantially. Chen et al. (2016) evaluate the average effects of the Fed’s QE on major advanced economies and fourteen EMEs. The results of their analysis indicate that, in Asian EMEs, appreciation pressures on local currency intensify and inflation decreases responding to a QE shock from the U.S. Bhattarai et al. (2015) find an expansionary U.S. QE shock exerts a significant influence on financial variables in EMEs.4 Tillmann (2016) also finds each of the three rounds of QE and the Maturity Extension Program (MEP) immediately expands capital flows into EMEs and induce appreciation in their currency value.
While the research on the impacts of the Fed’s QE on financial variables in EMEs have been burgeoning, macroeconomic variables in EMEs have not been paid due attention in the literature. Even in the several, if any, studies which include output and inflation in EMEs in the variable set of interest, those variables are treated as a secondary concern. In particular, the estimated effect of the Fed’s QE on inflation in EMEs is insignificant or negligible at the most.
Against this backdrop, the role of QE has been nearly overlooked in explaining the downward phase of inflation in Korea from 2011 to 2014. Meanwhile, as the reasons for that, researchers have suggested anemic expenditure on consumption and investment on the demand side and decreases in the prices of crude oil and intermediate goods on the supply side. However, considering the prevalent results from existing studies that the Fed’s QE led to appreciation in the currency value of EMEs, the QEs of the central banks in advanced economies as a whole might amplify the aforementioned downward pressures arising from weak aggregate demand and lower input prices on inflation through exchange rate channel.5
Motivated by these considerations, this paper aims to estimate the spillover effect of the QEs on inflation in Korea implemented by the central banks of four major advanced economies, namely, the U.S., Euro Area, Japan and U.K. on inflation in Korea through estimating a VAR-X model with the security holdings of those central banks an exogenous variable. The paper has two important distinctions compared to the existing studies in the same strand. First, since only Korean data is used for the analysis, the impact of the QEs unique to Korea can be identified instead of the average impact on EMEs. Second, unlike previous studies focusing their attention only on the Fed’s QE, the paper takes into account all the QEs implemented by the central banks of the major advanced economies (henceforth,
The empirical results of the analysis uncover that the QEs as a whole exert additional downward pressures on inflation in Korea through appreciation in the currency value. On the other hand, transmission of QEs through trade channel enlarging aggregate demand in EMEs turns out to be ineffective. Comparing the impacts of the individual QE programs on inflation in Korea, only those of the Fed and ECB are estimated to be significant. As regards the robustness of the empirical results, the results of an alternative estimation using long-term interest rates instead of the security holdings as an alternative indicator of QE remain in line with the baseline results.
The remainder of the paper is organized as follows. Section II provides an overview of each QEs of the major central banks. Section III elaborates on possible transmission channels through which the QEs affect inflation in Korea. Section IV presents the results of empirical analysis. Section V concludes with a summary and policy implications.
1)Numerous studies have provided the empirical results that QE induced long-term interest rates to fall. Earlier studies such as
2)A number of studies,
3)Another strand of research such as
4)
5)According to
II. OVERVIEW OF QUANTITATIVE EASING IN ADVANCED ECONOMIES
This section presents a brief overview of the QEs implemented by the Fed, ECB, BOJ and BOE following the sub-prime crisis.
Firstly, the Fed conducted three rounds of QE consecutively from November 2008 to October 2014 as shown in Table 1 to induce long-term interest rates to fall while lowering the target range for the federal funds rate to the zero lower bound in December 2008.6 The Fed purchased mainly agency mortgage-backed securities (MBS) and longterm treasury bonds totalling approximately 4 trillion U.S. dollars (henceforth
The ECB also embarked on a series of QE programs from June 2009 as shown in Table 2. Whereas the Fed’s QE was meant to lower long-term interest rates from the very beginning, the ECB’s initial QE programs, the first two rounds of Covered Bond Purchase Programme (CBPP) and the Securities Markets Programme (SMP), were intended to supply sufficient liquidity for easing credit conditions in the Euro Area. However, as inflation continued to hover far below the targeted level of
The BOJ, having already lowered policy rates to 0.5% even before the sub-prime crisis, launched the Asset Purchase Program (APP) in 2010 to expand the scope of policy for boosting the economy. As shown in Table 3, the BOJ purchased 76 trillion yen under the APP in various debts including government bonds, corporate bonds and commercial papers from October 2010 through March 2013. However, as deflation persisted even after implementing the APP, the BOJ entered the new phase of QE in 2013. The bank introduced the price stability target of 2% in January 2013 and subsequently launched the Quantitative and Qualitative Monetary Easing (QQE) in April the same year as a means to achieving the inflation target. It set the target for annual purchase of Japanese government bonds (JGBs) as 50 trillion yen while aiming to extend the average remaining maturity of the government bonds it held to about seven years. The BOJ has maintained the QQE regime modifying the main components of the policy framework.9
The BOE carried out QE through the Asset Purchase Facility (APF) established in March 2009 purchasing mainly medium- and long-maturity gilts, the government bond of the U.K. Initially, the ceiling on total asset purchase was set as 200 billion pounds by outstanding standard and was increased gradually to 435 billion since medium-term forecasts for inflation remained below the inflation target of 2% for too long. In September 2016, the Corporate Bond Purchase Scheme (CBPS) was newly introduced for buying additional 10 billion pounds in corporate bonds.
As a consequence of those large-scale asset purchases, the security holdings of the central banks increased rapidly and long-term interest rates in the advanced economies fell appreciably as can be seen in Figure 1. Table 5 below presents the increment and growth rate of the security holdings between 2008 and 2014. The Fed’s security holdings increased by 3.7 trillion dollars, roughly seven times during the period of QE implementation from the end of 2008 to October 2014. During the same period, the BOJ expanded its balance sheet by 2.1 trillion dollars, the ECB by 1.1 trillion dollars and the BOE by 0.6 trillion dollars. Comparing the growth rates of security holdings, the Fed’s is the highest as 755.9%, and the ECB and BOJ follow as 671.6% and 294.9%, respectively. The BOE’s growth rate is the lowest as 32.7%.
The average of long-term interest rates in the major advanced economies decreased by 110 basis points cumulatively from 2.3% to 1.2% during the same period as above, which is in line with the forecasts from the studies conducted at the earlier stage of QE such as Gagnon et al. (2011) and Joyce et al. (2011).
6)Academic attempts have been accumulated to quantify the effects of the Fed’s QE and MEP on long-term interest rates. According to
7)Under the MEP, the Fed sold short-term Treasury securities maturing less than three years to buy long-term ones. The program resulted in the purchase of an additional 267 billion dollars in Treasury securities.
8)Under the PSPP, the range of eligible assets for purchase also included, alongside government securities, governmental agency debts and euro-denominated securities issued by international organizations residing in the Euro Area.
9)The BOJ changed the original version of QQE to QQE
III. Channels of QE Transmission to Inflation in Korea
QE is theoretically presumed to exert spillover effects on financial and macroeconomic conditions in EMEs through exchange rate channel, trade channel and portfolio-balance channel which are closely intertwined, not mutually exclusive (Bauer and Neely, 2014; Lavigne et al., 2014).
■ Exchange rate channel: QE amplifies liquidity in advanced economies and thereby prompts the superfluous funds to flow into financial markets in EMEs. In the process, the currency value of EMEs remain under continuous appreciation pressure.
■ Trade channel: If QE were effective for boosting economic activities in advanced economies, the demand for imports from EMEs would expand, which in turn leads to larger aggregate demand in EMEs. However, its positive spillover effect on EMEs’ exports through trade channel may be offset by appreciation in the currency value of EMEs through exchange rate channel.
■ Portfolio-balance channel: Ampler liquidity created by QE translates into asset price appreciation compressing capital gains in advanced economies. In response to that, global investors rebalance their portfolio increasing their exposure to EMEs to attain higher returns. As a result, the capital relocation causes booms in asset markets of EMEs.
Applying the above reasoning, QE could affect inflation in EMEs through those three channels as follows. First, via exchange rate channel, QE would lessen inflationary pressure in EMEs directly by lowering import prices. Moreover, it might enhance downward pressure on inflation indirectly if exports of EMEs dwindle because of currency appreciation through the same channel. Second, if the demand in advanced economies for the products of EMEs expands owing to QE and consequently EMEs’ aggregate demand also grows, trade channel would engender upward pressures on inflation. Last, if portfolio rebalancing caused by QE leads to asset price hikes in EMEs and then the accrued capital gains are expended on consumption, in other words, if wealth effect channel operates, inflation would receive upward pressures. However, the causal link running from QE to inflation in EMEs through portfolio-balance channel appears to be tenuous relative to the other two channels in that the link is more distant and the existence of wealth effect still remains debatable from the empirical viewpoint.10
In Korea, exchange rate channel seems to have operated during the period from 2009 to 2014 in which the security holdings of the major central banks grew rapidly allowing for the foreign capital inflows and exchange rate trend. Seeing foreign investments in Korea on International Investment Position (IIP) plotted in Figure 2, capital inflows in net turned positive in 2009 in which the QEs were undertaken in concert among the advanced economies and remained so until 2013.11 The increment in capital inflows to Korea accounts for roughly 10% of the total inflows to EMEs during that period. The exchange rate of Korean Won (KRW) against U.S. dollar (USD) continued a downward trend most of the time until 2014, which ended in the appreciation of KRW by 14.6% as of the end of 2014 compared to the end of 2008.
A correlation analysis is conducted between the security holdings of the major central banks, the outstanding amount of foreign portfolio investment in Korea and the exchange rate of KRW/USD to examine preliminarily whether exchange rate channel operates during the period from January 2009 to December 2014. As can be seen in Table 6, the security holdings of the major central banks are positively correlated with the outstanding amount of foreign portfolio investment, which in turn is negatively correlated with the exchange rate of KRW/USD. This result suggests a causal chain runs from the QEs to expansion of capital flows to Korea, finally to appreciation in the value of KRW.
In contrast, trade channel looks apparently inoperative in Korea considering the growth rates of the major advanced economies and the exports from Korea to those economies during the period from 2009 to 2014 as shown in Figure 3. Seeing the left panel of the figure, the annual economic growth rate after the sub-prime crisis stays below the pre-crisis average of 2.2% every single year except for 2010. It means the economic recovery was being delayed for a protracted period despite then extremely accommodative financial condition.12 As a consequence, the exports from Korea to those economies, as shown in the right panel of the same figure, grew to such a limited extent that the QEs might hardly take effect through trade channel.
10)The capital gains accrued by QEs through portfolio-balance channel can be considerable since the yield on Korean 10-year government bond decreased from about 5% at the early 2009 to about 2% at the end of 2015 and KOSPI more than doubled from 2009 to 2011. However, how much portion of the capital gains belonged to common households and whether households spent the gains for consumption in practice need to be verified by another serious empirical analysis. Nevertheless, it is worth mentioning that previous empirical findings in Korea broadly support the wealth effect due to increases in stock prices is limited and differential among income groups
11)By the statistics from the EPFR (Emerging Portfolio Fund Research), the yearly average amount of foreign capital inflows to EMEs from 2005 to 2008 is 19.9 billion USD. It increased more than two times to 47.3 billion USD from 2009 to 2014. During this period, the ratio of the foreign capital inflows to Korea to the total inflows to EMEs hovers in the range of between 10% and 12% per annum. 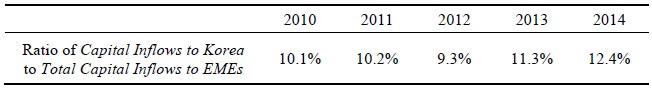
12)The sovereign debt crisis of southern European countries such as Greece, Spain, Portugal hampered global economic recovery by amplifying the initial negative shock which originated earlier from the sub-prime crisis in the U.S.
IV. EMPIRICAL ANALYSIS
1. Baseline Model Specification
The baseline model is specified as follows for estimating the influence of the QEs of the major central banks as a whole on inflation in Korea through exchange rate and trade channels.13

where
The shocks of the baseline model are identified by a standard Cholesky decomposition method. The endogenous variables in

The estimation period is set from January 2009 to December 2014 considering that the Fed’s QE terminated in October 2014 and the security holdings of the major central banks grew rapidly during that period.19 For ensuring the stationarity of the timeseries, all the level data except for
2. Empirical Results
The empirical results of the analysis can be summarized as follows. First, exchange rate channel is estimated to be operating during the sample period through which the QEs of the major central banks put downward pressures on inflation in Korea. On the other hand, the effect thorough trade channel turns out to be insignificant. Second, among the QEs of the major central banks, only those of the Fed and ECB turn out to be transmitted to inflation in Korea and especially the Fed’s appears to be slightly more potent relative to the ECB’s.
Figure 4 shows the impulse response functions for a shock to the total security holdings of the major central banks. Responding to a positive one standard deviation shock to the growth rate of the security holdings, the rate of change in
Next, to compare the magnitude of the individual QE program’s impact on inflation, the baseline model above is re-estimated using the security holdings of each of, not all, the major central banks. Looking at the results of this additional analysis presented in Figure 5 and 6 which show the impulse responses of
3. Alternative Model Specification
Most of the recent studies on the international spillover effects of QE use long-term interest rates or term spread as its statistical indicator instead of the security holdings of the central banks. For checking the robustness of the baseline results presented above, the same VAR-X model is re-estimated replacing the growth rate of the major central banks’ security holdings in
It can be seen in Figure 7 that the newly estimated impulse responses of the endogenous variables are qualitatively consistent with the baseline results.23 If the average of the long-term interest rates in the major advanced economies decreases by 50 basis points, the rate of change in
13)Portfolio-balance channel is not reflected based on the consideration that it is hardly justifiable to assume the QEs enlarge inflationary pressure in Korea through taking wealth effect.
14)Industrial production gap,
15)By
16)
17)The reason why the prices of crude oil and other raw materials are included in
18)Even if the endogenous variables ordered differently, the empirical results turn out to be broadly in line with the results obtained thorough this ordering.
19)By the results of the ADF (Augmented Dicky Fuller) tests, the time series of the endogenous variables are estimated to be stationary during the sample period.
20)A positive shock to the growth rate of the security holdings corresponds to an increase of 32.0 percentage point in the growth rate.
21)The average of IPG is -0.01 and its standard deviation is 1.73.
22)The estimation results of an alternative model including exports in place of industrial production, the growth rate of exports decreases by 2 percentage point upon a shock to QEs, which contradicts the predicted effect through trade channel. The estimated impulse responses are provided in Annex.
23)It is also true of another alternative model using term spread between yields on 10-year government bonds and interest rates on overnight inter-bank lending. This result is foreseeable enough considering that overnight interest rates in the major advanced economies were nearly fixed to zero-lower bound most of the time during the sample period while long-term interest rates fluctuated in a wider range reflecting various economic factors including the QEs.
24)However, this inference needs to be verified by a further analysis of how the QEs influenced the liquidity of money market in Korea and thereby short-term interest rates.
V. POLICY IMPLICATIONS
The empirical results of the paper support the hypothesis that the QEs of the central banks in major advanced economies posed additional downward pressures on inflation in Korea through exchange rate channel. That means in practice the QEs amplified the impacts of decreasing prices of crude oil and other raw materials on inflation during the disinflationary era from 2011 to 2014. It is considered in general, even in the circle of central bankers, that inflation is determined predominantly by domestic output gap and hence is hardly influenced directly by monetary policy decisions of the central banks in advanced economies. However, the findings of this paper imply that a direct causal relationship may emerge between monetary policy in advanced economies and inflation in EMEs depending on the policy measures and their scale.
A couple of policy implications derive from the empirical results with respect to the central bank’s research direction and communication. Firstly, central bankers in EMEs implementing inflation targeting need to be alert to the possibility that monetary policy stance abroad can be transmitted to domestic inflation through the channels considered unlikely in normal situations. In this regard, it is worth intensifying research on the transmission channels through which monetary policy in advanced economies affect inflation in EMEs. The efforts are expected to contribute to forecasting inflation more accurately and thereby to finding an optimal path of policy rates.
Secondly, the central bank needs to reinforce communication to explain the causes of changes in inflation to the public based on related research findings. As verified by existing studies, consumers tend to form inflation expectations in a backward looking way considering mainly past inflation information.25 However, if the central bank aggressively deliver the results of their research on the evolution of inflation, at least a fraction of consumers likely incorporate the knowledge into the information set used for forming inflation expectations. For example, if consumers in Korea had known that the QEs of the central banks in advanced economies were lowering inflation additionally while having the common knowledge that QEs would terminate in due course, they could have downplayed the apprehension of deflation occurrence which was somewhat prevalent around 2015 and formed inflation expectations at higher level.
Additionally, as a topic of further research in relation to this paper, it is worth studying whether the Fed’s balance sheet normalization started in 2007 puts upward pressures on inflation in Korea and that effect is symmetric compared with QE.
Annex
The following figure shows the impulse responses of the alternative model which replaces industrial production gap in the baseline model with the growth rate of total exports.
25)A large number of studies overseas as well as in Korea have empirically shown that consumers’ inflation expectations are formed in a backward-looking way.
Tables & Figures
Table 1.
Quantitative Easing by the Fed

Source: Federal Reserve
Table 2.
Quantitative Easing by the ECB

Notes: 1) The acronyms in the table stand for what is in the following parentheses: CB (Covered Bond), CBPP (Covered Bond Purchase Programme), SMP (Securities Markets Programme), ABSPP (Asset-backed Securities Purchase Programme), PSPP (Public Sector Purchase Program), CSPP (Corporate Sector Purchase Programme).
2) The purchase amount is in net as of June 2018.
Source: ECB
Table 3.
Quantitative Easing by the Bank of Japan

Notes: 1) APP and QQE stand for the Asset Purchase Program and Quantitative and Qualitative Monetary Easing, respectively. REIT refers to Real Estate Investment Trust.
2) The purchase amount of the QQE is in net as of June 2018.
Source: Bank of Japan
Table 4.
Quantitative Easing by the Bank of England

Note: APF and CBPS stand for Asset Purchase Facility and Corporate Bond Purchase Scheme, respectively.
Source: Bank of England
Figure 1.
Security Holdings of the Central Banks and Long-term Interest Rates in Major Advanced Economies

Note: Long-term interest rates in the Euro Area refer to yields on Bund, the German government bond, with the maturity of 10 years.
Table 5.
Security Holdings of the Central Banks in Advanced Economies

Note: The statistics are calculated for the period between the end of 2008 and the end of 2014.
Figure 2.
Transmission of QEs to Inflation in EMEs through Exchange Rate Channel and Trade Channel

Table 6.
Coefficients of Correlation between QE, Capital Inflow and Exchange Rate

Note: The data used for calculating the correlation coefficients are cyclical components of the variables extracted from the level data during from Jan. 2007 to Dec. 2015 through Hodrick-Prescott filtering.
Figure 3.
Flow of Foreign Investment and Exchange Rate in Korea

Source: Bank of Korea
Figure 4.
Economic Growth of Advanced Economies and Korean Exports

Note: Economic growth rate is the growth rate of the
Sources: U.S. Bureau of Economic Analysis, Eurostat, U.K. Office for National Statistics, Japan Cabinet Office, Bank of Korea, Korea International Trade Association
Figure 5.
Impulse Responses to a Shock to Security Holdings of the Major Central Banks

Note: The solid line represents the median response and the shaded area represents 68% confidence interval.
Figure 6.
Impulse Responses of Exchange Rate to a Shock to Security Holdings of Each Central Bank

Note: The solid line represents the median response and the shaded area represents 68% confidence interval.
Table 7.
Descriptive Statistics on Growth Rate of Security Holdings

Note: The statistics are calculated using the data from Jan. 2009 to Dec. 2014. Monthly Average means the average of monthly growth rates.
Figure 7.
Impulse Responses of Inflation in Korea to a Shock to Security Holdings of Each Central Bank

Note: The solid line represents the median response and the shaded area represents 68% confidence interval.
Figure 8.
Impulse Responses to a Negative Shock to Long-term Interest Rates in the Advanced Economies

Notes: The graphs represent impulse responses to a negative shock of 50 basis points to the

Note: The solid line represents the median response and the shaded area represents 68% confidence interval.
References
-
Anaya, P., Hachula, M. and C. J. Offermanns. 2017. “Spillovers of U.S. Unconventional Monetary Policy to Emerging Markets: The Role of Capital Flows,”
Journal of International Money and Finance , vol. 73, Part B, pp. 275-295.
-
Bank of Korea (BOK). 2015. “Transmission Effect of Base Rate Reductions on Banks’ Loan and Deposit Interest Rates,”
Monetary Policy Report , April, pp. 68-70. -
Bauer, M. D. and C. J. Neely. 2014. “International Channels of the Fed’s Unconventional Monetary Policy, ”
Journal of International Money and Finance , vol. 44, pp. 24-46.
- Bhattarai, S., Chatterjee, A. and W. Y. Park. 2015. Effects of U.S. Quantitative Easing on Emerging Market Economies. FRB of Dallas Globalization and Monetary Policy Institute. Working Paper, no. 255.
- Bonis, B., Ihrig, J. and M. Wei. 2017. The Effect of the Federal Reserve’s Securities Holdings on Long-term Interest Rates. FEDS Notes. Washington: Board of Governors of the Federal Reserve System. April 20, 2017.
-
Bowman, D., Londono, J. M. and H. Sapriza. 2015. “U.S. Unconventional Monetary Policy and Transmission to Emerging Market Economies,”
Journal of International Money and Finance , vol. 55, pp. 27-59.
-
Chang, B.-K. 2009. “Sock and Real Estate Market Effects on Household Consumption,”
Journal of Industrial Economics and Business , vol. 22, no. 3, pp. 1111-1132. (in Korean) -
Chen, Q., Filardo, A., He, D. and F. Zhu. 2016. “Financial Crisis, U.S. Unconventional Monetary Policy and International Spillovers,”
Journal of International Money and Finance , vol. 67, pp. 62-81.
-
Christensen, J. H. E. and G. D. Rudebusch. 2012. “The Response of Interest Rates to U.S. and U.K. Quantitative Easing,”
Economic Journal , vol. 122, no. 564, pp. F385-F414.
-
Cushman, D. O. and T. Zha. 1997. “Identifying Monetary Policy in a Small Open Economy under Flexible Exchange Rates,”
Journal of Monetary Economics , vol. 39, no. 3, pp. 433-448.
-
Eichenbaum, M. and C. L. Evans. 1995. “Some Empirical Evidence on the Effects of Shocks to Monetary Policy on Exchange Rates,”
Quarterly Journal of Economics , vol. 110, no. 4, pp. 975-1009.
-
Fratzscher, M., Duca, M. L. and R. Straub. 2016. “On the International Spillovers of U.S. Quantitative Easing,”
Economic Journal , vol. 128, no. 3, pp. 330-377. -
Gagnon, J., Raskin, M., Remache, J. and B. Sack. 2011. “The Financial Market Effects of the Federal Reserve’s Large-Scale Asset Purchases,”
International Journal of Central Banking , vol. 7, no. 1, pp. 3-43. -
Gambacorta, L., Hofmann, B. and G. Peersman. 2014. “The Effectiveness of Unconventional Monetary Policy at the Zero Lower Bound: A Cross-Country Analysis,”
Journal of Money, Credit and Banking , vol. 46, no. 4, pp. 615-642.
-
Gong, C., Son, C. and S. Choi. 2014. “Influence of Changes in Won/Dollar Exchange Rate on Consumer Prices,”
BOK Inflation Report , July, pp. 14-16. (in Korean) -
Joyce, M. A. S., Lasaosa, A., Stevens, I. and M. Tong. 2011. “The Financial Market Impact of Quantitative Easing in the United Kingdom,”
International Journal of Central Banking , vol. 7, no. 3, pp. 113-161. -
Kim, A.-Y. 2006. “Pass-Through of Exchange Rate Changes to Domestic Inflations in Korea,”
Journal of Korea Research Society for Customs , vol. 7, no. 1, pp. 213-237. (in Korean) - Kim, K. 2012. Pass-Through of Foreign Prices to Domestic Prices. BOK Economic Review, Discussion Paper Series, no. 2012-14. (in Korean)
-
Kim, S.-W. and M. Choi. 2007. “Stock Return’s Effect on Different Income Cohorts’ Consumption: Evidence from Nonlinear Estimation in Korea,”
Journal of Money and Finance , vol. 12, no. 2, pp. 145-174. (in Korean) - Korniyenko, Y. and E. Loukoianova. 2015. The Impact of Unconventional Monetary Policy Measured by the Systemic Four on Global Liquidity and Monetary Conditions. IMF Working Paper, no. WP/15/287.
-
Lavigne, R., Subrata, S. and G. Vasishtha. 2014. “Spillover Effects of Quantitative Easing on Emerging-Market Economies,”
Bank of Canada Review , vol. 2014, Autumn, pp. 23-33. - Miyajima, K., Mohanty, M. S. and J. Yetman. 2014. Spillovers of U.S. Unconventional Monetary Policy to Asia: the Role of Long-term Interest Rates. BIS Working Papers, no. 478.
-
Nam, M.-H. and M. Go. 2017. Formation of Inflation Expectations: Characteristics and Implications.
BOK Monthly Bulletin , vol. 71, no. 12, pp. 16-34. (in Korean) - Takáts, E. and A. Vela. 2014. International Monetary Policy Transmission. BIS Papers, no. 78.
-
Tillmann, P. 2016. “Unconventional Monetary Policy and the Spillovers to Emerging Markets,”
Journal of International Money and Finance , vol. 66, pp. 136-156.