

Abstract
This study depicts changes in the warm season (May to September) Universal Thermal Climate Index (UTCI) quantifying outdoor thermal comfort over the Loess Plateau from 1982 to 2015 and examines its relationship with large-scale climate changes and local vegetation restoration under the Grain for Green Program (GGP) after 1999. The results show that the UTCI experienced an increasing trend of 0.074/a from 1982 to 1999 and subsequently experienced a weakly decreasing trend of −0.002/a from 1999 to 2015. This trend shift in the UTCI was predominantly determined by surface air temperature changes with slopes of 0.077 °C a−1 from 1982 to 1999 and −0.005 °C a−1 from 1999 to 2015. The hiatus in the regional temperature rise after 1999 was closely related to the large-scale climate warming hiatus. Meanwhile, both measurement data analysis and climate modeling with the Weather Research and Forecasting (WRF) model suggest that the trend shift was also accelerated by vegetation restoration after 1999 through the intensification of transpiration, which increased the latent heat flux and reduced sensible heat flux. In particular, at the stations with the greatest degree of vegetation restoration, the local forcing from vegetation restoration was likely greater than that from the large-scale climate warming hiatus. This study highlights the importance of substantial vegetation restoration on local and regional thermal comfort.
Export citation and abstract BibTeX RIS

Original content from this work may be used under the terms of the Creative Commons Attribution 4.0 licence. Any further distribution of this work must maintain attribution to the author(s) and the title of the work, journal citation and DOI.
1. Introduction
Thermal comfort refers to the subjective perception of physical satisfaction with the thermal environment; it is assessed with an unobjective evaluation (ASHRAE Standard 55 2013). Local outdoor thermal comfort (OTC) conditions affect the human body in many ways. Suitable thermal conditions can reduce fatigue and improve quality of life, and they are extremely important for health, well-being, and productivity. Conversely, worse thermal conditions can disrupt public life and work, even causing an imbalance in the body's circulation and metabolism and harming human health (Zhang et al 2014). Therefore, OTC plays a vital role in fields such as public health, energy consumption, and tourism. In the context of global climate change, OTC variations and their driving forces are a hot topic.
OTC is heavily influenced by ground-surface meteorological factors. Changes in the large-scale climate and atmospheric circulation play vital roles in these ground-surface meteorological factors. Therefore, the influences of these large-scale factors on OTC have been extensively studied. Existing studies have focused on changes in the mean climatological state of OTC (e.g., Eludoyin and Adelekan 2012, Potchter and Itzhak Ben-Shalom 2013) as well as changes in heat and cold stress events (e.g., Matzarakis and Nastos 2010, Basarin et al 2015). Taken altogether, significant achievements have been made in understanding the impacts of large-scale climate change on OTC.
In addition to the large-scale climate background, ground-surface meteorological factors are also modulated by local land-surface properties (Green et al 2017, Bonan and Doney 2018). Land surfaces can affect the weather and climate through biogeochemical and biogeophysical processes that alter the chemical composition of the atmosphere, surface roughness and albedo, and partitions between latent and sensible heat fluxes (Feddema et al 2005, Pielke 2005, Bonan 2008, Bonan and Doney 2018). As an important type of land-surface cover, green vegetation has been extensively reported to play crucial roles in these processes and, consequently, in surface-level meteorology (Ge et al 2013, Zhang et al 2013, Green et al 2017, Piao et al 2019). However, few studies have focused on the regulation of green vegetation dynamics in the OTC. We thus know little about the contributions of substantial vegetation restoration/degradation to OTC.
In 1999, a major vegetation restoration program called the Grain for Green Program (GGP) was implemented in China, and the Loess Plateau has been a hotspot area for this program (Li et al 2017). The satellite-based normalized difference vegetation index (NDVI) increased by 6.4 times compared to its previous value according to the AVHRR dataset and by 8.3 times compared to its previous value according to the MODIS dataset during the first two decades of the 21st century (Li et al 2016). Vegetation restoration has improved the soil structure and thus protects the soil from erosion (Zuazo and Pleguezuelo 2008, Ran et al 2013). Due to the GGP, runoff and soil erosion may decrease by 18% and 45.4%, respectively, from 1998–2002 to 2003–2007 (Deng et al 2012).
It has also been extensively reported that the local climate over the Loess Plateau has been significantly modulated by GGP-induced vegetation restoration (Xu 2008, Fan et al 2015a, 2015b, Cao et al 2019). Overall, existing studies (e.g, Xu 2008, Fan et al 2015b, Cao et al 2019, Ge et al 2020) indicate that vegetation restoration may exert cooling and wetting effects on the local climate. Following the idea of thermal comfort, we can speculate that the cooling and wetting effects may more or less modulate the OTC; however, essential evidence supporting or denying these speculations has been infrequently presented by previous studies. Hence, it remains unclear whether vegetation restoration significantly modulates the OTC over the Loess Plateau.
This study therefore utilizes the Loess Plateau, where substantial vegetation restoration has occurred, as the study area and aims to detect the contributions of vegetation restoration to the local OTC. First, the spatiotemporal patterns of changes in the OTC and ground-level meteorological factors from 1982 to 2015 were depicted. Second, the potential roles of large-scale climate conditions and vegetation restoration on the variations in these meteorological factors were studied, particularly to highlight the modulation of OTC by vegetation restoration. Finally, climate modeling was carried out with the Weather Research and Forecasting (WRF) model to examine the underlying mechanisms by which vegetation restoration modulates the OTC.
2. Data and methods
2.1. Data
This study used five categories of datasets. The first dataset is the satellite-based NDVI, which is used to denote green vegetation coverage; the second dataset consists of ground station–based meteorological measurements. The third dataset is a global temperature dataset, and the fourth is the universal thermal climate index (UTCI), which is based on ground-level station data and is used as an OTC metric. Finally, reanalysis data are used for lateral boundary forcing of the WRF model.
The NDVI is a vital radiometric measure of photosynthetically active radiation absorbed by the green leaves of vegetation canopies, and it therefore plays an important role in measuring the surface greenness level of a region. This study used third-generation NDVI data provided by the Global Inventory Monitoring and Modeling System (GIMMS) project (hereafter, GIMMS-NDVI3g). The spatial resolution of the NDVI data is 8 km × 8 km, the temporal interval is 15 days, and the dataset covers the period from July 1981 to December 2015. A maximum value composite method was applied to reduce the atmospheric influence from clouds and aerosols; meanwhile, calibration loss, orbital drift, and volcanic eruptions were also corrected in the data (Pinzon and Tucker 2014). GIMMS-NDVI3g is considered to be one of the best datasets for long-term NDVI analysis, and it has been widely used to study long-term vegetation changes, including the effects of vegetation restoration (Jiang et al 2013, Onojeghuo et al 2018, Piao et al 2019).
The ground station–based daily meteorological data consisted of air temperature, relative humidity, wind speed, and surface air pressure. Then, using these measured data, we also calculated the specific humidity through equation (1). This dataset was provided by the China Meteorological Administration and covers the same time span as the GIMMS-NDVI3g dataset does. From this dataset, we selected 39 stations that were located within the Loess Plateau and had no missing values from 1982 to 2015 (figure 1):

where Q is the specific humidity (g·kg−1), p is the pressure (Pa), T is the temperature (K), and T0 is the reference temperature (typically 273.15 K).
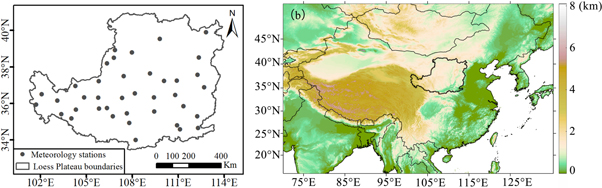
Figure 1. (a) Spatial distribution of the 39 meteorological stations within the Loess Plateau and (b) the domain of the WRF simulation within the Loess Plateau (black polygon).
Download figure:
Standard image High-resolution imageThe HadCRUT4 global temperature dataset provides gridded temperature anomalies worldwide as well as averages for each hemisphere and for the world overall. The dataset was developed by the Climatic Research Unit (University of East Anglia) in conjunction with the Hadley Centre (UK Met Office) but apart from the sea surface temperature dataset, which was developed solely by the Hadley Centre. The spatial resolution of the HadCRUT4 dataset is 5°, the temporal interval is one month, and the dataset covers the period from 1850 to present day.
The UTCI is defined as the equivalent temperature that enables the same physiological response of the human body as under standard environmental conditions (Fiala et al 2011). The UTCI provides a much better indication of biothermal conditions for human beings under specific climates, weather conditions, and locations than do other indices, such as the effective temperature, physiological equivalent temperature, or standard effective temperature (Błażejczyk et al 2011, Jendritzky et al 2011). The UTCI is a combination of the air temperature, humidity, wind speed, and solar radiation and reflects the air temperature of a reference environment that would lead to a similar physiological response. According to the definition of the UTCI, higher temperatures and humidity levels alongside lower wind speeds are favorable for a high UTCI (Bröde et al 2011). This study used the UTCI data calculated using BioKlima 2.6 by Kong (2017). Over the Loess Plateau, the UTCI from May to September is in the interval of heat stress (Kong 2017), which indicates higher temperatures and humidity levels; thus, a higher UTCI denotes stronger heat stress and is more uncomfortable.
The NCEP/DOE Reanalysis II dataset includes multiple meteorological variables, such as temperature, relative humidity, wind, and geopotential height. The spatial resolution of this dataset is T62 Gaussian grids with 28 vertical sigma levels, and its temporal interval is 6 h.
2.2. Observational data analysis
This study focuses on the Loess Plateau, mainly covering the domain of 32°N–42°N, 100°E–115°E in the central region of China (figure 1). The Loess Plateau occupies an area of approximately 624,641 km2 and accounts for approximately 7% of China's total area (Wang 2017). The plateau slopes from northwest to southeast, and its elevation ranges between 1,250 and 2,000 m above sea level. The region has a semi-arid climate that is heavily influenced by the Asian monsoon. The regional annual temperature is in the range of 3.6 °C–14.3 °C, and the annual precipitation is in the range of 150–750 mm. The dominant vegetation cover is grass and shrubs, and sparse vegetation exists over extensive areas of the northwestern Loess Plateau.
First, we analyzed the variations in the regional mean warm season (May to September) UTCI, surface air temperature, relative humidity, specific humidity, wind speed, and NDVI from 1982 to 2015. The research period of 1982 to 2015 was mainly limited by the extent of the GIMMS-NDVI3g dataset. The impacts of related meteorological variables on the UTCI were examined by comparing their temporal variations. Because temperature plays a dominant role in UTCI changes, we examined the potential effects of large-scale climate changes on regional temperature through a correlation analysis.
Second, to highlight the potential impacts of vegetation restoration on the UTCI variations, stations in areas with different levels of vegetation restoration were selected to study the contrasts of their differences in the changes in the UTCI and meteorological factors. Five stations with the highest and lowest NDVI slopes from 1982 to 2015 were selected. The first five stations were in regions with the greatest degrees of vegetation restoration, while the second five stations were in regions with the weakest amount of vegetation restoration. We compared the two groups' changes in UTCI and meteorological factors from 1982 to 2015.
We also examined the correlations between the changes in the UTCI and meteorological factors for all 39 stations. Because the changes in all series were generally characterized by a trend shift around 1999 (figure 2), this trend shift was used as the metric of their changes. A piecewise linear regression was applied to fit the slopes, with the turning point at 1999, and the differences in the slopes between 1982–1999 and 1999–2015 were used to quantify the trend shift. Windows of 3 × 3 pixels were defined and centered on the meteorological stations, and the mean NDVI of each window was calculated to represent the site's NDVI for comparison with the site's meteorological measurements.
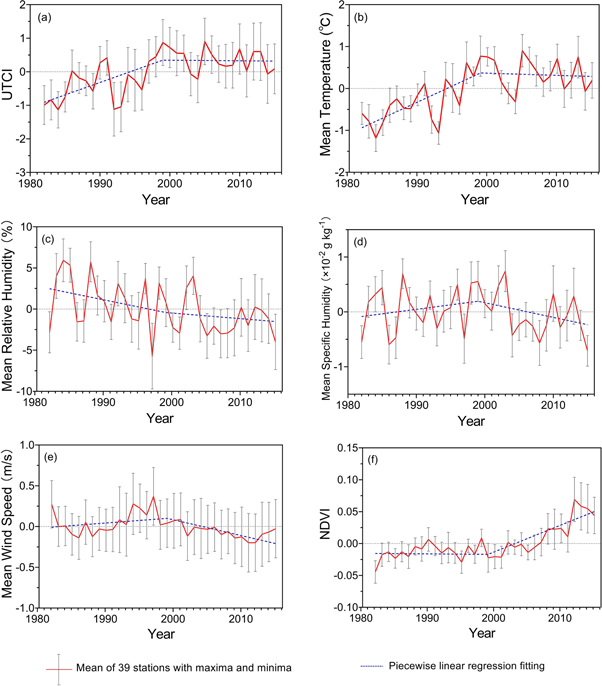
Figure 2. (a) The regional mean anomaly (referring to 1982–2015) of the warm season (May–September) UTCI, (b) mean temperature, (c) mean relative humidity, (d) mean specific humidity, (e) mean wind speed, and (f) NDVI from 39 meteorological stations over the Loess Plateau from 1982 to 2015.
Download figure:
Standard image High-resolution image2.3. WRF modeling
To diagnose the underlying mechanisms through which vegetation restoration has modulated the surface meteorology and, hence, the UTCI, climate modeling was carried out with the WRF model. The Noah Land Surface Model (Noah LSM) was applied to simulate the water and energy fluxes at the land surface–atmosphere interface. The WRF-Noah model has been widely used in regional climate change research (Leung et al 2006, Leung and Qian 2009, Chotamonsak et al 2011, Barlage et al 2015) and in land surface–atmosphere interaction simulations (Holt et al 2006, Zhang et al 2008, Chen and Zhang 2009, Lin and Cheng 2016).
In the Noah LSM, the vegetation canopy is parameterized by the green vegetation fraction (GVF), leaf area index (LAI), snow-free albedo (ALB), and emissivity coefficients (EMS) (Chen and Dudhia 2001). The GVF is the fractional green vegetation cover in a grid cell, which determines the land area that is directly exposed to the atmosphere and the precipitation intercepted by the canopy. Thus, the GVF may deeply regulate both the topsoil layer evaporation and canopy evaporation. The LAI is the one-sided green leaf area per unit ground-surface area, which determines the canopy surface resistance and thus affects canopy transpiration. In the Noah LSM, the GVF at each time step, as well as the annual maximum and minimum GVF, were prescribed for each grid cell; the annual maximum and minimum LAI, ALB, and EMS were prescribed for one category of land use in the form of tabulated values. The GVF was estimated from GIMMS-NDVI3g data using the scaled NDVI method (Gutman and Ignatov 1998). The semi-monthly GVF was linearly interpolated to daily intervals and aggregated to the WRF model grids. The values of LAI and EMS for each time step were interpolated in direct proportion to GVF; the values of ALB were also interpolated, but in inverse proportion to the GVF.
We carried out two groups of simulations, both of which applied exactly the same settings, except with respect to the vegetation parameters GVF, LAI, ALB, and EMS. One group used the vegetation parameters for 2005, representing the pre-restored vegetation, and the other group used those for 2013, representing restored vegetation. Therefore, the differences between the two groups' simulations represent the effects of vegetation restoration. To eliminate the influence of the climatic background as much as possible, for each group, two simulations were carried out with the same underlying vegetation parameters but with different climate backgrounds: those of 2005 and 2013. The annual precipitation values were 400 mm and 500 mm, which were below and above the climatological mean of 460 mm, respectively, in 2005 and 2013. In total, we performed four simulations. Two simulations used the vegetation parameters for 2005, one with the lateral boundary of 2005 (hereafter, V05B05) and one with the lateral boundary of 2013 (hereafter, V05B13). The other two simulations used the vegetation parameters for 2013, one with the lateral boundary of 2005 (hereafter, V13B05) and one with the lateral boundary of 2013 (hereafter, V13B13). Each simulation started on April 1 and ended on September 30. April was used as the spin-up period, and the simulation results for April were discarded. Finally, V05B05 and V13B13 were used as control simulations for comparison with the ground measurements in 2005 and 2013, respectively, to evaluate the performance of the WRF model. The differences between V05B05 and V13B05 and between V13B13 and V05B13 represent the effects of vegetation restoration. To eliminate the influence of the climatic background, the mean of the differences was used.
The simulation domain, centered on 103°E, 35°N, covers the entire Loess Plateau (figure 1). There are a total of 164 grid cells (west to east) by 126 grid cells (south to north) at a grid size of 30 km × 30 km. The main physical parameterizations are the WSM 3-class microphysics scheme (Hong et al 2004), the Grell–Devenyi ensemble convective parameterization (Grell and Dévényi 2002), the Community Atmospheric Model (CAM3) radiation package (Collins et al 2004), the Yonsei University (YSU) planetary boundary layer scheme (Hong and Pan 1996), and the Noah land surface scheme (Chen and Dudhia 2001). The lateral boundary forcing data were derived from the NCEP/DOE Reanalysis II dataset and were updated every 6 h.
3. Results
3.1. Regional mean UTCI and climate variations from 1982 to 2015
Figure 2 shows that the UTCI variations from 1982 to 2015 were characterized in general by an increasing trend of 0.039 ± 0.017 a−1 (95% confidence level, same hereafter). Meanwhile, the surface air temperature exhibited an upward trend of 0.040 ± 0.016 °C a−1, the relative humidity and wind speed exhibited declining trends, and the specific humidity showed a very slight upward trend of 0.39 ± 1.39 × 10⁻² g·kg−1. It should be noted that the variations in all the series were characterized by trend shifts with turning points at approximately 1999. For the UTCI, there was a strong upward trend of 0.074 ± 0.054 a−1 from 1982 to 1999, which then changed to a declining trend of −0.002 ± 0.003 a−1 from 1999 to 2015. For the mean temperature, there was an upward trend of 0.077 ± 0.021 °C a−1 before 1999 and a declining trend of −0.005 ± 0.008 °C a−1 after 1999. These trend shifts match well with the global warming hiatus (Hartmann et al 2013). For the relative humidity, a declining trend of −0.170 ± 0.279%/a before 1999 shifted to a weak decline of −0.068 ± 0.112%/a thereafter. For the specific humidity, a slight upward trend of 0.222 ± 0.367 before 1999 was replaced by a slight decline of −1.10 ± 1.57 × 10⁻² g·kg−1 thereafter. For the mean wind speed, a weak upward trend of 0.006 ± 0.011 m·s−1·a−1 before 1999 shifted to a weak decline of −0.019 ± 0.008 m·s−1·a−1 thereafter.
These results show that the UTCI variations remained approximately in phase with the temperature (r = 0.93, p < 0.001, n = 34) and wind speed while being approximately inverse to the relative humidity. Following the definition of UTCI, the temperature and relative humidity positively contributed to the UTCI, while wind speed exerted a negative contribution to the UTCI (Bröde et al 2011). Taken together, the above results indicate that the temperature increase may have contributed substantially to the UTCI increase; the wind speed changes contributed negatively, but their contribution was small enough to conceal. From 1982 to 2015, the specific humidity maintained approximately no trend, while the relative humidity decreased due to large increases in temperature and, hence, in the saturated vapor pressure. The decreased relative humidity was unfavorable to an increase in UTCI. The potential decrease in UTCI caused by an increase in relative humidity was also concealed by an upward trend in the UTCI dominated by the temperature rise. Following the definition of UTCI, solar radiation is also a contributing factor, and it has been reported that changes in the incoming solar radiation at the surface were characterized by an oscillatory decline during the 1980s to 2010s (Xia 2010, Shen et al 2014). A decline in solar radiation may potentially lead to a decreased UTCI, in contrast to the aforementioned increasing UTCI trend.
Altogether, these findings indicate that the UTCI changes were primarily determined by temperature changes. Figure 3 shows that the regional temperature variations of the Loess Plateau were significantly correlated with major global temperature variations. The correlations for the five-year moving average time series were much stronger than those for the original annual time series. This illustration suggests that regional temperature changes remained in phase with the large-scale temperature changes. It has been reported that the Northern Hemisphere temperature changes since the 1980s have exhibited two phases: an upward trend of ∼0.2 °C/10-a during the 1980s to the 1990s and a very weak trend of ~0.05 °C/10-a from 1998 to 2012 (Hartmann et al 2013). The shift from a rapid increase to a weak trend is called the global warming hiatus, which may be caused by external forcing modulating the global radiation budget (Solomon et al 2011, Trenberth and Fasullo 2013) and by internal variability modifying the heat distribution of the Pacific, Atlantic, and Indian Oceans (Lean and Rind 2009, Kosaka and Xie 2013, Trenberth and Fasullo 2013, Schmidt et al 2014). These results suggest that the regional temperature trend shift from a rapid increase to a weak decline, with a turning point in 1999, may be a response to the global warming hiatus rather than a regionally unique phenomenon.
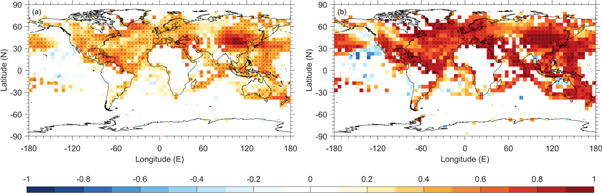
Figure 3. Correlation coefficient (a) between the regional mean temperature anomaly of the warm season (May–September) in the Loess Plateau and the global temperature from 1982 to 2015 and (b) between the five-year moving average regional mean temperature anomaly of the warm season (May–September) in the Loess Plateau and the global temperature from 1982 to 2015.
Download figure:
Standard image High-resolution image3.2. Relationships among UTCI, meteorological factors, and vegetation restoration
As mentioned in the introduction, regional climate conditions are not only modulated by global atmospheric processes but also by the underlying surface conditions. The most prominent change in land surface over the Loess Plateau after 1999 is characterized by active vegetation restoration under the GGP. Figure 2(f) shows that the NDVI increased significantly with the turning point in 1999, which aligns well with the GGP implementation. In detail, the NDVI declined slowly before 1999 but rose sharply with a trend of 0.004/a from 2000 to 2015. Such an upward trend of the GIMMS3g NDVI over the Loess Plateau was also confirmed by the MODIS NDVI data (Li et al 2016).
To understand the relationships between the UTCI and meteorological factors with vegetation restoration, we present the site-to-site correlation between changes in the NDVI and meteorological factors. As mentioned above, the changes for these items were primarily characterized by a trend shift with a turning point around 1999. Hence, the slope differences (SDFs) between 1999–2015 and 1982–1999 were used to quantify the strength of the trend shift for each item.
Figures 4(a) and (b) show that the SDFs were mostly negative for the UTCI and positive for the NDVI, but with spatial variability. In the east-central part of the Loess Plateau, there were mostly larger negative SDFs for the UTCI and larger positive SDFs for the NDVI than in the western part. Point-to-point, a negative correlation (r = −0.27, p < 0.1, n = 39) existed between the UTCI SDF and NDVI SDF (figure 4(c)). This correlation suggests that a greater (weaker) trend shift occurred at the greater (lesser) rates of vegetation restoration sites. The UTCI upward trend slowed more (less) after 1999 in the stations with greater (lesser) rates of vegetation restoration.
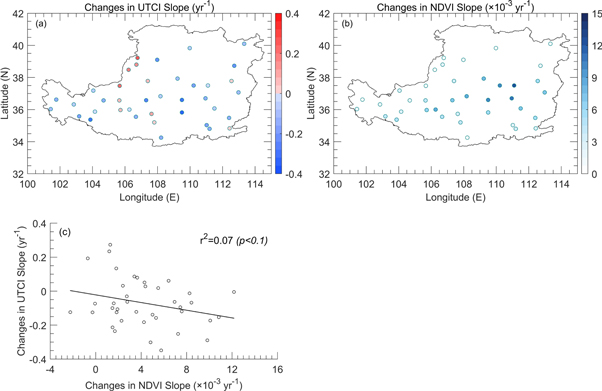
Figure 4. Station-based slope changes (the slope of 1999–2015 minus the slope of 1982–1999) of the (a) UTCI and (b) NDVI of 39 sites on the Loess Plateau and (c) their correlations.
Download figure:
Standard image High-resolution imageThere is also large spatial variability in the SDFs of temperature, specific humidity, relative humidity, and wind speed (figures 5(a)–(d)), for which there are also point-to-point correlations with the NDVI SDF (figures 5(e)–(h)). A negative correlation exists for the temperature SDF (r = −0.49, p < 0.01), and positive correlations exist for the SDFs of specific humidity, relative humidity (r = 0.49, p < 0.01), and mean wind speed (r = 0.14, p > 0.1). These correlations suggest that the increasing temperature trend slowed more (less), the declining trend of relative humidity slowed more (less), and the upward trend of specific humidity slowed less (more) after 1999 in the greater (weaker) vegetation restoration stations. Note that the correlation for the wind speed SDF did not pass a significance test at a level of 0.1.

Figure 5. Station-based slope changes (the slope of 1999–2015 minus the slope of 1982–1999) in the (a) daily mean temperature (Tmean), (b) daily mean relative humidity (RHmean), (c) daily mean specific humidity (SHmean), and (d) daily mean wind speed (WSmean) of 39 sites on the Loess Plateau from 1982 to 2015 and (e), (f), (g), (h) their correlations against slope changes of the NDVI.
Download figure:
Standard image High-resolution imageThese findings from the point-to-point correlations indicate that it was cooler and moister with a lower UTCI after 1999 at the stations with higher rate of vegetation restoration. This outcome is consistent with existing results that indicate that the greening surface may exert cooling and wetting effects on surface air (Wu et al 2011, Fan et al 2015a, 2015b, Cao et al 2019). Furthermore, this result suggests that these vegetation changes on surface air may also impact the UTCI. Because a cooling climate may favor a lower UTCI, while a moister climate may favor a higher UTCI, the lower UTCI at the stations with greater vegetation restoration may indicate a predominantly cooling climate.
3.3. Simulated climatic effects of vegetation restoration
To understand the mechanism through which the cooling and wetting effects of the vegetation restoration occur, we carried out regional climate modeling experiments with the WRF model, in which vegetation changes were implemented. Figure 6 shows that the WRF simulations mostly reproduced the spatial variability of the air temperature at 2 m above the ground. Both the WRF simulations and ground measurements consistently exhibited high-low-high temperature variations from the southeast to the northwest. There were significant correlations, with r = 0.95 (p < 0.001) for the mean of 2005 and 2013; 0.92 (p < 0.001) for 2005, i.e., V05B05; and 0.91 (p < 0.001) for 2013, i.e., V13B13. It should be noted that biases exist between the simulations and ground measurements. These biases are mainly cooling biases, in particular in the central-eastern and southwestern parts of the region, with a root mean square error (RMSE) of 1.7 °C for the means of 2005 and 2013. It is difficult to track the origin of the modeling bias; herein, the cooling bias may be related to overestimated precipitation, which is, in part, related to the microphysical and convective parameterizations.
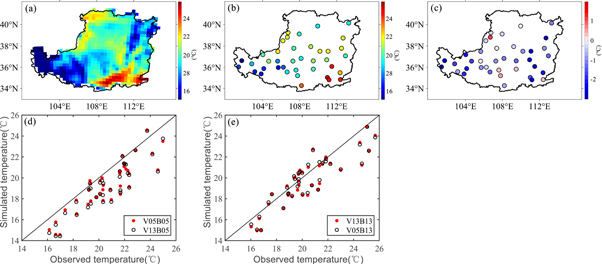
Figure 6. (a) Air temperature at 2 m above the ground from meteorological station–based measurements, (b) the mean of V05B05 and V13B13, (c) their differences (simulations minus measurements), and (d)–(e) the station-to-station values from one simulation against ground measurements for 2005 and 2013, respectively.
Download figure:
Standard image High-resolution imageNotably, the use of realistic underlying vegetation parameters may partly improve the performance of WRF simulations (figure 6). For 2005, the RMSE of the simulated temperature from V05B05 (with the vegetation parameters for 2005) was 1.98 °C, while it was 2.07 °C from V13B05 (with the vegetation parameters for 2013). For 2013, the RMSE of the simulated temperature remained approximately the same for V05B13 and V13B13 (with the vegetation parameters for 2005 and 2013, respectively); however, the spatial variability from V13B13 appears to be better matched with ground measurements than that from V05B13. Moreover, when vegetation restoration is included, the RMSE of the simulated temperature from V05B05 to V13B13 declines by 0.97 °C. However, the RMSE increases to 1.04 °C when using stationary vegetation for 2005, i.e., V05B05 minus V05B13, and to 1.09 °C when using stationary vegetation for 2013, i.e., V13B05 minus V13B13.
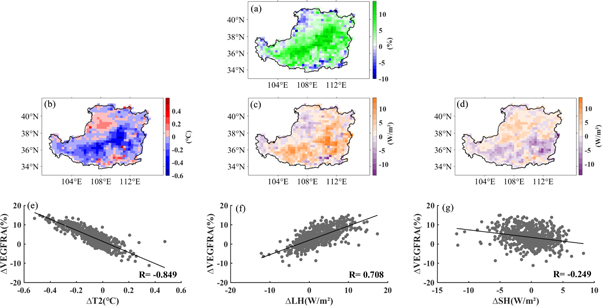
The aforementioned WRF modeling improvements due to the inclusion of vegetation restoration are derived from its cooling effects. Figures 7(a) and (b) show that distinct cooling occurred over the vegetation restoration area, with a maximum cooling of approximately −0.5 °C. A weak warming of approximately 0.2 °C occurred over the areas where there was slight vegetation degradation, such as the northwestern and southeastern corners of the region. Point-to-point, there was a significant negative correlation (r = −0.85, p < 0.001) between the GVF and temperature changes. The temperature declined by 0.36 °C per 10% increase in the GVF.
Figure 7. (a) Green vegetation fraction (VEGFRA) changes due to vegetation restoration over the Loess Plateau, the differences in (b) air temperature at 2 m above the ground (T2), (c) latent heat flux (LH), and (d) sensible heat flux (SH) between pre-restoration simulations, i.e., the mean of V05B05 and V05B13, and post-restoration simulations, i.e., the mean of V13B05 and V13B13, and (e)–(g) the grid-to-grid correlations of the meteorological factor differences against the GVF changes.
Download figure:
Standard image High-resolution image
The cooling effect of the vegetation restoration resulted from changes in the partitioning of the surface energy between latent and sensible heat. Figure 7(c) shows that vegetation restoration led to an intensified latent heat flux, with a maximum of approximately 15 W m−2; meanwhile, over the area of slightly degraded vegetation, the latent heat flux declined, with a maximum of approximately −10 W m−2. Point-to-point, a significant positive correlation (r = 0.71, p < 0.001) existed between the GVF and latent heat flux changes. The latent heat flux increased by 13.3 W m−2 per 10% increase in the GVF. Meanwhile, the sensible heat flux decreased with an increasing GVF. The point-to-point correlation was r = −0.25 (p < 0.001), and the corresponding slope of the sensible heat flux to the GVF was approximately −24 W m−2 per 10% increase in the GVF.
These findings suggest that vegetation restoration leads to more latent heat by intensifying transpiration and, conversely, leads to less sensible heat. As a result, the heat available to warm the surface air is reduced and cooling effect would thereby occur. Meanwhile, intensified transpiration leads to more water vapor in the air and, hence, larger atmospheric heat capacity, which is unfavorable for air temperature increase.
4. Discussion
The above results show that the variations in the UTCI from 1982 to 2015 underwent a trend shift from a rapid increase to a slight decline, with a turning point of 1999. Such a trend shift in the UTCI was dominantly derived from temperature variations, which matched well with Northern Hemisphere temperature changes, and was mainly characterized by the climate warming hiatus since the late 1990s. From the perspective of the spatial variability of the trend shift intensity, the more (less) intense trend shift of the UTCI and temperature generally occurred at the stations characterized by greater (weaker) increase in vegetation cover. The measured data–based analysis suggests that greater vegetation restoration may exert cooling and wetting effects on the surface air. The WRF model–based simulations confirm the cooling and wetting effects and, furthermore, show that these effects are derived from less sensible heat and more latent heat induced by intensified evapotranspiration due to vegetation restoration.
Taken together, these results indicate that both large-scale climate temperature changes and local vegetation restoration have left footprints on the UTCI over the Loess Plateau. Figure 5(a) shows that the trend shift of temperature could be detected at the least rates of vegetation restoration stations, where the local forcing of surface greening is very slight. This indicates that the trend shift of the temperature and UTCI from a rapid increase to a slight decline may be primarily derived from the large-scale climate warming hiatus rather than local vegetation restoration. However, this highlighted that the local forcing of vegetation restoration accelerated the trend shift.
We found that the intensity of the temperature trend shift at the stations with higher rates of vegetation restoration was much larger than that at the stations with weaker vegetation restoration. Following the fitting line in figure 5(c), the temperature SDF was about −0.05 °C a−1 at the lesser rates of vegetation restoration sites, while it reached as low as −0.15 °C a−1 at the greater rates of vegetation restoration sites, with an NDVI SDF of 0.012/a. Hence, this finding suggests that accelerations induced by vegetation restoration may be larger than those induced by the large-scale forcing at the stations with the highest rates of vegetation restoration. The UTCI SDF exhibited large variability at the stations with weaker vegetation restoration, but the mean SDF was weakly negative; however, the mean UTCI SDF reached as low as −0.15/a at the stations with greater vegetation restoration.
The cooling and wetting effects of vegetation restoration have opposing effects on the UTCI. This study suggests that the cooling effect was dominant, while the wetting effect was minor. This finding differs from that of Kang and Eltahir (2018), who noted that the wetting effects due to increased evapotranspiration were dominant, while the cooling effect was minor. The main reason for this difference may be that Kang and Eltahir (2018) based their research on a scenario with ample irrigation, which provides much more water vapor to the air than does the limited transpiration from natural vegetation growth. This increased water vapor may directly lead to higher thermal pressures and lower comfort levels, and water vapor also acts as a greenhouse gas, leading to a nighttime warming effect that offsets the cooling effect that occurs in the daytime.
5. Conclusion
This study found that the UTCI underwent a trend shift from a rapid increase to a weak decline during 1982–2015, with a turning point of 1999. Such a trend shift was dominantly derived from large-scale temperature trend shifts, namely a climate warming hiatus. It is notable that the trend shift was accelerated by vegetation restoration. In particular, at the greatest vegetation restoration stations, the acceleration of the trend shift may be stronger than that derived from the large-scale temperature trend shift.
This study provides evidence supporting the modulation of vegetation restoration on the local UTCI. Vegetation restoration may intensify evapotranspiration, i.e., latent heat, and reduce sensible heat over the Loess Plateau; this leads to a cooling effect that mitigates the thermal pressure. Therefore, as a complement to the existing knowledge that the local UTCI is highly relevant to the large-scale climate, this study highlights that human-driven substantial vegetation restoration/degradation may also play a crucial role in the local UTCI. This also suggests that future predictions of thermal comfort under climate change scenarios may have some uncertainties (Lin et al 2010, Chow et al 2016) due to a lack of knowledge about future vegetation.
In the future, the dynamics linking the local temperature changes and large-scale temperature are worth examining. The atmospheric dynamics are complex and beyond the scope of this study and have therefore not been examined, but the spatial pattern of correlations may be helpful for examining this issue. Additionally, this study carried out two simulations under one vegetation scenario and adopted the mean value of the simulations to lessen the uncertainty of the WRF model as much as possible. Since this study focused on temperature, and the uncertainties of temperature simulations from the WRF are generally low (in particular, lower than that for precipitation simulations), the limited number of simulation may be sufficient to examine the effects of vegetation restoration on temperature. However, when focusing on precipitation, many more members of the simulation are needed.
Acknowledgments
This research was supported by the National Natural Science Foundation of China (41790424), the National Key Research and Development Program of China (No. 2019YFA0606600), and the Key Program from CAS (ZDRW-ZS-2017-4 and QYZDBSSW-DQC005).
Data availability statement
The data that support the findings of this study are available upon reasonable request from the authors.