

Abstract
To achieve the safe operation of power system and prevent cascading failures, a vulnerability assessment method of power system is proposed based on the state correlation of branch fault. Firstly, a weighted correlation network based on the branch potential energy is established by using the state transition relationship of the two-level cascading failures. Secondly, the vulnerability assessment model of power system is constructed by applying the Theil entropy theory into the weighted correlation network. Finally, the simulation results on IEEE_39 bus system and an actual power system show that the model can not only evaluate the vulnerability of power system effectively but also find the vulnerable branches in power network more accurately.
Export citation and abstract BibTeX RIS
1. Introduction
The power system is one of the most important infrastructure network, and the large-scale blackouts of the power system will affect people's daily life and social order seriously. For example, in August 2017, a blackout caused by the failure of six units in Taiwan's Dadan power plant affected 17 cities and 592 users [1]. Besides, a regional blackout happened in British Columbia, Canada affects 34, 500 customers and damaged the equipment of major customers. The incident caused the islanding of seven power stations, and the shedding of 663 MW of generation. One of the subject lines experienced a double line-to-ground fault, and the other two lines experienced single line-to-ground faults [2]. These accident processes show that there exist some key lines whose failures will cause the accident spread wantonly. Therefore, it is of great significance to identify the key lines accurately and quickly for the safe operation of the power system and the better prevention of Cascading failures [3].
The power system vulnerability refers to the hidden dangerous state of the large-area power failure in the power system. This kind of hidden dangerous state will be revealed when the system fails due to the human intervention, internal fault, protection and control system and other factors. Generally, the power system vulnerability assessment can be divided into the structural and the state vulnerability [4, 5]. In the structural vulnerability, the structural importance of the power grid is studied by using the topological statistical characteristics of power networks. The research methods include the complex network theory [6, 7], critical cut set theory [8] and the artificial intelligence methods [9, 10], etc. In [10], based on the complex network theory, the active power of the transmission line was selected to define the line efficiency weight. By calculating the overall efficiency of the system which is composed of the efficiency of each line, the vulnerability evaluation index was established. However, using only the active power to establish the vulnerability assessment index can't fully reflect the state characteristics of the power system. So in order to analyze the vulnerability of the power system in real time, [11] proposed an enhanced potential state algorithm based on the relaxation theory to judge whether the saturated cut sets are generated or not after the system failure. In [12], a parallel fault evolution model (PFEM) was proposed to accelerate the fault evolution process of the power system, and reinforcement learning technology was used to identify the vulnerability of power grid. State vulnerability is mainly used to evaluate the risk level of the power grid by element operation status under a certain operation mode. The related methods include the energy function method [13, 14], sensitivity method [15] and the risk theory based on probability [16, 17], etc. Reference [18] investigated a research method of the state vulnerability of a power supply node in power grid. The actual short circuit capacity demanded was compared with the short circuit capacity provided by the power supply node on the investigation to evaluate the state vulnerability. Reference [19] evaluated the topological structural vulnerability of transmission lines and the vulnerability of power flow transmission. Moreover, a risk evaluation metric was presented by using an enhanced risky exponential utility function to quantify influences on the power grid after the trip of vulnerable lines. In [20], based on the real-time operation state of the node, the state vulnerability evaluation index was established by using the energy function model. Besides, considering the network parameters of the nodes, the structural vulnerability evaluation index was established. Combining with the state and structural characteristics of the system, the comprehensive vulnerability evaluation index was proposed. However, it is ignored that the fault spreads continuously in the grid.
In order to reflect the coupling relationship of lines in the power grid, [21] used the N-1 level fault to represent the correlations of transmission lines in the active power transmission, and then constructed the correlation network. Though the first level fault was considered, the evolution of blackouts in the form of cascading failures was ignored. In fact, there will be multi-level faults in the power grid in most cases. Therefore, [22] proposed to establish a correlation network considering the two-level cascading failures, and transform the power network constrained by Kirchhoff's law into a complex network. So, the branch vulnerability assessment was transformed into a node vulnerability assessment which is easier to handle. However, the above-mentioned literatures only consider the active power in many state characteristics of the grid, ignoring the reactive power transmitted by the grid branches and the state of the node voltage.
In view of these, we construct a state transition network according to the change of the energy function before and after the branch fault. Moreover, a vulnerability assessment method is proposed based on the Theil entropy theory. The main contributions of this paper are listed as follows:
- (1)By mapping the original topological structure of the power grid into a complex network, the branches in the power grid correspond to the nodes in the complex network, and the correlation between the branches in the power grid corresponds to the edges of the complex network. After the two-level cascading failures occur in the system, the potential energy accumulation of the remaining branches of the system is given to the unweighted complex network as the edge weight, and a two-level state transition network is generated.
- (2)The theory of the Theil entropy is introduced into the vulnerability assessment of power system to characterize the degree of disorder and unbalance of the system. By applying the Theil entropy theory into the state transition network, the comprehensive Theil entropy model on branch potential energy for branch vulnerability assessment is constructed.
- (3)The simulations of the IEEE-39 bus system and an actual power system shows that the proposed model can evaluate the vulnerability of power system effectively and find the vulnerable branches in power network more accurately.
The remainder of the paper is organized as follows. Section II points out the main research idea and motivation of this paper. Section III constructs the process of the power system vulnerability assessment and the relevant indicators to evaluate the effectiveness of the vulnerability assessment model. Section IV studies the IEEE-39 bus system and an actual power system, and some results are analyzed and discussed in detail. Finally, some conclusions are drawn in section V.
2. Method
2.1. Motivation
Reference [21] ignored the fault propagation of the power grid in the construction process of correlation networks. Reference [22] only considers the change of the active power after the branch fault in the calculation of the correlation network weight, which ignores the reactive power transmitted in the power grid and node voltage state. A large number of branch potential energy will be produced and distributed on each branch when a major disturbance happened in power system. And the system stability can be reflected by the distribution of the branch potential energy in the network. The branch potential energy is composed of two parts corresponding to the active and reactive power transmitted on the branches [23].
By integrating the branch voltage difference and phase angle difference, a branch energy function model can be established [24], and the expression is given as follows:

where i and j are the node numbers of branch m. Eij
is the branch energy function of branch m(i-j),


 and
and  represent the initial state values of the phase angle difference
  voltage difference
  active power
  and reactive power
 of branch m(i-j). is the conductance of branch m(i-j).
  is the susceptance of branch m(i-j).
  and
and  are the voltage amplitudes of node i and node j respectively.
  and
and  are the cosine and sine values of branch phase angle.
Due to the absorption of the branch potential energy, the global energy distribution becomes unbalanced, which results in the vulnerability of the branch and power grid. The greater the impact of branch potential energy is, the worse the stability of the system and the higher the vulnerability is [25]. The branch potential energy is mainly affected by the complex power on the branch. The active power transmitted by the branch is mainly determined by the voltage phase angle difference between the branch nodes, while the reactive power mainly depends on the voltage amplitude difference between the branch nodes. When the system is attacked, the system state will transit from the initial state to the fault state. The transmission power of the branch will change, which will result in the accumulation of the branch potential energy. The uneven distribution of branch potential energy in the network leads to different vulnerability of each branch. The higher the branch potential energy is, the higher the vulnerability is. The branch potential energy can represent the state characteristics of the power system, so the branch potential energy can be used as the weight of the state transition network to reflect the power grid state comprehensively.
2.2. State transition network
Based on the above analysis, the construction of the state transition correlation network based on the branch potential energy function is the primary work to evaluate the vulnerability of the power grid. To construct the state transition correlation network, each branch is taken as an initial fault. Moreover, the correlation between branches is analyzed based on the branch potential energy. Finally, a weighted state transition correlation network is established which takes the branch potential energy variation as the weight. The specific process is shown in Algorithm 1.
| Algorithm1: Construction of the two-level state transition network | |
| 1 | Input grid parameters and calculate the power flow and capacity margin of each branch. |
| 2 | According to the rule of "power grid branch corresponds to the unweighted network node", map the null graph. |
| 3 | For I = 1: L (L is the number of grid branches) |
| 4 | Remove the branch  and calculate the state changes of the remaining branches in the power grid: active power variation and calculate the state changes of the remaining branches in the power grid: active power variation  reactive power variation reactive power variation  phase angle variation phase angle variation  and voltage amplitude variation and voltage amplitude variation 
|
| 5 | For j = 1: L |
| 6 | If the active power on branch j is overload |
| 7 | Continue to remove the branch j and recalculate the state changes of the remaining branches in the grid. |
| 8 | End if |
| 9 | End for |
| 10 | For j = 1: L |
| 11 | According to Formula (1), calculate the transient energy variation of branch j; |
| 12 | If the disconnection of branch i causes the potential energy change of branch j |
| Establish an edge between nodes i and j in the state correlation networks, and assign the variation of the branch potential energy to edge (i-j) as weights. | |
| End if | |
| 13 | End for |
| 14 | End for |
The branch potential energy comprehensively reflects the operation state changes in the power grid, and its distribution on the branches can reflect the ability to withstand the impact. Therefore, the proposed state transition network accords with the power transfer and coupling relationship between transmission lines in the actual operation of the power grid. Taking figure 1 as an example, the process of generating a two-level state transition network by power system mapping is illustrated. There are 9 branches in the system, so the two-level state transition network has 9 nodes. If there are interactions among the 9 nodes, bidirectional edges will be generated to represent their correlations. Edge weight△E1–2 represents the potential energy change of branch L2 after the disconnection of branch L1. It should be noted that the influence of the fault of the branch i on the potential energy of branch j is different from that of the fault of branch j on branch i. Therefore, the branches in the secondary state transition network are bidirectional and have two weights, that is, one direction corresponds to one weight.
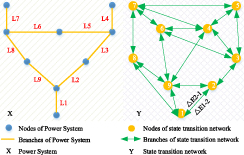
Figure 1. Schematic diagram of power system and the two-level state transition network.
Download figure:
Standard image High-resolution image2.3. Branch potential energy theil entropy method
According to the above analysis, the state transition network structure is a bidirectional weighted correlation complex network. In the correlation network, the out-degree of nodes reflects the influence of the node on the adjacent nodes and corresponds to the fault propagation characteristics of the branch. The higher the number of the out-degree of nodes is, the wider the influence range of the node is. And the larger the weight of the out-degree of nodes is, the greater the impact of the node on the corresponding node is. Therefore, this paper only studies the vulnerability of power system under the influence of the out-degree in the correlation network. Considering that the connectivity of a node is an important criterion to measure its criticality, we need to establish the connectivity index of the correlation network. This index can comprehensively reflect the total connectivity strength of nodes and their distribution in the related edges. Therefore, this paper constructs a branch potential energy entropy index based on the Theil entropy theory, which is shown in Formula (2).

where  is the branch potential energy entropy degree after the interruption of node u.
  is the weight of the node u.
  is the Theil entropy of the node u in the correlation network, and u is the node number in the correlation network.
Theil entropy standard is an index to calculate the income inequality based on the information entropy, which is the difference between the maximum value of information entropy and the actual entropy [26]. It is shown in Formula (3).

where,  is the maximum information entropy when n uncertain events appear with the same probability. H (x) is the actual entropy of the system, and
  is the probability of the occurrence of the uncertain event i.
If the weight of edge  in state correlation network is defined as
  then the weight of node u is:

Where,  is the adjacent node of node
  in the state in correlation network.
  is the set of adjacent nodes of node
According to Formula (4), the connection probability  between node
  and node u in the correlation network is:

Combined with Formula (3) to (5), the entropy index of branch potential energy is obtained as follows:

where,  is the degree of the node u in the state correlation network.
According to Formula (6), the greater the branch potential energy entropy degree  is, the more unbalanced the distribution of branch potential energy is. The branch potential energy is mainly accumulated on some lines in the system, which is more likely to cause the branch overload and even cascading failures. On the contrary, the smaller the branch potential energy entropy is, the more balanced the distribution of the system potential energy is. The branch with large capacity bears more power flow impact, while the branch with small capacity bears smaller power flow impact, and the system is in a relatively balanced state. This index can effectively reflect the influence of the active power and reactive power on the branch potential energy, which is closer to the actual operation of the power system. The vulnerability of branches can be reflected by the branch potential energy entropy degree
3. Evaluation model of vulnerable branch base on theil entropy of branch potential energy
3.1. Verification indicator
The fault of a line can propagate through the network and trigger other failures, and even lead to a blackout. This propagation, also called the cascading failures, is well known as the mechanism of large blackouts [27]. In the traditional branch vulnerability studies, a branch is selectively removed and the changes of system performance are usually taken as the verification indicators, such as network efficiency, load loss rate under AC cascading failure model and the outage loss index VaR, CVaR, etc. In this paper, the AC cascading failure model [28] is borrowed to perform the static intentional attacks according to the transmission lines sequence, and the load loss rate of the system after the fault is calculated. Thus, the cascade process of one day is as follows. Select a line and attack (or remove) it as an initial fault of cascading failures, and then judge whether there exists the branch overload or not. If yes, continue to remove the overload branches until there is no branch overload, and then calculate the system load loss. Then the average load loss rate after the attack of each line after N days simulation is:

where,  represents the average load loss rate of the system after the attack of line i. Obviously, the larger
  is, the more vulnerable the branch is. The sequence of vulnerable lines derived from
  is called cascading failures simulation (CFS) sequencing [29].
In this paper, the AC cascading fault model is used in the static intentional attacks according to transmission lines sequence. Then the system load loss rate is calculated, and the branch potential energy entropy algorithm proposed in this paper is verified.
3.2. The process of vulnerability assessment
The traditional power flow entropy model only considers the power flow value, and ignores the difference of the ability of branches to withstand power flow impact. That's to say, the same power flow impact may cause the overload of small capacity branches, but a little impact on the large capacity branches. The branch potential energy Theil entropy method can be used to identify the importance of nodes in complex networks. Thus, this paper establishes a comprehensive vulnerability evaluation model of the branches based on the Theil entropy theory, in which the importance of the branch fault to the system is measured by the influence of the two-level cascading failures on the system. Considering the change and accumulation of the branch potential energy caused by the branch disconnection, the evaluation method is closer to the actual operation of power grid.
The specific model is shown in figure 2. Firstly, according to the corresponding principle of branches mapped as nodes and the correlation between branches mapped as edges, a null graph is generated. Secondly, according to the power flow data of the initial operation state of the system and the two-level cascading failures, the potential energy changes of the remaining branches caused by a branch fault are calculated. Then, the potential energy variation of the branch is given to the branches of the null graph as weights to generate a bidirectional two-level state transition network. Finally, the branch potential energy entropy degree (PEED) of the nodes in the state transition network is calculated by using the branch potential energy Theil entropy method, and the PEED order in the two-level state transition network is equivalent to the power system branch vulnerability order, and the power system vulnerability assessment is completed.

Figure 2. Vulnerable branch evaluation model based on the branch potential energy Theil entropy.
Download figure:
Standard image High-resolution image4. Simulation analysis
4.1. IEEE-39 bus system
In this paper, the effectiveness and correctness of the proposed branch vulnerability assessment model based on the branch potential energy Theil entropy is verified by the simulations of the standard IEEE-39 bus system. The structure of the IEEE-39 bus system is shown in figure 3. There are 39 nodes, 46 branches, 10 generators, 21 load nodes.
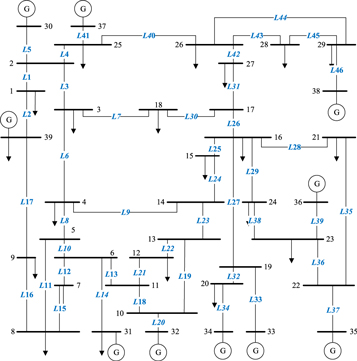
Figure 3. Structure diagram of the IEEE-39 bus system.
Download figure:
Standard image High-resolution imageIn this paper, the simulation days N are set to 10000 days in the AC cascading failures model (CFS). The effectiveness of the proposed method is verified by comparing the accuracy K/M identified by the first m branches between the proposed method and the CFS sequence. K is the number of the matched branches in the two sequences.
According to Formula (6), the first 17 vulnerable branches in the IEEE-39 bus system are shown in table 1. According to the analysis of figure 3, among the top 10 most vulnerable branches, branches 14, 37, 33, 20, 39, 46 and 34 (7 lines in total) are the only paths for generators 31, 35, 33, 32, 36, 38 and 34 to deliver power to the grid. Branch 27 is the only way for generators 33 and 34 to transmit power to the system, and its fault will cause serious shortage of the active power in the system, or even system disconnection. Branches 35 and 42 are located on the important transmission lines, whose disconnection will lead to a large-scale transfer of power flow so that the power flow equilibrium will be reduced. For example, the fault of branch 42 will lead to a power imbalance between node 26 and node 27, which may lead to a series of problems such as power angle instability. Therefore, from the perspective of the network structure and function, it can be found that the PEED method can identify the vulnerable branches of the system.
Table 1. Comparison of branch potential energy entropy and CFS sequence in the IEEE39 bus system.
| Rank | CFS | PEED |
|---|---|---|
| 1 | 46 | 14 |
| 2 | 38 | 20 |
| 3 | 35 | 27 |
| 4 | 14 | 33 |
| 5 | 28 | 37 |
| 6 | 20 | 34 |
| 7 | 37 | 39 |
| 8 | 18 | 42 |
| 9 | 39 | 46 |
| 10 | 32 a | 35 |
| 11 | 33 | 19 |
| 12 | 19 | 18 |
| 13 | 34 | 23 |
| 14 | 27 | 28 |
| 15 | 23 | 38 |
| 16 | 13 | 3 a |
| 17 | 42 | 13 |
| accuracy:16/17 | ||
Note:
a The branch with is inconsistent with CFS sequence.In order to further verify the identification effect of the proposed method, the CFS sequence is used as an index to be compared with the existing methods: the maximum flow method (MF) [30], the improved maximum flow method (IMF) [31], PageRank algorithm (PRA) [32] and Cascading index (CEI) [33]. Table 2 lists the comparison results of the first 12 vulnerable lines by the different methods. Firstly, although the methods have different perspectives on vulnerable branch evaluation, the overall distribution trend of the branch vulnerability obtained by this method is similar to those obtained by the above methods. Moreover, in the first 12 branches, there are 5 to 8 branches consistent with those got by other methods. It shows that this method can find out the vulnerable branches of the power system comprehensively and evaluate the vulnerability of power system branches more accurately. From the perspective of the comparison accuracy with the CFS sequence, the PEED sequence used in this paper has higher identification accuracy than other methods. It should be noted that if the first 10 lines are selected to be compared, the PEED still has better recognition effect and accuracy.
Table 2. Comparison of branch vulnerability identification results of different methods in the IEEE39 bus system.
| Rank | CFS | PEED | MF | IMF | PRA | CEI |
|---|---|---|---|---|---|---|
| 1 | 46 | 14 | 26 | 10 | 46 | 35 |
| 2 | 38 | 20 | 37 | 33 | 37 | 14 |
| 3 | 35 | 27 | 30 | 14 | 39 | 23 |
| 4 | 14 | 33 | 33 | 20 | 35 | 20 |
| 5 | 28 | 37 | 29 | 5 | 33 | 37 |
| 6 | 20 | 34 | 38 | 46 | 34 | 33 |
| 7 | 37 | 39 | 27 | 41 | 38 | 13 |
| 8 | 18 | 42 | 7 | 39 | 41 | 19 |
| 9 | 39 | 46 | 36 | 11 | 45 | 38 |
| 10 | 32 | 35 | 20 | 34 | 42 | 39 |
| 11 | 33 | 19 | 6 | 3 | 44 | 28 |
| 12 | 19 | 18 | 39 | 27 | 20 | 34 |
| accuracy | 6/10 | 3/10 | 4/10 | 5/10 | 6/10 | |
| 9/12 | 5/12 | 5/12 | 7/12 | 9/12 | ||
Figure 4. shows the comparison results of the potential energy entropy degrees of the nodes in the state transition network of the IEEE-39 node system, and that is, the comparison results in the power grid considering the two-level cascading failures. Table 3 shows the distributions of the fault branches and the number of the power system islands when the primary and secondary faults occur. In the process of two-level cascading failures simulations, there are 17 lines out of operation which will cause the exits of the rest of the lines from the system due to their overloads. Among the 17 most vulnerable lines identified by the branch PEED sequence, 16 lines are consistent with it, only branches 32 and 3 are exceptions. It can be seen from figure 4. that branch 32, which can induce the two-level cascading failures, ranks 18 in the entropy sequence of branch potential energy, and also belongs to the lines with high vulnerability. Although branch 3 can't induce the two-level cascading failures, it exits from the operation frequently due to an overload in the secondary fault, which indicates that branch 3 has a weak ability to resist the power flow impact. So the branch sequence induced by the N-2 cascading failures and identified by the branch potential energy entropy degree PEED sequence are consistent with each other, which shows the proposed method are effective.
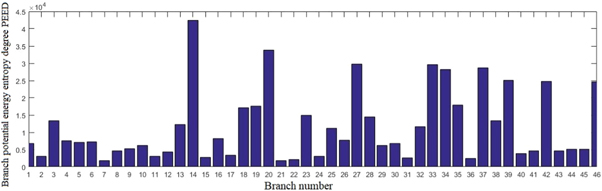
Figure 4. Comparison of branch potential energy entropy under two-level Cascading failures.
Download figure:
Standard image High-resolution imageTable 3. Exit operation branches under two-level cascading failures.
| PEED | Initial fault branch number | Secondary fault branch number | Number of islands |
|---|---|---|---|
| 14 | 13 | 9, 19, 23 | 2 |
| 20 | 14 | 3, 13 | 2 |
| 27 | 18 | 19 | 2 |
| 33 | 19 | 13, 18 | 2 |
| 37 | 20 | 3 | 2 |
| 34 | 23 | 13, 18 | 2 |
| 39 | 27 | 3 | 2 |
| 42 | 28 | 38, | 2 |
| 46 | 32* | 27 | 3 |
| 35 | 33 | 3 | 2 |
| 19 | 34 | 3 | 2 |
| 18 | 35 | 29, 26, 28 | 4 |
| 23 | 37 | 3 | 2 |
| 28 | 38 | 28, 35 | 3 |
| 38 | 39 | 3 | 2 |
| 3* | 42 | 3 | 1 |
| 13 | 46 | 3 | 2 |
4.2. Real-life regional power grid of China
This section takes a real-life regional power grid of China as an example for analysis. The regional power grid system has 32 nodes, 42 branches, 9 generators, 20 load nodes. For simplicity, it is called the NE power grid later, and figure 5. is the schematic diagram of the NE power system.
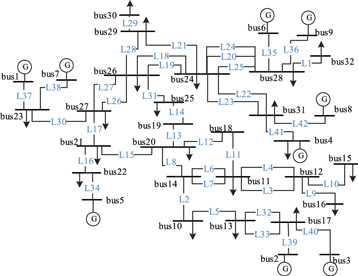
Figure 5. Structure diagram of NE power grid.
Download figure:
Standard image High-resolution imageTable 4 shows the comparison between the proposed method and the CFS sequence in the NE power grid. The simulation days in the AC cascading failures model are still set to 10000 days. In the first 15 vulnerable branches, 12 of them are consistent with the results in the verification index CFS sequence, and the accuracy is 80%. The three unidentified branches are Branch 1, branch 13 and branch 29 respectively. Branch 1 and branch 29 are the only paths for load node 32 (load 702MW) and load node 30 (load 250MW) to absorb power from the system respectively. Although the faults of these two branches will cause great losses of loads, the rest of the system will not be greatly impacted. Therefore, branch 1 and branch 29 rank higher in the CFS sequence considering the load loss, but lower in the PEED sequence considering the system state change.
Table 4. Comparison of branch potential energy entropy and CFS sequence in NE power grid.
| Rank | CFS | PEED |
|---|---|---|
| 1 | 1 | 5 |
| 2 | 29 | 35 |
| 3 | 36 | 36 |
| 4 | 35 | 30 |
| 5 | 5 | 39 |
| 6 | 30 | 40 |
| 7 | 15 | 2 |
| 8 | 39 | 16 a |
| 9 | 40 | 34 |
| 10 | 2 | 41 |
| 11 | 41 | 42 |
| 12 | 42 | 15 |
| 13 | 31 | 37 a |
| 14 | 34 | 38 a |
| 15 | 13 | 31 |
| Accuracy:12/15 | ||
Note:
a The branch with is inconsistent with CFS sequence.According to the PEED sequence, branches 35, 36, 39, 40, 34, 41, 42, 37 and 38 (9 branches in total) are the only paths for 9 generators 6, 9, 2, 3, 5, 4, 8, 1 and 7 to transmit power to the grid. Branch 5 is the only path for generators 2 and 3, load nodes 13 and 17 connected with the system. Branches 30, 2 and 16 play the same role with branch 5 in the system. Branch 30 is the only path for generators 1 and 7, load node 23 to connect with the system. Branch 2 is also the only path for generators 2 and 3, load nodes 10, 13 and 17 to connect with the system. Branch 16 is the only path for generator 5 and load node 22 to connect with the system. The above branch faults will cause serious shortage of the active power in the system, resulting in islands and great losses of loads. Branch 15 and branch 31 are the branches of the high voltage loop network of the system, which are located on the important transmission lines. Their faults will lead to a decrease of the system connectivity and a wide range transfer of power flows.
Due to the high voltage level of the NE power grid, most of the important branches are double circuit lines, and the short circuit capacity of the system is large, so the secondary fault of the remaining branches doesn't occur after the first level fault of the branches.
The results are compared with the other methods mentioned in section B. Taking the CFS sequence as index, table 5 shows the comparison of the identification results of the first 12 branches by different methods. It can be seen that compared with the other methods, the branch potential energy entropy method still has higher identification accuracy in the NE power grid. Select the first six lines from results by the above methods and remove them from the system in order. Once a line is removed, we calculate the proportion of the residual load to the total load for each line removed using the AC power flow model, that is, the residual load rate of system.
Table 5. Comparison of branch vulnerability identification results of different methods in the NE power grid system.
| Rank | CFS | PEED | MF | IMF | PRA | CEI |
|---|---|---|---|---|---|---|
| 1 | 1 | 5 | 18 | 32 | 5 | 32 |
| 2 | 29 | 35 | 19 | 33 | 40 | 33 |
| 3 | 36 | 36 | 20 | 35 | 39 | 1 |
| 4 | 35 | 30 | 24 | 22 | 30 | 2 |
| 5 | 5 | 39 | 25 | 23 | 15 | 3 |
| 6 | 30 | 40 | 22 | 5 | 34 | 4 |
| 7 | 15 | 2 | 23 | 1 | 35 | 5 |
| 8 | 39 | 16* | 31 | 30 | 42 | 6 |
| 9 | 40 | 34* | 35 | 41 | 41 | 7 |
| 10 | 2 | 41 | 36 | 42 | 31 | 8 |
| 11 | 41 | 42 | 30 | 21 | 36 | 9 |
| 12 | 42 | 15 | 21 | 39 | 2 | 10 |
| Accuracy | 7/10 | 2/10 | 4/10 | 6/10 | 2/10 | |
| 10/12 | 3/12 | 7/12 | 10/12 | 2/12 | ||
The residual load rate is shown in figure 6. According to the results of the PEED, the residual load of the system is less than 40% after attacking the six lines continuously, which can cause an extremely serious impact on the power grid. The simulation results show that compared with the other methods, this method is more sensitive to identifying vulnerable lines.

Figure 6. Residual load rate of the first six lines removed by different methods in NE power grid.
Download figure:
Standard image High-resolution image
4.3. Time complexity analysis of the algorithm
Table 6 shows the time consumed by the algorithm in this paper. In the two test networks in this paper, the time consumed by the branch potential energy entropy method is much less than that of CFS. If the server with better performance is used, the computing time will be shorter and the online application is expected to be realized.
Table 6. Comparison of computing time of different algorithms and networks.
| IEEE-39 bus system | NE power Grid | |
|---|---|---|
| PEED | 3.96 s | 3.62 s |
| CFS | 86265 s | 13362 s |
5. Conclusion
In this paper, a vulnerability assessment method of power system based on the branch potential energy entropy is proposed. According to the power grid topology and the potential energy accumulation of the remaining branches after the occurrence of the two-level cascading failures, a two-level state transition network is generated to comprehensively reflect the topological structure and state characteristics of the power grid, and the vulnerability assessment of power transmission lines is transformed into a better complex network node importance assessment. The Theil entropy standard is introduced into the vulnerability assessment of power system to characterize the disorder and imbalance of the system. The branch vulnerability can effectively reflect the impact of branch faults on the power grid and the ability of the branch to withstand the power grid impact. The simulation results of the IEEE-39 bus system and the real-life regional power grid show that the proposed method can accurately identify the vulnerable branches with higher fault frequency and the branches with the most serious load loss after the fault.
Acknowledgments
This work was supported in part by the General Project of Humanities and Social Sciences Research of the Ministry of Education (18YJCZH028, 20XJCZH004) and the Fundamental Research Funds for the Central Universities (A0920502052001-1), and Chengdu soft science research project (2020-RK00-00367-ZF).
Data availability statement
The data generated and/or analysed during the current study are not publicly available for legal/ethical reasons but are available from the corresponding author on reasonable request.