Rock Burst Evaluation Using the CRITIC Algorithm-Based Cloud Model
 Jiachuang Wang1
  Jiang Guo
- 1School of Resources and Safety Engineering, Central South University, Changsha, China
- 2Hongda Blasting Engineering Group, Co., Ltd., Guangzhou, China
Under high-stress conditions, rock burst disasters can significantly impact underground civil engineering construction. For underground metal mines, rock burst evaluations and prevention during mining have become major research topics, and the prediction and prevention of rock burst must be based on the study of rocks and rock burst tendencies. To further prevent the risk of geological disasters and provide timely warnings, a finite-interval cloud model based on the CRITIC algorithm is proposed in this paper to address the uncertainty of rock burst evaluation, the complexity under multi-factor interactions, and the correlations between factors, and it then realizes a preliminary qualitative judgment of rock burst disasters. This paper selects the uniaxial compressive strength σc (I1), ratio of the uniaxial compressive strength to the tensile strength σc/σt (brittleness coefficient, I2), elastic deformation energy index Wet (I3), ratio of the maximum tangential stress to the uniaxial compressive strength σθ /σc (stress coefficient, I4) of the rock, depth of the roadway H (I5), and integrity coefficient of the rock mass Kv (I6) as indicators for rock burst propensity predictions. The CRITIC algorithm is used to consider the relationships between the evaluation indicators, and it is combined with an improved cloud model to verify 20 groups of learning samples. The calculation results obtained by the prediction method are basically consistent with the actual situation. The validity of the model is tested, and then the model is applied to the Dongguashan Copper Mine in Tongling, Anhui Province, China, for rock burst evaluation.
Introduction
Rock burst is due to the impact of ground pressure on hard and brittle rock masses in high earth-stress states during the excavation of underground tunnels. Elastic strain energy is suddenly and rapidly released due to the stress concentration around the opening, and the dynamic instability of the energy leads to the sudden release of energy into the free space, thus destroying the equilibrium. This energy release is an earthquake induced by mining or tunnel excavation [1, 2]. As early as 1738, there were related reports of rock burst disasters [3]. Rock burst disasters are sudden and extremely destructive and will not only cause over-excavation, initiate support failure, and delay construction but may also cause earthquakes or destroy the entire tunnel or pit, thus causing casualties and serious economic losses. At the same time, rock burst disasters are often accompanied by the exfoliation and ejection of surrounding rock, the formation of a considerable amount of dust and the creation of air shock waves. Thus, these disasters can easily cause numerous casualties and determining a method of correctly predicting the risk of rock burst in underground engineering and geotechnical engineering practice has become a problem that must be solved.
Compared with other engineering fields, the occurrence of rock burst in underground metal mines is unique and mainly reflected in the following aspects: 1) Rock burst evaluation is an important basis for determining the risk level and safety of mines; 2) In other metal mine production research fields, such as underground caverns, rock slopes and dam foundation stability, rock burst is a relatively important criterion; 3) Reasonable rock burst evaluations can provide effective theoretical criteria for process selection, disaster prevention and control during construction, which provides strong theoretical support for mining safety protection measures, such as safety support and safety shielding implementation; and 4) Underground engineering rock burst evaluations provide data for underground engineering surveys, designs and safe construction and represent an important research topic in rock mechanics and geotechnical engineering.
In recent decades, many scholars have performed a number of analyses and research based on the formation mechanism of rock burst and proposed many well-known theoretical criteria, such as the Russenes criterion, the Hoek criterion, the energy criterion, and the stress criterion. In recent years, rock burst criteria based on engineering experience have emerged. The above discrimination methods are based on the study of rock burst mechanisms and have been combined with qualitative or quantitative analysis methods to determine the rock burst tendency and hazard level. In general, current rock burst evaluation methods can be classified into three categories: theoretical analysis methods, field measurement methods and statistical evaluation methods. The specific contents and differences are as follows.
Theoretical Analysis
Theoretical analysis can be used in the process of rock burst evaluation. This method is inexpensive and can better simulate the influence of various on-site factors. The theoretical analysis method is based on different theories of rock burst mechanism, and the resulting criteria are used to form different prediction methods, including the following methods. 1) Rock burst tendency judgment method [4–6]: This method is mainly used in the engineering geological exploration stage after drilling rock samples on site and for conducting rock mechanics tests, and one indicator or a set of indicators (elastic deformation index, impact energy index, dynamic damage time, etc.) are used to analyze the possibility of rock burst. 2) Strength theory method [7, 8]: Strength theory suggests that rock burst may occur when the tensile stress or compressive strength of rock reaches a certain ratio, and the prediction criteria used in this method include the Norwegian Russenes criterion [9], elastic energy reserve criterion, brittleness coefficient criterion, and tangential stress criterion. 3) Energy release rate (ERR) index method [10–12]: The ERR value is the ratio of the energy release caused by the excavated ore to the volume of the mined rock, and it comprehensively reflects the influence of the geometry, depth, original rock stress field and rock mechanical properties of the excavation on rock burst. 4) Numerical prediction methods [13, 14]: These methods include the finite element method and finite difference method.
On-Site Measurement Method
The on-site measurement method uses the necessary instruments to determine whether a rock explosion occurs by investigating and analyzing the mining site or testing the rock mass [15]. This approach mainly includes the following methods. 1) Drill cutting method [16]: This method is mainly used for drilling and sampling analysis of surrounding rock through the collection of dynamic response information, such as popping sounds, friction sounds and stuck drilling phenomena and auxiliary judgements. 2) Acoustic emission method [17]: This method is the most direct monitoring method for rock burst detection and most direct forecasting method, and the occurrence of rock burst is determined according to the shape and frequency spectrum of the acoustic emission signals emitted at different stages of rock deformation. 3) Electromagnetic radiation method [18–20]: This method can predict the possibility and development of rock burst. 4) Microgravity method: this method can predict rock burst early and over a wider prediction range, although its costs are higher than those of other methods.
Statistical Forecasting Methods
Uncertainty is the main feature of most engineering problems, mainly the randomness and ambiguity discussed in probability theory and fuzzy mathematics. Because of the randomness and complexity of the rock mass structure of underground mines, the severity, timing, form, and location of rock burst are uncertain. To resolve the uncertainty of the rock burst problem, domestic and foreign scholars have performed many studies on rock burst tendency predictions and proposed a variety of rock burst grading prediction methods [21–27]. For example, Zhou et al. [28] selected seven data parameters and 132 rock burst databases and combined multiple data models to carry out rock burst tendency prediction work. Xu [29] considered the basic theory of the ideal point method and selected several factors for the evaluation prediction index to construct a coupled ideal point prediction analysis model. Lu et al. [30] used the basic principles of Analytic Hierarchy Process and the entropy weight method to select prediction indexes from three aspects, namely, lithology conditions, stress conditions and surrounding rock conditions, to calculate the critical rock burst risk and the closeness of actual mine data. Wen et al. [31] proposed a rock burst propensity prediction model based on a support vector machine (SVM) with mixed particle swarm optimization (PSO) based on combination weighting, constructed a combination weighting criterion and established a H-PSO-SVM rock burst tendency prediction model based on the concept of the harmonic mean. Zhang et al. [32] established the rock burst cloud model with the distance index and uncertainty metric. Faradonbeh and Taheri [33, 34] used data mining technology to study rock burst tendencies and innovatively proposed the use of field experiments and data analysis methods to conduct research on the predicting deep rock mass and explosion tendencies, and they verified the feasibility of the method. However, some uncertainty analysis methods still have shortcomings. For example, when the AHP method is used to analyze the index weight and usually only measures the relative importance of the index, and it also presents subjectivity; the extension model takes a long time to analyze large-scale training samples and is dependent on the selection of the kernel function; the coupled neural network algorithm is complicated to calculate, the obtained samples are not representative, and the fitting speed is difficult to control; and the distance discrimination weighting model is strongly dependent on the sample data.
Due to the complexity of rock burst, the above methods also have some limitations: 1) Many risk evaluation factors are derived from subjective experience, which may not make sense in theory; 2) The evaluation criteria standard is generally vague, and traditional evaluation models cannot handle the problem of index classification near the threshold; 3) When different evaluation indicators belong to different grades, the method of defining the actual evaluation indicators of the sample is also somewhat ambiguous; 4) The measured value of the evaluation factors will have some errors, which will lead to the unreasonable classification of factor levels near the threshold; and 5) The traditional method of determining the importance of the risk level factors of the object relies too much on subjective experience. When the production system is complex and there are many influencing factors, many redundant factors will interfere, thereby reducing the reliability of the evaluation results. The entropy weight method [35] determines the variability of the evaluation index based on the sample data to calculate the amount of information included in the index, thereby assigning the weight according to the amount of information included in the index, although it does not consider the correlation between the indicators. Therefore, it is necessary to introduce a relatively perfect rock burst evaluation model.
In this paper, based on the uncertainty of rock burst evaluations, the complexity under multi-factor interactions, and the correlations between factors, a cloud model of finite intervals based on the CRITIC algorithm is proposed. When using the traditional normal cloud model to address the parameter distribution of the single interval boundary, the deviation between the actual situation and the model distribution will not be considered. The calculation result obtained in this case often differs from the actual engineering, and this difference affects the accuracy of the prediction result. When classifying rock burst grades, the determination of index weights is the key to object evaluation. Although the traditional method of objective weights is based on objective data, the results may be poorly interpreted. This paper uses the improved CRITIC method-normal cloud model for rock burst propensity prediction to determine the weight of the index. The model is applied to the rock burst examples of underground engineering worldwide, the validity of the model is tested, and the model is finally applied to the Dongguashan Copper Mine in Tongling, Anhui Province, for rock burst evaluation.
Theoretical Basis
Identification Framework and BPA
For a fuzzy evaluation problem, the answers can be composed of a set, and the internal elements of the set are mutually exclusive. Under certain conditions, the answer to the question can be the only element in the set. For this reason, Shafer [36] refers to this mutually exclusive set Θ as the recognition framework according to the set theory:
where Am indicates the evaluation level of the evaluation question and Θ indicates the evaluation standard in the evaluation question.
The evidence set is the basis for judging whether the identification framework of a problem Θ is a subset, which is equivalent to the index factor in the evaluation and is recorded as follows:
where En represents the index factor in the evaluation question, which is usually used to express the sample and judge its subordinate level. In the recognition framework Θ, the basic probability distribution function f is a mapping of the set 2Θ to [0, 1] and satisfies the following:
where A denotes any subset of the recognition frame Θ, which is denoted as A ∈ Θ; and f (A) is the basic probability distribution function of A, which indicates the degree of evidence support for A. In the evaluation question, f (A) indicates the degree of membership, which is characterized by the fact that the measured values of the indicators of the evaluation factors belong to the degree of membership of different evaluation levels.
Definition of the Cloud Model
The essence of the membership function concept, which is the most basic of fuzzy mathematics, did not have good theoretical support before the cloud model was produced. In particular, it is basically impossible to use accurate membership functions to define fuzzy thinking activities. For this reason, Li Deyi et al. proposed the concept of a cloud model [37, 38]. From the perspective of membership degree, they analyzed the data randomness and ambiguity problems in engineering practice. Randomness means that there is a certain basic definition, although the events may not occur. The characteristic of this problem is randomness. In the evaluation model, the concept and distribution of each evaluation factor index are deterministic but for different evaluation subjects; however, the specific data distribution is uncertain. Therefore, the mine risk assessment problem shows randomness; moreover, the basic concept of ambiguity can be characterized as the uncertainty contained in the event that has occurred but is difficult to accurately define. The method has been applied in many fields [39–48] and achieved good evaluation results.
The “cloud” is a two-way cognitive model between a qualitative concept and its quantitative representation expressed by linguistic values to reflect the uncertainty of random and ambiguous concepts in natural language. The relevant definitions are as follows [39].
There is an exact numerical representation of the quantitative set U = {x}, where U is the domain (1D, 2D or multidimensional), the Ak inter-cell is the fuzzy interval in the domain U, K is the number of grade intervals in the domain segmentation, and C is the qualitative concept of Ak. An arbitrary element x is observed in Ak, and each corresponding x ∈ Ak has a stable random number in the mapping μ: x → μA(x), which is randomly implemented in the qualitative concept CμA(x) is called the degree of certainty of x for concept C and can also be called the membership degree. The distribution of μA(x) on the domain U is called the cloud model, μA(x) ∈ (0, 1):
The distribution of μA(x) on each fuzzy set Ak is called a cloud, and each point [x, μ(x)] is called a cloud drop, where
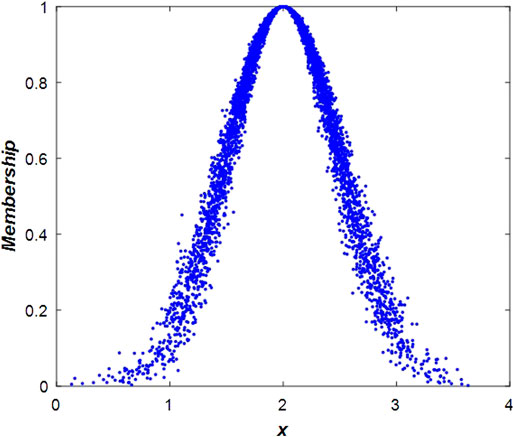
FIGURE 1. Traditional normal cloud model.
Digital Characteristics of the Cloud
Usually, the support of the cloud model concept is mainly expressed by three numerical eigenvalues [49]: expectation Ex, entropy En, and super entropy He. The specific meaning of the expression is shown in Figure 2, where three lines are selected in the cloud drop graph and Ex is expected to represent the central value of the data parameter in the Universe. In the geometric sense, a random value corresponding to the highest point of the graph is selected. The location of the cloud drop distributions suggests that Ex3 > Ex2 > Ex1. Entropy En indicates the range of values of the cloud drop expressed in the qualitative domain of the Universe, thus reflecting the ambiguity and randomness of the basic concept, which also determines the cloud drop. The greater the confusion is, the greater the width of a cloud map, the larger the value range of the cloud droplet, the more blurred the qualitative concept, and the greater the dispersion of the cloud droplet; thus, En2 > En1 = En3. The super entropy He, which is the entropy of entropy and indicates the uncertainty of entropy, is the thickness of the cloud in the cloud drop diagram. The larger the super entropy is, the thicker the cloud, which is characterized as He1 = He2 > He3 in the cloud drop diagram.
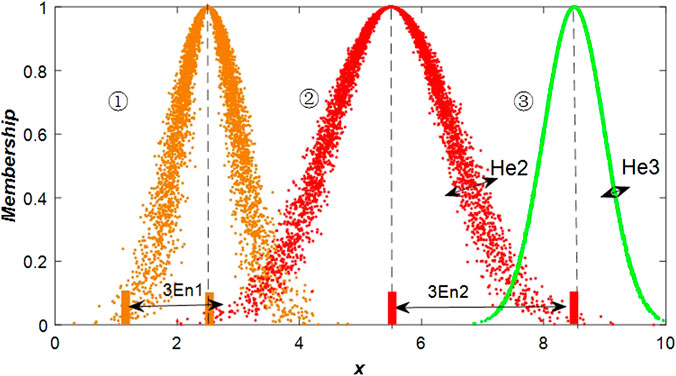
FIGURE 2. Cloud model feature parameter representation.
In the cloud model, each cloud drop satisfies
The boundary value Ck is a transition value of two levels, and the membership degrees belonging to the two fuzzy intervals are equal:
For the rock burst hazard grading interval, there are fuzzy edge intervals of magnitude
where Ck is the half-length of the k-level;
Forward Cloud Generator
Cloud generators, including forward cloud generators and reverse cloud generators, are an important medium to transform qualitative concepts into quantitative data. This paper uses a forward cloud generator as a means of qualitative and quantitative conversion. According to the cloud characteristic parameter N (Ex, En, He), a cloud drop map is generated in the blur interval Ak by the forward cloud generator. For each cloud drop P [xi, μA(x)] (i = 1, 2,…, n), n is the number of cloud droplets to be generated in the fuzzy interval Ak and N = n1 + n2 + nk represents the total number of clouds generated in the entire Universe U (N = 5,000 in this paper). When the indicator is in the mean interval of the non-edge level cloud, the degree of certainty of x to C is μ(x) = exp [−(x − Ex)2/2En,2]. When the indicator is in the edge level interval, x no longer has a normal distribution but has a uniform distribution with a degree of certainty of 1. Combining these two distributions, we have
The generated edge interval is a uniformly distributed cloud model as shown in Figure 3, where curve one and curve three represent a finite-interval cloud model and indicate hazard levels one and three, respectively, and the left and right edges of the two curves obey a uniform distribution with a degree of certainty of one.
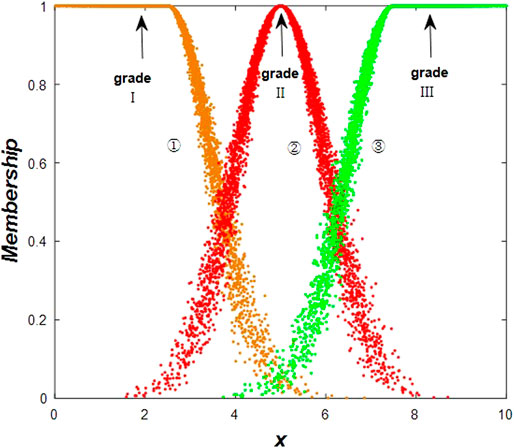
FIGURE 3. Finite-interval cloud model cloud drop diagram.
The positive normal cloud model is applied to rock burst evaluation based on the following four reasons:
(1) Rock burst risk assessment is a problem of uncertainty, and the cloud model expresses and reflects the uncertainty of concepts in the process of human cognition through the three characteristic parameters of N (Ex, En, He);
(2) The cloud model with the edge obeys the normal distribution, and its main body still obeys the normal distribution, which has certain universality and extensiveness;
(3) In the natural sciences, the characteristic curves of many qualitative concepts approximately obey a normal distribution;
(4) The cloud model can convert qualitative concepts and quantitative values, and the rock burst risk assessment selected in this article is also a research process from qualitative to quantitative.
Cloud Model Based on the CRITIC Algorithm for Rock Burst Evaluation
To use the CRITIC algorithm-based cloud model for rock burst evaluation, the appropriate evaluation index system and its corresponding evaluation criteria must be selected and the index weights are then calculated by the CRITIC algorithm; then, the corresponding evaluation index criteria are used to calculate the cloud characteristic parameters of each level. The cloud model is generated using the cloud generator, and the degree of certainty corresponding to each index is calculated according to the measured data of the sample. Finally, the comprehensive weight value is calculated, and the rock burst risk level is determined according to the principle of maximum membership degree. The evaluation flow chart is shown in Figure 4.
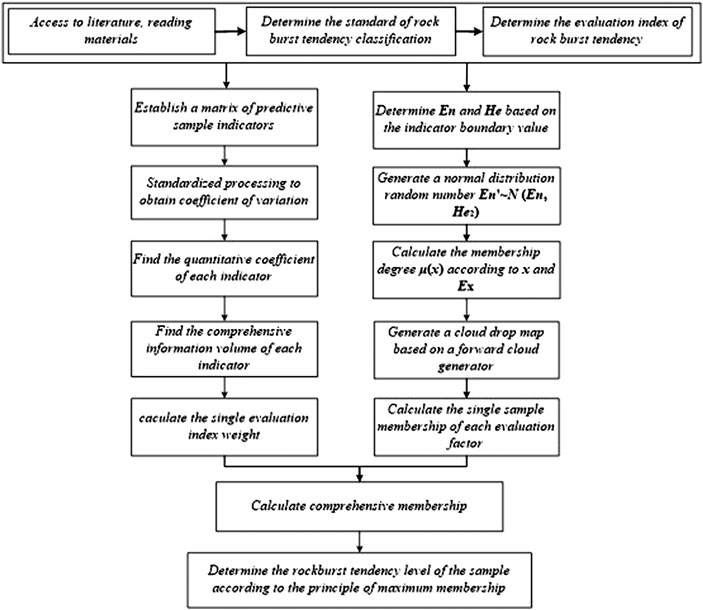
FIGURE 4. Flow chart of rock burst tendency prediction and evaluation.
Selection of Rock Burst Evaluation Classification Indicators and Intensity Grading Standards
The mechanism of rock burst is complicated, and there are many influencing factors. The selection of indicators is a key step in the prediction process. The impact of rock burst is two-fold: internal and external. In a high-stress environment, excavation of a cavern will lead to stress redistribution and stress concentration in the surrounding rock mass. The environment in which the rock mass is located undergoes a certain change, which is the external factor of rock burst. The mechanical properties of the rock mass itself are internal factors, and hard rock and brittle rock are prone to rock burst. Therefore, it is necessary not only to carry out mechanical experiments on the rock but also to obtain the rock burst tendency index and consider external conditions in rock burst evaluation. Based on related research on rock burst [50, 51], the theory of rock burst tendency, and intrinsic rock burst conditions, lithological factors, energy factors and geological factors, this paper selects the uniaxial compressive strength σc (I1), ratio of the uniaxial compressive strength to the tensile strength σc/σt (brittleness coefficient, I2), elastic deformation energy index Wet (I3), ratio of the maximum tangential stress to the uniaxial compressive strength σθ/σc (stress coefficient, I4) of the rock, depth of the roadway H (I5), and integrity coefficient of the rock mass Kv (I6) as indicators for rock burst propensity prediction. According to the characteristics of rock burst occurrence during underground mining of metal mines, the selection of evaluation indicators should be scientific, independent and representative. The main factors should be included in the evaluation as much as possible. The stronger the independence of the indicators, the more accurate the prediction results will be.
According to the relevant research and classification criteria, the rock burst intensity can be divided into four grades. Grade I (no rock burst) is mainly manifested as a lack of rock wall tearing, rock fragmentation, sound emission phenomenon, etc., and there is no need to take any safety measures. Grade II (weak rock burst) is characterized by a loose rock wall surface and block spalling occurs, and safety and safety monitoring measures are required. Grade III (moderate rock burst) is characterized by block spalling of the rock in the diverticulum and roadway wall accompanied by occasional projectiles that often emit sharp ejecting sounds and may cause casualties and property losses; thus, it is necessary to implement monitoring measures to perform isolation and protection work. Grade IV (violent rock burst) is characterized by large rock mass spalling, rapidly deformed surrounding rock, and a large number of blast pits; this type of rock burst is prone to causing numerous casualties and injuries, and relevant safety protection measures must be taken. The specific classification criteria are shown in Table 1 [52–54]. Multiple studies at home and abroad indicate that the classification standards for rock burst tendencies are different. The classification standards selected in this article indicate a trend and only show the uncertainty of the rock burst problem.
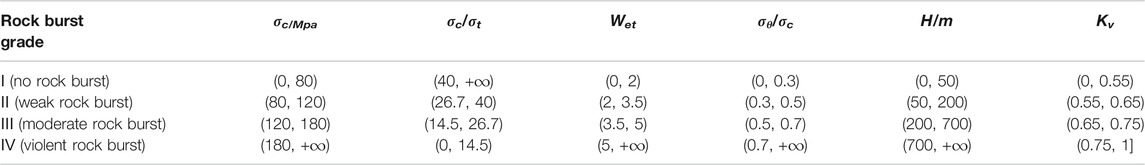
TABLE 1. Rock burst classification criteria.
Rock Burst Propensity Prediction CRITIC Algorithm
The so-called weight refers to the importance of the risk indicators that affect the problem in the evaluation process. The methods of determining weight mainly include subjective weighting methods and objective weighting methods. According to the engineering characteristics of the rock burst problem, this paper adopts the CRITIC objective weighting algorithm to determine the index weight. The CRITIC method was proposed by Diakoulaki et al. [55] in 1995, and it focuses on using the information and correlation of risk indicators to determine risk weights. The improved CRITIC algorithm is based on the original calculation steps, adding the concept of coefficient of variation (Formula 12), thereby reducing the shortcomings of using standard deviation to measure the variability of indicators [56], the main steps are as follows:
STEP 1: Using the initial data, establish a matrix of predicted sample indicator values:
where xij is the original value corresponding to the jth indicator of the ith evaluation object.
STEP 2: According to the Z-score method, standardize the index values in matrix X of the above formula:
According to the algorithm, the two parameters in the above formula are defined as follows:
where
STEP 3: Find the coefficient of variation in the indicator:
where vj is the coefficient of variation in the jth indicator.
STEP 4: Use STEP 2 to obtain the normalized matrix X* and use the statistical concept to calculate the correlation coefficient:
Obtain the Correlation Coefficient Matrix
where rkl is the correlation coefficient between the kth indicator and the 1st indicator.
STEP 5: Identify the degree of independence—quantization coefficient—of each indicator:
STEP 6: Calculate the total volume of information for each indicator:
STEP 7: Determine the weight of each evaluation index:
According to the cloud model theory and the improved CRITIC algorithm, the coupling process is as follows.
(1) With reference to the rock burst risk level classification standard and cloud model concept, determine the number and interval of the divided states.
(2) According to the numerical characteristics of the cloud model (Eq. 7) and the grading standard of the rock burst intensity level, the numerical eigenvalues of different hazard levels of different evaluation factors can be obtained. The specific values are shown in Table 2. When the edge interval is treated as (Ck, +∞), the expected value of the k-1 interval can be assumed, and then the expected value of the entire interval can be obtained.
(3) Based on the evaluation criteria in this table and the characteristics of the cloud model, the MATLAB simulator is used to generate a cloud drop graph of each evaluation index by a forward cloud generator, and then the specific generation graph can be determined as shown in Figure 5. Let drop (x1i, x2i,…xni, μi) be a cloud drop, which is a specific implementation of the number of linguistic values represented by the cloud, where X (x1i, x2i,…xni) is the value of the qualitative concept in this field and μ(xi) is the degree to which the x value (the measured value of the sample) belongs to different levels.
(4) Use the improved CRITIC weighting algorithm (Eqs 9–17) to calculate the importance of a single evaluation factor, i.e., the weight value.
(5) Combine the weights determined by the improved CRITIC algorithm with the cloud model feature parameters to obtain the final degree of certainty.
(6) After the expansion and calculation of the above steps, we can obtain the uncertainty in the different evaluation indicators x subordinate to a certain cloud μ (x) and then utilize the CRITIC algorithm to calculate the weight of different evaluation indicators. Then, the final comprehensive determination formula is as follows:
where k is the degree of determination of the measured value of the jth indicator of the μk,j sample; and ω(Ej) represents the weight of the jth evaluation index of the sample.
(7) According to the final comprehensive determination and the principle of maximum membership, the membership level of the sample is determined:
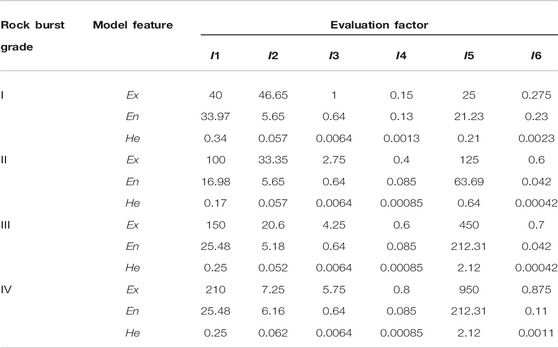
TABLE 2. Characteristic parameters of the rock burst cloud model.
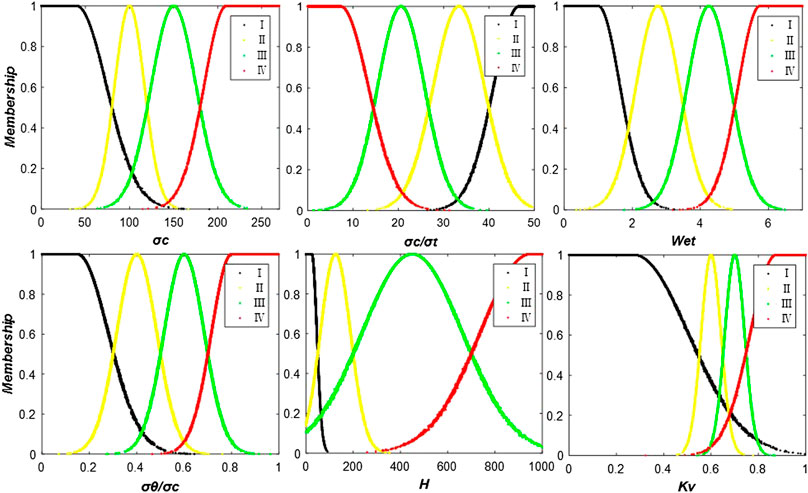
FIGURE 5. Rock burst evaluation index cloud drop diagram.
Rock Burst Evaluation Analysis of Learning Samples
To verify the rationality and effectiveness of the rock burst propensity prediction model used in this paper, referring to 20 sets of typical rockburst example data in literature [50]. The details of the measured index values and actual rock burst grades are listed in Table 3.
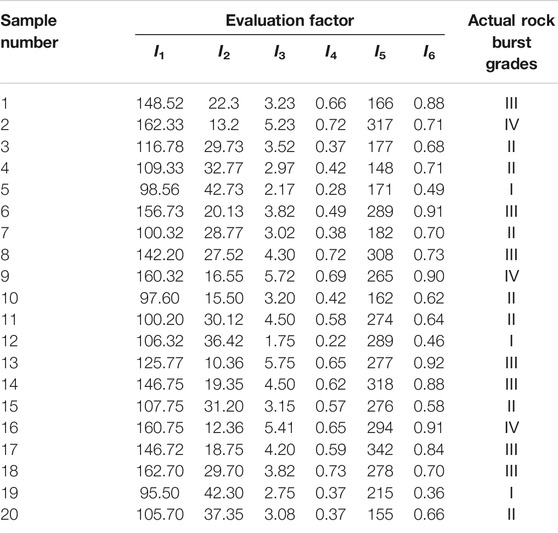
TABLE 3. Measured rock burst index values and actual rock burst grades.
Indicator Weight Determination
In this paper, the CRITIC method is used to calculate the index weight and the information volume of the indicator and the correlation between the indicators are comprehensively considered. According to the steps outlined in Formulas 10 and 11, the Z-score method is used to standardize the index values in Table 3 and then the mean and variance of each index are calculated. The coefficient of variation in each index is obtained by using Eq. 12. These results are shown in Table 4.
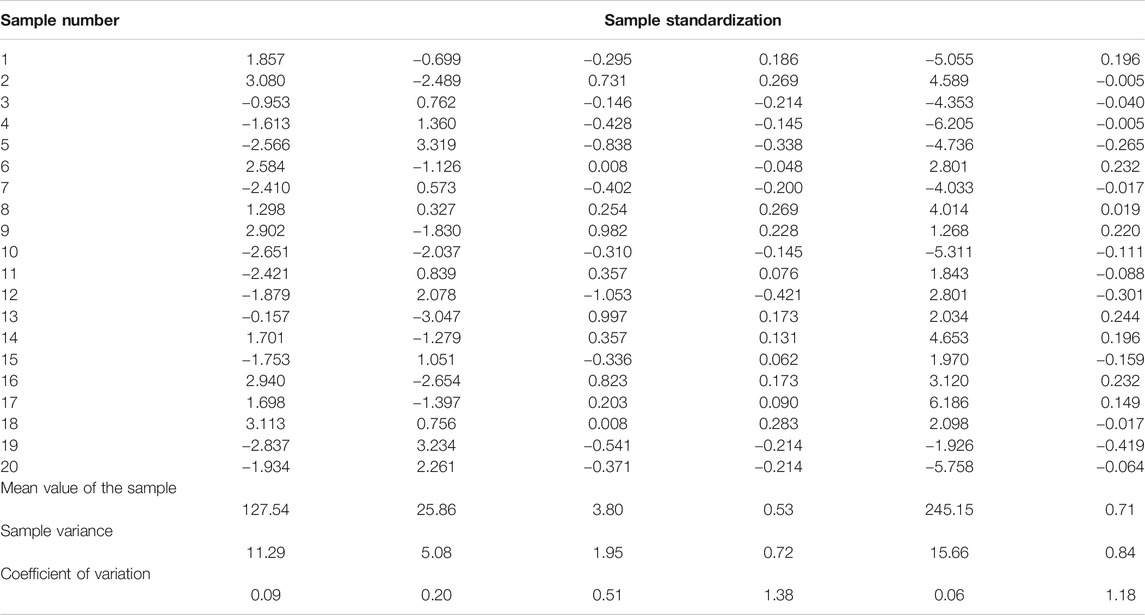
TABLE 4. Sample-normalized index values and CRITIC algorithm index parameters.
According to the basic concept of the Pearson correlation coefficient, the correlation coefficients of the standardized calculated indexes are obtained by referring to Formula 13 as shown in Table 5.
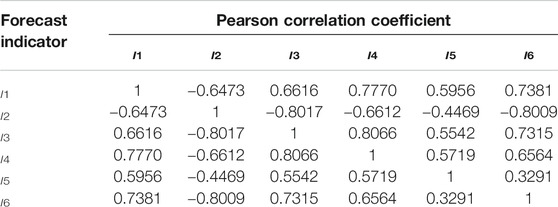
TABLE 5. Normalized index Pearson correlation coefficients.
The coefficient of independence of each index is obtained by using Eq. 15, and the coefficient of variation and the coefficient of independence of each index are multiplied by Eq. 16. Finally, using Eq. 17, we can obtain the weight values of each prediction index I1 (σc), I2 (σc/σt), I3 (Wet), I4 (σθ/σc), I5 (H), and I6 (Kv): 0.022, 0.142, 0.135, 0.340, 0.019, and 0.342, respectively.
Prediction Results and Analysis
According to the cloud model characteristic parameters obtained from the table, by substituting them into Formula 8, the degree of certainty of the selected test samples are calculated to categorize their hazard levels, and the corresponding weights are calculated according to Formula 18. According to the principle of maximum membership degree, the degrees of membership of the samples to be tested are shown in Table 6.
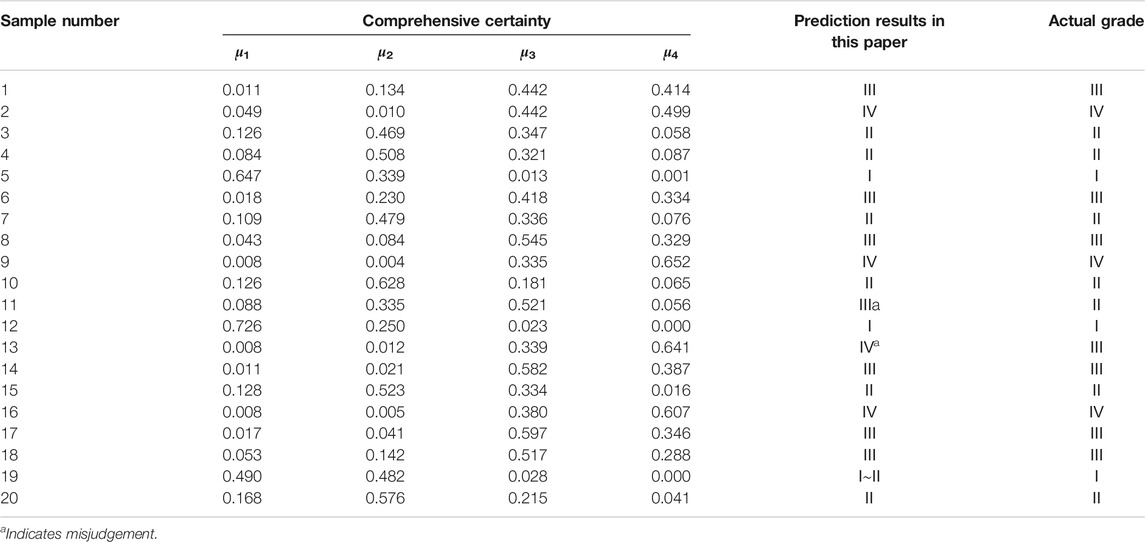
TABLE 6. Rock burst propensity prediction results.
In order to further verify the accuracy of the calculation method proposed in this manuscript, we selected the calculation of F1 score for discussion and analysis. F1 Score is an indicator used in statistics to measure the accuracy of a binary classification model. It takes into account the accuracy and recall of the classification model. F1 score can be regarded as a weighted average of model accuracy and recall. Its maximum value is 1 and its minimum value is 0. The F1 score analysis includes the following four basic concepts, namely Tue Positive (TP: prediction is positive, actual is positive); False Positive (FP: prediction is positive, actual is negative); False Negative (FN: prediction is negative, actually positive); True Negative (TN: predicted negative, actual negative). The so-called positive means that the predicted result is correct; the negative concept means that the predicted result is wrong. Therefore, for the rockburst grading of level 1, the TP value is 3, and similarly corresponding to the 2, 3, and 4 levels, the TP values are 6, 6, and 3 respectively. In terms of FP value and FN value, the situation is shown in Table 8:

TABLE 7. Analysis of prediction results (TP, FP, FN values of different rockburst prediction grades).
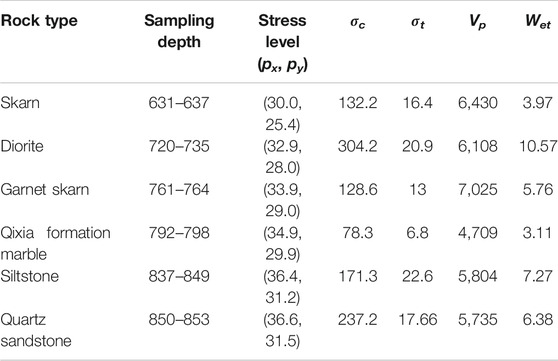
TABLE 8. Rock sample test data of seven typical ore rocks from Donggua Mountain.
The calculation formula for the precision rate P and the recall rate R are:
The formula for calculating F1 score is:
The calculation shows that the p value, R value, and F1 score are all 0.9, which also verifies that the model is reasonable and feasible in the exploration of rockburst tendency classification.
The calculation results of the proposed rock burst cloud model based on the CRITIC algorithm are consistent with the actual data, indicating that the proposed model is reasonable and effective for rock burst grading. The generation of sample error is due to the gray features of the rock burst problem itself, causing its prediction to have some ambiguity, and the factors affecting the rock burst tendency are multi-faceted and include other external environmental factors, such as the installation of artificial support and the humidity of the internal environment, all of which complicate the accuracy of rock burst tendency.
In the CRITIC method, the correlation between the information volume and the indicator index is comprehensively considered and the reliability of the weight calculation result is improved. As a cognitive model that realizes the qualitative concept and the bidirectional transformation of quantitative data, the cloud model can transform the ambiguity and randomness of the rock burst evaluation process into quantitative data of certainty, which accurately reflects the uncertainty of rock burst grading. This approach is superior to other methods.
Since rock burst tendency is a qualitative concept, the classification of its hazard level will be affected and controlled by many uncertain factors. Although the application of the cloud model has certain predictability for the occurrence of rock burst, the finite-interval cloud model cannot completely eliminate the gray features of its existence by transforming its ambiguity and randomness into certainty. The current cloud model used for evaluation does not reflect the characteristics of rock burst affected by multiple factors and does not reflect the correlation of factors in the process. The form of the actual distribution of the rock burst tendency evaluation index will have an impact on the evaluation results. The cloud model generated by the combination of uniform and normal distributions reflects the actual situation more reasonably, the parameter method must be further improved to generate more accurate results. In addition, the selection of the evaluation index should also be performed according to the actual project conditions and cannot be rushed. Because of the location of the rock burst, the external environment and human factors will affect the occurrence of rock burst.
Engineering Application
The Dongguashan copper deposit is located in the Shizishan orefield of Tongling City, Anhui Province, on the polymetallic metallogenic belt along the Yangtze River. The surface is a hilly area with a ground elevation of 15–182 m. The ore body is inclined to 35° and dips to the northwest and southeast with the surrounding rock. The inclination angle is generally approximately 20°, and the maximum inclination angle is 30–35°. The ore body is mainly composed of copper-bearing skarns, copper-bearing pyrite, copper-bearing pyrrhotite and copper-bearing serpentinite. The direct surrounding rock of the ore body is the Carboniferous Lower Gorilla Formation of quartz diorite, which is dominated by horny siltstone. Dongguashan Copper Mine is the main mine of Tongling Nonferrous Metals Group Holdings Co., Ltd. The deposit is a layer-controlled skarn-type deeply buried deposit, with a burial depth of more than 700 m. Therefore, the original rock stress and ore strength of the mining area are relatively high. In the process of mining, the prediction and prevention of rock burst has become a major issue and must be based on the study of rock burst tendency. Because the Dongguashan Copper Mine has a deep burial depth, a high initial rock stress, a favourable ore body structure and hard rock properties, rock burst is possible in this mine according to the experience of deep mine mining outside of China. Under the action of high stress, a destructive rock burst event with rock ejection as the main feature occurred during the construction of the tunnel during the construction and production of the Winter Melon Mountain Mine. Therefore, rock burst tendency predictions have become a focus of mine earthquake prevention and disaster reduction and important technical mean. In this paper, the physico-mechanical properties of the core of seven kinds of typical ore from the ore-bearing rock mass and the surrounding rock of the upper and lower layers are selected as the criterion for the 730 m middle section of the Dongguashan copper deposit (the geological map of this section is shown in Figure 6). The core data of wells zk504 and zk504 are shown in Table 8 [57].
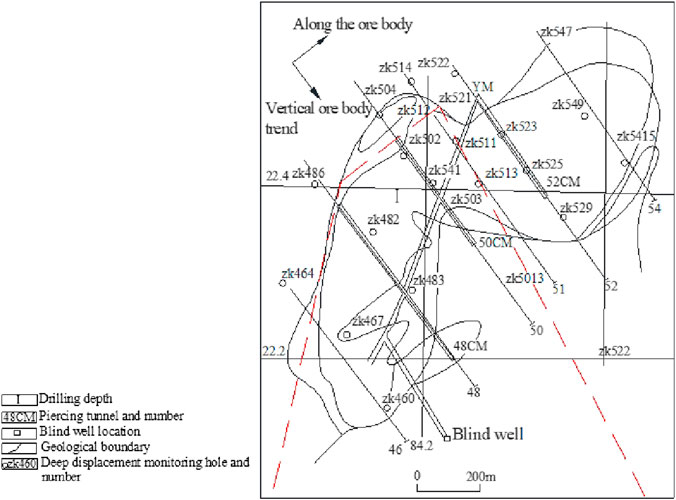
FIGURE 6. Geological map of the 730 m middle section of the Dongguashan Copper Mine.
In this paper, six rock burst propensity prediction indexes are selected: the uniaxial compressive strength σc (I1), ratio of the uniaxial compressive strength to the tensile strength σc/σt (brittleness coefficient, I2), elastic deformation energy index Wet (I3), and ratio of the maximum tangential stress to the uniaxial compressive strength σθ/σc (stress coefficient, I4) of the rock, depth of the roadway H (I5), and integrity coefficient of the rock mass Kv (I6). A comparison of σc/σt and Wet is easy to obtain, and σθ/σc is determined by the formula of the maximum shear stress around the circular roadway:
where ξ is the laneway shape correction coefficient and λ is the side stress coefficient, which is equal to the ratio of the horizontal stress px to the vertical stress py.
The rock mass integrity coefficient Kv is the square of the longitudinal wave velocity of the rock mass. The longitudinal wave velocity Vp of the rock is easy to determine (as shown in Formula 23). Therefore, the value of Kv is determined according to Vp. The higher the elastic wave velocity is, the better the rock integrity. The rock sample test data of the Dongguashan Copper Mine are shown in Table 8 [58].
where Kv is the rock mass integrity coefficient, and Vpm is the longitudinal wave velocity of rock mass, and Vpr is the longitudinal wave velocity of indoor rock (block).
For the roadway height, since the height span is not very large, this paper takes the average measured height; based on these data, the value of the prediction index can be calculated. The calculation results are shown in Table 9.
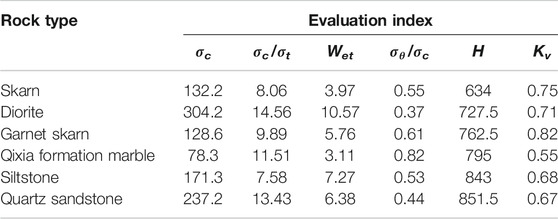
TABLE 9. Rock burst tendency prediction value for the Dongguashan Copper Mine.
Referring to the calculation method of the learning sample, the calculation and analysis of the actual engineering data can be comprehensively determined. The prediction results shown in Table 10 show that the rock burst tendencies of the diorite and siltstone are the strongest while those of the garnet skarn are the next strongest. The skarn grade is between III and IV, while the quartz sandstone and skarn are of grade III. The grade III predictions are the most certain, but the degree of membership for IV is not small. Finally, the Qixia Formation is predicted to be III (moderate rock burst).
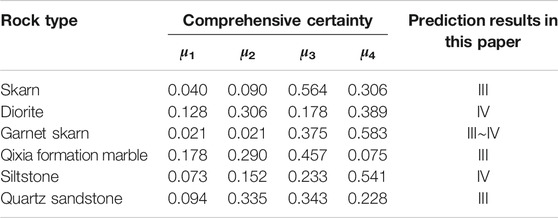
TABLE 10. Rock burst tendency prediction results for the Dongguashan Copper Mine.
Through the analysis of loading and unloading tests and the sum of the brittleness coefficient, impact energy index and elastic deformation energy index, the rock burst tendency of each rock sample type is ranked from the largest to the smallest: siltstone, quartz sandstone, garnet skarn, skarn, and Qixia group marble. The prediction results of this paper are basically consistent with this strong-to-weak ranking.
Conclusion
(1) To further evaluate the rock burst tendency and provide corresponding engineering technical guidance, this article selects the membership function cloud model that considers randomness and ambiguity and comprehensively accounts for the complexity of multi-factors and the correlation between factors in the rock burst evaluation problem. The CRITIC weighting algorithm is selected for the comprehensive evaluation, the rationality of the evaluation method is verified by selecting 20 groups of underground engineering rock burst example data, and the method is finally applied to the Dongguashan copper mine. The explosion tendency evaluation obtained good results.
(2) Although the edge of the cloud model with uniform distribution reduces the actual error to a certain extent, deviations may occur between the actual production situation and the analysis result, such as the calculation of some parameters for Dongguashan. Therefore, the risk assessment result can only be used as a reference and the actual situation needs to be analyzed in detail. Capturing the risk factors that affect the occurrence of the disaster by the theoretical analysis process is indeed difficult because regardless of the influencing factor selected for modeling, analysis and calculation, other objective factors may be ignored.
Data Availability Statement
The original contributions presented in the study are included in the article/Supplementary Material, further inquiries can be directed to the corresponding author.
Author Contributions
The first author JW drafted the content of the manuscript, there are related contents about on-site practice in this manuscript, MH is a member of Hongda Blasting Engineering Group Co., Ltd had in China and he is a Doctor of Engineering in Central South University who made relevant contributions and, the corresponding author JG was responsible for the guidance of the manuscript and put forward relevant revision opinions.
Conflict of Interest
Author MH was employed by company Hongda Blasting Engineering Group, Co., Ltd.The remaining authors declare that the research was conducted in the absence of any commercial or financial relationships that could be construed as a potential conflict of interest.
References
1. Wang Y-C, Hong-wen J, Zhang Q, Wei L, Zhi-min X. A normal cloud model-based study of grading prediction of rock burst intensity in deep underground engineering. Rock Soil Mech (2015) 4:1189–94. doi:10.16285/j.rsm.2015.04.037
2. Zhou C-J, Zhang Y, Xu H, Gao Y-D, Zhang R. Review of rock burst in underground engineering. Adv Sci Technol Water Resour (2013) 3:77–83+94.
3. Hui-lian Y. Rock burst characteristics, causes and influencing factors. Coal Engineer (1989) 2:37–42.
4. Mansurov VA. Prediction of rock bursts by analysis of induced seismicity data. Int J Rock Mech Min Sci (2001) 38:893–901. doi:10.1016/S1365-1609(01)00055-7
5. Tang L, Xia KA. Seismological method for prediction of areal rock bursts in deep mine with seismic source mechanism and unstable failure theory. J Cent South Univ T (2010) 17:947–53. doi:10.1007/s11771-010-0582-5
6. Fujii Y, Ishijima Y, Deguchi G. Prediction of coal face rock bursts and micro seismicity in deep longwall coal mining. J Rock Mech Mining (1997) 34:85–96. doi:10.1016/S1365-1609(97)80035-4
7. Sirit B, Wattimena RK, Widodo NP. Rock burst prediction of a cut and fill mine by using energy balance and induced stress. Proc Earth Planet Sci (2013) 6:426–34. doi:10.1016/j.proeps.2013.01.056
8. Cook NGW. The basic mechanics of rock bursts. J South African Inst Mining Metallurgy (1963) 64:71–81.
9. Russense BF. Analysis of rock spalling for tunnels in steep valley sides (in Norwegian). Trondheim, Norwegian: Norwegian Institute of Technology (1974).
10. Kornowski J, Kurzeja J. Prediction of rock burst probability given seismic energy and factors defined by the expert method of hazard evaluation (MRG). Acta Geophys (2012) 60:472–86. doi:10.2478/s11600-012-0002-3
11. Meng F, Zhou H, Wang Z, Zhang L, Kong L, Li S, et al. Experimental study on the prediction of rock burst hazards induced by dynamic structural plane shearing in deeply buried hard rock tunnels. Int J Rock Mech Min Sci (2016) 86:210–23. doi:10.1016/j.ijrmms.2016.04.013
12. Chen B, Feng X, Li Q, Luo R, Li S. Rock burst intensity classification based on the radiated energy with damage intensity at Jinping II hydropower station, China. Rock Mech Rock Eng (2015) 48:289–303. doi:10.1007/s00603-013-0524-2
13. Wang JA, Park HD. Comprehensive prediction of rock burst based on analysis of strain energy in rocks. Tunn Undergr Space Technol (2001) 16:49–57. doi:10.1016/S0886-7798(01)00030-X
14. Sharan SK. A finite element perturbation method for the prediction of rock burst. Comput Struct (2007) 85:1304–9. doi:10.1016/j.compstruc.2006.08.084
15. Hirata A, Kameoka Y, Hirano T. Safety management based on detection of possible rock bursts by AE monitoring during tunnel excavation. Rock Mech Rock Eng (2007) 40:563–76. doi:10.1007/s00603-006-0122-7
16. Bao-xin JIA, Chen H, Pan Y-s, Yang C. Rock burst evaluation technology of multi-parameters synthetic index. J Disaster Prev Mitig Eng (2019) 2:330–7. doi:10.13409/j.cnki.jdpme.2019.02.019
17. Zhang Z-Z, Tian Z-L, Lin B. Prediction research of rock burst tendency based on the acoustic emission test. Metal Mine (2011) 8:56–9.
18. Dou L, Chen T, Gong S, He H, Zhang S. Rock burst hazard determination by using computed tomography technology in deep workface. Saf Sci (2012) 50:736–40. doi:10.1016/j.ssci.2011.08.043
19. Li X, Wang E, Li Z, Liu Z, Song D, Qiu L. Rock burst monitoring by integrated microseismic and electromagnetic radiation methods. Rock Mech Rock Eng (2016) 49:4393–406. doi:10.1007/s00603-016-1037-6
20. Frid V. Rock burst hazard forecast by electromagnetic radiation excited by rock fracture. Rock Mech Rock Eng (1997) 30:229–36.
21. Sun J, Wang L-G, Zhang H-L, Shen Y-F. Application of fuzzy neural network in predicting the risk of rock burst. Proc Earth Planet Sci (2009) 1:536–43. doi:10.1016/j.proeps.2009.09.085
22. Li SH, Wang SY, Zhu J, Li B, Yang J, Wu LZ. Prediction of rock burst tendency based on weighted fusion and improved cloud model. Chin J Geotech Eng (2018) 6:1075–83. doi:10.11779/CJGE201806013
23. Guo J, Zhang W, Zhao Y. A multidimensional cloud model for Rock burst evaluation. Chin J Rock Mech Eng (2018) 37(5):1199–206. doi:10.13722/j.cnki.jrme.2017.1522
24. Zhang L-W, Zhang D-Y, Shu-cai L, Dao-hong Q. Application of RBF neural network to rock burst evaluation based on rough set theory. Rock Soil Mech (2012) 33:270–6. doi:10.16285/j.rsm.2012.s1.008
25. Gao W. Prediction of rock burst based on ant colony clustering algorithm. Chin J Geotech Eng (2010) 6:874–80.
26. Liu ZB, Shao JF, Xu WY, Meng YD. Prediction of rock burst classification using the technique of cloud models with attribution weight. Nat Hazards (2013) 68:549–68. doi:10.1007/s11069-013-0635-9
27. Zhou KP, Lin Y, Deng HW, Li J, Liu CJ. Prediction of rock burst classification using cloud model with entropy weight. Trans Nonferrous Metals Soc China (2016) 26:1995–2002. doi:10.1016/S1003-6326(16)64313-3
28. Zhou J, Li X, Shi X. Long-term prediction model of rockburst in underground openings using heuristic algorithms and support vector machines. Saf Sci (2012) 50:629–44. doi:10.1016/j.ssci.2011.08.065
29. Chen X, Xiao-li L, En-zhi W, Wang S-J. Rock burst evaluation and classification based on the ideal-point method of information theory. Tunn Undergr Space Technol (2018) 81:382–90. doi:10.1016/j.tust.2018.07.014
30. Lu F-R, Chen J-H. Rock burst evaluation method based on AHP and entropy weight TOPSIS model. Gold Sci Technol (2018) 3:365–71.
31. Ting-xin W, Xiao-yu C. Forecast research on the rock burst liability based on the comprehensive evaluation H-PSO-SVM Model. J Saf Environ (2018) 2:440–5. doi:10.13637/j.issn.1009-6094.2018.02.006
32. Zhang B, Dai X-G. A cloud model for predicting rock burst intensity grade based on index distance and uncertainty measure. Rock Soil Mech (2017) 38:257–65. doi:10.16285/j.rsm.2017.S2.036
33. Faradonbeh RS, Taheri A. Long-term prediction of rockburst hazard in deep underground openings using three robust data mining techniques. Eng Comput (2019) 2:659–75. doi:10.1007/s00366-018-0624-4
34. Faradonbeh RS, Taheri A, Sousa LRE, Karakus M. Rockburst assessment in deep geotechnical conditions using true-triaxial tests and data-driven approaches. Int J Rock Mech Min Sci (2020) 128:104279. doi:10.1016/j.ijrmms.2020.104279
35. Zou ZH, Yun Y, Sun JN. Entropy method for determination of weight of evaluating indicators in fuzzy synthetic evaluation for water quality assessment. J Environ Sci (China) (2006) 18:1020–3. doi:10.1016/s1001-0742(06)60032-6
36. Rissanen JJ. Fisher information and stochastic complexity. IEEE Trans Inf Theory (1996) 42(1):40–7. doi:10.1109/18.481776
37. De-yi LI, Meng H-J, Xue-mei SHI. Affiliated cloud and affiliated cloud generator. Comput Res Develop (1995) 32:15–20.
38. Li D, Chen H, Fan J, Shen C. A novel qualitative control method to inverted pendulum systems. IFAC Proc Vol (1999) 32:1495–500. doi:10.1016/S1474-6670(17)56253-9
39. Efremenko DS, Schüssler O, Doicu A, Loyola D. A stochastic cloud model for cloud and ozone retrievals from UV measurements. J Quant Spectr Radiat Transf (2016) 184:167–79. doi:10.1016/j.jqsrt.2016.07.008
40. Wang J, Guo J. Research on rock mass quality classification based on an improved rough set–cloud model. IEEE Access (2019) 7:123710–24. doi:10.1109/ACCESS.2019.2938567
41. Zhu M, Hahn A, Wen YQ. Identification-based controller design using cloud model for course-keeping of ships in waves. Eng Appl Artif Intell (2018) 75:22–35. doi:10.1016/j.engappai.2018.07.011
42. Zang W, Ren L, Zhang W, Liu X. A cloud model-based DNA genetic algorithm for numerical optimization problems. Future Generat Comput Syst (2018) 81:465–77. doi:10.1016/j.future.2017.07.036
43. Hongbo G, Guatao X, Hongzhe L, Xinyu Z, Deyi L. Lateral control of autonomous vehicles based on learning driver behavior via cloud model. J China Univ Posts Telecommun (2017) 24:10–7. doi:10.1016/S1005-8885(17)60194-8
44. Guo J, Wang J, Liu S. Application of an improved cloud model and distance discrimination to evaluate slope stability. Math Probl Eng (2019) 2019:1–18. doi:10.1155/2019/8315894
45. Mou R, Cai Q. Research on classification method of surrounding rock stability based on cloud model and rough set theory. J Saf Environ (2018) 18:1251–7. doi:10.13637/j.issn.1009-6094.2018.04.003
46. Khedim F, Labraoui N, Ari AAA. A cognitive chronometry strategy associated with a revised cloud model to deal with the dishonest recommendations attacks in wireless sensor networks. J Netw Comput Appl (2018) 123:42–56. doi:10.1016/j.jnca.2018.09.001
47. Bao Y, Lin L, Wu S, Deng KAW, Petropoulos GP. Surface soil moisture retrievals over partially vegetated areas from the synergy of Sentinel-1 and Landsat 8 data using a modified water-cloud model. Int J Appl Earth Obs Geoinf (2018) 72:76–85. doi:10.1016/j.jag.2018.05.026
48. Wang D, Zeng D, Singh VP, Xu P, Liu D, Wang Y, et al. A multidimension cloud model-based approach for water quality assessment. Environ Res (2016) 149:113–21. doi:10.1016/j.envres.2016.05.012
49. Li D, Du Y. Artificial intelligence with uncertainty. 2nd ed. Beijing, China: National Defense Industry Press (2017). p. 1–30.
50. Xue Y, Li Z, Li S, Qiu D, Tao Y, Wang L, et al. Prediction of rock burst in underground caverns based on rough set and extensible comprehensive evaluation. Bull Eng Geol Environ (2019) 78:417–29. doi:10.1007/s10064-017-1117-1
51. Lin Y, Zhou K, Li J. Application of cloud model in rock burst evaluation and performance comparison with three machine learning algorithms. IEEE Access (2018) 6:30958–68. doi:10.1109/ACCESS.2018.2839754
52. Wang Y-H, Wo-dong L, Qi-guang L, Xu Y, Tan G-H. Fuzzy comprehensive evaluation method pf Rock burst evaluation. Chin J Rock Mech Eng (1998) 5:493–501.
53. Shang Y, Zhang J, Fu B. Analyses of three parameters for strain mode rock burst and expression of rock burst potential. Chin J Rock Mech Eng (2013) 8:1520–7.
54. Wang Y-C, Hong-wen J, Xian-wei J, Mu T-A, Zhang C-L. Model for classification and prediction of rock burst intensity in a deep underground engineering with rough set and efficacy coefficient method. J Centr South Univ (Sci Technol) (2014) 6:1992–7.
55. Diakoulaki D, Mavrotas G, Papayannakis L. Determining objective weights in multiple criteria problems: the critic method. Comput Oper Res (1995) 7:763–70. doi:10.1016/0305-0548(94)00059-H
56. Wang Y, Jiang X, Zhang L. Research on the evaluation of science and technological awards based on improved CRITIC method and cloud model. J Hunan Univ (Nat Sci) (2014) 04:118–24.
57. Guo J, Zhao Y, Zhang W, Dai X, Xie X. Stress analysis of mine wall in panel barrier pillar-stope under multi-directional loads. J Central South Univ (Sci Technol) (2018) 49(12):3020–8.
Keywords: cloud model, CRITIC algorithm, rock burst, uncertainty, prediction
Citation: Wang J, Huang M and Guo J (2021) Rock Burst Evaluation Using the CRITIC Algorithm-Based Cloud Model. Front. Phys. 8:593701. doi: 10.3389/fphy.2020.593701
Received: 11 August 2020; Accepted: 23 December 2020;
Published: 04 February 2021.
Edited by:
Guoyang Fu, Monash University, AustraliaReviewed by:
Wenzheng Yue, China University of Petroleum, ChinaAbbas Taheri, University of Adelaide, Australia
Copyright © 2021 Wang, Huang and Guo. This is an open-access article distributed under the terms of the Creative Commons Attribution License (CC BY). The use, distribution or reproduction in other forums is permitted, provided the original author(s) and the copyright owner(s) are credited and that the original publication in this journal is cited, in accordance with accepted academic practice. No use, distribution or reproduction is permitted which does not comply with these terms.
*Correspondence: Jiang Guo, guojiang@csu.edu.cn
†ORCID: Jiang Guo orcid.org/0000-0003-1418-2039