Brand and Firm Value: Evidence from Arab Emerging Markets


1
Doctoral School of Economic and Regional Sciences, Szent István University, Páter Károly u. 1, 2100 Gödöllő, Hungary
2
Faculty of Finance and Accountancy, Department of Finance, Budapest Business School, Buzogány u. 10-12, 1149 Budapest, Hungary
3
Faculty of Economic and Social Sciences, Szent István University, Páter Károly u. 1, 2100 Gödöllő, Hungary
*
Author to whom correspondence should be addressed.
Economies 2021, 9(1), 5; https://doi.org/10.3390/economies9010005
Submission received: 18 November 2020
/
Revised: 5 January 2021
/
Accepted: 8 January 2021
/
Published: 12 January 2021
Abstract
:This study aims to estimate the impact of brand as the most important intangible marketing asset on firm value, measured by share return in some Arab emerging market, as well analyze the moderating role of agency costs in the relationship between share return and brand. We use the Ohlson model of valuation with a sample of the most traded companies on four markets under study. The panel data regression results show a significant impact of brand on return as well as agency costs that promote the valuation model power, meaning that good corporate governance increases the degree of marketing investment efficiency in value creation. Our findings support the literature relating to the residual earnings valuation model. Furthermore, the results confirm the informative content of marketing application besides the traditional accounting figures as a promising approach for firm valuation.
1. Introduction
Research efforts are still underway to solve the value puzzle in the capital market as well as to determine the explanatory factors affecting share return. More than 300 factors have been identified (Pham et al. 2018). On the other hand, the relationship between accounting profit and return on equity is less significant because it turns a blind eye to some important variables such as marketing (Lev and Zarowin 1999). In the same context, a new research trend has been towards linking marketing applications to improving the company’s market values within the marketing–finance interface framework, which has added new dimensions to marketing strategies to include the investor as one of the key stakeholders, as well as considering the value of the company as a main objective of these strategies. In other words, to bridge the gap between marketing and financial decisions within the firm (Singh et al. 2005; Hanssens and Pauwels 2016). Likewise, Srivastava et al. (1998) pointed out the role of brand equity in creating value for shareholders by influencing cash flows. Corporate valuation models that explicitly include assessment of firm capabilities indicate that the marketing capabilities of the owner-managers, alongside their efforts to improve the brand value of their company, matter a lot (Littunen 2000). Consequently, two channels have been defined for the impact on firm value, the first being the indirect influence of tangible assets through increased revenues, and the second being the channel of direct influence through intangible marketing assets. Laghi et al. (2020) developed market and accounting multiples for the purpose of estimating the value of brands, for assessing the (intangible) relational capital. Inherently, marketing assets create competitive resources that increase the possibility of sustainable growth and surplus performance in the long-term (Rust et al. 2004).
Brand as a substantial intangible asset has attracted extensive research to elucidate the financial consequences on shareholders’ value as the original goal of companies (Aaker 1996) through expediting cash flow, which in turn raises the revenue of tangible assets (Bank et al. 2020). This suggests brand value contribution at 20% of the S&P 500 market capitalization (Ocean Tomo 2017). The financial statements of Apple corporation show $933 million in advertising expenses, but the corresponding asset for these costs is the brand value of $87.1 billion (Badenhausen 2012).
In order to identify the sustainable impact of brand, several financial variables related to the company’s valuation approaches were studied, such as stock return, market value, market risk, and Tobin’s Q ratio, which led to formulating several models of the complementary relationship between the two variables (Bank et al. 2020). Basically, if the market value of the company significantly exceeds the replacement value of its tangible assets, there is a high perceived value for its immaterial assets, such as a brand (Suleimankadieva et al. 2019).
Following the path of relative studies using an interdisciplinary methodology, the current study adds new evidence of the role of brand in firm value in emerging markets, unlike the vast majority of previous studies conducted in developed markets. The Middle East region has not been addressed in such research. Furthermore, the moderating effect of agency cost was analyzed to explore individual differences resulting from the level of decision governance. Therefore, this study contributes to the theoretical literature of the investor response to intangible marketing assets in the framework of the marketing–finance interface, using a proposed valuation model. Thus, it involves brand relevance information along with some accounting indicators.
The paper is structured as follows: the second section presents the theoretical background of brand aspects and relevant literature of the brand–firm value relationship. Section 3 involves the research data and adopted methodology, while the empirical results are displayed and discussed in Section 4. The final section offers some conclusions.
2. Literature Review
2.1. Brand–Share Return Relationship
Despite the pivotal position of the brand in marketing concepts, brand equity measuring as a concept is still among the tasks on the researchers’ agenda (Oliveira et al. 2018). It is still not clear how to identify the borders between brand connected concepts, for instance, brand equity and brand value are still used synonymously (El Zein et al. 2019). Brand equity refers to the financial value created from customer reaction to the brand marketing. It involves three concepts: a group of intellectual associations, the higher price compared with rivals, and the share price premium (Anderson 2011). Further brand equity produces two complementary components. First, the brand’s strength, which indicates sustainable competitive advantage resulting from an interactive relationship with stakeholders. Second, the brand value, which is the financial outputs measured by profit and cash flow improvements and risk reduction through a variety of marketing actions (Srivastava and Shocker 1991). Basically, the role of brand on performance is evident from the customer as a focal point of a company’s activities, aimed at attracting new clients and maintaining a long-term relationship with existing ones. Thus, achieving a competitive position allows a greater profit margin. In other words, product added value results from a customer response, which in turn creates his loyalty (Bank et al. 2020).
Brand equity valuation has become one of the most important issues in financial research owing to the strategic function of brand value by ensuring the efficient allocation of resources to maximize the value, particularly by directing marketing spending towards the optimal brand portfolio that goes beyond the customer side to firm value effect (Abratt and Bick 2003). Therefore, many approaches and models have been developed in the brand equity valuation arena on both a customer and financial basis by researchers (Aaker 1996; Keller 2001; Tasci 2020) or by consultancy companies such as Brand Finance, Interbrand, Millward Brown, and Forbes that issue periodical rankings of firms’ brand values around the world.
In the context of the capital market, the extent to which intangible assets like brand equity are reflected in firm value depends on the market efficiency level (Zimmermannová 2020), and thus their reported number in the published financial statements (Chan et al. 2001). Therefore, scholars asserted a significant link between brand equity and future firm value (Aaker 1996). Consequently, several researches used asset-pricing models such as CAPM (Capital Asset Pricing Model) of Fama and French (1993), and Carhart’s momentum four-factor models (1997) to manifest the role of brand in boosting share return or associated risk reduction. A set of related studies are presented in Table 1.
Companies with high brand capital investment have a higher mean of returns than companies with less brand capital investment. Companies with greater brand investment per employee gain higher returns (Belo et al. 2014). Furthermore, using Carhart’s four-factor model, Madden et al. (2006) inferred that Interbrand’s most valuable brand portfolio has a higher return and lower risk compared with other listed companies’ portfolios. This was confirmed by Fehle et al. (2005) when high brand value portfolio performance portfolios were compared with low brand value portfolios. With the same logic, brand familiarity in the product market extends to the capital market. Billet et al. (2014) showed that the most popular brand portfolio has a higher market-to-book level in the three-factor CAPM model by dividing listed companies into some portfolios based on client prospects for 1200 brands. In relation to brand value announcements, abnormal returns are driven by the announcement due to investors’ convocation about the highly valued brand ability to mitigate the company’s susceptibility to the consequences of cash flow fluctuations (Dutordoir et al. 2015). The same applies to changes in brand quality that influence shareholders’ equity through a positive impact on returns and negative impact on both systemic and idiosyncratic risk. For instance, a positive impact can be reached when employees’ commitment and customer loyalty are accelerated by open innovation (Krajcsák 2020). This impact is most pronounced in high competition industries measured by concentration degree (Bharadwaj et al. 2011). In contrast, Johansson et al. (2012) concluded that valuable brand portfolios based on the EquiTrend ranking performed better than the market during the subprime crisis in 2008 using three-factor CAPM. There is no notable impact within valuable brand firms of Interbrand portfolios because of the measure variation used by two rankings.
From an emerging market perspective, Oliveira et al. (2018) compared the performance of high brand values listed on five Latin America capital markets and included in the Millward Brown report with other listed firms’ portfolios. The authors found that investors of valuable brand portfolios enjoy a lower level of investment risk depending on Carhart’s four-factor model outputs. In China, the largest emerging market, Wang and Jiang (2019) demonstrated the mediating role of financial analysts’ recommendations as the information channel between brand value and sustainable performance of listed firms indicated by an abnormal return and risk level in the CAPM three-factor model. In this case, the analysts tended to positively recommend the high value brand shares, especially in highly competitive industries. Likewise, most valuable Turkish brands of listed companies covered by the Brand Finance report are not fully priced on the stock exchange because of high abnormal return and lower risk market level margin (Bank et al. 2020). Based on the literature and to bridge the research gap of brand impact on Arab emerging markets, the first hypothesis was established:
Hypothesis 1 (H1).
The brand equity has a significant impact on share return in Arab markets under study.
2.2. The Moderating Role of Agency Costs
Agency costs present all costs incurred by the company to ensure that the activities of the agent managers are aligned with the objectives of the principle owners. In other words, the reduction of the negative impact of interests’ conflict between the two parties is perfectly applicable to a public listed company where shareholders need to monitor non-owner managers’ behavior (Jensen and Meckling 1976; Singh and Davidson 2001; Chandler 2018). Inherently, governance mechanisms aim to minimize unfavorable repercussions of the agency problem, and hence lower agency costs (Huu Nguyen et al. 2020). Because of the purpose of this kind of cost, agency costs connect to firm performance through cash flow channels in two ways. First, a high competition level in the product market leads to lower agency costs, whereas the limited chance to achieve a cash flow surplus compared with competitors pushes shareholders to tighten control over managers’ decisions (Mitton 2004; Karuna 2007). Second, agency costs are linked adversely to debt portion in the company financial structure as financial leverage guides managers to serve debt, thus the need for cash flow contributes to more profitable actions by managers. In other words, they are reducing ineffective decisions to invest in cash flow surplus (Cheng and Tzeng 2011). In contrast, several empirical studies investigate the link between agency cost and ownership structure. Ang et al. (2000) pointed out that these costs are lower in the case of managers’ ownership or lender banks’ significant ownership in small and medium enterprises (SMEs) that confirmed the letter for large companies by Singh and Davidson (2001). Additionally, agency costs increase with high ownership, and vice versa, in the case of state ownership in China’s emerging markets (Rashid Khan et al. 2020). In conjunction with agency problems, the literature assays the role of corporate governance factors in their resulted costs with some lower agency costs, such as the duality of the chair–CEO position and institutional members of board, while board size and board independence are related to higher incurred agency costs (Vijayakumaran 2019; McKnight and Charlie 2009; Huu Nguyen et al. 2020).
Through their connection to the decision-making framework of a company, agency costs can be considered as a proxy of governance quality for the maintenance of stakeholders’ financial interests, including customers and shareholders, by enhancing the operational functions in the light of efficient control, which is interrelated to the link between intangible marketing assets and firm value linkage. In this case, the convenient actions of managers led to effective cash flow investment, which in turn elevated the outcomes of marketing investment. Accordingly, the second hypothesis was established:
Hypothesis 2 (H2).
Agency costs moderate the relationship between brand equity and share return.
3. Data and Methodology
Contrary to the related literature, there is no comprehensive annual brand ranking with an acceptable time series in the Arab Gulf market. According to the Financial Times Stock Exchange (FTSE) classification, four secondary emerging markets were selected (Qatar, Dubai, Abu Dhabi, Kuwait) based on the same economic and social circumstances, as well as the structure of the financial market. The listed companies within the constituents of the FTSE Emerging Index were identified and some specific characteristics were applied to determine the final sample as follows:
- Company has accounting data for consecutive years between 2010 and 2019.
- The accounting period ends on 31 December.
- The company is considered within the FTSE Emerging Index constituents for a minimum of four periods.
- The book value is positive for all series years.
- The company has a clear branded product or service, and operates in a competitive market, that is, it does not have an absolute monopoly position.
The final sample includes 36 companies (360 observations) that present more than 50% of trading value in markets in which they are listed, and 3% of the FTSE Emerging Index weight.
Market value is significantly related to the future of a firm from an investor’s point of view, depending on many indicators of risk level such as earning, cash flow, and dividends. Undoubtedly, residual earning models have gained wide attention from valuation literature owing to their theoretical added value in connection with the informative content of the difference between earnings and the investment cost incurred to get this earning (Barniv and Myring 2006). Furthermore, Ohlson’s 1995 model has been used in this study as one of the most common and cited residual-earning based models, as it provides a logical framework of market value–residual earning linkage on the one hand, and takes other value resources into account on the other. This is especially relevant for the goodwill role in value creation (Richardson and Tinaikar 2004), which is in line with the concept of intangible marketing assets as a supplement to accounting information.
Starting from the linear information dynamics assumption of the Ohlson model, the relationship between residual earnings and firm value is as follows:
where = market share price; = book value of equity at date t; = other information rather than accounting figures; while = abnormal earnings per share for the period t, which is equal to book value at the previous year t − 1 multiplied by the risk-free rate. For that, according to Ohlson (1995), abnormal earnings are the output of the subtraction of normal earnings from actual earning, as in (2):
= earnings per share for period t; = normal earning for period t − 1.
The above mathematical relationship (1) presents the market response to available accounting information included in the financial statement, as well as other information provided by other resources as proxy to measure the innovation level of the firm.
In the same manner, Ohlson proposed the return expression (3) depending on lagged uncertain earnings and embedded innovation information (Ohlson 1995):
In order to estimate the informative role of marketing within the model, the other information variable is replaced by brand equity that is consistent with related interdisciplinary studies (i.e., Sullivan and McCallig 2009; Duqi and Torluccio 2010). Brand equity is calculated based on the perpetuation approach, where the brand equity value reflects the cash flow growth of a firm’s operations discounted to an acceptable investment rate from the shareholders’ perspective. Therefore, brand equity has been calculated by dividing revenue less marketing cost to weighted average cost of capital (WACC). Brand perpetual value is a numerical comprehensive measurement considering a brand as a perpetual asset concordant with the intangible marketing assets function in cash flow generation/revenue increasing, and is also connected to the capital market response via the WACC rate (Bahadir et al. 2008).
Some control variables are added that are consistent with previous interdisciplinary studies in order to show the individual differences of companies within the sample on the one hand, and to control any illogical effects on the statistical test on the other hand (Bharadwaj et al. 2011). Basically, the size of firm is measured by the natural logarithm of the assets on 31 December and the difference of oil prices as a proxy of the economic situation in oil exporting countries, which leads to the main model of this study as follows:
Moreover, the moderator variable was added to Equation (4) to identify the role of agency cost (AGECO) in the return-brand model. AGECO is measured by the asset utilization ratio by dividing the revenue by assets. This ratio interprets the investment decisions’ efficiency, where a high ratio refers to less efficient asset allocation (Ang et al. 2000).
In Equation (5), explains the reaction of the market against the accounting earnings presented by abnormal (residual) earnings, which has been discussed previously in the framework of capital market-based accounting research, while determines the level of market response as a result of brand equity impact.
Dynamic-panel regression was used to analyse the impact of independent variables on dependent variables using the random effect model based on the Hausman test (1978), which controls for unobserved effects within the panel level. A generalized method-of-moments (GMM) was applied. The GMM process includes that the population moment is replaced with its sample counterpart (Arellano and Bond 1991). The GMM method employs the first differences of explanatory variables as instruments practically, where the parameter u is shown to be related to some expected value in the distribution of Y, a standard error with an expected value and covariance as E(u) = 0 and cov (x, u) = 0 (Maddala and Lehiri 2009). This also addresses the problem of autocorrelation and heteroscedasticity of explanatory variables, and model designation is assured as a zero autocorrelation in first-differenced errors (Arellano and Bond 1991).
Variable discerption is presented in Appendix A. All values were converted to U.S. dollar to ensure homogeneity of data. Furthermore, secondary data of fundamental financial figures and data related to share price of sample company were extracted from Thomson Reuters Refinitiv DataStream, as well as from official websites of markets and companies in the case of missing data.
4. Results and Discussion
4.1. Descriptive Statistics
The study investigates the role of brand on share performance from 2010 to 2019 in the markets under study. Table 2 presents descriptive statistics of the sample data.
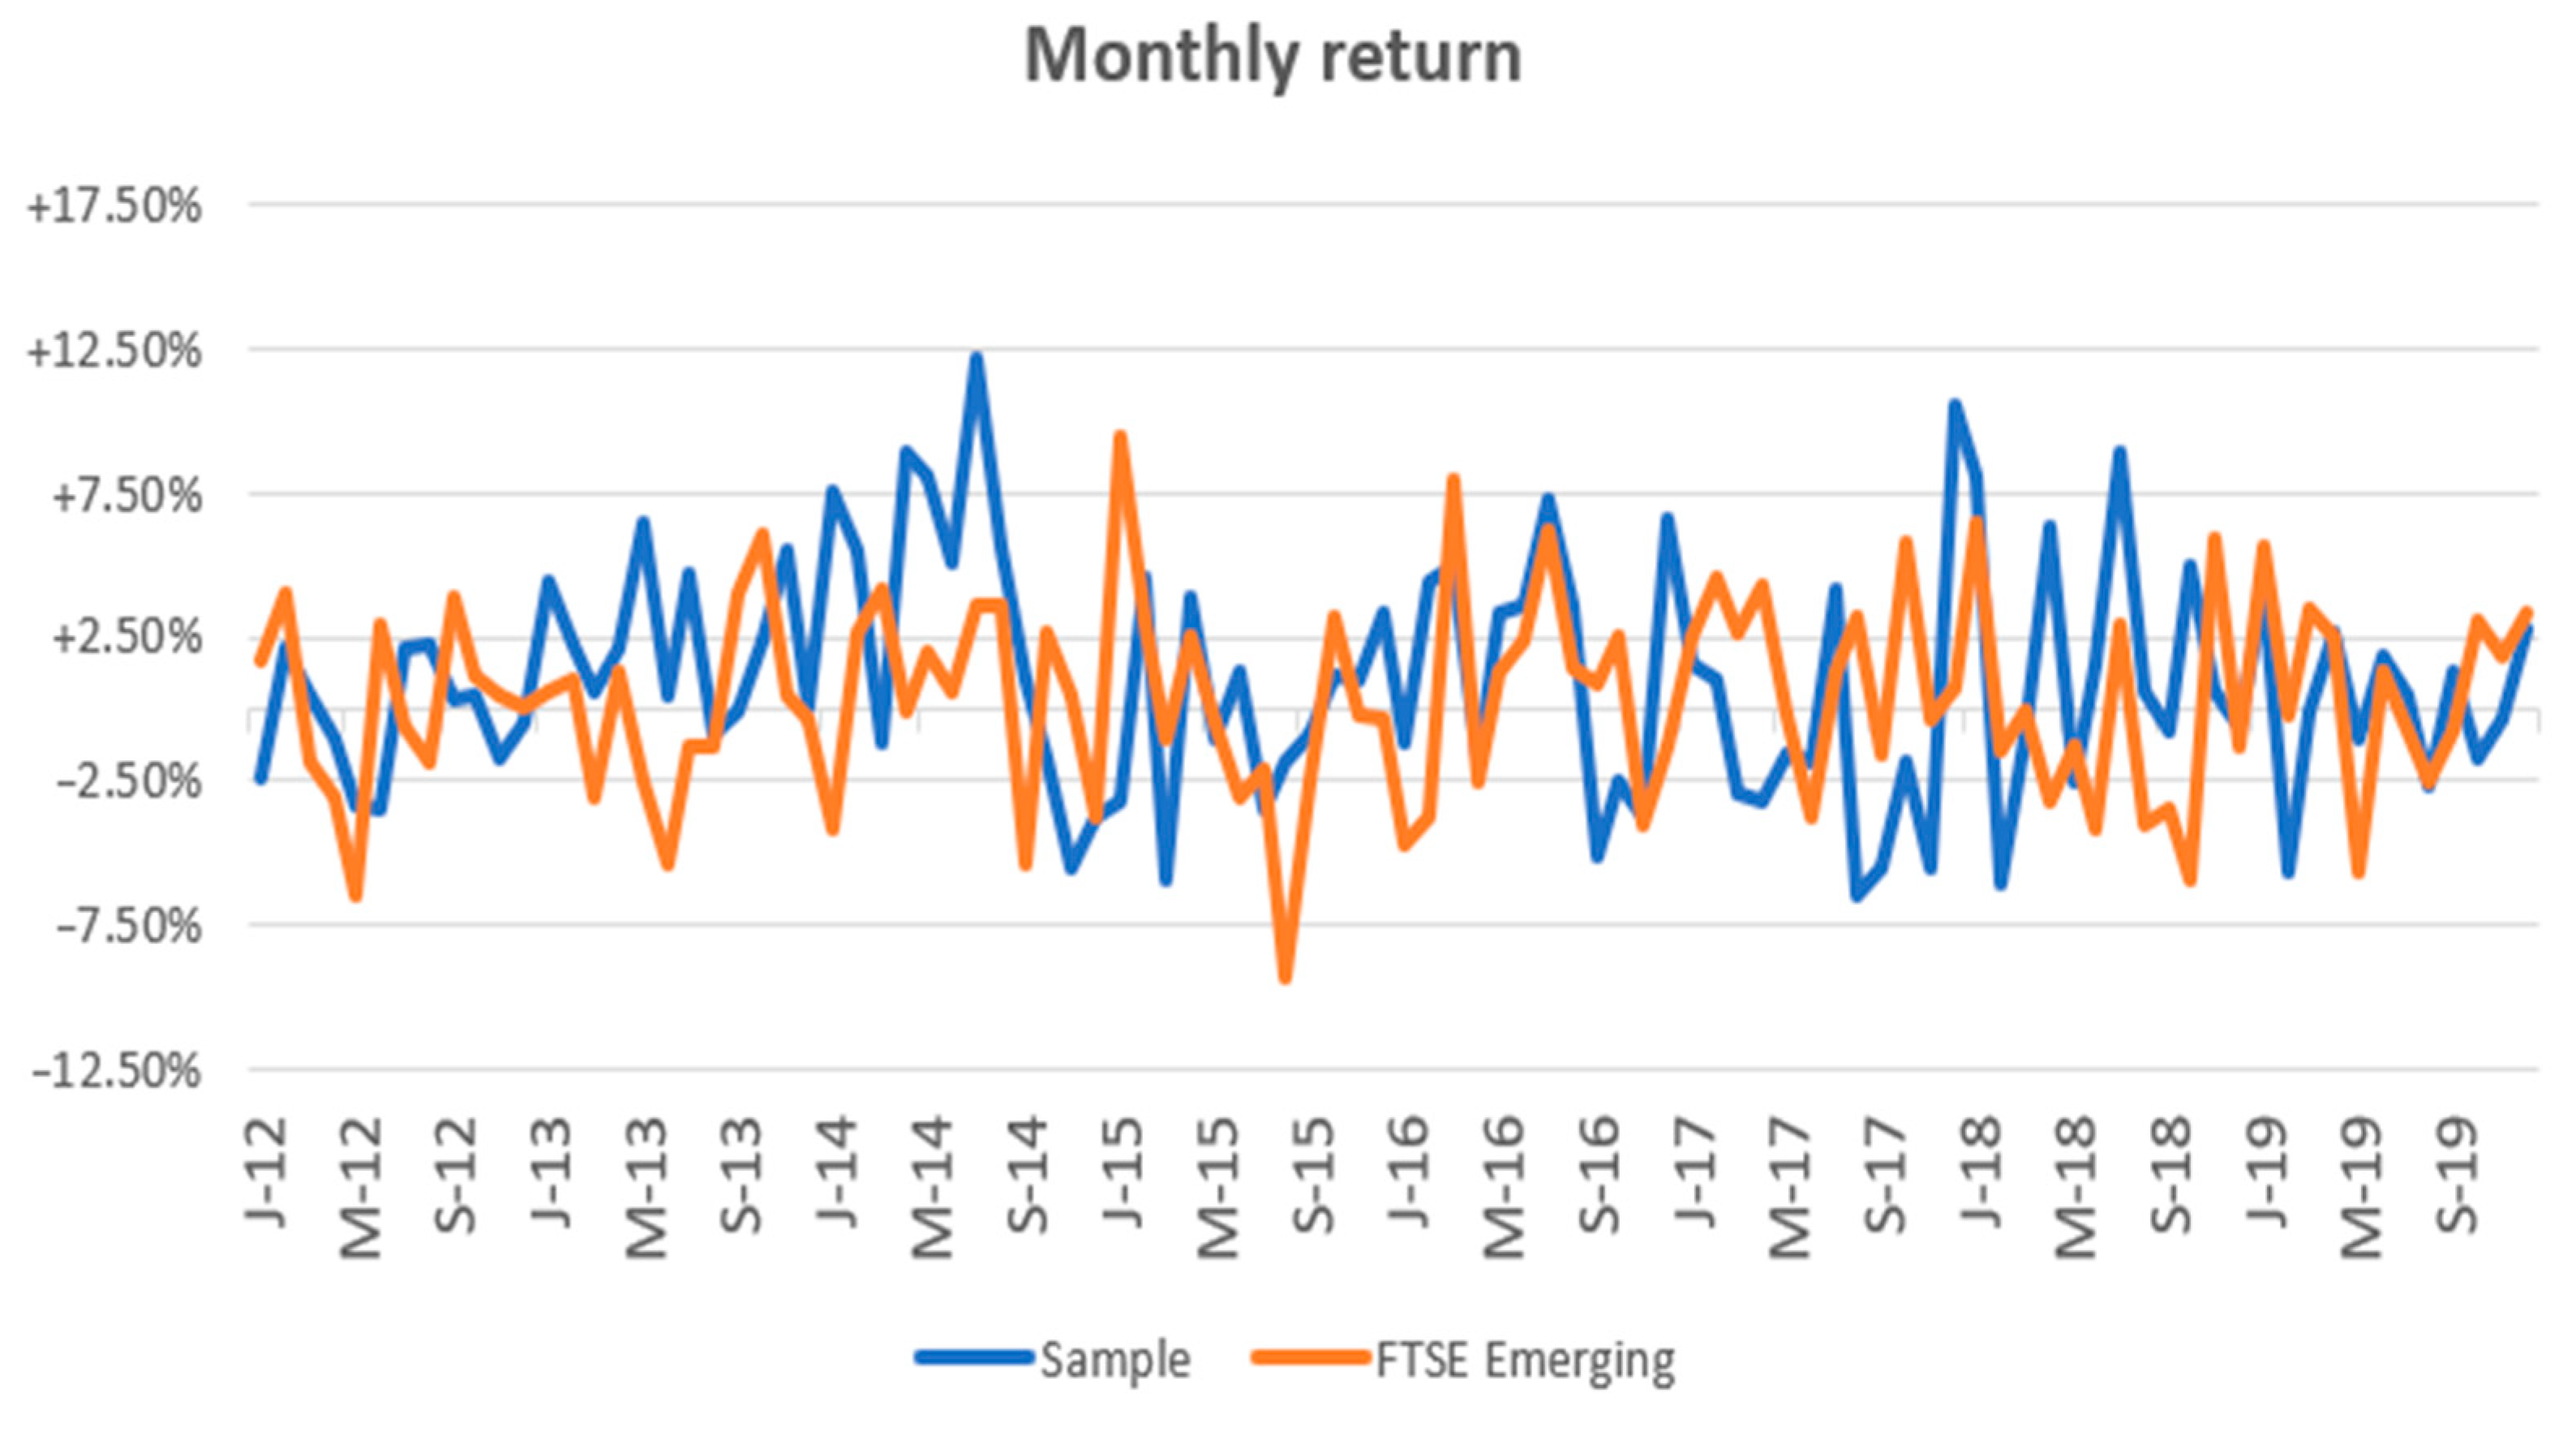
The average of sample return is 20.9%, with higher excess returns compared with the FTSE Emerging Index, as presented in Figure 1, and the average of book value is $1.17, which indicates the superior performance of sample companies compared with the par value, which is not more than in $0.32. The average of abnormal returns X is close to $0.07, referring to the margin where the operational return level in sample companies is in excess of the normal return. In connection to agency cost, the average was 22.9%, widely distributed between 0.005 and 2.2 times. On the other hand, the Beta average of the sample was 0.84 times, pointing to a convergent level of volatility between each individual stock and the market as a whole, which indicates that the sample companies have approximately the same risk level of markets because the sample involves most of the blue-chip companies in markets under examination and, therefore, a significant component of the market indices in which they are listed. Finally, the ratio of market to book value (P/B) ranges between 0.26 and 6.65 times, with an average of 1.57 times. This provides evidence of value created by intangible assets in general and marketing assets in particular. This shows that the average is close to the international average at 1.7 and 1.8 in developed markets, and more than the average of emerging markets at 1.3 and Middle East markets at 1.1 (Star Capital 2020).
4.2. Regression Results and Hypotheses Test
In Table 3, the outputs of GMM regression are illustrated between abnormal return change and brand value change in light of the research model. The findings refer to the significant impact of brand variable on share return controlled by size and oil price, which is similar to the results of related studies such as Kirk et al. (2013) and Oliveira et al. (2018). According to the R-squared value, the independent variables (mainly residual earning and brand) explain 23.4% (adjusted 12.9%) of the variance of sample portfolio return, which supports the first hypothesis of the brand’s direct impact on share return.
Table 4 presents the regression results with the moderating impact of agency costs. Based on statistical outputs, agency costs increase the significance level of brand impact on return as well as the moderating impact. Additionally, the explanatory power of the model increases by 10% (R-squared = 33.4%, adjusted = 24.1%) compared with the direct impact model, which supports the second hypothesis of the agency costs’ moderating role. It is worth noting that the negative coefficient of the agency costs variable refers to a diminution effect of this kind of cost in light of agency theory principles; that is, to the practical management self-interest behavior, which overburdens shareholders’ return (Jensen and Meckling 1976). The results related to the moderator variable show the importance of governance mechanisms in performance enhancement. In other words, the results highlight the moderating role of agency costs in the relationship between marketing assets and firm value, meaning that good corporate governance increases the degree of marketing investment efficiency in value creation.
Furthermore, oil prices play a remarkable role in sample portfolio return as all markets in the study are net oil exporting, which in turn leads to a significant correlation direction, which has been reported in Arab Gulf studies (Dutta et al. 2017; Ben Cheikh et al. 2018).
To ensure the robustness of basic results, we used an alternative proxy for both brand equity and agency costs. The marketing expenditure to total assets ratio was used to measure the brand equity because marketing investment is the main output of creating a firm brand equity according to prior studies (Luo 2008; Ryoo et al. 2016). In relation to agency cost, following relative studies in financial and governance literature (i.e., Jensen 1986), the free cash flow to total assets ratio was used to measure the role of agency cost. Table 5 presents the results of alternative measures.
The robustness of these outcomes in Table 5 is in line with the original findings regarding the direct impact of brand on share return, as well as the moderating role of agency costs on the proposed valuation model. In general, these results confirm the reliability of our regression model to present the brand–share return relationship.
The statistical results confirm the findings of prior financial research works in relation to residual earnings’ impact on return, and support the literature relating to the residual earning valuation model by demonstrating the validity of the Ohlson model in assessing the value of the selected sample stocks. In other words, the informative content of current earnings for predicting future performance (Graham et al. 2005; Mizik and Jacobson 2009). At the same time, adding brand variables promotes the model’s valuation power, which is in harmony with other information elements in the Ohlson model and emphasizes the mechanisms of cash flow generation via intangible marketing assets or reducing connected cash flow volatility (Srivastava et al. 1998). On the other hand, our findings provide new evidence about the interactive marketing–financial value relationship. This evidence confirms the pivotal and dual role of the marketing function in improving value in capital market side to side to the traditional role in delivering value to customers.
Synchronously, the results of this paper are corroborative to the CAPM model, which assesses the impact of marketing assets on valuation models in both emerging and developed markets, as the measurement of brand perpetual value corresponds with the market risk hypothesis of CAPM forms. Therefore, a strong brand adds value to the company and reduces the risk associated with the company’s activities or with capital markets, especially in emerging markets, where higher risk exists owing to economic and political uncertainty. Accordingly, focusing on building a well-known brand motivates investors and ensures a high valuation of a company (Oliveira et al. 2018).
Moreover, utilizing the agency costs effect in the proposed valuation model within marketing, governance, and market value trilogy provides a promising approach for researchers under interdisciplinary methodology as well as for practitioners to improve performance and achieve goals effectively, whether in the product market or the capital market.
From a business perspective, the results enrich the debate about the reliability of marketing assets for management. Therefore, managers and decision-makers should deal with marketing expenditure as a long-term investment that will positively impact shareholders’ value. Moreover, they should deal with it as a powerful function responsible for managing and developing the value for both investors and customers. Consequently, marketing objectives must be considered as a tool for enhancing accounting performance. Furthermore, this paper’s findings support the impact of marketing intangible assets in investment decisions when the investor receives this signal and reacts accordingly. In other words, marketing actions are translated into financial outputs. Briefly, marketing applications can be an effective tool for obtaining an outstanding evaluation of the market.
Over and above, the empirical results of this paper shed light on the gap between accounting value and market value, of which a large portion is due to the intangible marketing assets, which in turn play a crucial role in shareholders’ value creation. In addition to this, and despite the specific characteristics of the Arab Gulf region, the results of this paper are found to be consistent with the findings of comparable studies in other geographical regions.
5. Conclusions
Based on sample of the most traded companies in four Arabic markets, the current research adopts the Ohlson model to theorize the value relevance of marketing assets through cash flow channels, where the elements of other information in the model can bridge the gap between intangible asset valuation and its effect on investor response. Furthermore, this study provides new evidence about brand importance in emerging markets as a market value driver, meaning that brand information as a comprehensive outcome of marketing efforts is considered by the market as a pivotal part of firm value. Additionally, agency costs boost the brand–firm value relationship, which means that good governance contributes significantly to financial outcomes of marketing.
For future research, using an interdisciplinary methodology, more marketing variables could be studied in light of the marketing–firm valuation relationship, as well as considering other variables as a proxy of firm value or performance. Furthermore, the study of the customer–investor interaction would be a fitting behavioral approach to promoting marketing understanding from a behavioral point of view. Finally, other variables could be studied as a moderator to demonstrate the integrative relationship between marketing and other corporate practices to create and maximize value in emerging markets.
Author Contributions
Conceptualization, M.M. and J.S.; methodology, M.M. and J.S.; validation, M.M., J.S., and Z.Z.; formal analysis, M.M. and J.S.; investigation, J.S. and Z.Z.; resources, M.M. and J.S.; data curation, M.M.; writing—original draft preparation, M.M.; writing—review and editing, J.S. and Z.Z.; visualization, M.M.; supervision, J.S. and Z.Z.; project administration, J.S. All authors have read and agreed to the published version of the manuscript.
Funding
This research received no external funding.
Institutional Review Board Statement
Not applicable.
Informed Consent Statement
Not applicable.
Data Availability Statement
Publicly available datasets were analyzed in this study. This data can be found here: https://www.refinitiv.com/ (Thomson Reuters Refinitiv DataStream).
Acknowledgments
The researchers acknowledge the support given by Tempus Public Foundation and Szent István University, School of Economics and Regional Science through administrative and technical support.
Conflicts of Interest
The authors declare no conflict of interest.
Appendix A

Table A1.
Variables’ description and measurements.
| Variable | Code | Description | Recourse |
|---|---|---|---|
| Return | − | − ) + D]/ − where = annual closing price in period t. = annual closing price in period t − 1. D = dividends = risk-free return measured by the yield on government bonds for ten years | Own calculation based on Thomson Reuters DataStream |
| Abnormal return | operational earnings per share less the normal earning , where = risk free return, = book value of previous year | Own calculation based on Thomson Reuters DataStream | |
| Brand equity | {Total revenue − total marketing cost}/WACC Marketing cost = general administrative expenses (SG&A) minus research and development (R&D) expenses. WACC: weighted average cost of capital = WACC = VE × Re + VD × Rd × (1 − Tc) where Re = cost of equity calculated by Capital Asset Pricing Model (CAPM) r = () = the return of the market portfolio systematic risk factor calculated using moving five years’ window (60 months or at least 36) through regression estimation between monthly return of share and market index. = slop (,) Rd = cost of debt measured by debt interest rate E = market value of the firm’s equity D = market value of the firm’s debt V = E + D = total market value of the firm’s financing E/V = percentage of financing that is equity D/V = percentage of financing that is debt Tc = corporate tax rate | Own calculation based on Thomson Reuters DataStream | |
| Agency cost | AGCO | Asset utilization ratio = sales/total assets | Own calculation based on Thomson Reuters DataStream |
| Size | Size | Ln (total assets) | Thomson Reuters DataStream |
| Oil | Oil | Annual closing price of Brent crude price | Thomson Reuters DataStream |
References
- Aaker, David. 1996. Building Strong Brands. New York: The Free Press. [Google Scholar]
- Abratt, Russell, and Geoffrey Bick. 2003. Valuing Brands and Brand Equity: Methods and Processes. Journal of Applied Management and Entrepreneurship 8: 21–39. [Google Scholar]
- Anderson, Justin. 2011. Measuring the financial value of brand equity: The perpetuity perspective. Journal of Business Administration Online 10: 1–11. [Google Scholar]
- Ang, James S., Rebel A. Cole, and James Wuh Lin. 2000. Agency costs and ownership structure. Journal of Finance 1: 81–106. [Google Scholar] [CrossRef]
- Arellano, Manuel, and Stephen Bond. 1991. Some tests of specification for panel data: Monte Carlo evidence and an application to employment Equations. The Review of Economic Studies 58: 277–97. [Google Scholar] [CrossRef] [Green Version]
- Badenhausen, Kurt. 2012. Apple tops list of the world’s most powerful brands. Forbes 10. Available online: https://www.forbes.com/sites/kurtbadenhausen/2012/10/02/apple-tops-list-of-the-worlds-most-powerful-brands/?sh=63cab693cc9a (accessed on 10 March 2020).
- Bahadir, S. Cem, Sundar G. Bharadwaj, and Rajendra K. Srivastava. 2008. Financial value of brands in mergers and acquisitions: Is value in the eye of the beholder? Journal of Marketing 72: 49–64. [Google Scholar] [CrossRef]
- Bank, Semra, Evrim Yzar, and Ugur Sivri. 2020. The portfolios with strong brand value: More returns? Lower risk? Borsa Istanbul Review 20: 64–79. [Google Scholar] [CrossRef]
- Barniv, Ran, and Mark Myring. 2006. An international analysis of historical and forecast earnings in accounting-based valuation models. Journal of Business Finance & Accounting 33: 1087–109. [Google Scholar] [CrossRef]
- Belo, Frederico, Xiaoji Lin, and Maria Ana Vitorino. 2014. Brand capital and firm value. Review of Economic Dynamics 17: 150–69. [Google Scholar] [CrossRef]
- Ben Cheikh, Nidhaleddine, Sami Ben Naceur, Oussama Kanaan, and Christophe Rault. 2008. Oil Prices and GCC Stock Markets: New Evidence from Smooth Transition Models. IMF Working Paper, WP/18/98. Washington, DC: International Monetary Fund. [Google Scholar] [CrossRef] [Green Version]
- Bharadwaj, Sundar G., Kapil R. Tuli, and Andrea Bonfrer. 2011. The impact of brand quality on shareholder wealth. Journal of Marketing 75: 88–104. [Google Scholar] [CrossRef]
- Billet, Matthew T., Zhan Jiang, and Lopo L. Rego. 2014. Glamour brands and glamour stocks. Journal of Economic Behavior & Organization 107: 744–59. [Google Scholar] [CrossRef]
- Chan, Louis, Joseph Lakonishok, and Theodore Sougiannis. 2001. The stock market valuation of research and development expenditures. The Journal of Finance 56: 2431–56. [Google Scholar] [CrossRef]
- Chandler, Nicholas Guy. 2018. A Symbiotic Relationship: HR and Organizational Culture. In Organizational Behaviour and Human Resource Management. Management and Industrial Engineering. Edited by C. Machado and J. Davim. Cham: Springer. [Google Scholar] [CrossRef]
- Cheng, Ming-Chang S., and Zuawei Ching Tzeng. 2011. The effect of leverage on firm value and how the firm financial quality influence on this effect. World Journal of Management 3: 30–53. [Google Scholar]
- Duqi, Andi, and Giuseppe Torluccio. 2010. R&D Expenditure and Firm Valuation: Evidence from Europe. Paper presented at 23rd Australasian Finance and Banking Conference, Sydney, Australia, December 14; Available online: https://ssrn.com/abstract=1663205 (accessed on 10 July 2020).
- Dutordoir, Marie, Frank M. Verbeeten, and Dominique Beijer. 2015. Stock price reactions to brand value announcements: Magnitude and moderators. International Journal of Research in Marketing 32: 34–47. [Google Scholar] [CrossRef]
- Dutta Anupam, Jussi Nikkinen, and Timo Rothovius. 2017. Impact of oil price uncertainty on Middle East and African stock markets. Energy 123: 189–97. [Google Scholar] [CrossRef]
- El Zein, Samer A., Carolina C. Segura, and Ruben H. Garcia. 2019. The role of sustainability in brand equity value in the financial sector. Sustainability 12: 254. [Google Scholar] [CrossRef] [Green Version]
- Fehle, Frank, Sergey Tsyplakov, and Vladimir Zdorovtsov. 2005. Can Companies Influence Investor Behaviour through Advertising? Super Bowl Commercials and Stock Returns. European Financial Management 11: 625–47. [Google Scholar] [CrossRef]
- Graham, John R., Campbell R. Harvey, and Shiva Rajgopal. 2005. The economic implications of corporate financial reporting. Journal of Accounting and Economics 40: 3–73. [Google Scholar] [CrossRef] [Green Version]
- Hanssens, Dominique M., and Koen H. Pauwels. 2016. Demonstrating the value of marketing. Journal of Marketing 80: 173–90. [Google Scholar] [CrossRef]
- Huu Nguyen, Anh, Duong Thuy Doan, and Linh Ha Nguyen. 2020. Corporate governance and agency cost: Empirical evidence from Vietnam. Journal of Risk and Financial Management 13: 103. [Google Scholar] [CrossRef]
- Jensen, Michael C., and William H. Meckling. 1976. Theory of the Firm: Managerial Behavior, Agency Costs and Ownership Structure. Journal of Financial Economics 3: 305–60. [Google Scholar] [CrossRef]
- Jensen, Michael. 1986. Agency Costs of Free Cash Flow, Corporate Finance, and Takeovers. The American Economic Review 76: 323–29. [Google Scholar]
- Johansson, Johny K., Claudiu V. Dimofte, and Sanal K. Mazvancheryl. 2012. The performance of global brands in the 2008 financial crisis: A test of two brand value measures. International Journal of Research in Marketing 29: 235–45. [Google Scholar] [CrossRef]
- Karuna, Christo. 2007. Industry product market competition and managerial incentives. Journal of Accounting and Economics 43: 275–97. [Google Scholar] [CrossRef]
- Keller, Kevin Lane. 2001. Building Customer-based Brand Equity: A blueprint for Creating Strong Brands. Report No. 01-107. New York: Marketing Science Institute, pp. 1–31. [Google Scholar]
- Kirk, Coleen P., Ipshita Ray, and Berry Wilson. 2013. The impact of brand value on firm valuation: The moderating influence of firm type. Journal of Brand Management 20: 488–500. [Google Scholar] [CrossRef]
- Krajcsák, Zoltán. 2020. Implementing Open Innovation Using Quality Management Systems: The Role of Organizational Commitment and Customer Loyalty. Journal of Open Innovation: Technology, Market, and Complexity 5: 90. [Google Scholar] [CrossRef] [Green Version]
- Laghi, Enrico, Michele Di Marcantonio, Valentina Cillo, and Niccolo Paoloni. 2020. The relational side of intellectual capital: An empirical study on brand value evaluation and financial performance. Journal of Intellectual Capital. [Google Scholar] [CrossRef]
- Lev, Baruch, and Paul Zarowin. 1999. The boundaries of financial reporting and how to extend them. Journal of Accounting Research 37: 353–85. [Google Scholar] [CrossRef] [Green Version]
- Littunen, Hannu. 2000. Entrepreneurship and the characteristics of the entrepreneurial personality. International Journal of Entrepreneurial Behavior & Research 6: 295–310. [Google Scholar] [CrossRef]
- Luo, Xueming. 2008. When marketing strategy first meets Wall Street: Marketing spending and firms’ initial public offerings (IPOs). Journal of Marketing 72: 98–109. [Google Scholar] [CrossRef]
- Maddala, G. S., and Kajal Lehiri. 2009. Introduction to Econometrics, 3rd ed. Hoboken: Wiley, p. 625. [Google Scholar]
- Madden, Thomas J., Frank Fehle, and Susan Fournier. 2006. Brands matter: An empirical demonstration of the creation of shareholder value through brands. Journal of the Academy of Marketing Science 3: 224–35. [Google Scholar] [CrossRef]
- McKnight, Philip, and Weir Charlie. 2009. Agency costs, corporate governance mechanisms and ownership structure in large UK publicly quoted companies: A panel data analysis. The Quarterly Review of Economics and Finance 39: 131–57. [Google Scholar] [CrossRef] [Green Version]
- Mitton, Todd. 2004. Corporate governance and dividend policy in emerging markets. Emerging Markets Review 5: 409–26. [Google Scholar] [CrossRef]
- Mizik, Natalie, and Robert Jacobson. 2009. Valuing branded businesses. Journal of Marketing 73: 137–53. [Google Scholar] [CrossRef]
- Ocean Tomo. 2017. Intangible Assets Market Value Study. Available online: https://www.oceantomo.com/intangible-asset-market-value-study/ (accessed on 2 April 2020).
- Ohlson, James A. 1995. Earnings, book values and dividends in equity valuation. Contemporary Accounting Research 11: 661–87. [Google Scholar] [CrossRef]
- Oliveira, Martha Olivia Rovedder, Aline Armanini Stefanan, and Mauri Leodir Lobler. 2018. Brand equity, risk and return in Latin America. Journal of Product & Brand Management 27: 557–72. [Google Scholar] [CrossRef]
- Pham, Thach Ngoc, Vuong Minh Nguyen, and Duc Hong Vo. 2018. The Cross-Section of Expected Stock Returns: New Evidence from an Emerging Market. Emerging Markets Finance and Trade 54: 3566–76. [Google Scholar] [CrossRef]
- Rashid Khan, Haroon-Ur, Waqas Bin Khidmat, Osama Al Hares, Naeem Muhammad, and Kashif Saleem. 2020. Corporate governance quality, ownership structure, agency costs and firm performance. Evidence from an emerging economy. Journal of Risk and Financial Management 13: 154. [Google Scholar] [CrossRef]
- Richardson, Gordon, and Surjit Tinaikar. 2004. Accounting based valuation models: What have we learned. Accounting and Finance 44: 223–55. [Google Scholar] [CrossRef]
- Rust, Roland T., Katherine N. Lemon, and Valarie A. Zeithaml. 2004. Return on marketing: Using customer equity to focus marketing strategy. Journal of Marketing 68: 109–27. [Google Scholar] [CrossRef] [Green Version]
- Ryoo, Juyoun, Jin Q. Jeon, and Cheolwoo Lee. 2016. Do marketing activities enhance firm value? Evidence from M&A transactions. European Management Journal 34: 243–57. [Google Scholar] [CrossRef]
- Singh, Manohar, and Wallace N. Davidson. 2001. Agency costs, ownership structure and corporate governance mechanisms. Journal of Banking & Finance 18: 473–90. [Google Scholar] [CrossRef]
- Singh, Manohar, Sheri Faircloth, and Ali Nejadmalayeri. 2005. Capital market impact of product marketing strategy: Evidence from the relationship between advertising expenses and cost of capital. Journal of the Academy of Marketing 33: 432–44. [Google Scholar] [CrossRef]
- Srivastava, Rajendra K., and Allan D. Shocker. 1991. Brand Equity: A Perspective on Its Meaning and Measurement. Marketing Science Institute Working Paper Series Report. Cambridge: Marketing Science Institute, pp. 91–124. [Google Scholar]
- Srivastava, Rajendra K., Shervani A. Tasadduq, and Liam Fahey. 1998. Market-Based Assets and Shareholder Value: A Framework for Analysis. Journal of Marketing 62: 2–18. [Google Scholar] [CrossRef] [Green Version]
- Star Capital. 2020. Global Stock Market Valuation Ratios. Available online: https://www.starcapital.de/en/research/stock-market-valuation/ (accessed on 2 February 2020).
- Suleimankadieva, Aljanat. E., Valeria I. Pilipenko, and Judit Sági. 2019. Knowledge Company: Approaches to Assessing New Knowledge and Representation it to Society. Procedia Computer Science 150: 730–36. [Google Scholar] [CrossRef]
- Sullivan, Don, and John McCallig. 2009. Does customer satisfaction influence the relationship between earnings and firm value? Marketing Letters 20: 337–51. [Google Scholar] [CrossRef]
- Tasci, Asli D. A. 2020. A critical review and reconstruction of perceptual brand equity. International Journal of Contemporary Hospitality Management. [Google Scholar] [CrossRef]
- Vijayakumaran, Ratnam. 2019. Agency cost, ownership, and internal governance mechanisms: Evidence from Chinese listed companies. Asian Economic and Financial Review 9: 133–54. [Google Scholar] [CrossRef] [Green Version]
- Wang, Kui, and Wei Jiang. 2019. Brand equity and firm sustainable performance: The mediating role of analysts’ recommendations. Sustainability 11: 1086. [Google Scholar] [CrossRef] [Green Version]
- Zimmermannová, Jarmila. 2020. Methods in Microeconomic and Macroeconomic Issues. Spationomy. [Google Scholar] [CrossRef] [Green Version]
Figure 1.
Sample return compared with FTSE emerging return.

Table 1.
Some related studies of the brand–firm value relationship.
| Paper | Market Scope | Methodology | Moderating Variables |
|---|---|---|---|
| Fehle et al. (2005) | Developed market—USA | CAPM three-factor and momentum four-factor | No |
| Kirk et al. (2013) | Developed market—USA | Cross-sectional regression | Firm type |
| Luo (2008) | Three developed markets: USA, UK, and Germany | CAPM three-factor and momentum four-factor | NO |
| Johansson et al. (2012) | Developed market USA | CAPM three-factor | NO |
| Billet et al. (2014) | Developed market USA | CAPM three-factor | NO |
| Bharadwaj et al. (2011) | Developed market USA | CAPM three-factor | Changes in industry concentration |
| Oliveira et al. (2018) | Five emerging markets in Latin America | CAPM three-factor and momentum four-factor | NO |
| Wang and Jiang (2019) | Emerging Market—China | CAPM three-factor | Financial analysts’ recommendations |
| Bank et al. (2020) | Emerging market—Turkey | CAPM three-factor | NO |
| Current paper | Four Emerging Arab markets | Ohlson model | Agency costs |
Source: own.
Table 2.
Descriptive statistics.
| N | Mean | Std. Deviation | Minimum | Maximum | |
|---|---|---|---|---|---|
| R | 360 | 0.2090 | 0.6310 | −0.8800 | 8.8770 |
| BRE/USD M | 360 | 8,133 | 5,522 | 491 | 73,640 |
| B | 360 | 1.1725 | 0.9060 | 0.0700 | 5.8200 |
| X | 360 | 0.0700 | 0.3020 | −0.6000 | 2.5300 |
| AGCO | 360 | 0.2290 | 0.3271 | 0.0050 | 2.2000 |
| Age | 360 | 26.39 | 17.15 | 3.00 | 67.00 |
| Beta | 360 | 0.8377 | 0.5468 | −0.9000 | 2.4400 |
| P/B | 360 | 1.5697 | 0.9310 | 0.2600 | 6.6500 |
Table 3.
Regression analysis results of brand’s direct impact on return.
| Variable | Coefficient | Std. Error | t-Statistic | Prob. |
|---|---|---|---|---|
| C | 0.162988 | 0.015143 | 10.76358 | 0.0000 |
| 0.080932 | 0.053339 | 1.517318 | 0.0303 | |
| 3.350713 | 1.221071 | 2.753886 | 0.0063 | |
| 0.250784 | 0.072821 | 3.443856 | 0.0007 | |
| 0.334040 | 0.061452 | 5.435805 | 0.0000 | |
| Weighted Statistics | ||||
| R-squared | 0.234363 | Mean dependent var | 0.224118 | |
| Adjusted R-squared | 0.129222 | S.D. dependent var | 0.594155 | |
| S.E. of regression | 0.554792 | Sum squared resid | 87.41353 | |
| Durbin–Watson stat | 1.928109 | J-statistic | 284.0000 | |
Note: This table includes the generalized method-of-moments (GMM) regression results of the Ohlson model between return as dependent variable residual earnings, brand as a proxy of other information, and control variables over the period 2010–2019.
Table 4.
Regression analysis results of agency costs moderator of brand–return.
| Variable | Coefficient | Std. Error | t-Statistic | Prob. |
|---|---|---|---|---|
| C | 0.137739 | 0.016340 | 8.429398 | 0.0000 |
| 0.092680 | 0.055358 | 1.674178 | 0.0452 | |
| 6.931407 | 2.806108 | 7.069977 | 0.0000 | |
| 0.255507 | 0.073526 | 3.475053 | 0.0006 | |
| 0.341708 | 0.064580 | 5.291196 | 0.0000 | |
| −0.509158 | 0.288937 | −1.762175 | 0.0291 | |
| Weighted Statistics | ||||
| R-squared | 0.339707 | Mean dependent var | 0.214671 | |
| Adjusted R-squared | 0.241016 | S.D. dependent var | 0.591428 | |
| S.E. of regression | 0.517187 | Sum squared resid | 75.16261 | |
| Durbin-Watson stat | 2.030494 | J-statistic | 281.0000 | |
This table includes the GMM regression results of the Ohlson model between return as dependent variable residual earnings, brand as a proxy of other information, agency costs as a moderator variable measured by asset utilization ratio, and control variables over the period 2010–2019.
Table 5.
Regression analysis results of alternative measures.
| Variable | Coefficient | Std. Error | t-Statistic | Prob. |
|---|---|---|---|---|
| C | −0.633603 | 0.628525 | −1.008079 | 0.3141 |
| −0.131992 | 0.053696 | −2.458123 | 0.0145 | |
| 7.166510 | 8.196501 | 7.998904 | 0.0000 | |
| 0.345222 | 0.071958 | 3.407869 | 0.0007 | |
| −0.389212 | 0.064280 | −6.054927 | 0.0000 | |
| −0.509158 | 0.288937 | −1.762175 | 0.0291 | |
| Weighted Statistics | ||||
| R-squared | 0.286994 | Mean dependent var | 0.214671 | |
| Adjusted R-squared | 0.272782 | S.D. dependent var | 0.212352 | |
| S.E. of regression | 0.491734 | Sum squared resid | 72.78248 | |
| Durbin-Watson stat | 1.838339 | J-statistic | 301.0000 | |
Note: This table includes the GMM regression results of the Ohlson model between return as dependent variable residual earnings, alternative brand measure as a proxy of other information, alternative agency costs as a moderator variable measured by cash flow utilization ratio, and control variables over the period 2010–2019.
Publisher’s Note: MDPI stays neutral with regard to jurisdictional claims in published maps and institutional affiliations. |
© 2021 by the authors. Licensee MDPI, Basel, Switzerland. This article is an open access article distributed under the terms and conditions of the Creative Commons Attribution (CC BY) license (http://creativecommons.org/licenses/by/4.0/).
Share and Cite
MDPI and ACS Style
Mousa, M.; Sági, J.; Zéman, Z. Brand and Firm Value: Evidence from Arab Emerging Markets. Economies 2021, 9, 5. https://doi.org/10.3390/economies9010005
AMA Style
Mousa M, Sági J, Zéman Z. Brand and Firm Value: Evidence from Arab Emerging Markets. Economies. 2021; 9(1):5. https://doi.org/10.3390/economies9010005
Chicago/Turabian StyleMousa, Musaab, Judit Sági, and Zoltán Zéman. 2021. "Brand and Firm Value: Evidence from Arab Emerging Markets" Economies 9, no. 1: 5. https://doi.org/10.3390/economies9010005
Note that from the first issue of 2016, this journal uses article numbers instead of page numbers. See further details here.