Case Report: Investigation of the Time Evolution of Optical Breakdown Plasma During Irradiation of Aqueous Solutions of Fe Nanoparticles
 Ilya V. Baimler
 Viktor K. Chevokin
  Sergey V. Gudkov
- Prokhorov General Physics Institute of the Russian Academy of Sciences, Moscow, Russia
The time sweeps of images of optical breakdown plasma flashes under irradiation of aqueous solutions of Fe nanoparticles with Nd: YAG laser radiation (λ = 1,064 nm, τ = 10 ns, ν = 10 kHz, ε = 2 mJ) are studied. It is shown that the sizes of plasma flares, the plasma glow intensity, and the time to reach the maximum intensity are concentrated around certain values. So, for example, the values of 30 μm are most typical for the maximum size of flares. The maximum luminescence is usually reached in 3–4 ns. It is found that at initial stage of optical breakdown process the water-vapor boundary moves at typical speed of 11 km/s and have maximum and minimum values at 15 and 4 km/s respectively. It is assumed in this work that such a distribution may be associated with the initiation of breakdown on nanoparticles located in different places of the laser radiation waist.
Introduction
Nowadays, the process of optical breakdown is being intensively studied [1–3]. Practical application is mainly associated with the process of laser ablation of metal targets in liquids for the generation of nanoparticles, as well as the LIBS and NELIBS methods, based on the study of plasma spectra induced by laser radiation on the surface of samples or on nanoparticles [4, 5]. The LIBS technique can be used to study samples in liquids [6]. It has been investigated that optical breakdown occurs several times more intense in the presence of impurities in the liquid and, especially, nanoparticles of various metals [7]. Other distinctive features of optical breakdown in a liquid are the processes of formation of decay products of liquid molecules as a result of interaction with the breakdown plasma, intense generation of shock waves, the formation of cavitation bubbles, etc. [8–10]. At the moment, one of the main directions in this area is the study of the process of optical breakdown of liquids at early stages, i.e. at the moment of the formation of the breakdown plasma and the formation of the cavitation area [11]. The practical application of these results is closely related to medicine and laser surgery as lasers with femto- and nanosecond pulse duration often used in these areas [12, 13].
The aim of this work is to experimentally study the formation and evolution of breakdown plasma at nanosecond scale over time using a high-speed strip camera.
Methods
Fe nanoparticles were obtained using the laser ablation technique in water. To generate nanoparticles, a Nd: YAG laser was used with the following characteristics: λ = 1,064 nm, τ = 100 ns, ν = 10 kHz, ε = 1 mJ. Milli-Q water (150 ml) was used as a working fluid for ablation. The thickness of the liquid layer between the metal target and the water surface was 2–3 mm. The ablation time was 30 min. The Fe nanoparticles obtained using the laser ablation technique were then analyzed in a CPS disc centrifuge. The studied nanoparticles had a spherical shape and a unimodal particle size distribution with an average nanoparticle diameter of 36 nm, Figure 1A.
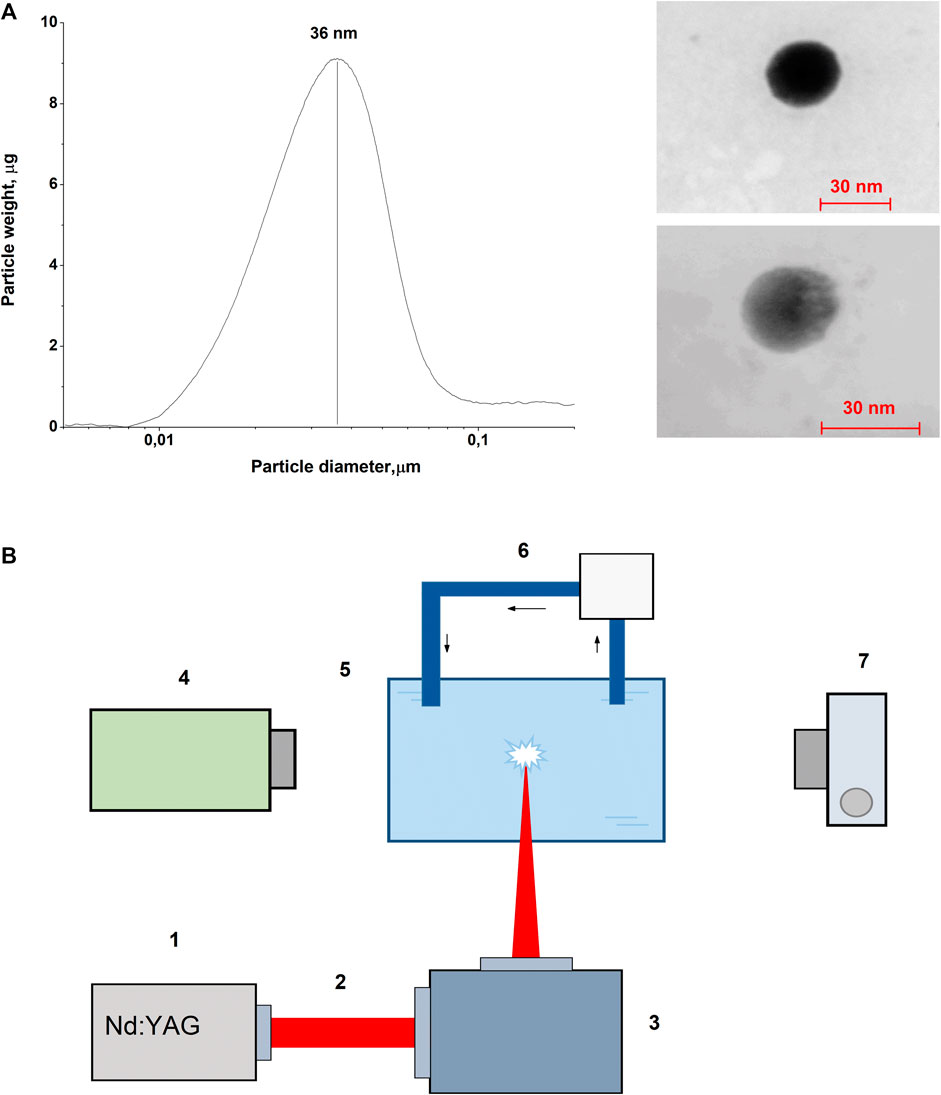
FIGURE 1. (A)- weight distribution of Fe nanoparticles by size (left) and TEM—images of Fe nanoparticles (right). (B)- Diagram of the experimental setup. 1—Laser radiation source, λ = 1,064 nm, τ = 10 ns, ν = 10 kHz, ε = 2 mJ; 2—Laser radiation; 3—Galvano-optical system of mirrors; 4—strip-camera; 5—Experimental cuvette with a colloidal solution of Fe nanoparticles (n = 109 NP/ml); 6—Peristaltic pump; 7- Digital camera.
A schematic view of the experimental setup for studying optical breakdown plasma is shown in Figure 1B. The obtained Fe nanoparticles were added to a glass cuvette filled with Milli-Q water in a volume of 150 ml. The water in the cuvette was constantly pumped with a peristaltic pump in order to weaken the effect of the process of laser fragmentation of nanoparticles and preserve the initial distribution of nanoparticles. The added volume of the solution of Fe nanoparticles was about 50 μL; thus, it was assumed that the resulting volume of liquid in the cuvette did not change. The concentration of nanoparticles added to the cuvette was selected so that the irradiated colloidal solution in the cuvette contained approximately 109 NP/ml. The specified concentration of nanoparticles was selected based on the following considerations. The probability of breakdown at a given concentration of nanoparticles is close enough to 100%. At the same time, at such concentrations of nanoparticles, one laser pulse usually has a single breakdown, as it was shown in [14].
The radiation of a Nd: YAG laser (λ = 1,064 nm, τ = 10 ns, ν = 10 kHz, ε = 2 mJ) was focused into the center of the cell. The size of the laser radiation waist at the focusing point was about 40 μm, and the laser radiation energy density at the focus was 160 J/cm2. With the help of a galvano-optical system of mirrors, the radiation was moved inside the cell at a speed of 3,000 mm/s. Thus, optical breakdowns corresponding to successive laser pulses were separated from each other by a distance of about 0.3 mm. The movement of laser radiation inside the cuvette is dictated by the need to avoid overheating of the liquid at one point. Overheating of the liquid, in turn, leads to the effect of thermal defocusing of laser radiation. The irradiation time was 1 min. The temperature of solution after irradiation did not change significantly and was 25°C.
Optical breakdown images were obtained using a Canon-75D digital camera (Japan). A time sweep of the intensity and size of the optical breakdown was obtained using a VICA-75F strip camera. The time and spatial resolution of the camera is 1 ns and 10 μm, respectively. The spatial resolution of the camera was calibrated using the images of plasma flashes from the digital camera. The average size of one breakdown plasma flash was measured from the digital camera image and then it was assumed that this size corresponds to the plasma diameter on strip-camera images. The average size of breakdown plasma obtained from digital camera images was 65 μm. The average size of breakdown plasma obtained from strip-camera images was approximately 35 pxl. Thus, the corresponding calibration coefficient was 2 μm/pxl.
Results and Discussion
In the experiments, the time evolution of the spatial dimensions and the intensity of optical breakdown plasma flashes under irradiation of a colloidal solution of iron nanoparticles was studied. Figure 2A shows optical breakdown plasma images from the strip camera and the digital camera. In the experiments, the intensity of the flash glow was measured as a function of time; the diameter of the flash and the time tmax during which the glow intensity reached its maximum was also measured.
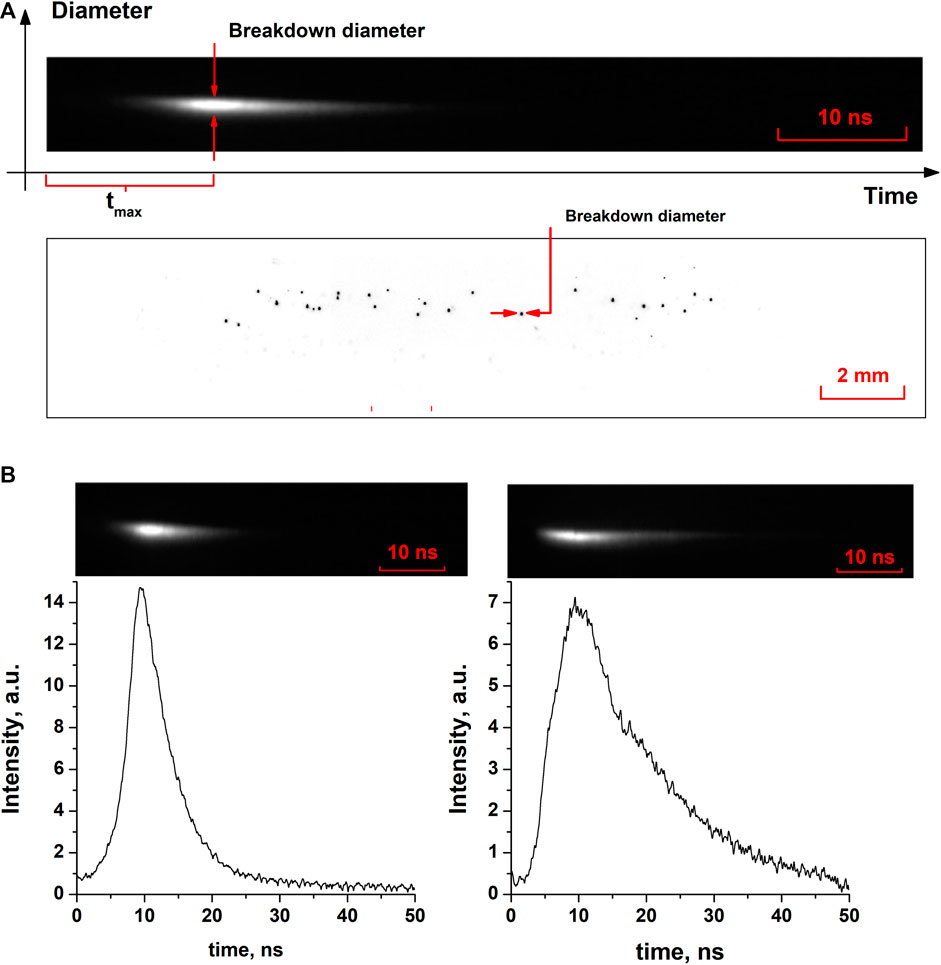
FIGURE 2. (A)—Images of an individual flash of optical breakdown obtained with a strip camera (top), images of optical breakdown during irradiation of a colloid of Fe nanoparticles in the negative (bottom); (B)—Intensity of individual flashes depending on time: Flash duration—8 ns (left), flash duration—15 ns (right).
In Figure 2B shows images of two different flashes of breakdown plasma from a strip camera. It follows from the figure that the lifetime of an optical breakdown plasma flash is 15 to 30 ns. In this case, the intensity of the plasma glow reaches a maximum in about 6–7 ns in both cases. It should be noted that plasma bursts differ in both the lifetime and the intensity. The maximum intensity for the flash in Figure 2B (left) is approximately twice the same intensity maximum for the image in Figure 2B (right). On the other hand, the flash lifetimes differ. The half-width of the plasma intensity signal in Figure 2B (right) is approximately 15 ns, at the same time the half-width of the plasma intensity signal in Figure 2A (left)—8 ns. Based on the results presented, it can be assumed that the processes of optical breakdown and plasma formation in these cases proceed differently.
Figure 3 shows the results of studies of optical breakdown plasma flashes upon irradiation of aqueous solutions of Fe nanoparticles. For each plasma outburst, the maximum intensity value, the maximum size of the outbreak, and the characteristic time during which the outburst intensity reaches its maximum value were measured.
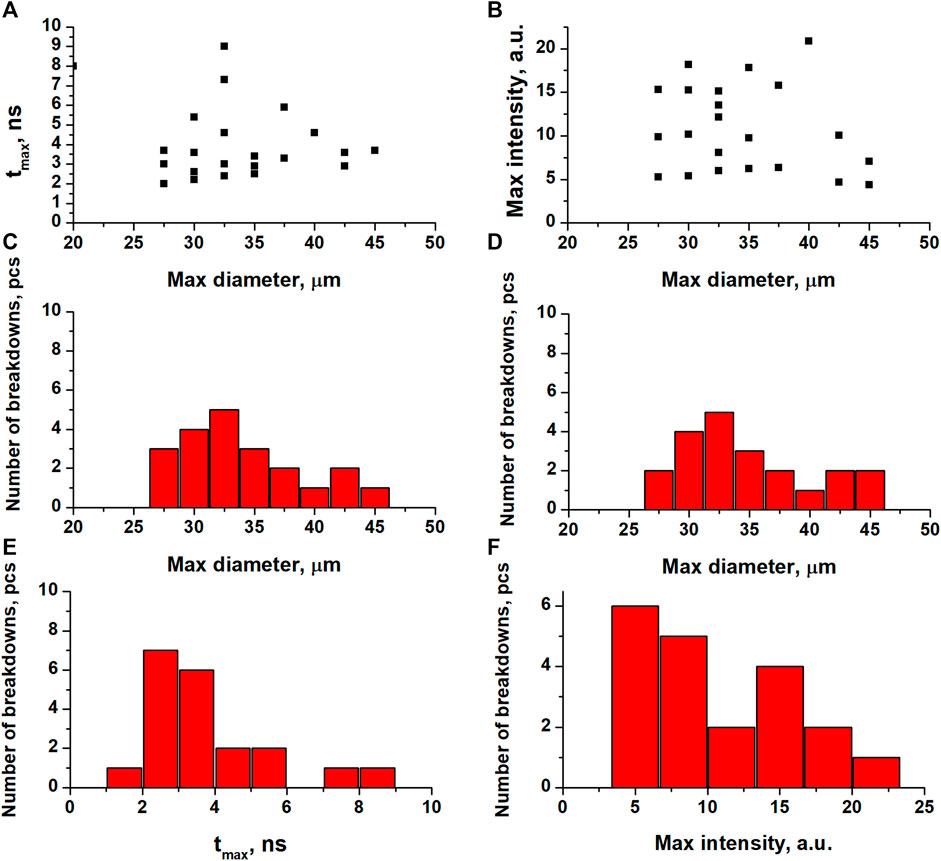
FIGURE 3. (A)- Distribution of plasma flashes depending on the maximum size and the tmax parameter; (B)- Distribution of plasma flashes depending on the maximum diameter and intensity; (C)—Distribution of plasma flashes over maximum sizes according to the data in Figure 3A. (D)—Distribution of plasma flashes by maximum size according to Figure 3B; (E)—Distribution of plasma flashes according to the maximum intensity; (F)—Distribution of plasma flashes over time tmax.
As can be seen from the data shown in Figure 3A, the smallest size of registered plasma flash was 27 μm, and the maximum size of plasma flashes was 45 μm. It is also shown that there is a minimum time before which the breakdown does not reach its maximum intensity. Figure 3A it follows that the lower time limit is about 2 ns. On the other hand, with an increase in the localization area, i.e. the maximum size of the flash, there are no significant changes in the values of tmax. Most flashes reach their maximum intensity in times of the order of 2.5–3 ns.
It follows from Figure 3B that the scatter of the flash glow intensity values varies in the range of values from 5 units. up to 21 units, i.e., the spread in the values of the maximum intensity reaches 400%. Most plasma flashes, as in the case of Figure 3A have sizes ranging from 30 to 35 microns.
Based on the data from Figures 3A,B, the distributions of the number of plasma flashes were plotted depending on the parameters under study, Figures 3C–F. It is shown that the size of the plasma flashes is localized in the range of values from 27 to 45 μm. In this case, most of the flashes are concentrated around 32.5 μm, Figures 3C,D. From Figure 3E it follows that most of the flashes reach their maximum intensity in times of the order of 2–4 ns. Also, the largest number of plasma flashes has intensity values of 5 units. up to 10 units, Figure 3F.
It is assumed that the process of optical breakdown on a nanoparticle occurs as follows. Laser radiation hitting the nanoparticle heats the nanoparticle material to ionization temperatures. After that, a cavity filled with plasma begins to form around the nanoparticle. The size of the region in which the breakdown plasma is localized does not exceed the size of the cavitation region. Based on the data obtained on the size of the plasma flash and the time tmax, one can estimate the approximate velocity of the interface propagation, Figure 4. As can be seen from the figure, for most of the investigated bursts of breakdown plasma, the velocity with which the interface propagates is approximately equal to 11000 m/s. It can be seen that all breakdowns in the figure are located mainly at the upper limit of the velocity equal to 15000 m/s. The minimum propagation speed turns out to be about 4,000 m/s. It should be noted that the values of the velocities of motion of the interface in a similar work [15] varied in the region from 600 to 2,500 m/s approximately 10 ns after optical breakdown and depend both on the duration of the laser pulse and on the energy in the laser pulse.
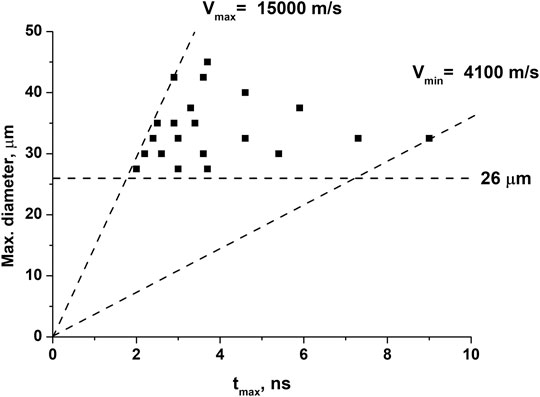
FIGURE 4. Dependence of the maximum diameter of plasma flashes on the time tmax. The figure shows the maximum and minimum values of the interface velocity.
It is also worth noting that breakdowns are limited from below by the maximum diameter (i.e., the process is a threshold) The minimum size of flashes for the given parameters is most likely limited by the value of the energy density of the laser radiation and the duration of the laser pulse. On the contrary, the maximum size should depend on the value of the deposited energy (the fraction of the laser radiation breakdown absorbed by the plasma) and the amount of energy loss. This can be influenced by both the parameters of laser radiation (laser energy density, pulse duration) and the properties of nanoparticles (material of nanoparticles, nanoparticle size). For example, in [8], it was shown that the rate of formation of hydroxyl radicals OH•, which are one of the main products of the decay of water molecules during optical breakdown, is significantly affected by the material and size of nanoparticles used in the irradiated solution. OH• radical—one of the primary decay products of a water molecule, formed under the action of breakdown plasma as a result of electron impact. The rate of generation of primary products should be mainly proportional to the area of interaction of the breakdown plasma with the surrounding liquid. Thus, the material and sizes of nanoparticles should affect the size of the plasma localization region.
Conclusion
Thus, the work demonstrates the development of an optical breakdown plasma upon irradiation of aqueous solutions of iron nanoparticles. It was investigated that the maximum typical sizes of plasma flashes are approximately 30–35 μm. In times of the order of 3–4 ns, the breakdown plasma reaches its maximum intensity. The velocity of the liquid-gas interface or the velocity of the cavity wall at the moment of breakdown has a limiting value of 15000 m/s. Most of the optical breakdowns after about 3–4 ns from the moment of plasma formation are characterized by the velocity of the interface movement of 11000 m/s. It was found that the maximum size of plasma flashes is limited from below by 26 mm, which is presumably related to the parameters of laser radiation. Presented results can expand the understanding of the initial stages of optical breakdown in a liquid, what in turn could also find application in the field of medicine and laser surgery.
Data Availability Statement
The raw data supporting the conclusions of this article will be made available by the authors, without undue reservation.
Author Contributions
IB, VC, and VP conducted experiments. IB and SG participated in the processing of the results and their discussion. IB and SG participated in writing the text of the manuscript.
Funding
This work was supported by a grant of the Ministry of Science and Higher Education of the Russian Federation (075-15-2020-912) for the organization and development of a World-class reseach center “Photonics”.
Conflict of Interest
The authors declare that the research was conducted in the absence of any commercial or financial relationships that could be construed as a potential conflict of interest.
Acknowledgments
The authors are grateful to the Center for Collective Use of the GPI RAS for the equipment provided.
References
1. Meader VK, John MG, Rodrigues CJ, Tibbetts KM. Roles of free electrons and H2O2in the optical breakdown-induced photochemical reduction of aqueous [AuCl4]−. J Phys Chem (2017) 121(36):6742–54. doi:10.1021/acs.jpca.7b05370
2. Pustovalov VK, Smetannikov AS, Zharov VP. Photothermal and accompanied phenomena of selective nanophotothermolysis with gold nanoparticles and laser pulses. Laser Phys Lett (2008) 5(11):775. doi:10.1002/lapl.200810072
3. Zhang D, Gökce B, Barcikowski S. Laser synthesis and processing of colloids: fundamentals and applications. Chem Rev (2017) 117(5):3990–4103. doi:10.1021/acs.chemrev.6b00468
4. Dell’Aglio M, Gaudiuso R, Koral C, Valenza G. Perspective on the use of nanoparticles to improve LIBS analytical performance: nanoparticle enhanced laser induced breakdown spectroscopy (NELIBS). J Anal At Spectrom (2016) 31:1566–73. doi:10.1039/C6JA00189K
5. Winefordner JD, Gornushkin IB, Correll T, Gibb E, Smith BW, Omenetto N. Comparing several atomic spectrometric methods to the super stars: special emphasis on laser induced breakdown spectrometry, LIBS, a future super star. J Anal At Spectrom (2004) 19(9):1061–83. doi:10.1039/B400355C
6. Lazic V, Jovićević S. Laser induced breakdown spectroscopy inside liquids: processes and analytical aspects. Spectrochim Acta B Atom Spectrosc (2014) 101:288–311. doi:10.1016/j.sab.2014.09.006
7. Docchio F, Avigo A, Palumbo R. Characteristics of optical breakdown in ultrapure water induced by nanosecond Nd: YAG laser pulses. Europhys Lett (1991) 15(1):69. doi:10.1209/0295-5075/15/1/012
8. Barmina EV, Simakin AV, Shafeev GA. Hydrogen emission under laser exposure of colloidal solutions of nanoparticles. Chem Phys Lett (2016) 655–656:35–8. doi:10.1016/j.cplett.2016.05.020
9. Baimler IV, Simakin AV, Uvarov OV, Volkov MY, Gudkov SV. Generation of hydroxyl radicals during laser breakdown of aqueous solutions in the presence of Fe and Cu nanoparticles of different sizes. Phys Wave Phenom (2020) 28(2):107–10. doi:10.3103/S1541308X20020028
10. Lam J, Lombard J, Dujardin C, Ledoux G, Merabia S, Amans D. Dynamical study of bubble expansion following laser ablation in liquids. Appl Phys Lett (2016) 108(7):074104. doi:10.1063/1.4942389
11. Kanitz A, Kalus M-R, Gurevich EL, Ostendorf A, Barcikowski S, Amans D. Review on experimental and theoretical investigations of the early stage, femtoseconds to microseconds processes during laser ablation in liquid-phase for the synthesis of colloidal nanoparticles. Plasma Sources Sci Technol (2019) 28(10):103001. doi:10.1088/1361-6595/ab3dbe
12. Kenhagho HKN, Rauter G, Guzman R, Cattin PC, Zam A. Comparison of acoustic shock waves generated by micro and nanosecond lasers for a smart laser surgery system. In: Advanced biomedical and clinical diagnostic and surgical guidance systems XVI. Bellingham, WA: International Society for Optics and Photonics (2018) 2018. p 10484–104840. doi:10.1117/12.2290094
13. Linz N, Freidank S, Liang X-X, Vogel A. Wavelength dependence of femtosecond laser-induced breakdown in water and implications for laser surgery. Phys Rev B (2016) 94(2):024113. doi:10.1103/PhysRevB.94.024113
14. Simakin AV, Astashev ME, Baimler IV, Uvarov OV, Voronov VV, Vedunova MV, et al. The effect of gold nanoparticle concentration and laser fluence on the laser-induced water decomposition. J Phys Chem B (2019) 123(8):1869–80. doi:10.1021/acs.jpcb.8b11087
Keywords: laser radiation, nanoparticles, optical breakdown, optical breakdown plasma, cavitation bubble
Citation: Baimler IV, Chevokin VK, Podvyaznikov VA and Gudkov SV (2021) Case Report: Investigation of the Time Evolution of Optical Breakdown Plasma During Irradiation of Aqueous Solutions of Fe Nanoparticles. Front. Phys. 9:641189. doi: 10.3389/fphy.2021.641189
Received: 14 December 2020; Accepted: 06 January 2021;
Published: 02 February 2021.
Edited by:
Laura Stricker, ETH Zürich, SwitzerlandReviewed by:
Alireza Maleki, Macquarie University, AustraliaElena Mitroshina, Lobachevsky State University of Nizhny Novgorod, Russia
Copyright © 2021 Baimler, Chevokin, Podvyaznikov and Gudkov. This is an open-access article distributed under the terms of the Creative Commons Attribution License (CC BY). The use, distribution or reproduction in other forums is permitted, provided the original author(s) and the copyright owner(s) are credited and that the original publication in this journal is cited, in accordance with accepted academic practice. No use, distribution or reproduction is permitted which does not comply with these terms.
*Correspondence: Sergey V. Gudkov, s_makariy@rambler.ru