


Introduction
During the last few decades, an average mountain surface air temperature warming rate of 0.3 ± 0.2°C per decade was detected across western North America, Europe and High Mountain Asia, which is higher than the global warming rate of 0.2 ± 0.1°C per decade (IPCC, 2018). In response to rapid climate warming, the mass loss of global mountain glaciers, which are distinct from the Greenland and Antarctic ice sheets, contributed 27 ± 22 mm to the global mean sea-level rise from 1961 to 2016, increasing by ~30% from 1986−2005 to 2006−15 (Zemp and others, Reference Zemp2019). The mean mass balance of the Himalayan glaciers was −0.25 ± 0.09 m water equivalent (w.e.) a−1 over the period of 1974–2000, becoming more negative (−0.39 ± 0.12 m w.e. a−1) between 2000 and 2015 (King and others, Reference King, Bhattacharya, Bhambri and Bolch2019). The mass loss of the lake-terminating glaciers was greater than that of the land-terminating glaciers (Carrivick and Tweed, Reference Carrivick and Tweed2013; Fujita and Sakai, Reference Fujita and Sakai2014; Song and others, Reference Song2017; Begam and Sen, Reference Begam and Sen2019; Brun and others, Reference Brun2019; Tsutaki and others, Reference Tsutaki2019; Wu and others, Reference Wu, Liu, Jiang, Xu and Wei2019; Zhang and others, Reference Zhang2019; Andreassen and others, Reference Andreassen, Elvehøy, Kjøllmoen and Belart2020; Watson and others, Reference Watson2020). Across the Himalayan regions during the period 1974−2000, geodetic measurements indicate a mean mass loss of −0.32 ± 0.12 m w.e. a−1 for the lake-terminating glaciers, which was more negative than the value for the land-terminating glaciers (−0.23 ± 0.09 m w.e. a−1) (King and others, Reference King, Bhattacharya, Bhambri and Bolch2019). Furthermore, the difference in the mass wastage between the two types of glaciers (0.09 m w.e. a−1 during 1974−2000) doubled to 0.18 m w.e.a−1 in the period 2000−15, with mean mass budgets of −0.55 ± 0.12 and −0.37 ± 0.12 m w.e. a−1 for the lake-terminating and land-terminating glaciers, respectively (King and others, Reference King, Bhattacharya, Bhambri and Bolch2019).
The moraine dams of proglacial lakes are susceptible to failure via overtopping and piping trigger mechanisms (Richardson and Reynolds, Reference Richardson and Reynolds2000; Nie and others, Reference Nie2018). In 1964, the Cirenmaco Lake moraine dam collapsed due to piping, which caused a glacial lake outburst flood (GLOF) (Yamada and Sharma, Reference Yamada and Sharma1993). The failure of the same proglacial lake occurred again in 1981, directly triggered by a passage appearing 20−30 m below the water level within the moraine dam (Xu, Reference Xu1988). Among the 1348 GLOFs recorded worldwide, more than 120 events occurred at moraine-dammed lakes (Carrivick and Tweed, Reference Carrivick and Tweed2016). In the Chinese Himalaya, 329 moraine-dammed lakes were detected using remotely sensed data, with an average area expansion rate of 25.11% from the 1990s to the 2010s, and 35% of these lakes were identified as potentially dangerous glacial lakes (Wang and others, Reference Wang, Qin and Xiao2015).
Longbasaba Lake is a typical moraine-dammed proglacial lake in the central eastern Himalaya with a high outburst risk and it has experienced dramatic expansion over recent decades (Yao and others, Reference Yao, Liu, Sun, Wei and Guo2012b; Wang and others, Reference Wang, Liu, Liu, Wei and Jiang2016). Due to the significant retreat of the terminus of its host glacier (1264 m, 40 m a−1), the lake area has increased by 223% from 1977–2009 (Wang and others, Reference Wang, Liu, Liu, Wei and Jiang2016), whereas the glacial lakes in the Himalaya have expanded by 14.1% on average during 1990–2015 (Nie and others, Reference Nie2017). In addition, an accelerating retreat of the glacier terminus (63.8 m a−1) was observed for Longbasaba Lake during 2005−09, resulting in a lake area expansion rate of 0.040 km2 a−1 (Wang and others, Reference Wang, Liu, Liu, Wei and Jiang2016). The ice core in the moraine dam of this lake has been deteriorating during the last few decades, which is manifested as an increasing yearly maximum thawing depth and a decreasing yearly maximum freezing depth (Wang and others, Reference Wang2018). These changes will decrease the moraine dam stability and may increase the risk of dam failure. A modeled outburst flood from Longbasaba Lake and the adjacent proglacial lake, Pida Lake, projects that the water flux would reach 3–5 × 10⁴ m3 s−1 within ~1.8 h after the beginning of the flood (Wang and others, Reference Wang, Liu, Guo and Xu2008). The Hydrological Department of the Tibet Autonomous Region has suggested that a GLOF from Longbasaba Lake would damage the roads, bridges and the hydropower station downstream and would threaten the towns of Saer and Jiangge, along with 23 other villages (Yao and others, Reference Yao, Liu, Sun, Wei and Guo2012b). Thus, the evolution of Longbasaba Glacier and Lake needs to be monitored and has attracted the attention of scientists and local government departments (Wang and others, Reference Wang, Liu, Guo and Xu2008, Reference Wang2018; Yao and others, Reference Yao, Liu, Sun, Wei and Guo2012b; Nie and others, Reference Nie2017). Here, we provide an approach to assess the mass budget from glacier recession by calculating the corresponding mass loss contributions from different components of glacier fluctuations. The goal of this study is to detect the variations in the glacier mass budget and the lake area, to estimate the expansion of the lake water volume, and then, to assess the mass impacts of the glacier degradation on the water volume of Longbasaba Lake.
Study area
Longbasaba Glacier has a proglacial moraine-dammed lake and is located in the headwaters of the Pumqu River on the northern slope of the central eastern Himalaya (Fig. 1a). This glacier covered an area of 28.4 km2 in 2010, with a length of 8.7 km and a debris-covered area of 1.1 km2 on the tongue (3.7%) (Guo and others, Reference Guo2015). Many crevasses have formed on the glacier tongue (Fig. 1b) and are likely produced due to extending flow as a result of calving, which produces icebergs with various sizes in the lake (Fig. 1c). Longbasaba Lake remains at a high risk of outburst (Wang and others, Reference Wang, Liu, Liu, Wei and Jiang2016). It covered an area of 1.22 km2 in 2009, with a maximum SE-NW length of 2.210 km and a maximum SW-NE width of 0.685 km (Yao and others, Reference Yao, Liu, Sun, Wei and Guo2012b). According to in situ measurements conducted using an echo sounder with a GPS receiver in September 2009, the water level of Longbasaba Lake was at 5499 m a.s.l. and the average and maximum lake depths were 48 and 102 m, respectively, contributing a water volume of ~0.064 km3 (Yao and others, Reference Yao, Liu, Sun, Wei and Guo2012b).

Fig. 1. (a) The study area. The outlines of Longbasaba Glacier/Lake were manually delineated from the Landsat OLI image taken on 17 October 2018. The inset has a Natural Earth shaded relief background. The blue line, with an elevation of 5650 m obtained from the SRTM DEM, shows the intersection between the glacier main channel and the tributaries. The glacier tongue is defined as the area lower than the blue line. The red arrow shows the direction in which the sub-images (b, c, d) were taken. (b) Crevasses and debris cover on the glacier tongue. (c) Icebergs widely distributed over the lake surface. (d) The water outlet of Longbasaba Lake in June 2006.
Data and methods
Changes in glacier area, length and surface velocity
Variations in glacier area and length were determined based on 34 Landsat TM\ETM+\OLI images acquired during 1988−2018 (Table S1). These multispectral, multitemporal images, with a spatial resolution of 30 m and the coordinate system of the WGS1984/EGM1996, are available from, and were orthorectified by, the United States Geological Survey (USGS). The Landsat images showed a horizontal accuracy of better than one pixel to each other or to non-differential GPS data (Bolch and others, Reference Bolch2010; Guo and others, Reference Guo, Liu, Wei and Bao2013) and have been widely used in glaciology (Guo and others, Reference Guo2015; Cogley, Reference Cogley2016; Azam and others, Reference Azam2018; Nie and others, Reference Nie2018; Wu and others, Reference Wu2018; Begam and others, Reference Begam and Sen2019; Liu and others, Reference Liu2020).
Landsat images covering the study region were affected by frequent snow and cloud cover. We preferentially chose images acquired in September and October with minimum snow and cloud cover. Some high-quality images acquired in the adjacent months (e.g. July and August) were used when there was no suitable image in September and October (Fig. S1a). In addition, scanline errors (SLC-off scenes acquired by the ETM+ sensor since early summer 2003) also created obstacles in generating the glacier/lake outlines (Fig. S1b). Then, the SLC-off images were used only to identify the glacier front positions. The glacier outlines were manually mapped, and subsequently, the areal variation during the investigation period was generated. The center flowlines were also manually digitized to assess the changes in the glacier length.
Glacier surface velocities were extracted from Landsat image pairs utilizing the cross-correlation feature tracking processing in a free software module Co-registration of Optically Sensed Images and Correlation (COSI-Corr) (Leprince and others, Reference Leprince, Barbot, Ayoub and Avouac2007; Gantayat and others, Reference Gantayat, Kulkarni and Srinivasan2014; Ruiz and others, Reference Ruiz, Berthier, Masiokas, Pitte and Villalba2015; Ayoub and others, Reference Ayoub, Leprince and Avouac2017). A co-registered image pair containing two Landsat images was iteratively cross-correlated in a sliding window with 32 pixels and a step size of one pixel. Then, two horizontal ground offset fields (East\West and North\South) with a spatial resolution of 30 m were calculated for each pixel. The signal-to-noise ratio (SNR) was calculated using the frequency mask and the weighting matrix, and it reflects the quality of the correlation (Leprince and others, Reference Leprince, Barbot, Ayoub and Avouac2007). The surface velocity of an individual pixel was generated by combining two horizontal offsets with an SNR threshold of >0.95. The mean surface velocity of the glacier (MSVg) was extracted over the glacier terrain using a 95% quantile boundary to eliminate the extreme outliers. In addition, the mean surface velocity of the glacier tongue (MSVt) was generated using the same threshold of pixels over the glacier tongue region. Unfortunately, there was no perfect Landsat image covering the entire glacier in 2012, so the surface velocities over the periods 2011−12 and 2012−13 were replaced by the mean surface velocity extracted from the Landsat images in 2011 and 2013.
The changes in the surface elevation were obtained from the High Mountain Asia Gridded Glacier Thickness Changes from Multi-Sensor DEMs, Version 1 (HMA_Glacier_dH) for two subsequent time periods of 1975−2000 and 2000−16 (Maurer and others, Reference Maurer, Rupper and Schaefer2018). These data were extracted based on a series of stereo scenes from KH-9 HEXAGON in 1975 and ASTER data acquired from 2000 to 2016 by fitting robust linear trends. These data are available from the National Snow and Ice Data Center (NSIDC) and have a horizontal resolution of 30 m. The asserted accuracy of the full dataset is ±0.42 m a−1 as derived from the non-glacier terrain and varies between the glaciers and sub-regions due to the different data quality and coverage (Maurer and others, Reference Maurer, Rupper and Schaefer2018). In this study, we obtained a higher accuracy of ±0.04 m a−1 for the two periods 1975−2000 and 2000−16, using the method of Brun and others (Reference Brun, Berthier, Wagnon, Kääb and Treichler2017).
Changes in glacial lake area and water volume
The changes in the lake area were obtained from the Landsat images used to generate the glacier outlines in order to ensure that there was no gap between the glacier/lake outlines. The water volume was estimated by multiplying the lake area and depth. In situ measurements of the water depths of Longbasaba Lake were taken in September 2009, using a comprehensive measuring system containing an echo sounder and a GPS receiver (Yao and others, Reference Yao, Liu, Sun, Wei and Guo2012b). A total of 35 558 depth points with positions were collected (Fig. S2a). Another 33 random points were obtained synchronously using a measuring rope. The depth error was ±2.0 m by comparing the depth measured by the echo sounder and that obtained using the measuring rope. Considering the vertical errors controlled by the rope drift and GPS horizontal errors, the in situ measurements showed a depth accuracy of ±2.5 m (see Fig. S3 and Table S2). Combining the water depth measurements and the lake boundary in 2009, the isobaths with 10 m intervals for the lake basin were extracted using the ordinary kriging interpolation method with a search radius of 12 pixels and a spherical semivariogram model. Subsequently, the basin morphology within the 2009 lake boundary was reconstructed using a water level of 5499 m a.s.l. Based on this morphology (Fig. S2b), the lowest elevation of the lake basin was 5398 m a.s.l. in 2009.
By comparing the ice thickness and surface DEM of mountain glaciers provided by Farinotti and others (Reference Farinotti2019), we generated the bed topography with 10 m intervals for Longbasaba Glacier (Fig. S2d). These ice thickness data are a consensus estimate based on five ice thickness estimation models (Farinotti and others, Reference Farinotti2019). The original consensus ice thickness suggested a gentle gradient at the glacier's terminus, which was inconsistent with the steep cliff at the front of the host glacier (Fig. 1b). Thus, the isobaths just within the 2014 glacier boundary were used and merged with the 2009 lake isobaths by taking into account the basin's continuity (Fig. S2e). Based on the merged isobaths and the 2018 glacial lake boundary, the ‘hole’ in the basin morphology between the 2009 and 2014 glacier terminus locations was estimated using the ‘topo to raster’ module in ArcGIS 10.2, which is based on the ANUDEM method (Hutchinson, Reference Hutchinson2004). Finally, the 2018 basin morphology for the proglacial lake, with a spatial resolution of 30 m, was reconstructed (Fig. S2f). The lake water volume in each year, Vl, was estimated using:

where N l is the pixel number within the lake boundary in each year; $h_{\rm l}^i$ is the depth of the individual pixel, which can be calculated by comparing the water level and the basin morphology; and S is the lake area in the corresponding year.
In High Mountain Asia, the rate of the rise in lake water level was 0.14–0.18 m a−1 on average between 1990 and 2015 (Treichler and others, Reference Treichler, Kääb, Salzmann and Xu2019) and increased to 0.21 m a−1 during 2003−09 (Zhang and others, Reference Zhang2017). Furthermore, the lake water level in the southwestern part of the Tibetan Plateau has risen by 4 ± 1 mm a−1 on average during 1990–2015 (Treichler and others, Reference Treichler, Kääb, Salzmann and Xu2019). Following the rate from Treichler and others (Reference Treichler, Kääb, Salzmann and Xu2019), the maximum mean rate of increase of the Longbasaba Lake water level, with a mean lake depth of ~50 m, would be 0.2 m a−1. This results in an underestimation of <1.2% relative to the estimated water volume using our measurement. Thus, we assumed in this study that the lake experienced a negligible interannual change in water level during the investigation period.
Mass contributions of glacier wastage to lake water volume
Due to the effects of climate warming and the formation of proglacial lakes, the mass wastage of lake-terminating glaciers is characterized by terminus retreat and surface lowering (Fig. 2). At the glacier terminus, the mass loss from ice melt and calving directly enters the proglacial lake. Meltwater from glacier ablation is manifested as three components: water inflow directly into the proglacial lake, evaporation (or sublimation directly from ice) into the air and infiltration into the ground. For lake-terminating glaciers, mass balance that is assessed by geodetic measurements solely based on glacier surface lowering underestimates mass contributions, as movement from the glacier terminus is not considered. Without the consideration of the negligible amounts of evaporation and percolation (Brock and others, Reference Brock2010; Zhang and others, Reference Zhang, Hirabayashi and Liu2012; Lei and others, Reference Lei2013; Treichler and others, Reference Treichler, Kääb, Salzmann and Xu2019), the mass impacts of the glacier change on the lake water volume can be divided into two portions: the mass contribution from the terminus dynamics, M t; and the mass contribution that is not from the terminus dynamics (mainly from glacier surface lowering), M s. The former can be further divided into two phases: (i) terminus advance and subsequent ice melt and calving from the advanced ice according to the ice flow, M f, and (ii) synchronous terminus retreat without considering the ice flow, M r, only due to ice melt and calving at the glacier terminus. Then, the impact of the glacier wastage on the lake water volume can be classified into three synchronous components of ice loss contributed by: (i) ice flow, V f; (ii) terminus retreat, V r; and (iii) glacier surface lowering over the area higher than L e, V e (Fig. 2). Eventually, the mass contributions of the glacier changes to the lake water volume, M G, can be calculated as:

where ρ ice is the ice density of the glacier tongue, with a constant value of 900 kg m−3 as recommended by Kääb and others (Reference Kääb, Berthier, Nuth, Gardelle and Arnaud2012); ρ gla is the consensus glacier density for the long-timescale estimation, with a value of 850 ± 60 kg m−3 suggested by Huss (Reference Huss2013).
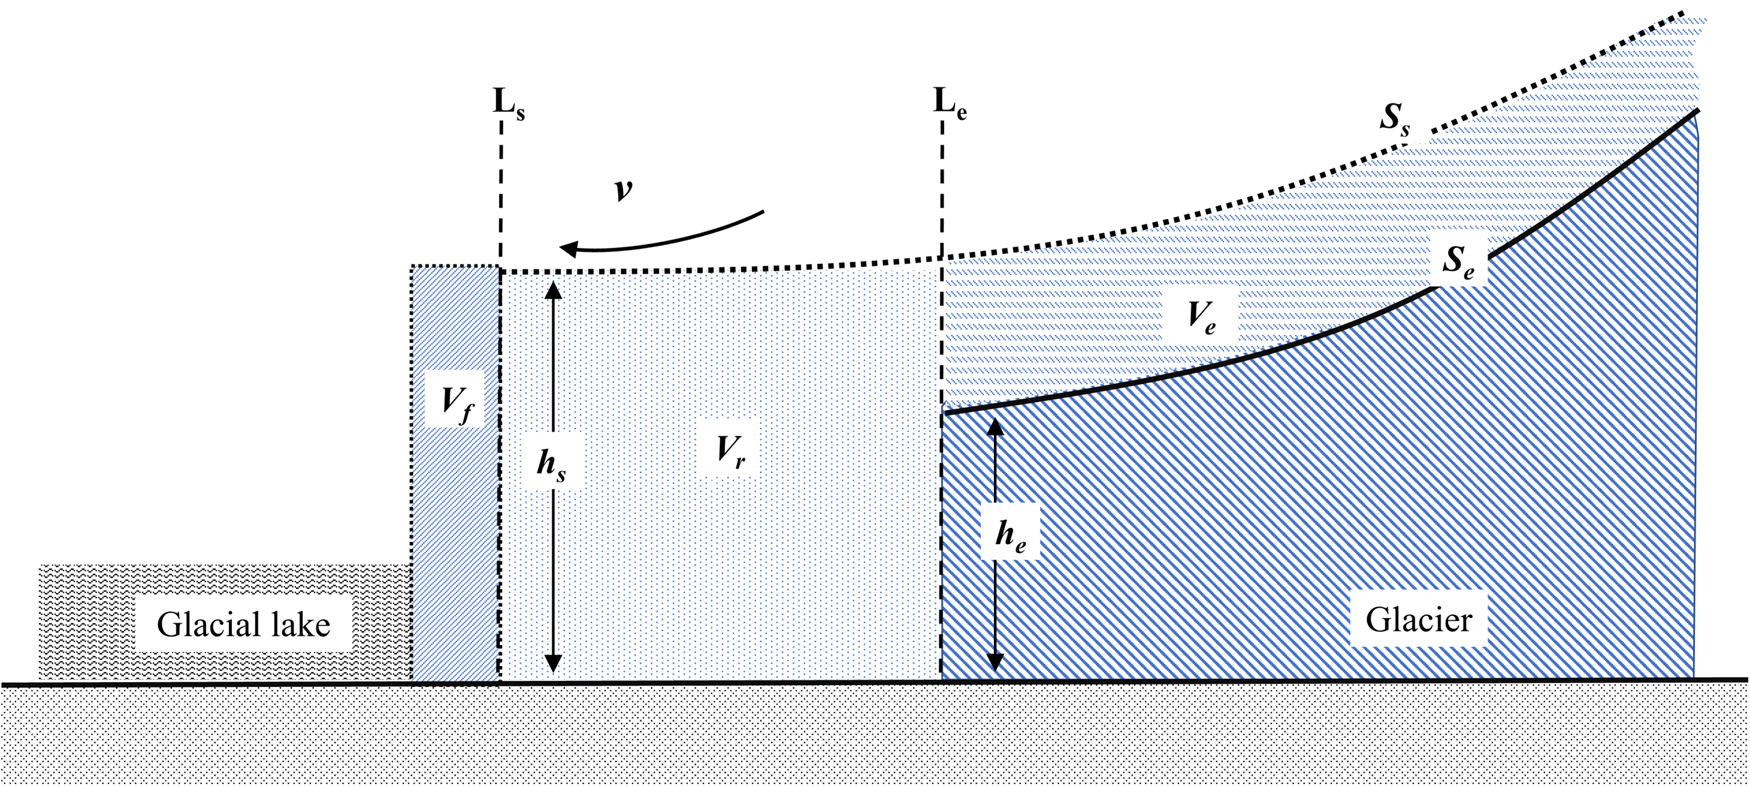
Fig. 2. Mass fluctuation components of a lake-terminating glacier and its contribution to lake water volume. Ls, S s and h s are the glacier front, glacier surface and ice thickness in a specific year; L e, S e and h e are the glacier front, glacier surface and ice thickness after retreat in the next year; v is the surface ice flow velocity; V e is the ice volume loss contributed by the glacier surface lowering; and V f and V r are the ice losses contributed by the ice flow and the terminus retreat, respectively.
The ice volume contributed by the ice flow of the glacier terminus can be estimated as:

where v is the ice flow velocity at the glacier terminus; t is the interval time; R is the spatial resolution of the pixel; N f is the number of pixels within the profile of the glacier front; $h_{\rm s}^i$ is the ice thickness for an individual pixel in the previous year; and s i is the pixel area.
The ice flow velocities of glaciers depend on factors such as the bed gradient, glacier thickness, the mass balance, ice temperature and subglacial hydrology (Paterson, Reference Paterson1994; Dehecq and others, Reference Dehecq2018). The annual mean air temperature of −3.6°C in our study area (Wang and others, Reference Wang2018) was suggested to be 2−4°C colder than ice temperatures of glaciers (Liu and others, Reference Liu, Hou, Wang and Song2009; Miles and others, Reference Miles2018). It indicates that Longbasaba Glacier is a temperature glacier, and its basal velocities should be generally characterized by a more uniform distribution across the ice body (Paterson, Reference Paterson1994). In previous studies, the basal velocity was suggested to account 30−80% of the surface velocity (Perutz, Reference Perutz1949; Harper and others, Reference Harper2001; Copland and others, Reference Copland, Sharp, Nienow and Bingham2003). For Koxkar Glacier in the Tien Shan, the basal sliding contributed 33% of the surface velocity (Li and others, Reference Li2014). Therefore, we assumed that the basal velocity accounted for 40% of the surface velocity at the glacier terminus for Longbasaba Glacier, and the value of 70% of the MSVt was obtained as the value of the ice flow velocity for the glacier terminus, by averaging the basal (40%) and surface (100%) velocities. The minimum and maximum values (30 and 80%) of the potential basal velocity range were also tested and led to variations of <1% for the results in this study.
The ice thickness of the glacier terminus was calculated by comparing the surface/bed elevations at the glacier front in a specific year. The surface elevation of Longbasaba Glacier in 1980 was extracted from the 1:50 000 Chinese historical topographic map (Wei and others, Reference Wei2015; Wu and others, Reference Wu2018). By combining the position and bed elevation of the glacier front, the ice thicknesses of the glacier terminus from 1988 to 2018 were generated and modified using the average surface-lowering rates of the glacier tongue. Based on the HMA_Glacier_dH data (Maurer and others, Reference Maurer, Rupper and Schaefer2018), the mean thinning rate of glacier tongue was ~−0.89 ± 0.04 m a−1 during 1975−2000, and it increased to −2.04 ± 0.04 m a−1 during 2000−16.
The ice volume loss contributed by the retreat of the glacier front was:

where N r is the number of pixels over the terrain between the profiles of L s and L e (Fig. 2). The changes in the ice volume contributed by the surface lowering, V e, can be estimated as:

where s g and $\overline {h_\Delta }$ are the glacier area and average thinning rate higher than L e, respectively. The mean changes in glacier surface elevation during the two periods 1975−2000 and 2000−16 were extracted from the HMA_Glacier_dH data.
Background of climate change
The background of climate change in the study area was analyzed based on the China Meteorological Forcing Dataset (CMFD) released by the National Tibetan Plateau Data Center (He and others, Reference He2020). Using a combination of in situ station data, gridded datasets from remote-sensing products, and reanalysis datasets, the CMFD data product releases the instantaneous surface (2 m) air temperature and 3 h mean precipitation rate required for land modeling during 1979–2018. These data are available as tiles with a temporal resolution of 3 h and a spatial resolution of 0.1°, and distributed on daily, monthly and yearly scales (Yang and He, Reference Yang and He2018). Here, we generated the changes in the yearly mean air temperature and precipitation during the past three decades, to discuss their effect on the changes of Longbasaba Glacier.
Accuracy analysis
The geolocation errors of the pixels on the glacier/lake boundaries, generated through a careful manual approach, can be controlled within a pixel. By comparing the outline positions from the manual delineation and GPS measurements, Guo and others (Reference Guo2015) suggested that the accuracies of manual outlines were ~±11 and ±30 m for clean ice and debris-covered glaciers, respectively. In this study, the position accuracy of glacier boundary was affected by the debris cover on the glacier tongue but without the glacier terminus, as it was easy to exactly distinguish the glacier from its proglacial lake. The accuracies of the generated area are defined by the buffer along the glacier/lake perimeters with the size of half of the outline position error, and equal to 0.5 pixels multiplied by the pixel number within the perimeters and the spatial resolution of the images (Bolch and others, Reference Bolch2010; Guo and others, Reference Guo2015). The maximum error for the glacier area was ±0.665 km2 in 1988, and for the lake area the value was ±0.104 km2 in 2018, with mean accuracies of ±0.644 km2 (2%) and ±0.078 km2 (7%) for glacier and lake areas, respectively. The accuracy of the central flowline length was also controlled within 0.5 pixels, approximately equal to ±15 m, which caused an accuracy of ±21 m for the changes in the glacier length according to the law of error propagation. For the accumulation area of Longbasaba Glacier, the changes of a few pixels suggested a ‘stable’ outline during the investigation period. The accuracy of changes in the glacier/lake areas was predominantly controlled by the perimeters of the digital polygons defining the area changes, and it ranged from ±0.017 to ±0.027 km2 during each interval, using the buffer method (Bolch and others, Reference Bolch2010; Guo and others, Reference Guo2015).
The accuracy of the estimated water volume was assessed according to the law of error propagation, based on errors of the lake depth and area. The error of interpolation method was estimated from the differences of depth values of the 35 558 points between the in situ measurements and the 2018 basin morphology. Based on the mean and square deviation (SD) values of 0.2 and 4.9 m, respectively, the interpolated result showed an accuracy of ±4.9 m by following $\sqrt {{\lpar {{\rm mean}} \rpar }^ 2{\rm} + {\rm \lpar SD}\rpar ^ 2}$ (Wei and others, Reference Wei2015). Considering the accuracy of ±2.5 m for the lake depth obtained from the in situ measurements, the estimated accuracy of the lake basin depth was ${\pm} \sqrt {{\lpar { 2 .5} \rpar }^ 2{\rm} + \lpar 4 .9\rpar ^ 2}$
 = ± 5.5 m.
The uncertainties of the mass contributions from the glacier terminus motions and surface lowering were mainly controlled by the errors in the glacier surface velocity, ice thickness and thinning rate. The error of the surface velocity was obtained from the stable glacier-free terrain in the investigated region, and ranged from ±0.23 to ±2.36 cm d−1. The accuracy in the glacier thinning rate depends on the precision of the HMA_Glacier_dH data and approximately equaled to ±0.04 m a−1 for the two periods 1975−2000 and 2000−16. The uncertainty in the ice thickness was determined from the errors in the elevations of the glacier surface and bed at the glacier tongue. The precision of the glacier surface elevations was controlled by the accuracies of the topographic maps and the elevation-lowering rates of the glacier tongue. The topographic maps showed a vertical accuracy of ±8 m for areas with slopes of 6−25⁰ (Chinese National Standard, 2008). The error in the lake depth was used to assess the accuracy of the bed elevations. Then the estimated accuracy of the ice thickness equaled to ±9.6 m, and finally caused an accuracy of ±0.018 km3 for the total mass loss from the glacier recession during the period 1988−2018.
Results
Glacier recession
The total area of Longbasaba Glacier was 29.551 ± 0.617 km2 in 2018 and decreased by 3.23% since 1988 (Fig. 3), with a mean areal recession rate of 0.033 ± 0.001 km2 a−1. The glacier recession varied dramatically with an SD value of 0.027 km2 during 1988–2008, whereas with less variation (SD of 0.006 km2) in the recent decade (Fig. 4a). The greatest area loss occurred from 1993 to 1994, causing an area of 0.089 ± 0.026 km2 (0.29%) to disappear. During 2000−01 and 2003−04, this glacier experienced a significant amount of recession, with a degradation area of >0.075 km2. However, the glacier area decreased by <0.05 km2 during the other periods before 2008. In particular, during the periods of 1988−89, 1989−90, 1991−92, 1994−95 and 2004−05, this glacier remained nearly stable, with an area loss of <0.01 km2. The glacier retreated slower prior to 2008 (mean 0.032 ± 0.003 km2 a−1) than in the last decade (0.035 ± 0.001 km2 a−1).

Fig. 3. Variation in the front positions of Longbasaba Glacier, generated from Landsat images taken during 1988−2018. The background map is the Landsat OLI image taken on 17 October 2018. The white line is the center flowline.

Fig. 4. Changes in (a) area, (b) length and (c) mean surface velocity for Longbasaba Glacier during 1989−2018. The recessions of glacier area and length were more variable prior to 2008 than in the last decade. The glacier length changes were determined by comparing the positions of the intersection points between the center flowline and the glacier fronts.
The length of the center flowline was 8274 ± 15 m in 2018, and it has decreased by 1577 ± 21 m (53 ± 1 m a−1) from 1988 to 2018 (Fig. 4b). A higher mean length retreat (58 ± 2 m a−1) occurred during 2008–18 than in 1988−2008 (50 ± 1 m a−1). The variation in the glacier length was dramatic before 2008, with an SD value of 78 m relative to the value of 13 m during 2008−18. The largest reductions in length occurred during 1993−94, 2000−01 and 2003−04, with retreat rates of >180 m a−1. Nevertheless, the length of the center flowline changed slightly within a pixel or remained nearly stable during the other periods before 2008.
The MSVg was 3.60 ± 1.03 cm d−1 during the investigation period, ranging from 2.08 ± 0.41 cm d−1 during 2001−02 to 6.64 ± 1.78 cm d−1 during 1996–97. The MSVt was 5.05 ± 1.03 cm d−1 during 1988–2018, which is 65% faster than the MSVg. The decreases in the MSVg were observed during the periods 1988−2008 and 2008−18, and the decrease rate has increased during the last decade (Fig. 4c). An approximately synchronous fluctuation was observed for the MSVg and MSVt, while the variation in the magnitude of the MSVt was greater than that of the MSVg, with SD values of 1.89 and 1.12 cm d−1 for MSVt and MSVg, respectively. The change in the MSVg is not consistent with the changes in the glacier area and length, with correlation coefficients of <0.3.
According to the consensus estimate of the ice thickness from Farinotti and others (Reference Farinotti2019), the total ice volume of Longbasaba Glacier was ~3.317 km3 (Fig. 5). The mean surface-lowering rate was −0.38 ± 0.04 m a−1 from 1975 to 2000 based on the HMA_Glacier_dH data, resulting in a total ice loss of 0.139 ± 0.001 km3 (4.2% of the total ice volume) from 1988 to 2000. The thinning rate decreased slightly to an average of −0.28 ± 0.04 m a−1 from 2000 to 2016, resulting in an ice loss of 0.100 ± 0.001 km3 (3.0% of the total ice volume) during 2000−18. In contrast, the glacier tongue experienced a greater and accelerating shrinkage, with mean thinning rates from −0.89 ± 0.04 m a−1 before 2000 to −2.04 ± 0.04 m a−1 after 2000. Finally, an average surface lowering of −0.34 ± 0.04 m a−1 occurred from 1975 to 2016, contributing an average mass wastage of −0.27 ± 0.04 m w.e. a−1 during 1988−2018.

Fig. 5. (a) The center flowline profiles of the bed, ice thickness, lake depth and surface lowering rates of Longbasaba Glacier. The basin morphology of Longbasaba Lake and the bed/ice-thickness of Longbasaba Glacier were reconstructed from the echo sounder measurements of Yao and others (Reference Yao, Liu, Sun, Wei and Guo2012b), and the ice thickness and surface DEM of Farinotti and others (Reference Farinotti2019). The surface-lowering rates are from the HMA_Glacier_dH dataset during periods 1975−2000 and 2000−16 (Maurer and others, Reference Maurer, Rupper and Schaefer2018). (b) The potential maximum lake extent when the glacier terminus is separated from the lake in the future, by assuming no change in lake water level.
Glacial lake expansion
Accompanied by the degradation of the host glacier, the area of Longbasaba Lake has expanded by 164% (3.3% a−1) to 1.591 ± 0.104 km2 in 2018 (Fig. 6a), with an increased mean rate of expansion of 0.033 ± 0.001 km2 a−1 over the past three decades. Similar to its host glacier, the lake expanded with more variable rates before 2008 than during the last decade (Fig. 4a).

Fig. 6. (a) Time series of glacier and lake area and their errors during 1988–2018. (b) Changes in the water volume of Longbasaba Lake during 1988 − 2018.
Based on the estimated basin morphology (Fig. 5a), the maximum lake depth was 102.3 ± 5.5 m in 2018. Over the period of 1988–2018, the water volume increased by 237% to 0.083 ± 0.025 km3 in 2018 (Fig. 6b). The mean increase in water volume was 0.002 ± 0.001 km3 a−1 during 1988–2008, with a lower rate during the past decade (0.001 ± 0.001 km3 a−1). The most dramatic water volume increases (>0.05 km3) occurred during 1993–94, 2000–01 and 2003–04, when synchronous dramatic decreases in glacier area and length were observed (Fig. 6b).
Glacier mass loss
Over the last three decades, a total mass loss of 0.286 ± 0.018 km3 w.e. from the host glacier was released into the proglacial lake (Table 1). The mean mass loss of Longbasaba Glacier decreased from an average of 0.012 ± 0.001 km3 w.e. a−1 during 1988–2000 to 0.010 ± 0.001 km3 w.e a−1 during 2000−18. The mean water inflow contributed by the glacier recession was 36% of the mean lake volume from 1988 to 2000, and the percentage was three times greater than the value (11%) during 2000–18. These mass budgets result in mean mass balances of −0.40 ± 0.02 m w.e. a−1 during 1988–2000 and −0.26 ± 0.02 m w.e. a−1 during 2000–18, contributing water to the lake at a mean mass balance magnitude of −0.32 ± 0.02 m w.e. a−1 over the last three decades.
Table 1. Mass loss from Longbasaba Glacier during 1988−2018.

p*: the mass contribution percentage relative to the total mass loss due to glacier recession.
The mass losses due to ice flow (M f) and terminus retreat (M r) are the total values over the corresponding periods. The mass losses due to surface lowering (M s) were generated by multiplying the mean surface lowering and the mean glacier area of the corresponding periods.
The water inflow released by the glacier degradation was predominately due to the glacier surface lowering, which contributed 71% of the total glacier mass wastage during 1988–2018 (0.203 ± 0.002 km3 w.e.). The remaining 23% of the mass budget was from glacier terminus retreat, with a water contribution of 0.066 ± 0.008 km3 w.e. during 1988−2018, while ice flow contributed <7% of the mass budget. During 1988−2000 and 2000−18, the mass loss due to glacier surface lowering decreased by 28%, accompanied by a lower mass contribution percentage over the last decade. At the same time, the mass contribution from the glacier terminus retreat doubled between the two periods, accompanied by the amplified contribution percentages from 5 to 7% in the ice flow. This caused the total mass loss contributed by the glacier terminus dynamics nearly to double between the two periods 1988−2000 and 2000−18.
Discussion
Uncertainties in the estimated mass contributions from glacier recession to lake water volume
For glaciers in high mountain regions, the groundwater system and evaporation/sublimation from glaciers have insignificant impacts on glacier hydrology and water resources in comparison to contributions from glacier melt and calving (Kang and others, Reference Kang, Cheng, Lan and Jin1999; Brock and others, Reference Brock2010; Liu and others, Reference Liu2010; Zhang and others, Reference Zhang, Hirabayashi and Liu2012). In addition, the evaporation loss from the glacier basin could be negligible for both current and warmer climate scenarios (Singha and others, Reference Singha and Bengtsson2005), due to the small vapor pressure gradient (Bengtsson, Reference Bengtsson1980). Lei and others (Reference Lei2013) and Treichler and others (Reference Treichler, Kääb, Salzmann and Xu2019) have both suggested that the groundwater exchange between different basins has a very limited influence on the water balance of the individual lakes according to the impermeability of the surrounding permafrost terrain. Thus, the overestimation of the mass contribution to lake water volume from glacier recession caused by ignoring the impact of evaporation/sublimation and infiltration is small and was considered to be negligible in this study. However, thawing of permafrost can become another potential source of water entering the proglacial lake.
Mechanism of the changes of Longbasaba Glacier
Glaciers in the Himalaya have experienced the greatest decrease in length and area, accompanied by the most negative mass balance in High Mountain Asia during the last decades (Yao and others, Reference Yao2012a). However, heterogeneous glacier changes have been reported in previous studies (Kääb and others, Reference Kääb, Berthier, Nuth, Gardelle and Arnaud2012; Gardelle and others, Reference Gardelle, Berthier, Arnaud and Kääb2013; Cogley, Reference Cogley2016; King and others, Reference King, Quincey, Carrivick and Rowan2017; Azam and others, Reference Azam2018).
For the lake-terminating glaciers in the central eastern Himalaya, the mean mass balance was −0.37 ± 0.10 m w.e. a−1 before 2000 and increased to −0.48 ± 0.11 m w.e. a−1 from 2000 to 2015 (King and others, Reference King, Bhattacharya, Bhambri and Bolch2019). In contrast, Longbasaba Glacier has experienced a less negative mass loss contributed by the surface lowering, and the thinning rate of Longbasaba Glacier decreased from 1975–2000 to 2000–16, leading to significantly different mass loss mechanisms from the lake-terminating glaciers in the central eastern Himalaya during the last decade.
For Longbasaba Glacier, the mean air temperature has increased by 0.029 ± 0.007°C a−1 over the period of 1979−2018, with a significant correlation at the 0.01 level (Fig. 7a). This warming rate was slightly greater than the temperature increase rate (mean 0.024 ± 0.004°C a−1 from 1967 to 2017) observed at Nyalam Station located at 3810 m a.s.l. and 210 km away from Longbasaba Glacier in the central Himalaya (Zhang and others, Reference Zhang2019). The changes in precipitation were heterogeneous in the central Himalaya (IPCC, 2018). An increase in precipitation was observed at Longbasaba Glacier, with a mean rate of 1.36 ± 1.24 mm a−1 (Fig. 7b). In contrast, a decrease in precipitation of −0.76 ± 1.34 mm a−1 on average during 1960−2013 was determined from the in situ measurements (Zhang and others, Reference Zhang2019). Based on the CMFD, Longbasaba Glacier receives more than 50% of its yearly precipitation in August and September, when the mean air temperatures approximately equal to 0°C, and is therefore likely in the form of rain (Fig. 7c).

Fig. 7. Yearly and monthly changes in mean air temperature and precipitation in the study area during 1979−2018. The time series of the temperature and precipitation were acquired from the data of the CMFD tiles covering Longbasaba Lake and the tongue of Longbasaba Glacier on the yearly and monthly scales. (a) Changes in yearly mean air temperature from 1979 to 2018. (b) Changes in yearly precipitation from 1979 to 2018. (c) Monthly characteristics of the mean air temperature and precipitation based on the daily values from 1979 to 2018.
Although Longbasaba Glacier is in direct contact with a proglacial lake, a faster decrease in glacier area and length was not observed along with lake expansion over this period (King and others, Reference King, Bhattacharya, Bhambri and Bolch2019; Zhang and others, Reference Zhang2019; Luo and others, Reference Luo, Zhang, Chen and Xu2020). The glaciers in the central Himalaya experience their maximum accumulation in summer, so they are more sensitive to climate warming (Fujita and others, Reference Fujita, Suzuki, Nuimura and Sakai2008; Yao and others, Reference Yao2012a; Sakai and others, Reference Sakai2015). This is because climate warming directly reduces the amount of solid precipitation (i.e. snow accumulation) and extends the melting period (Bolch and others, Reference Bolch2012). Unfortunately, we did not find a significant correlation between climate change (increases in temperature and decreases in precipitation) and the glacier degradation (decreases in area and surface lowering), even for different lag times of 3–5 years. In the Poiqu River Basin adjacent to Longbasaba Glacier, the surface elevations of the lake-terminating glaciers have decreased at higher mean rates of −0.65 ± 0.04 m a−1 during 1974−2000 and −0.80 ± 0.05 m a−1 during 2000−17 (Zhang and others, Reference Zhang2019). These rates are more negative than the values for Longbasaba Glacier and the lake-terminating glaciers in the Himalaya. This releases that the glacier shrinkage was controlled by other contributing mechanisms and more detailed models at the glacier-scale are needed.
It should be noted that heterogeneous retreats of the glacier terminus occurred at the center and flanks before 2008 (Fig. 3). During 1993−94, 2000−01 and 2003−04, the center of the glacier terminus experienced a greater retreat than the flanks (Fig. 8a). This is most likely caused by huge or numerous ice calving events from the central terminus considering the magnitude of the area decrease and the crevasses on the glacier terminus (Fig. 1b). When the area decreases mainly occurred at the flanks (Fig. 8b), the glacier length decreased slightly with a medium decrease in glacier area, such as during 1990−91, 1999−2000, 2001−03 and 2005−07. These specific patterns of glacier recession leaded to variable mass losses from glacier terminus prior to 2008, while the homogeneous retreat of the center and flanks caused a less variation for the glacier recession during 2008−18 (Figs 3 and 8c). The occurrence of both ice calving and subaqueous melt could exacerbate the surface lowering at the glacier terminus, and also the increased proglacial lake depth could enhance calving fluxes and glacier flow rates (Benn and others, Reference Benn, Warren and Mottram2007; Truffer and Motyka, Reference Truffer and Motyka2016; King and others, Reference King, Bhattacharya, Bhambri and Bolch2019; Tsutaki and others, Reference Tsutaki2019). On the contrary, the mass loss could drive the decrease in the glacier flow velocity (Dehecq and others, Reference Dehecq2018), resulting in lower calving rates. For Longbasaba Glacier, the amplified rate of terminus surface lowering would play a role on the decrease of flow velocities and the occurrence of ice calving during the last decade. Overall, for glaciers in direct contact with proglacial lakes, specific changes in area and ice mass are controlled by a complicated combination of processes and diverse local topographic conditions (Fujita and Sakai, Reference Fujita and Sakai2014; Immerzeel and others, Reference Immerzeel2014; King and others, Reference King, Quincey, Carrivick and Rowan2017; Song and others, Reference Song2017; Zhang and others, Reference Zhang2019). To assess the complex processes of the changes in glacier area and mass budget for the lake-terminating glaciers, detailed dynamic studies at the glacier-scale of the mass and energy interaction between glaciers and lakes are urgently needed in the future.

Fig. 8. Three categories representing different patterns of terminus retreat of Longbasaba Glacier during specific periods. The background maps are Landsat TM\OLI images taken in 1994, 2007 and 2017, respectively. (a) Retreat mainly occurred at the center of the glacier terminus during 1993−94. (b) Retreat mainly occurred on the flanks of the glacier terminus during 2005−07. (c) Homogeneous retreat of the glacier terminus at the center and on the flanks during 2016−17.
Expansion of the proglacial lake
Throughout the Himalaya, the surface area of proglacial lakes has expanded by 2.1% a−1 during 1990−2015, and the mean expansion rate increased from 1.8% a−1 during 1990−2010 to 2.3% a−1 during 2010−15 (Nie and others, Reference Nie2017). The fastest growth percentage occurred in the central Himalaya. For the proglacial lakes in contact with debris-covered glacier tongues, the surface area increased by a mean of 2.6% a−1 during 2000–14, with a lower expansion rate for lakes in contact with clean-ice glacier terminus (Song and others, Reference Song2017). For the 42 moraine-dammed glacial lakes on the northern slope of the central and eastern Himalaya, the total area has expanded by 43.6% during 1990–2015 (Begam and others, Reference Begam and Sen2019). The areas of the glacier lakes in the Poiqu River Basin expanded at a mean rate of 2.2% a−1 during 1964−2017, and the mean growth rate decreased from 2.4% a−1 during 1964–2010 to 0.2% a−1 during 2010−17 (Zhang and others, Reference Zhang2019). For the two fastest growing proglacial lakes in the Nepal Himalaya, the lake areas showed an accelerating growth rate during 1975–2017, with mean expansion rates of 0.03 km2 a−1 for Imja Lake and 0.04 km2 a−1 for Lower Barun Lake (Haritashya and others, Reference Haritashya2018).
A higher expansion percentage was found for Longbasaba Lake than for the other proglacial lakes throughout the Himalaya and the adjacent basins/regions (Nie and others, Reference Nie2017; Zhang and others, Reference Zhang2019). During 1978−2005, the surface area of Longbasaba Lake increased at a mean rate of 5.2% a−1, but which is less than the growth rate of 7.2% a−1 for the adjacent Pida Lake with an area of 0.97 km2 in 2005 (Wang and others, Reference Wang, Liu, Guo and Xu2008). For Longbasaba Lake, the mean expansion rate of 0.028 ± 0.001 km2 a−1 (8.3% a−1) was determined for 1977−2009, and the changes during 2000–09 were twice as large as the values during 1977−80 (Yao and others, Reference Yao, Liu, Sun, Wei and Guo2012b). In this study, a higher mean increase rate of 0.032 ± 0.001 km2 a−1, but a lower percentage (5.3% a−1), was determined for 1988–2009. This growth percentage decreased to 3.4% a−1 with a more mean increase rate of 0.035 ± 0.002 km2 a−1 during the last decade. Generally, the proglacial lakes initially formed with a small surface area, and then, they grew rapidly according to the front retreat of their host glaciers, which indicates that most of the expansion occurred at the beginning of lake growth (Wang and others, Reference Wang, Liu, Guo and Xu2008; Yao and others, Reference Yao, Liu, Sun, Wei and Guo2012b; Haritashya and others, Reference Haritashya2018).
For Longbasaba Lake, the water inflow due to the degradation of its host glacier was predominantly contributed by the glacier surface lowering, with a decrease during the last few decades. However, the mass loss from glacier terminus dynamics, including ice flow and frontal retreat, has doubled from 1988−2000 to 2000−18. This water budget is manifested by ice melting and calving from the glacier front. Although the occurrence and scale of ice calving has decreased over the most recent decade, the hazard risk of this proglacial lake could be promoted by the increase of mass loss contribution from terminus motions, the water volume expansion and the continuous deterioration of the permafrost in the moraine dam.
Proglacial lakes exacerbate recession of their host glaciers (King and others, Reference King, Bhattacharya, Bhambri and Bolch2019), which results in continued retreat of the glacier terminus. The bed elevation at the glacier front rises as the glacier terminus retreats. Once the bed elevation at the glacier front is equal to the lake water level in the future, the proglacial lake will physically detach from its host glacier and change to an unconnected glacial lake (Sakai and others, Reference Sakai, Nishimura, Kadota and Takeuchi2009; Haritashya and others, Reference Haritashya2018; Luo and others, Reference Luo, Zhang, Chen and Xu2020; Watson and others, Reference Watson2020). A continued retreat of Longbasaba Glacier was observed over the past three decades, and this retreat is expected to continue into the future. The subsequent retreat of the glacier terminus on the up-valley side of the proglacial lake would allow Longbasaba Glacier to become a land-terminating glacier. With the assumption that the glacier front retreat at the mean rate during 2008−18 (58 ± 15 m a−1) and the lake water level remains stable in the future, it should take approximately another four decades for the glacier terminus to separate from the lake, and the potential maximum surface area for the lake is ~2.623 ± 0.169 km2 (Fig. 6b). The potential maximum water volume is 0.110 ± 0.008 km3, with the mean and maximum depths of 48.8 ± 5.3 and 102.3 ± 5.3 m. It reveals expansion percentages of 64.9% in area and 32.4% in water volume relative to the corresponding values in 2018.
Conclusions
This study investigated the evolution of the recession of Longbasaba Glacier and the related expansion of the proglacial lake over the period of 1988−2018, while the mass contributions from glacier degradation to the water volume of the proglacial lake were assessed. The recession rate of Longbasaba Glacier has increased slightly during 1988−2019, but slowed down during the last decade. The glacier recession was more variable prior to 2008 than during 2000−18. The mean surface-lowering rate decreased between 1975−2000 and 2000−16. The mean areal shrinkage rate was lower than those of other glaciers throughout the Himalaya, whereas the glacier surface lowering rate was higher than the regional average in the decades before 2000 but lower during 2000 − 16. The extent and volume of Longbasaba Lake increased during 1988 − 2018, with expansion rates decreasing over the last decade. The water inflow was predominantly contributed by mass wastage due to glacier surface lowering. The mass contribution from glacier degradation has decreased between 1988 − 2000 and 2000 − 18. Nevertheless, glacier terminus retreat and flow contributed to an increasing amount of mass loss, which could increase the hazard risk of the proglacial lake. In the future, Longbasaba Lake may reach a maximum water volume of 0.110 ± 0.008 km3 after four decades, assuming the retreat rate of the host glacier remains stable.
Supplementary material
The supplementary material for this article can be found at https://doi.org/10.1017/jog.2020.119.
Data
The Landsat TM\ETM + \OLI images are available from the USGS (https://www.usgs.gov/land-resources/nli/landsat/landsat-level-1-processing-details). The High Mountain Asia Gridded Glacier Thickness Changes from Multi-sensor DEMs, Version 1 is available from the National Snow and Ice Data Center (NSIDC) (https://nsidc.org/data/hma_glacier_dh). The free software module Co-registration of Optically Sensed Images and Correlation (COSI-Corr) is available from the Caltech Tectonics Observatory (TO) (http://www.tectonics.caltech.edu/slip_history/spot_coseis/download_software.html). The consensus estimates of the ice thickness and the glacier surface DEMs are available from ETH Zurich (https://doi.org/10.3929/ethz-b-000315707). The China Meteorological Forcing Dataset (CMFD) is released by the National Tibetan Plateau Data Center (http://data.tpdc.ac.cn/en/data/8028b944-daaa-4511-8769-965612652c49/). The in situ echo sounder points with positions and water depths for Longbasaba Lake can be obtained from Junfeng Wei upon request.
Acknowledgements
This work was funded by the fundamental program of the National Natural Science Foundation of China (grant no. 41701061) and the research project of Hunan University of Science and Technology (grant no. E51669). This research was also supported by the fundamental program of the National Natural Science Foundation of China (grant no. 41761144075 and 41771075), and the National Key Research and Development Program of China (grant no. 2018YFE0100100). We are grateful to the California Institute of Technology (CIT) for providing the not-for-profit institution with the COSI-Corr software. We thank the two anonymous reviewers, Hester Jiskoot (Chief editor) and Dan Shugar (Scientific editor) for their contributions to the final version of this paper.


 Open access