the Creative Commons Attribution 4.0 License.
the Creative Commons Attribution 4.0 License.
 | 26 Jan 2021
The response of annual minimum temperature on the eastern central Tibetan Plateau to large volcanic eruptions over the period 1380–2014 CE
Yajun Wang
Xuemei Shao
Yong Zhang
Mingqi Li
Volcanic eruptions have a significant impact on global temperature; their consequences are of particular interest in regions that are especially sensitive to climate change, like the Tibetan Plateau. In this study, we develop a temperature-sensitive tree-ring-width standard chronology covering the period 1348–2014 CE using Qilian juniper (Sabina przewalskii (Kom.)) samples collected from the Animaqin Mountains on the Tibetan Plateau. We reconstruct the annual (prior August to current July) mean minimum temperature (Tmin) since 1380 CE and show that our reconstruction explains 58 % of the variance during the 1960–2014 calibration period. Our results demonstrate that in 77.8 % of cases in which a volcanic eruption with a Volcanic Explosivity Index of 5 or greater occurs, temperature decreases in the year of or the year following the eruption. The results of the superposed epoch analysis also indicate that there is a high probability that the Tmin decreases for 2 years after a large volcanic eruption, especially when such eruptions occur in the Northern Hemisphere.
- Article
(7322 KB) -
Supplement
(191 KB) - BibTeX
- EndNote


Large volcanic eruptions can affect the climate of the Earth (Robock, 2000) and have played a major role in past global temperature changes (Salzer and Hughes, 2007). Eruptions emit large amounts of ash particles and gases into the atmosphere, much of which is carried to other regions by atmospheric movement. These materials efficiently reflect incident solar radiation, resulting in the cooling of the Earth's surface. However, volcanic eruptions of similar magnitudes do not necessarily result in cooling across all areas of the world. For example, the 1991 eruption of Mount Pinatubo, Philippines, caused summer cooling over much of the globe in 1992, but the temperature in some areas was above average (Robock and Mao, 1992). Thus, it is not necessarily clear to what extent or in what manner a strong volcanic eruption will influence temperature in a particular region.
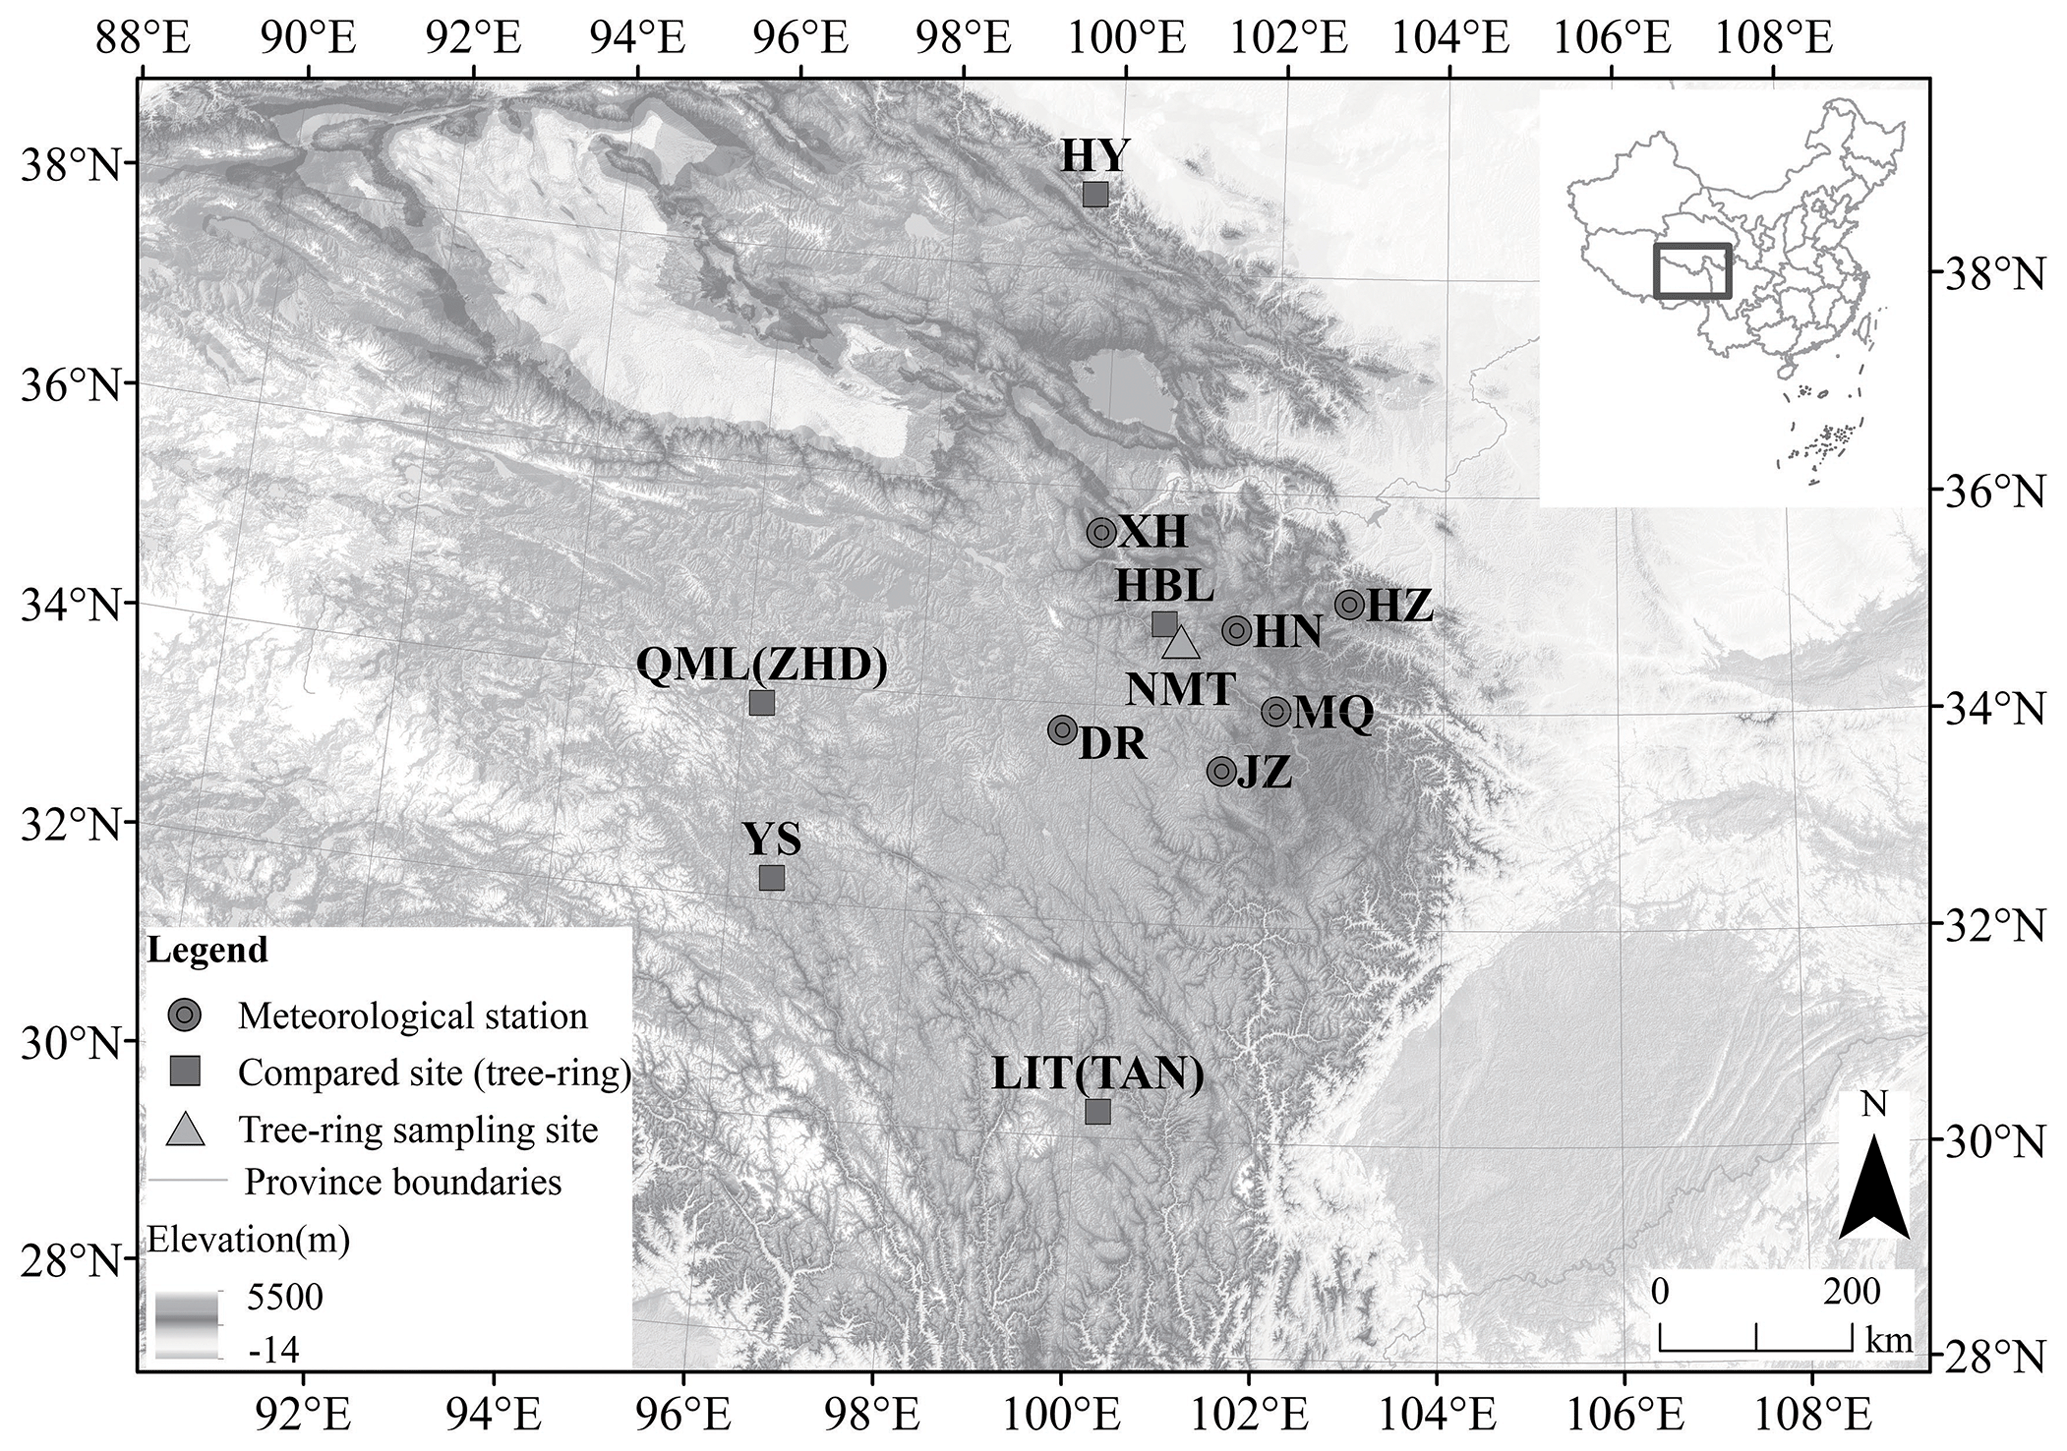
Figure 1Locations of the sampling sites, meteorological stations, and compared sites. The digital elevation model is provided by the Geospatial Data Cloud site, Computer Network Information Center, Chinese Academy of Sciences (http://www.gscloud.cn, last access: 10 December 2020).
Often referred to as the “third pole”, the Tibetan Plateau (TP) is especially sensitive to climate change (Yao et al., 2012) and may therefore be more profoundly influenced by volcanic eruptions. As early as 1985, studies of the relationship between large volcanic eruptions (dust veil index >1000 m3) and temperature variations from 1951 to 1980 in China (Zhang and Zhang, 1985) demonstrated that temperature on the northeastern TP decreased 8, 15, and 18 months after eruptions. However, temperatures in the 6 months immediately following an eruption were found to be relatively high. Jia and Shi (2001) studied climate signals following volcanic eruptions from 1950 to 1997 and found that temperatures on the TP dropped for 2 years following eruptions. However, new research focusing on regional differences over China found that winter volcanic eruptions occurring between 1956 and 2005 led to extensive warming of winter temperatures over the Tibetan Plateau (Sun et al., 2019). These studies show that temperature on the TP is affected by volcanic activity, but it is important to note that they are based on instrumental data, which covers a relatively short time span. Temperature changes caused by strong volcanic eruptions can affect tree growth (Tognetti et al., 2012). This influence that can be seen in the rings of certain trees (D'Arrigo et al., 2013; Filion et al., 1986; Lamarche and Hirschboeck, 1984) and used to identify past volcanic activity (D'Arrigo et al., 2013; Filion et al., 1986; Lamarche and Hirschboeck, 1984). Especially when long-lived trees are available, tree rings can serve as temperature-sensitive proxies for investigating climate responses to volcanic eruptions that occurred prior to the instrumental record (D'Arrigo et al., 2013; Salzer and Hughes, 2007).
Tree rings from the TP can potentially be used to study the regional response of climate to volcanic activities. Previous tree-ring-based studies have shown that some cold years are closely correlated with large volcanic events (Liang et al., 2008, 2016; Zhang et al., 2014). Li et al. (2017a) quantitatively assessed the correlation between temperature changes on the southeastern TP and volcanic eruptions and showed that most of the years of extreme cold in the past 304 years occurred 1–2 years after major volcanic eruptions. However, the influence of volcanic eruptions on temperatures on the TP over the long term is less well understood due to the paucity of data in this region.
The Animaqin Mountains are located on the northeastern TP and have yielded many long tree-ring series (Chen et al., 2016; Gou et al., 2007, 2008, 2010). These series can provide a significant record of how tree growth responds to volcanic eruptions, but such studies are still rare across this area of the TP. Using tree-ring samples of Qilian juniper (Sabina przewalskii (Kom.)) collected from a new sample site in the southeastern part of the Animaqin Mountains, we develop a 667-year tree-ring-width chronology. We then use the chronology to reconstruct annual mean minimum temperatures (Tmin) across the eastern central TP. Finally, we explore the response of Tmin to strong volcanic eruptions (Volcanic Explosivity Index (VEI) >4) over the past 6 centuries.
Table 1Meteorological station details.
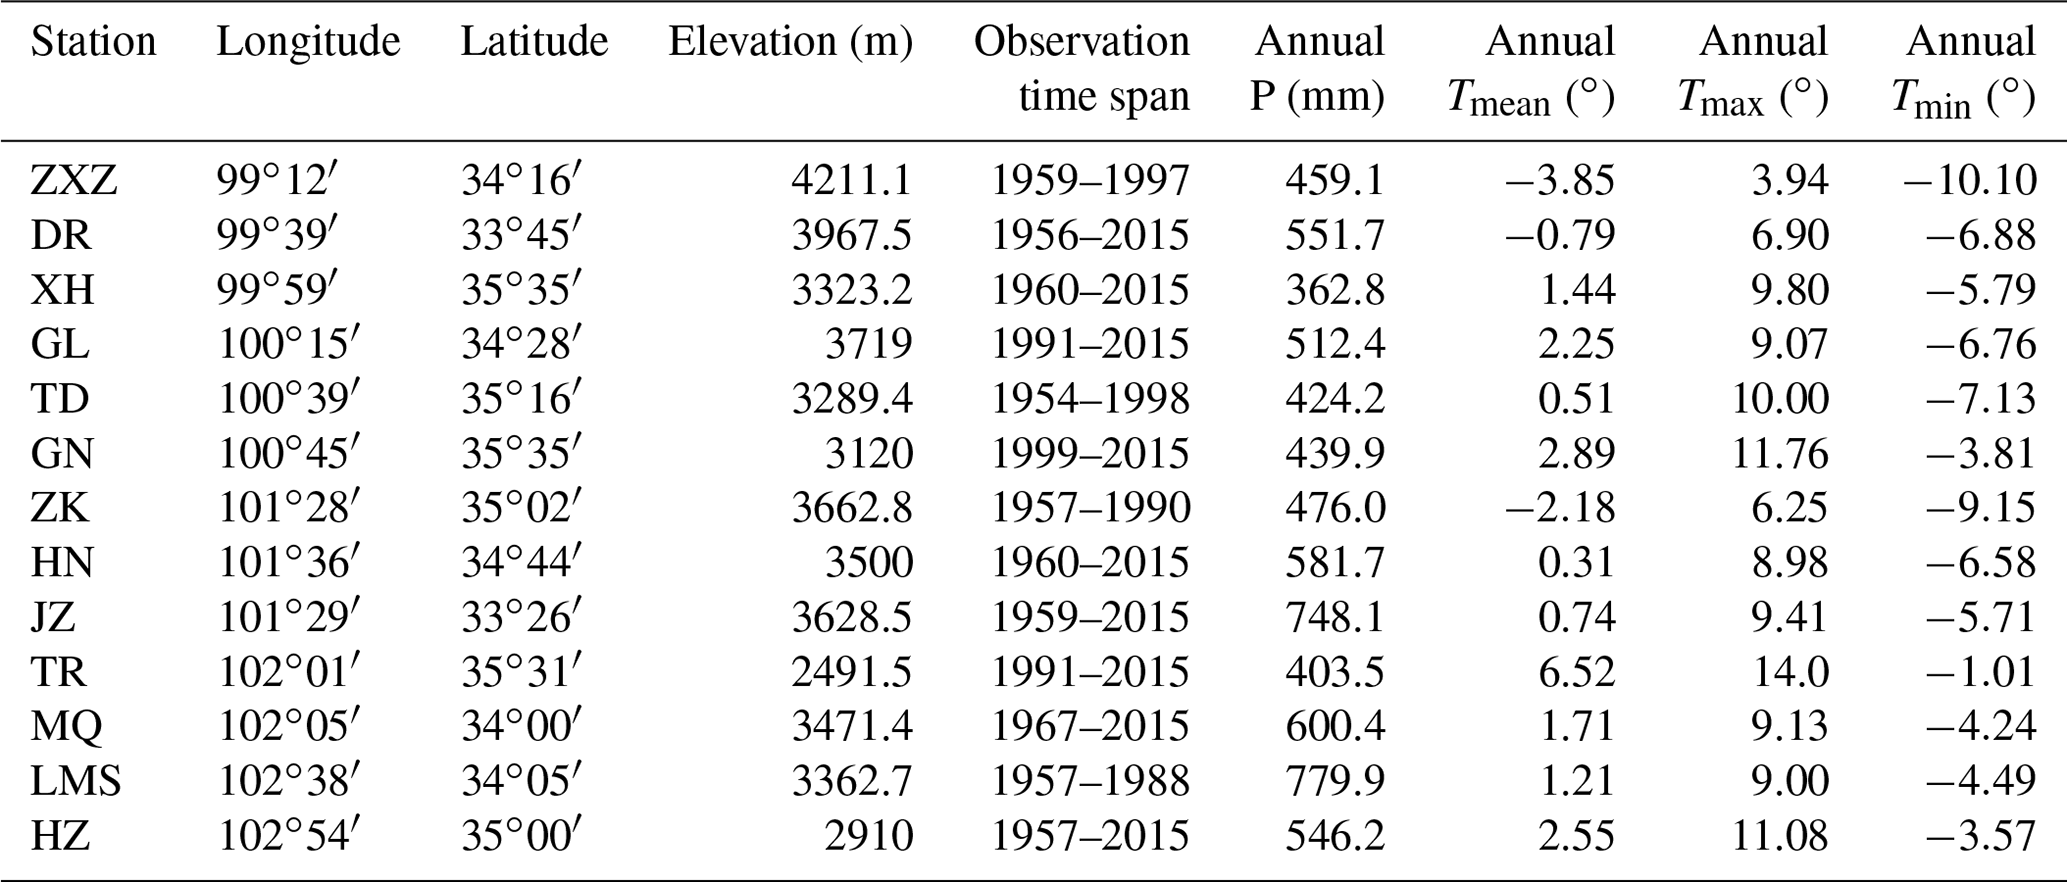
Note: ZXZ: Zhongxinzhan; DR: Dari; XH: Xinghai; GL: Guoluo; TD: Tongde; GN: Guinan; ZK: Zeku; HN: Henan; JZ: Jiuzhi; TR: Tongren; MQ: Maqu; LMS: Langmusi; HZ: Hezuo.
2.1 Tree-ring data
Qilian juniper samples were taken from a natural woodland 35 km west of Ningmute town, Henan County, Qinghai Province, China (100.96∘ E, 34.62∘ N, 3806 m a.s.l.). This area is located in the sub-frigid zone and has a semi-humid climate (Zheng et al., 2013). According to climate data of the Henan meteorological station (1960–2015; Table 1), mean annual temperature is 0.31∘ and mean annual precipitation is 582 mm. Precipitation is mainly concentrated between May and September. Because the site is close to the Yellow River and the soil layer in the forest area is thick, the moisture conditions of the forest are good. The regional vegetation zone is coniferous forest and the main tree species include Sabina przewalskii (Kom.), Picea crassifolia (Kom.), Betula spp., and Salix cheilophila. The study area is located on the southern slope of the Animaqin Mountains and ranges in elevation from 3523 to 3900 m a.s.l. (Fig. 1). The gradient of the slope is 30–40∘. A total of 110 cores from 55 trees were drilled at chest height with an increment borer in 2015.
The cores were air-dried, fixed to wooden mounts, polished, and cross-dated. The cores were then measured using a Lintab 6 tree-ring-width measuring instrument with a resolution of 0.01 mm. The COFECHA program (Holmes, 1983) was used to check the quality of the cross-dating and the accuracy of the measurements. The signal-free standardization method (Melvin and Briffa, 2008) was adopted to standardize the tree-ring data in order to minimize trend distortion in the chronologies produced by the straight-line detrending method. The RCSigFree program (https://www.ldeo.columbia.edu/tree-ring-laboratory/resources/software, 18 January 2021) was used to establish the tree-ring-width chronology. In this procedure, the age trend curve was fitted to a cubic smoothing spline with a 50 % cutoff at approximately 67 % of the mean segment length. The validity of the chronology was assessed using the mean correlation coefficient for the tree-ring series (Rbar) and the value of the expressed population signal (EPS).
2.2 Instrumental data
Thirteen meteorological stations were identified in the region of the sampling site: Zhongxinzhan (ZXZ), Dari (DR), Xinghai (XH), Guoluo (GL), Tongde (TD), Guinan (GN), Zeku (ZK), Henan (HN), Jiuzhi (JZ), Tongren (TR), Maqu (MQ), Langmusi (LMS), and Hezuo (HZ). For each station, data for four climate parameters – monthly total precipitation (P), monthly mean temperature (Tmean), monthly mean minimum temperature (Tmin), and monthly mean maximum temperature (Tmax) – were extracted from the China Meteorological Data Sharing Service System (http://www.cma.gov.cn/2011qxfw/2011qsjgx, last access: 10 December 2020). Details are provided in Table 1.
Because the observation intervals of the stations shown in Table 1 differ, it was necessary to select the longest record to ensure the stability of the correlation function. Seven stations with instrumental data spanning <30 years were excluded: GL, GN, and TR (all of which were established in the 1990s), and ZXZ, TD, ZK, and LMS (all of which ceased monitoring in the 1980s or 1990s). Climate data from the other six stations (DR, XH, HN, JZ, MQ, and HZ) were used for the following analysis (Fig. 1). During the quality control of the data from the six stations, we found that there are some problems in the instrumental data from the HN, JZ, and XH stations. For example, there are some missing values in April and May in 1962 at JZ station. To resolve this problem, we used the interpolation approach to estimate the missing values based on the complete instrumental records from nearby stations (see the Supplement for details). Finally, taking the means for the interval 1971–2000 as references, we calculated the precipitation departure percentages and average temperature departures for all six stations. The mean values are considered to be representative of the regional climate. The monthly climate data from previous July to current September were used to analyze the response of tree growth to climate change.
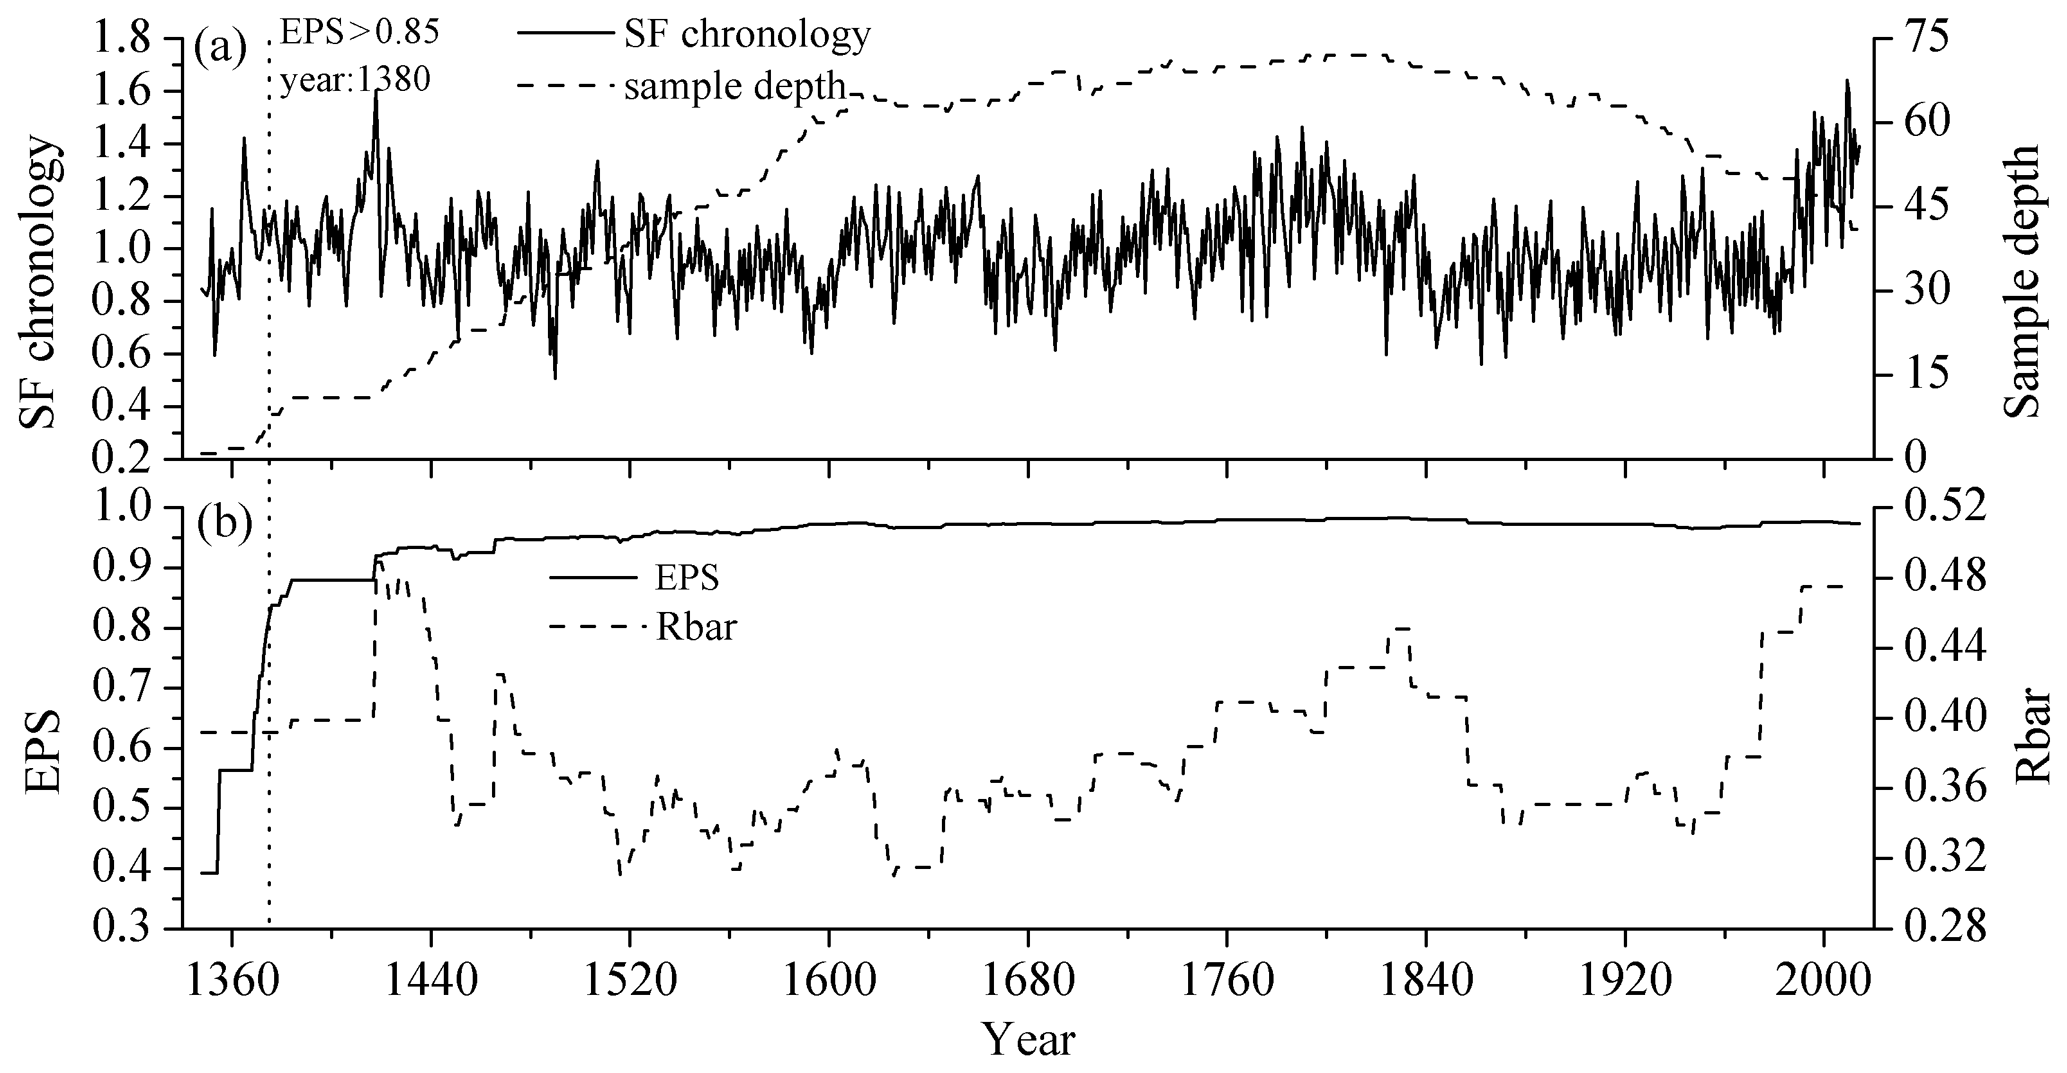
Figure 2(a) Tree-ring-width chronology; (b) EPS and Rbar values. The dotted vertical line denotes the year 1380 CE, which is when the EPS value exceeds the 0.85 threshold.
2.3 Volcanic data
Data about volcanic activity were obtained from the VEI sequence published by the Smithsonian Institution Global Volcanism Program (http://volcano.si.edu, 10 December 2020). Globally, there have been 46 strong volcanic eruptions (VEIs >4) since 1380 CE. For this study, it is important to note that eruptions that occurred in October, November, or December of a given year are marked as being a volcanic event in the following year. This is because tree radial growth mostly stops in October on the TP. We developed seven sets of volcanic data for further analysis based on geography: (a) global; (b) Northern Hemisphere; (c) Southern Hemisphere; (d) low latitude 30∘ S–30∘ N; (e) Northern Hemisphere midlatitude 30–60∘ N; (f) Southern Hemisphere midlatitude 30–60∘ S; and (g) Northern Hemisphere high latitude.
2.4 Methods
The correlation function was used to analyze the relationship between the tree-ring-width index and climatic factors. A fitted equation was then established using a simple linear regression and verified by the cross-validation method (Michaelsen, 1987) and by split-period calibration or verification analysis (Meko and Graybill, 1995). Several statistical tests (sign test, product mean value, reduction error, and coefficient of efficiency) were utilized. The split periods for calibration were 1960–1991 and 1984–2014. The correlations between the observed and reconstructed series and the gridded dataset (TS3.22; Mitchell and Jones, 2005) from the University of East Anglia Climatic Research Unit (CRU) were analyzed using the KNMI Climate Explorer research tool (http://climexp.knmi.nl, 10 December 2020). The superposed epoch analysis (SEA) method (Haurwitz and Brier, 1981) was used to analyze the influence of volcanic activity on regional temperature. SEA is a statistical method used to resolve significant signal-to-noise problems and is often used to study the link between climate and discrete events such as solar activity, fire events, and volcanic activity (Adams et al., 2003; Singh and Badruddin, 2006; Swetnam, 1993; Esper et al., 2013). In this study, the year of a volcanic eruption is regarded as year 0. The years before the volcanic eruption are denoted as −1, −2, −3, and so forth, whereas the years after the eruption are expressed as 1, 2, 3, etc. The impact of volcanic eruptions on temperature on the eastern central TP was analyzed by comparing differences in temperature in the years leading up to and following an eruption. The significance of responses was determined by a Monte Carlo resampling procedure (10 000 iterations) (Adams et al., 2003).
3.1 Statistical characteristics of the chronology
The tree-ring-width chronology covers the time period from 1348 to 2014 CE (Fig. 2a) and has an average length of 325.1 years. The average sensitivity is 0.171; the first-order autocorrelation coefficient is 0.261. The signal-to-noise ratio is 21.870, the EPS is 0.956, and the Rbar ranges between 0.31 and 0.489. The chronology is considered reliable (EPS >0.85) from 1380 CE, at which point the sample depth is 9.
3.2 Correlations between the tree-ring-width index and climate factors
Figure 3a shows that the tree-ring-width index correlates positively and significantly with precipitation in February and has a positive correlation with Tmean, Tmax, and Tmin, most notably with Tmean and Tmin. For the 15-month period from previous July to current September, the tree-ring-width index correlates significantly and positively with the monthly Tmin except during previous August. Correlation with annual Tmin (from previous August through current July; hereafter referred to as Tmin87) is at the 0.01 significance level.
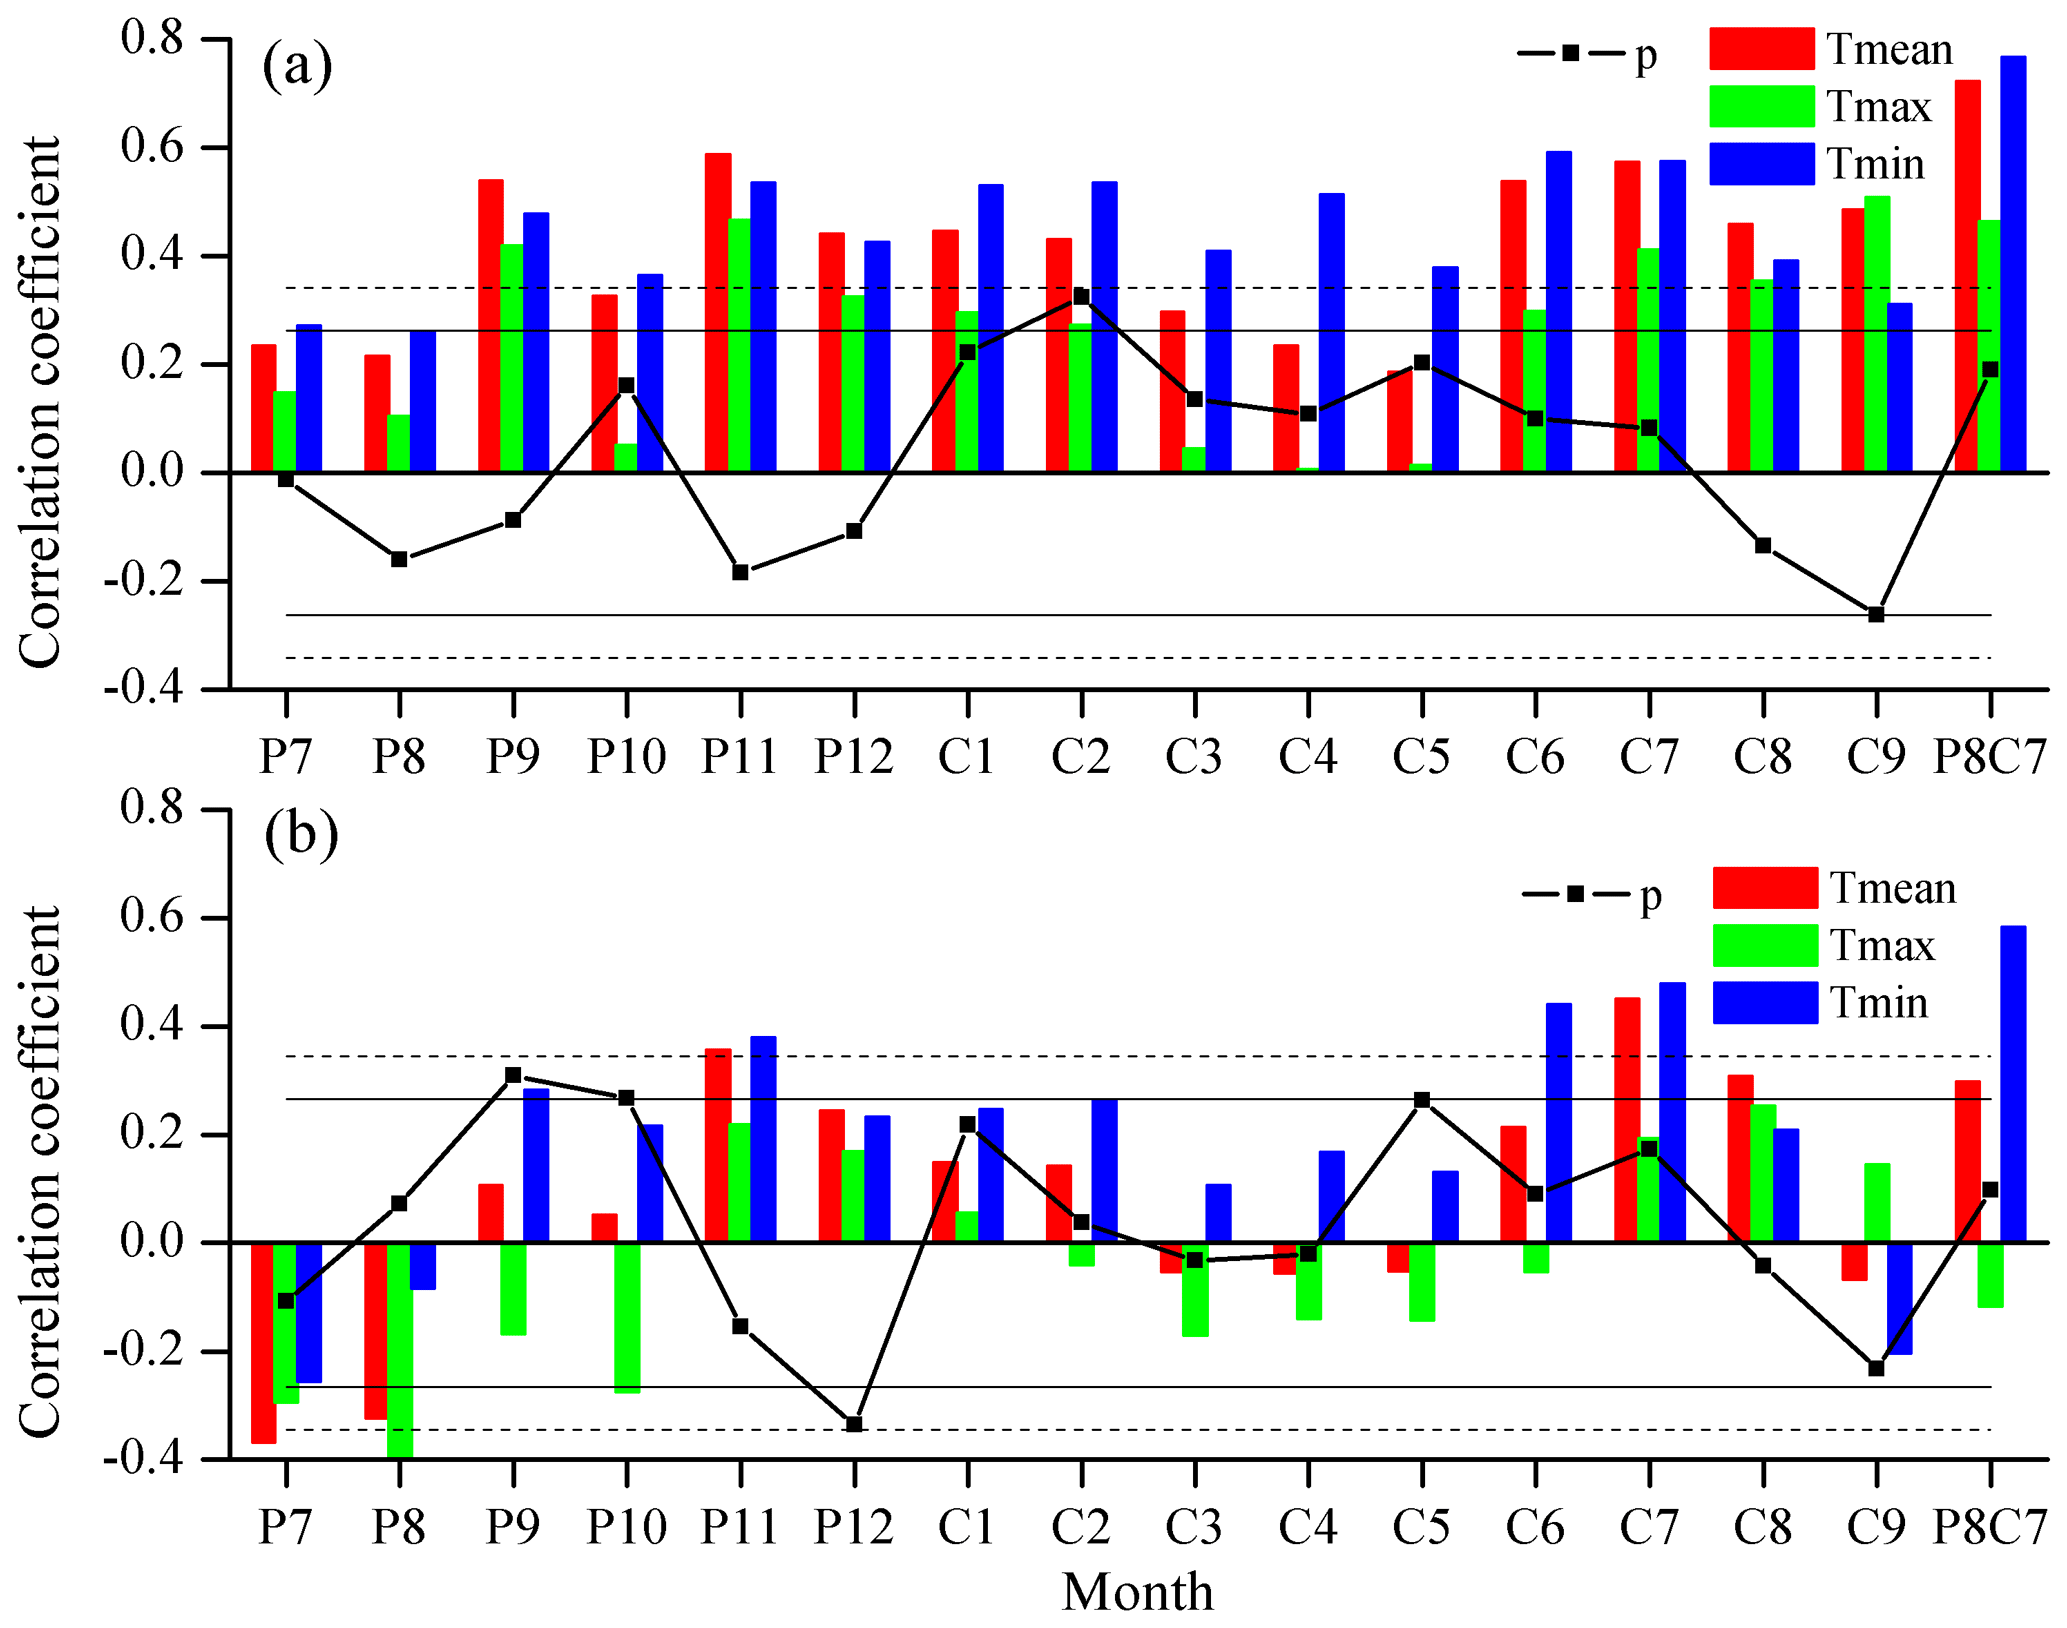
Figure 3Correlations between (a) the tree-ring width index and climate data and (b) the first-differenced tree-ring-width index and climate data. The horizontal solid lines indicate the 0.05 significance level; the horizontal dashed lines show the 0.01 significance level. Annu. represents the entire period from previous August to current July.
The first-differenced correlations between the tree-ring-width index and climate data are weak; in some months, the first-order correlations are even negative (Fig. 3b). The first-differenced chronology correlates significantly and positively with precipitation of the previous September and the current May but negatively with precipitation of the previous December. For temperature, the tree-ring-width index shows clear correlations with Tmean and Tmin and correlates significantly and positively with Tmin of previous September and November and current February, June, and July. The positive correlation with the annual Tmin is at the 0.01 significance level.
The tree-ring-width index is most strongly correlated with Tmin87 (r=0.767, p<0.001). This correlation remains strong and positive after first differencing (r=0.583, p<0.001), which indicates that the tree-ring-width index is suitable for reconstructing the Tmin87 for the given period.
3.3 Reconstruction development and verification
The tree-ring-width index for the current year (SFt) was selected as the predictor to reconstruct the annual mean minimum temperature departure (Tmin87):
The reconstruction accounts for 58 % of the variance in the instrumental series during the calibration period (1960–2014). The F value is 74.187 and exceeds the 0.001 confidence level. The transfer function is therefore highly significant (Fig. 4a and b).

Figure 4(a) Scatterplot of the tree-ring index and the instrumental annual Tmin. (b) Instrumental (black line) and reconstructed (gray line) annual Tmin. (c) Changes in annual Tmin since 1380 CE and the 11-year moving average (black solid line).
Cross validation for the calibration period 1960–2014 shows that the sign test (ST) and the first-difference sign test (FST) are all significant at the 0.01 level (Table 2). ST or FST are also significant for the split periods 1960–1991 and 1984–2014, indicating that the reconstructed Tmin87 is in good agreement with the instrumental values for the split periods and for the overall period. The product mean value of 5.13 (p<0.01) implies favorable coincidence in the two series. A reduction error (RE) value of 0.557 for the whole 1960–2014 period indicates a high degree of similarity between the reconstructed and instrumental series. Thus, Eq. (1) is suitable for reconstructing changes in Tmin87.
Table 2Statistics of cross-validation and split-period calibration or verification.
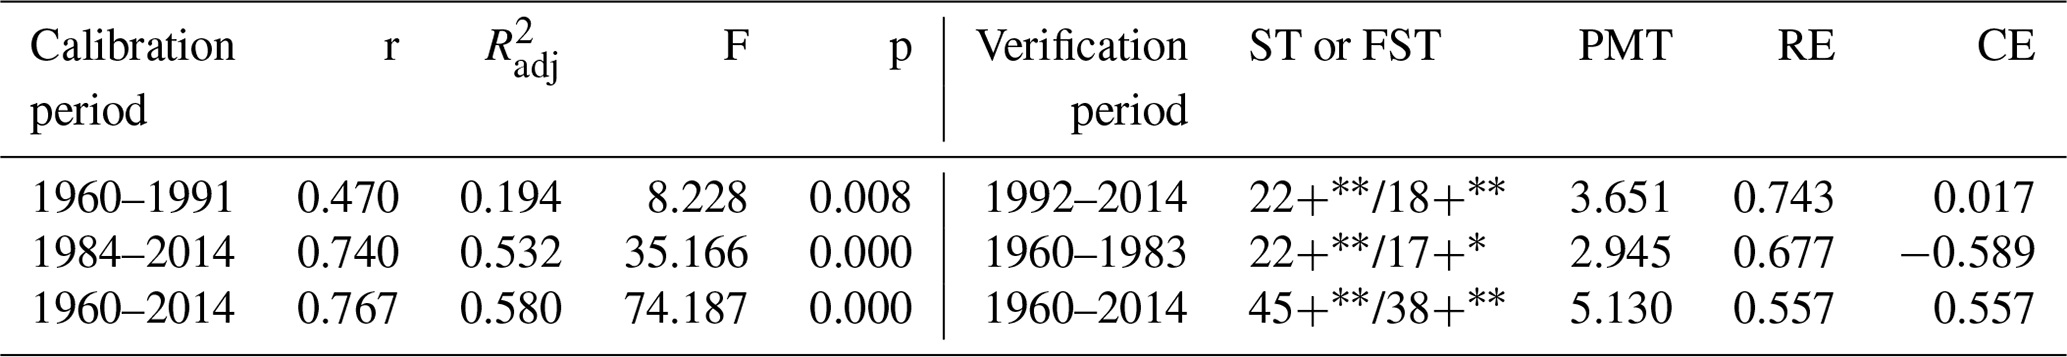
r: Pearson correlation coefficient; : variance after adjusting; ST or FST: sign test or first-difference sign test; PMT: product mean test; RE: reduction error; CE: coefficient of efficiency. * p<0.05; p<0.01.
3.4 Tmin87 change since 1380 CE
The reconstructed Tmin87 from 1380–2014 CE (Fig. 4c) shows clear interannual variations in temperature. The mean of the reconstructed Tmin87 is −0.15∘C (standard deviation σ=0.41). Tmin87 values below the mean 1.5σ are defined here as “extreme cold”, and values above the mean 1.5σ as “extreme warm”. There are 39 extreme cold years; the five coldest are 1488, 1490, 1824, 1862, and 1872. There are 47 extreme warm years; the five warmest are 1418, 1996, 1999, 2009, and 2010. Cold periods lasting longer than 5 years are 1483–1495, 1555–1568, 1586–1602, 1686–1696, 1840–1854, 1872–1876, 1893–1901, 1910–1920, 1961–1968, and 1975–1983. Of these, 1586–1602 was the longest period and experienced the lowest temperatures, followed by 1840–1854. Warm periods lasting more than 5 years were 1409–1424, 1504–1509, 1655–1659, 1729–1739, 1775–1779, 1781–1813, and 1991–2009. The longest warm period was 1781–1813, and the warmest interval was 1991–2009, followed by 1409–1424. Changes at both high and low frequencies over the study period clearly indicate that the climate on the TP has been warming, especially since the 1980s.
3.5 Spatial representation
Correlations between the reconstructed series, instrumental data, and the CRU gridded annual Tmin are high over most of China and even across most of Asia for the period 1960–2014 (Fig. 5a and b). However, the first-differenced instrumental data only correlate significantly with the CRU gridded data over the TP (Fig. 5c). The coverage of the significant first-differenced correlations of reconstructed Tmin87 with the CRU grid data is smaller and is mainly located on the central and western part of the TP, especially around the Animaqin Mountains (Fig. 5d).
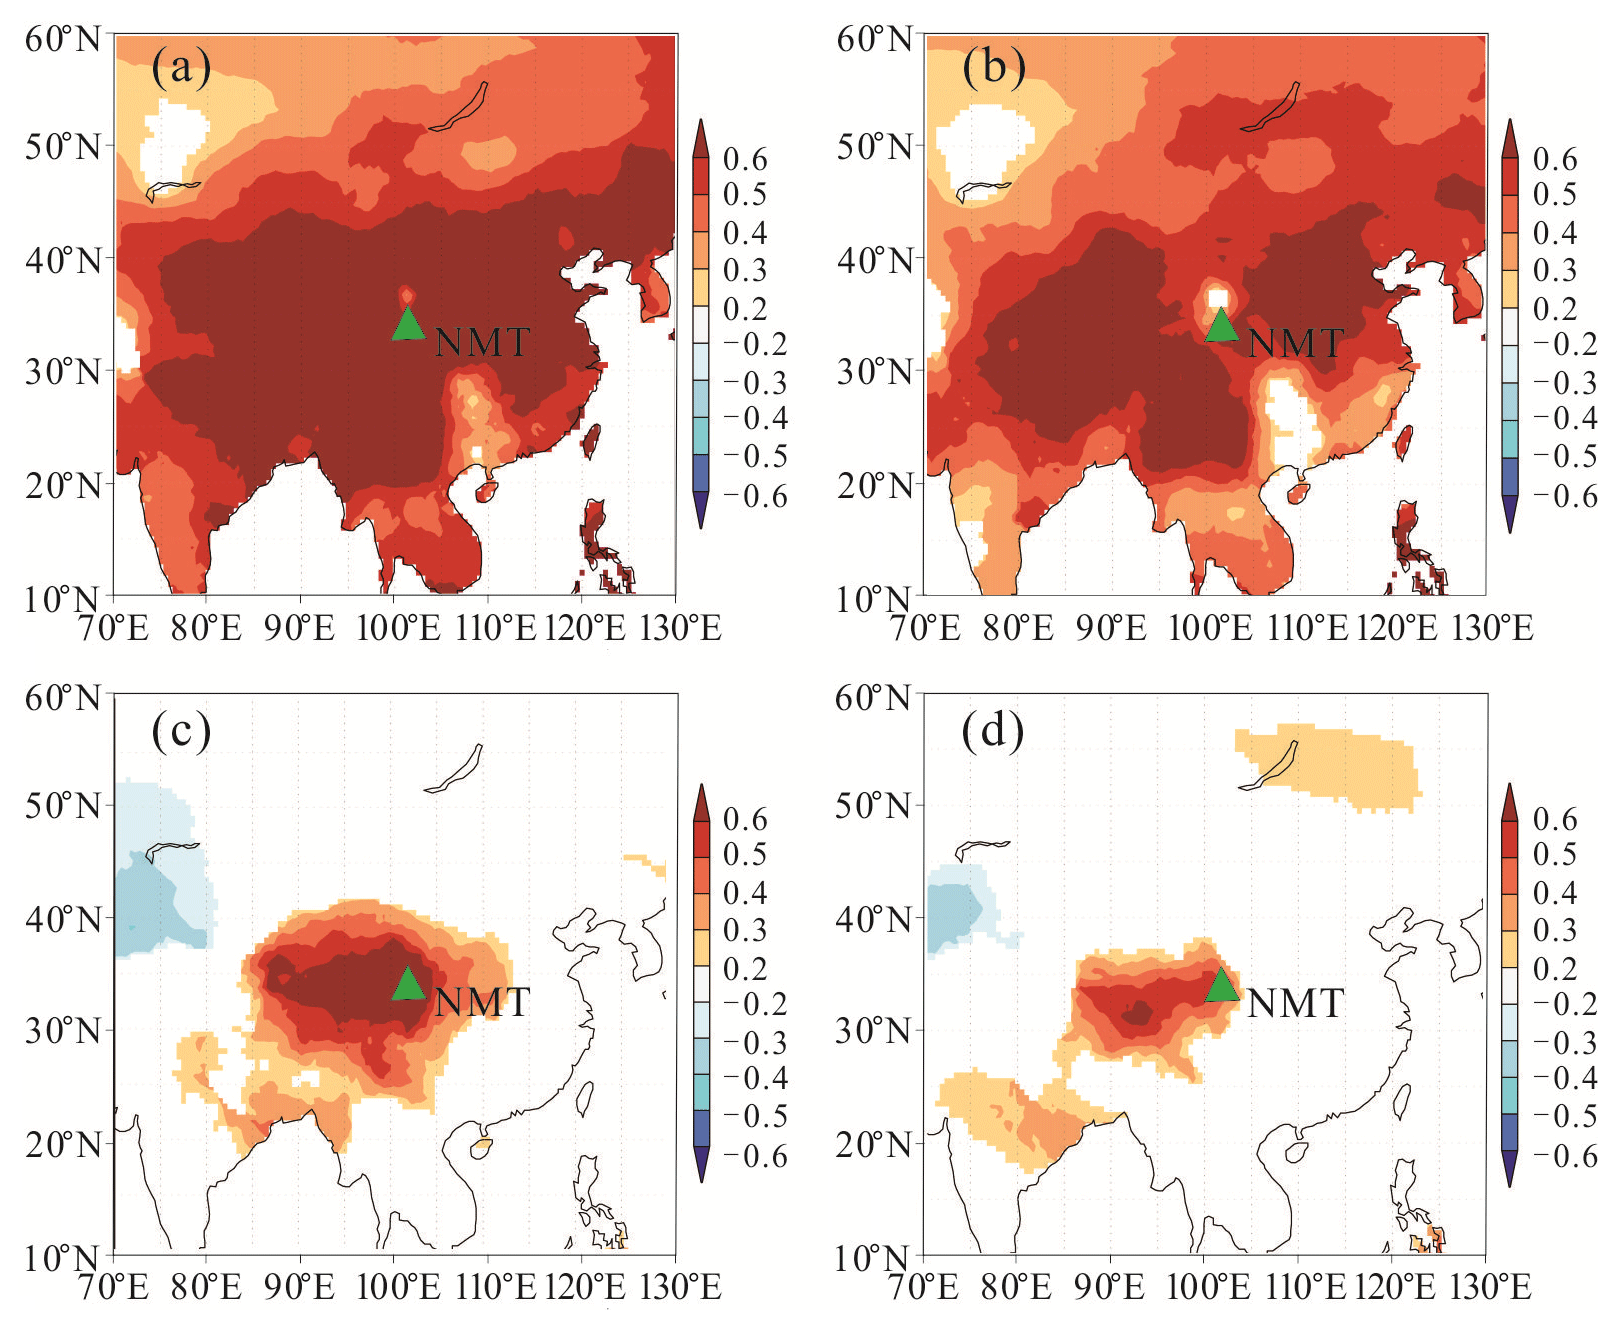
Figure 5Correlations of CRU Tmin87 with Tmin87: (a) instrumental; (b) reconstructed; (c) first-differenced instrumental; and (d) first-differenced reconstructed.
3.6 Relationship between volcanic activity and minimum temperature
A comparison of large volcanic eruption events and the reconstructed Tmin87 is shown in Fig. 6. For most years, large volcanic eruptions (VEIs >4) coincide with a drop in Tmin across the study area. Of the 46 strong volcanic eruption years, there are 35 event years in which temperature decreases in the year of the eruption or 1, 2, or even 3 years after the event.
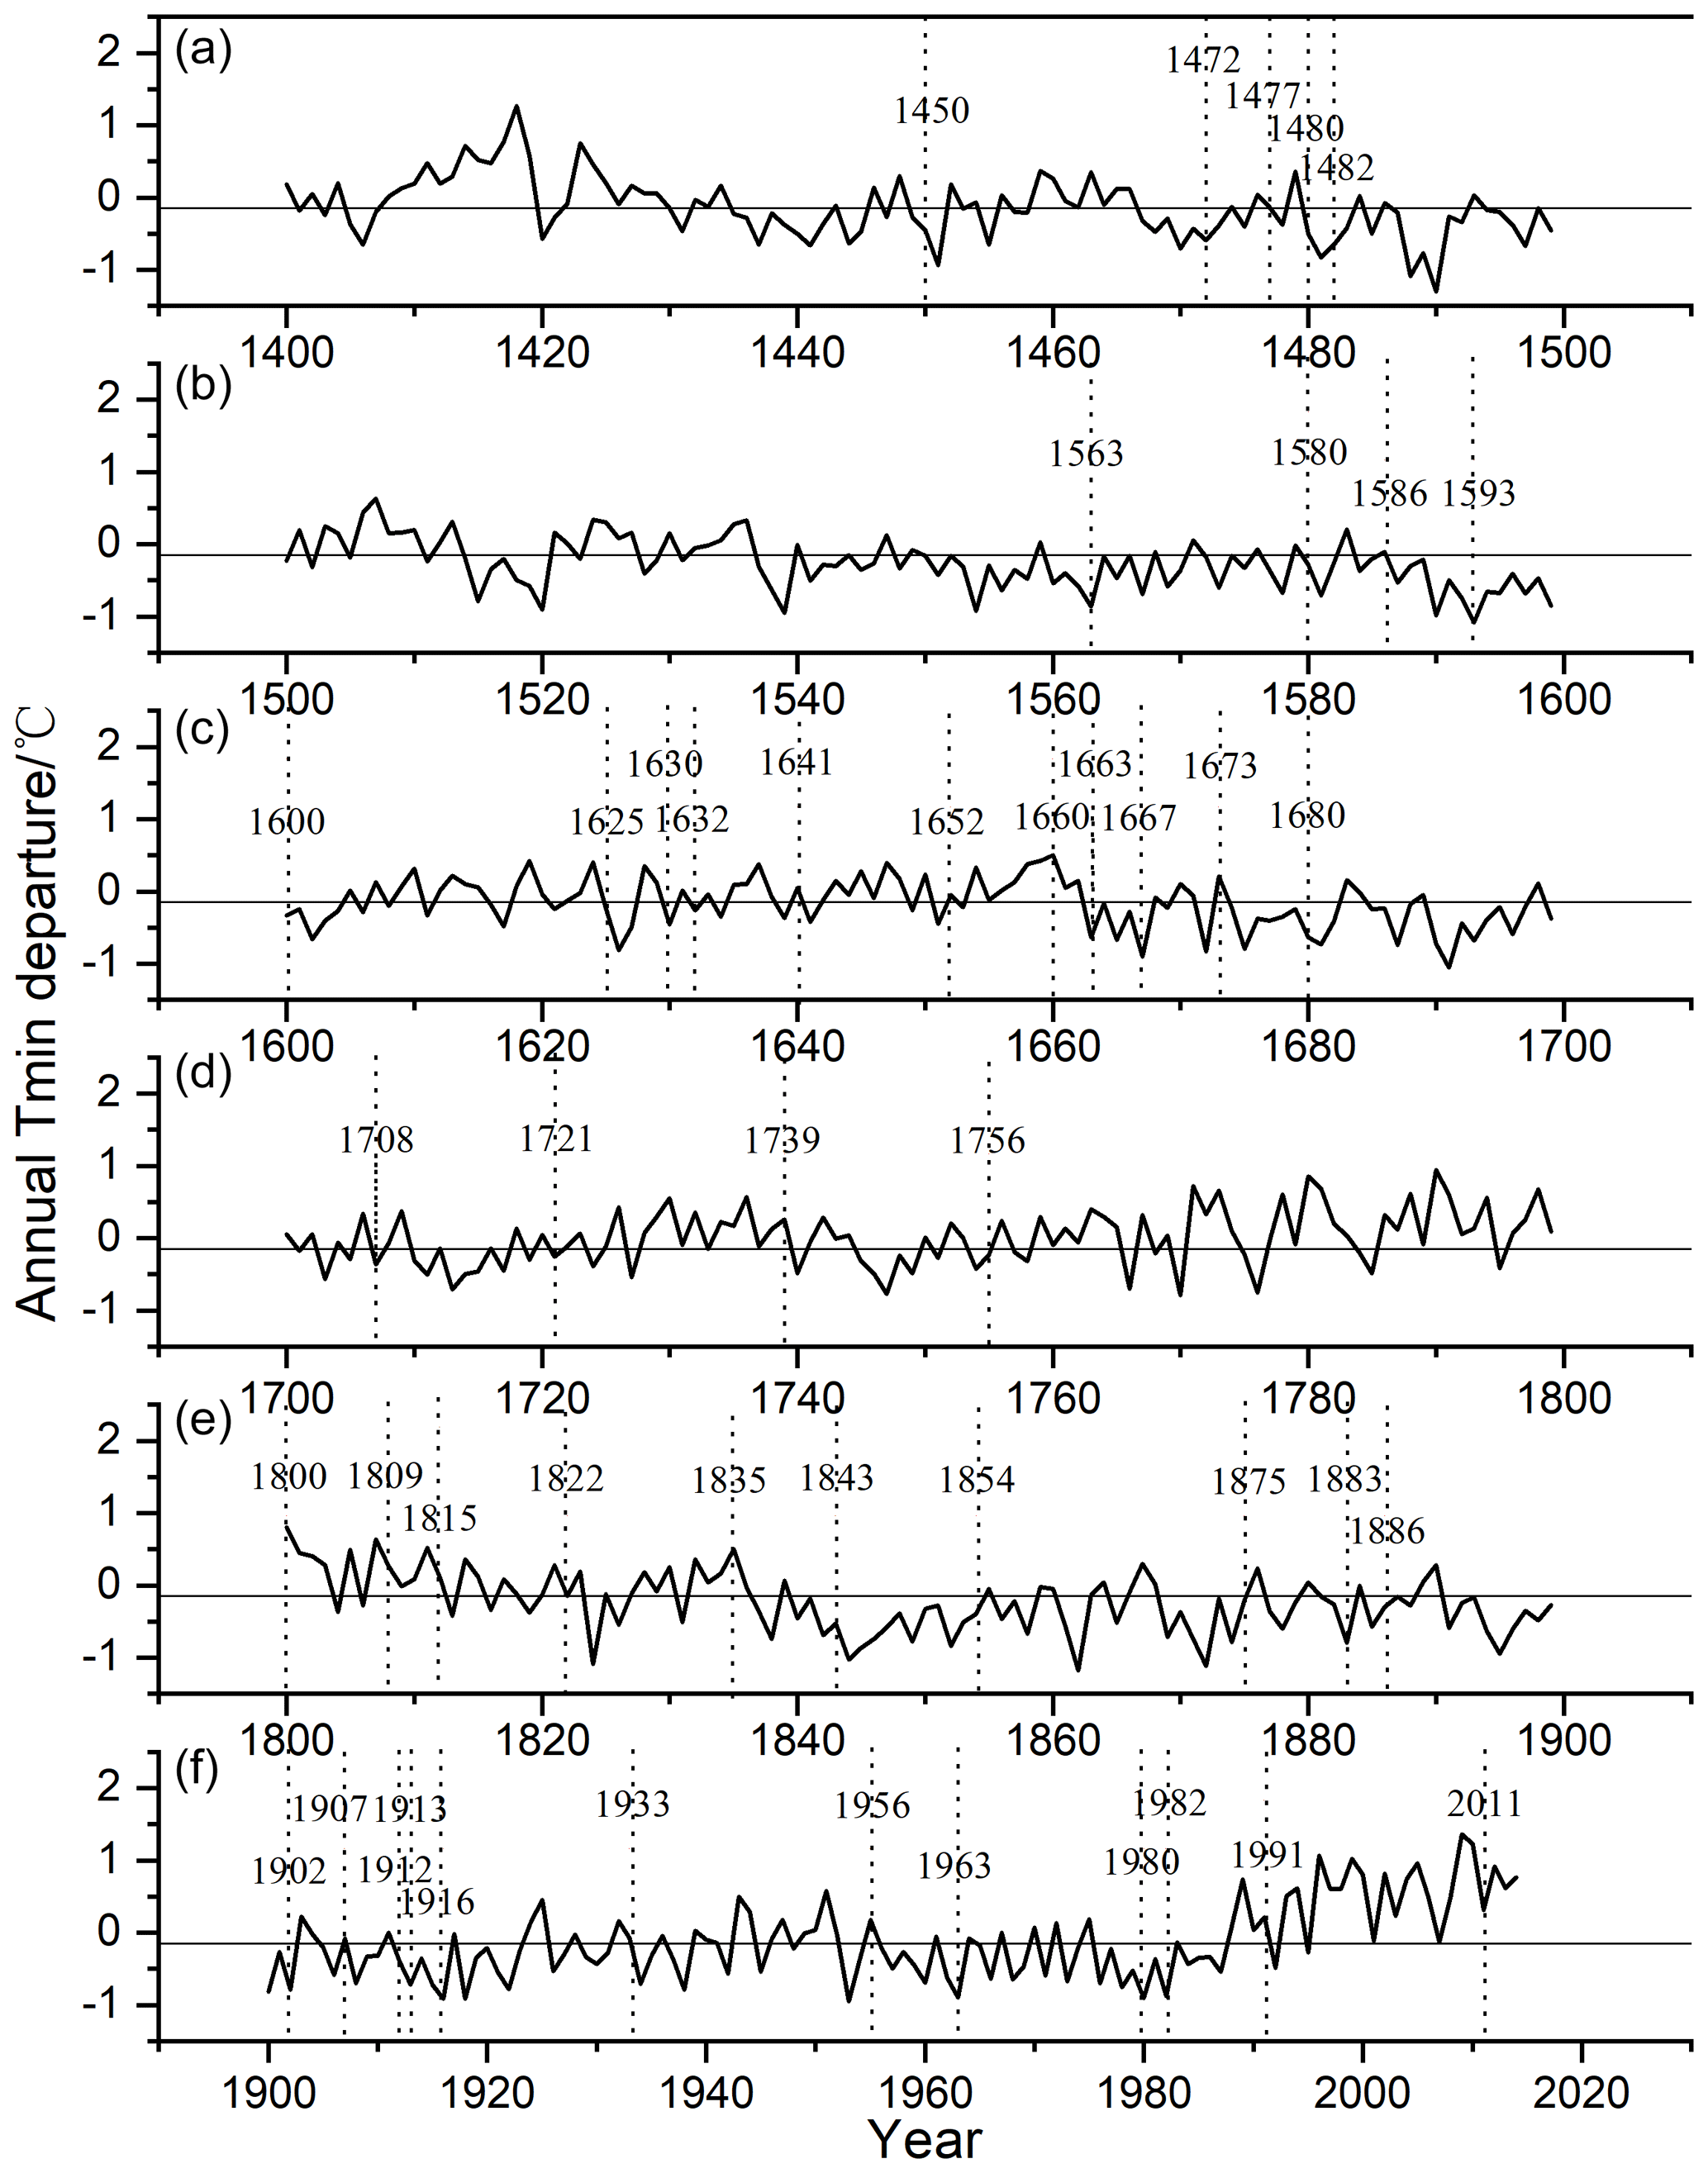
Figure 6Plot of Tmin reconstruction since 1400 CE. The x axis in each sub-figure indicates the year from the 15th century (a) to the 20th century (f). The dotted lines and the numbers indicate the years in which the 46 volcanic events used in this study occurred.
Over the period 1380–2014 CE, Tmin on the TP has been greatly influenced by large volcanic eruptions, especially those occurring in the Northern Hemisphere. Globally, Tmin decreases in the year of an eruption and for 1 to 2 years thereafter (Fig. 7a). In the year immediately following an eruption, the relationship is at the 0.05 significance level. Eruptions in the Northern and Southern Hemispheres (Fig. 7b and c) also coincide with a Tmin decrease in the year of the eruption and for 1 to 2 years thereafter. However, eruptions in the Northern Hemisphere have a more obvious influence on Tmin in the study area, as indicated by the strong drop in temperature in the year following an eruption (Fig. 7b). Southern Hemisphere midlatitude eruptions occur at greater distances from the TP and therefore have a weaker influence on Tmin.
Tmin in the study area decreases significantly in the years following volcanic activity at low latitudes (Fig. 7d). Eruptions in the midlatitudes of the Northern Hemisphere clearly coincide with drops in temperature, but the decreases are not statistically significant (Fig. 7e). Eruptions in the midlatitudes of the Southern Hemisphere and in the high latitudes of the Northern Hemisphere also coincide with reduced Tmin in the year of the eruption and in the following year, but the decreases are not statistically significant (Fig. 7f and g).
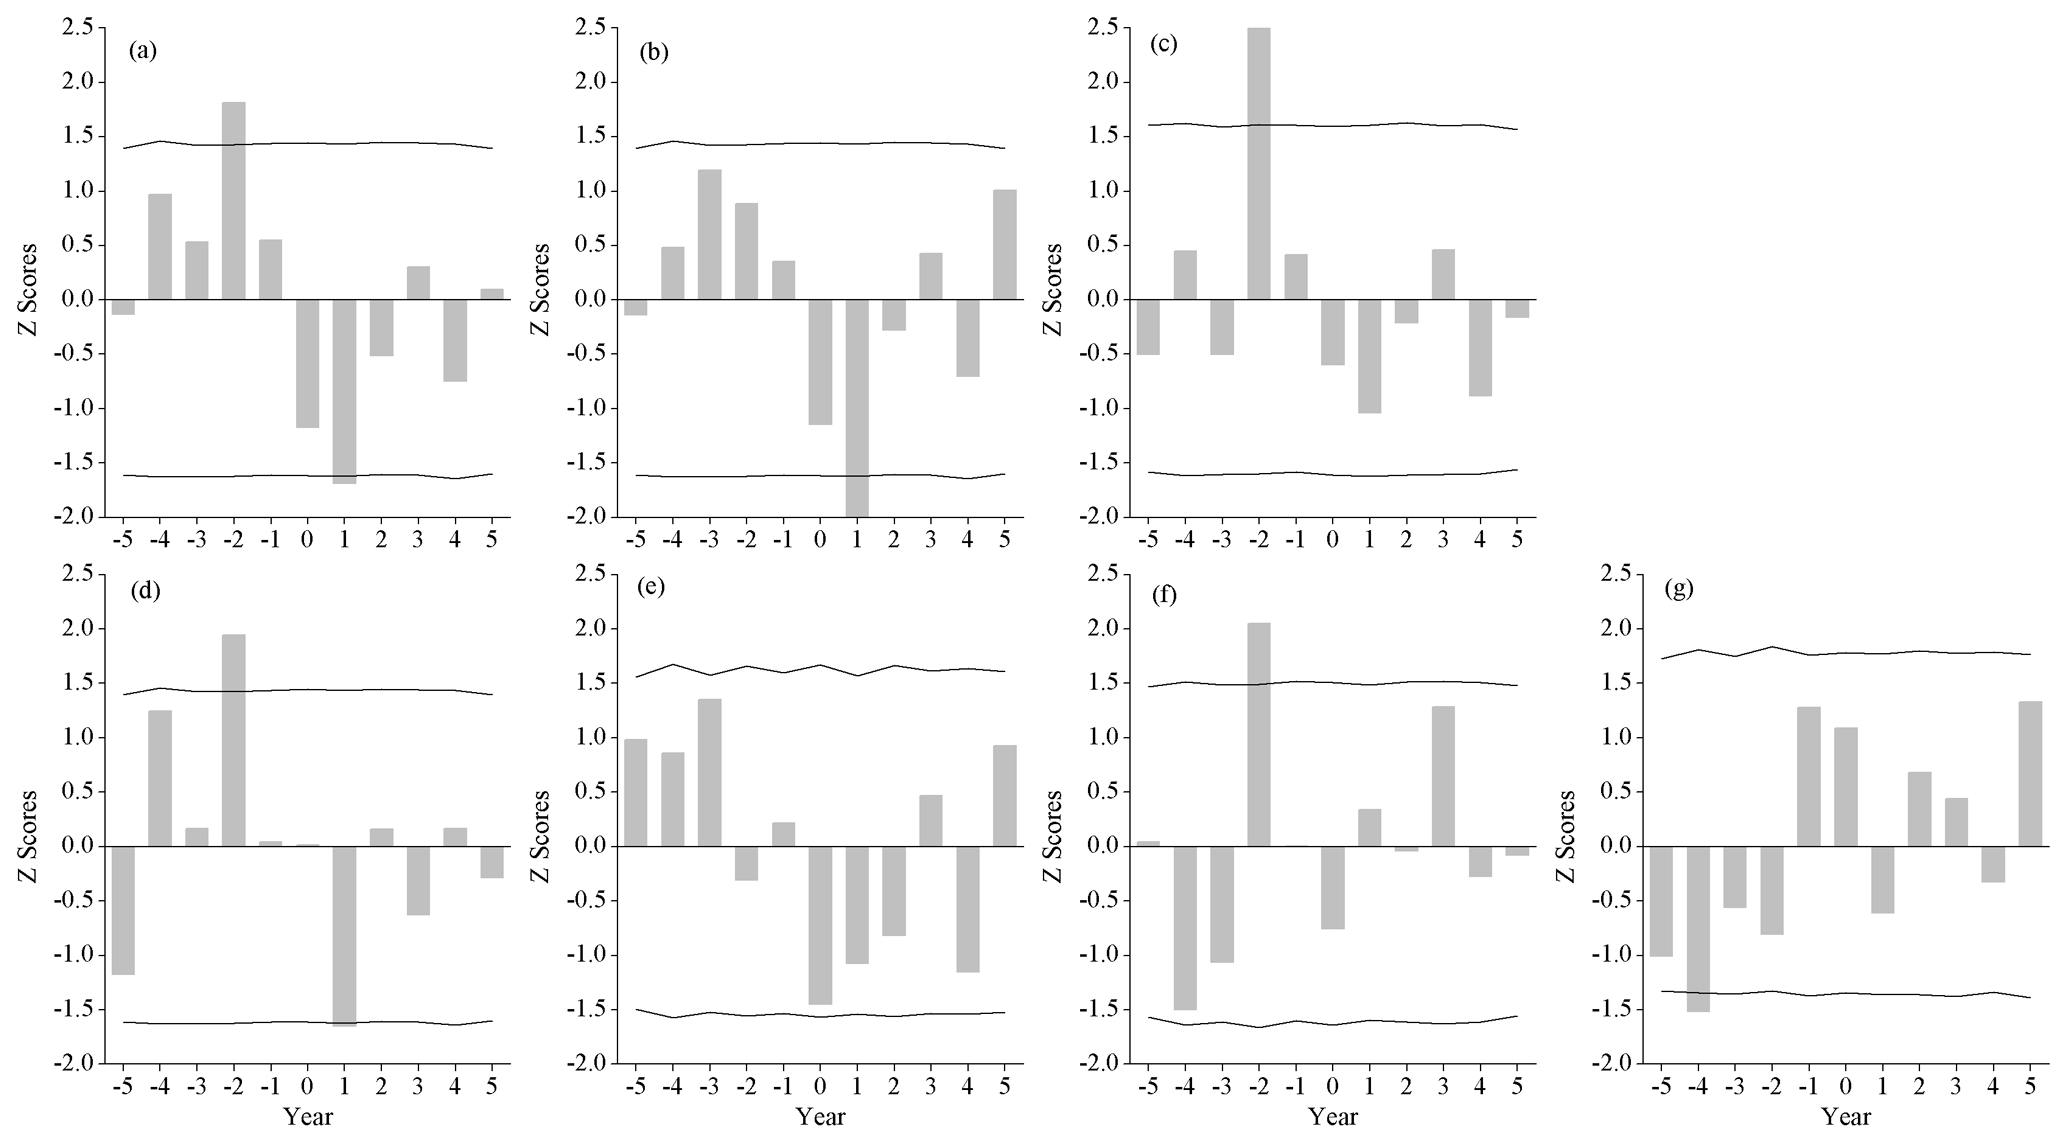
Figure 7SEA results of our reconstructed Tmin87 with large volcanic eruptions in different areas: (a) global; (b) Northern Hemisphere; (c) Southern Hemisphere; (d) low latitudes 30∘S–30∘N; (e) Northern Hemisphere midlatitudes 30–60∘ N; (f) Southern Hemisphere midlatitudes 30–60∘ S; and (g) Northern Hemisphere high latitudes. 0: year of volcanic eruption; −1: year before eruption; 1: year after eruption. The solid lines represent the 95 % confidence limits using Monte Carlo-type block bootstrapping (Adams et al., 2003).
4.1 Reliability of the Tmin reconstruction
The correlation between the tree-ring-width index and climate factors shows that the relationship between tree radial growth and precipitation is not statistically significant except in February. With the thick topsoil and humid climate in spring and summer, the study area meets the moisture needs of trees for radial growth. However, according to instrumental data from the GL weather station (Table 1), the elevation of which is close to that of the sampling site, the annual Tmean and Tmin are 2.25 and −6.76∘, respectively. These temperatures are quite low for tree growth, and the statistically significant positive correlation between growth and temperature shows that tree radial growth in this area is restricted by temperature, especially Tmin. Tmin before and during the growing season may affect tree growth in several ways. In winter and early spring, warmer Tmin protects roots from cold damage and triggers earlier snowmelt. Warmer Tmin may therefore result in a longer growing season, and trees may experience increased growth during the subsequent growing season (Pederson et al., 2004; Fu et al., 2012; Hollesen et al., 2015; Williams et al., 2015). On the other hand, Tmin is known to positively affect conifer tracheid division and enlargement by controlling the onset and conclusion of xylogenesis during the growing season (Deslauriers et al., 2003; Rossi et al., 2008; Li et al., 2017b; Hosoo et al., 2002; Steppe et al., 2015).
It should be mentioned that the CE value of the validation period remains negative for the period from 1960 to 1983 even though we tested different meteorological stations and different observation intervals in the analysis process. One reason for this could be a distortion of the meteorological data due to the poor management and/or the relocation of meteorological stations during the 1950s and 1960s on the TP. However, the cross-validation results indicate that the equation is otherwise reliable. The negative CE value should not influence our analysis of the high-frequency climate response to volcanism.
The correlations of the reconstructed series with CRU Tmin reflect the regional significance of the reconstruction in general. However, the consistent warming trend in Tmin over most of Asia (Dong et al., 2017) may result in a large area of significant positive correlations. For this reason, the results of our first-order correlation analysis are therefore more dependable; i.e., our reconstruction reliably reflects temperature variations in the Animaqin Mountains and in the area to the west.
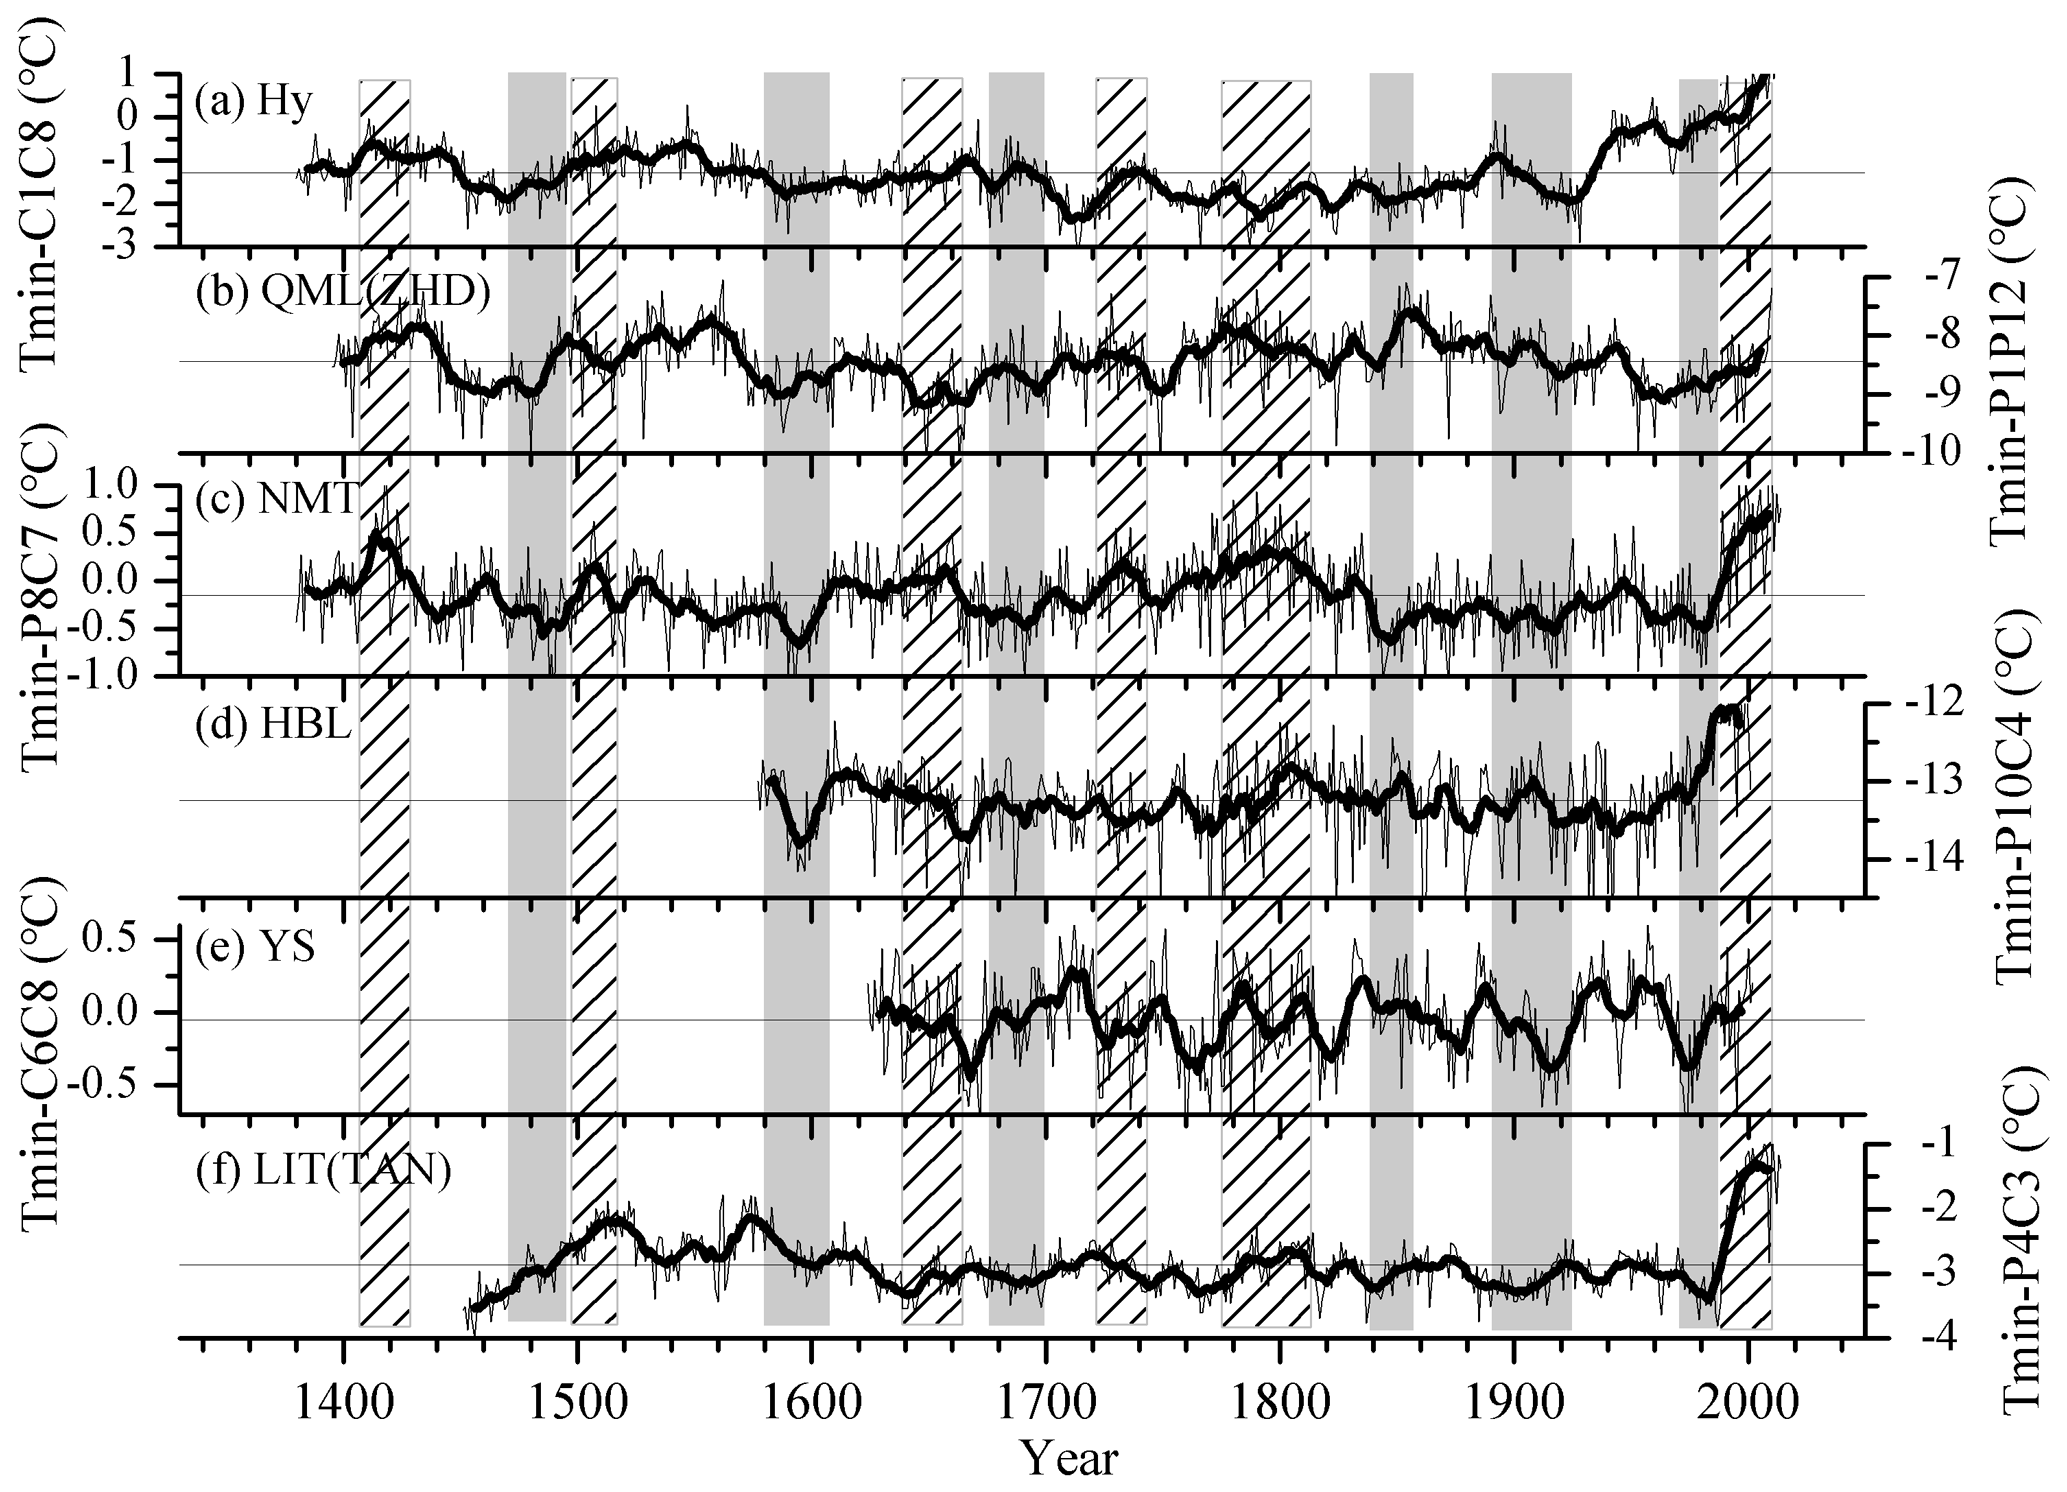
Figure 8Comparison of our reconstructed Tmin87 with other Tmin reconstructions from the TP for the period 1380–2014 CE. (a) HY, January–August Tmin on the northeastern TP (Zhang et al., 2014); (b) QML(ZHD), January–December Tmin on the central TP (He et al., 2014); (c) our study; (d) HBL, October–April Tmin on the eastern TP (Gou et al., 2007); (e) YS, June–August Tmin on the southern central TP (Liang et al., 2008); (f) LIT(TAN), April-March Tmin on the southeastern TP (Li and Li, 2017). Columns with slash marks indicate warm periods in our reconstruction; solid gray columns indicate cold periods.
The reconstructed Tmin87 was further compared with minimum temperature reconstructions from other regions of the TP, including HY (northeastern TP; Zhang et al., 2014), QML(ZHD) (central TP; He et al., 2014), HBL (eastern TP; Gou et al., 2007), YS (southern central TP; Liang et al., 2008), and LIT(TAN) (southeastern TP; Li and Li, 2017). As a result of differences in reconstruction factors, study regions, and methods of chronology establishment, there are some differences between the chronologies. For example, there are significant regional differences in Tmin reconstructions over the past 100 years. However, there is also notable consistency at the interannual–multidecadal scale. The correlation coefficients between our reconstruction and each sequence are 0.227 (HY; p<0.01), 0.328 (QML(ZHD); p<0.01), 0.499 (HBL; p<0.000), 0.235 (YS; p<0.01), and 0.317 (LIT(TAN); p<0.01). The closer the sequence is to the study site, the more similar the changes in Tmin are. For example, the Tmin87 of this study is most strongly correlated with the HBL reconstruction (Fig. 8d), which is nearest to our study area. Both reconstructions show low-temperature periods at the end of the 16th century and from the 1670s to the 1720s. Although it is located further from the study area, the HY reconstruction also shows cold periods in the late 15th century, at the end of the 16th century, at the beginning of the 18th century, and in the middle of the 19th century (Fig. 8a). Similarly, the low-temperature periods in the late 15th and late 16th centuries, the 1670s to 1720s, and the 1960s to 1980s are in agreement with those in the QML(ZHD) reconstruction (Fig. 8b). The low-temperature interval in the 1960s–1980s coincides with the cold interval in the YS reconstruction (Fig. 8e). Finally, although the LIT(TAN) reconstruction is located in a more distant region of the TP, its low-temperature intervals are consistent with those in our reconstruction (e.g., the end of the 15th century, 1670s–1720s, 1900s–1920s, and 1960s–80s) (Fig. 8f). It is interesting that higher Rbar values appear in some special intervals, i.e., the cold intervals of the 1460s–1500s and 1800s–1820s and the warmest period of 1980–2014. These higher Rbar values indicate a good consistency among tree-ring series during these periods; in fact, these three intervals are evident in tree-ring-based studies from elsewhere on the Tibetan Plateau (Huang et al., 2019; Liang et al., 2016; Shi et al., 2019). The two cold periods identified in our series correspond to periods of weaker solar activity (the Spörer Minimum and the Dalton Minimum) and to a few very strong tropical eruptions (e.g., the Tambora eruption in 1815 and another stratospheric eruption in 1809) (Cole-Dai et al., 2009). Similarly, the warming in 1980–2014 is closely related to the influence of human activities. These responses are indicative of the consistent response of tree growth to strong external forcing factors and of the reliability of our reconstruction.
4.2 The effect of volcanic activity on the reconstructed Tmin87
As shown in Fig. 6, the cooling probability in the year of or the year following a large volcanic eruption is very high. The effects of the Tambora volcano in 1815 (VEI =7) were recorded in many parts of the world. Our reconstruction indicates that temperatures on the TP dropped by about 0.5∘C in 1816, the year following the eruption. On the southeastern TP, the cold period from 1816 to 1822 may have also been related to the Tambora eruption (Liang et al., 2008). Other research in the northeastern TP has shown that cold years can be matched with known tropical volcanic events in 15 of 21 cases (Zhang et al., 2014). We compared the years of cooling we identified in this study with those identified by Zhang et al. (2014) and found that the cooling years are either the same or within a year of each other. Liang et al. (2016) showed that on the southeastern TP, the 15 coldest years of the past 304 years occurred mostly within 1–2 years of a major volcanic eruption; 9 of those years are also seen in our study. The results of SEA analysis further confirm that the temperature on the TP is affected by strong volcanic eruptions, especially those occurring in the Northern Hemisphere and at low latitudes, and that cooling occurs in the study area within a year or two of a major eruption.
Studies have shown that some cold intervals on the eastern and southern TP may be influenced by large volcanic eruptions in low-latitude regions (Bi et al., 2020; Duan et al., 2019a; Krusic et al., 2015). Oman et al. (2005) used an ensemble simulation of the climate response to high-latitude volcanic eruption to show the surface air temperature in the TP were cooling in the first winter. Using the fully coupled NCAR Community Climate System Model (CCSM3), Schneider et al. (2009) found that there is significant summer cooling over the continents in the case of both tropical and high-latitude volcanism for the period 1250–1300 CE. New research by Toohey et al. (2019) demonstrated that explosive extratropical eruptions since 750 CE have produced stronger hemispheric cooling than tropical eruptions. These results are in alignment with ours, which show that strong eruptions in both the Northern Hemisphere and the tropics can lead to decreases in Tmin in our study area. Our results suggest that the effects of volcanic eruptions in the Northern Hemisphere are more pronounced. It should be mentioned that a one-to-one correspondence between large eruptions and cooling is not observed; temperature variability is also driven by factors such as circulation patterns like El Niño–Southern Oscillation (ENSO) (Breitenmoser et al., 2012; D'Arrigo et al., 2011; Duan et al., 2019b). Cooling on the TP as a result of large volcanic eruptions may be weakened or masked by other influencing factors (Duan et al., 2018). Establishing a deeper understanding of the relationship between eruptions and cooling will depend on expanding the spatial network of long-term, temperature-sensitive chronologies from the TP.
This study establishes a 667-year-long tree-ring-width chronology for the eastern central TP. The anomaly sequence of the annual Tmin (Tmin87) was reconstructed for the period 1380–2014 CE. The lowest temperatures with the longest duration occurred in 1586–1602; the longest and warmest interval was 1991–2009. The Tmin on the TP has been increasing, most notably since the 1980s. The SEA analysis shows that Tmin decreases in the year following strong volcanic activity in the Northern Hemisphere. Thus, the climate across the eastern central TP is sensitive to large-scale background climatic factors such as volcanic activity. Further investigations are needed to fully understand the connection between volcanic eruptions and temperature on the TP and to incorporate this information into regional predictions of annual and decadal temperatures.
The data generated for this study are available from the corresponding author.
The supplement related to this article is available online at: https://doi.org/10.5194/cp-17-241-2021-supplement.
YZ and XS designed this study and took the tree-ring samples; YW and YZ analyzed the data and prepared the paper. ML prepared the volcanic data and took the tree-ring samples.
The authors declare that they have no conflict of interest.
This article is part of the special issue “Interdisciplinary studies of volcanic impacts on climate and society”. It is not associated with a conference.
We thank two anonymous reviewers and the guest editor Kevin Anchukaitis for their helpful comments.
This research has been supported by the National Key R&D Program of China (grant no. 2016YFA0600401) and the National Natural Science Foundation of China (grant nos. 41630529 and 41430528).
This paper was edited by Kevin Anchukaitis and reviewed by two anonymous referees.
Adams, J. B., Mann, M. E., and Ammann, C. M.: Proxy evidence for an El Niño-like response to volcanic forcing, Nature, 426, 274–278, 2003.
Bi, Y. F., Cory, W., Fan, Z. X., Yang, J. C., Wu, Z. K., Huang, W., Li, J. W., and Yang, X. F.: Ring-widths of Abies at tree-line ecotone reveal three centuries of early winter season temperature changes in Yunnan, China, Clim. Dynam., 55, 945–959, 2020.
Breitenmoser, P., Beer, J., Broennimann, S., Frank, D., Steinhilber, F., and Wanner, H.: Solar and volcanic fingerprints in tree-ring chronologies over the past 2000 years, Palaeogeogr. Palaeocl., 313–314, 127–139, https://doi.org/10.1016/j.palaeo.2011.10.014, 2012.
Chen, F., Zhang, Y., Shao, X. M., Li, M. Q., and Yin, Z. Y.: A 2000-year temperature reconstruction in the Animaqin Mountains of the Tibet Plateau, China, Holocene, 26, 1904–1913, 2016.
Cole-Dai, J., Ferris, D., Lanciki, A., Savarino, J., Baroni, M., and Thiemens, M.: Cold decade (AD 1801–1819) caused by Tambora (1815) and another (1809) stratospheric volcanic eruption, Geophys. Res. Lett., 36, L22703, https://doi.org/10.1029/2009GL040882, 2009.
D'Arrigo, R., Seager, R., Smerdon, J. E., LeGrande, A. N., and Cook, E. R.: The anomalous winter of 1783–1784: was the Laki eruption or an analog of the 2009–2010 winter to blame?, Geophys. Res. Lett., 38, L5706, https://doi.org/10.1029/2011GL046696, 2011.
D'Arrigo, R., Wilson, R., and Anchukaitis, K. J.: Volcanic cooling signal in tree ring temperature records for the past millennium, J. Geophys. Res.-Atmos., 118, 9000–9010, 2013.
Deslauriers, A., Morin, H., and Begin, Y.: Cellular phenology of annual ring formation of Abies balsamea in the Quebec boreal forest (Canada), Can. J. For. Res., 33, 190–200, 2003.
Dong, S., Sun, Y., Aguilar, E., Zhang, X., Peterson, T. C., Song, L., and Zhang, Y.: Observed changes in temperature extremes over Asia and their attribution, Clim Dynam., 51, 339–353, https://doi.org/10.1007/s00382-017-3927-z, 2017.
Duan, J. P., Li, L., Ma, Z. G., Esper, J., Büntgen, U., Xoplaki, E., Zhang, D. J., Wang, L., Yin, H., and Luterbacher, J.: Summer cooling driven by large volcanic eruptions over the Tibetan Plateau, J. Climate, 31, 9869–9879, https://doi.org/10.1175/JCLI-D-17-0664.1, 2018.
Duan, J. P., Ma, Z. G., Yuan, N. M., Li, L., and Chen, L.: Extremes in the magnitude of annual temperature cycle on the Tibetan Plateau over the past three centuries, Clim. Dynam., 52, 3599–3608, 2019a.
Duan, J. P., Wu, P. L., and Ma, Z. G.: Reconciling the discrepancy of post-volcanic cooling estimated from tree-ring reconstructions and model simulations over the Tibetan Plateau, Atmosphere, 10, 738, https://doi.org/10.3390/atmos10120738, 2019b.
Esper, J., Schneider, L., Krusic, P. J., Luterbacher, J., Büntgen, U., Timonen, M., Sirocko, F., and Zorita, E.: European summer temperature response to annually dated volcanic eruptions over the past nine centuries, Bull. Volcanol, 75, 736, https://doi.org/10.1007/s00445-013-0736-z, 2013.
Filion, L., Payette, S., Gauthier, L., and Boutin, Y.: Light rings in subarctic conifers as a dendrochronological tool, Quaternary Res., 26, 272–279, 1986.
Fu, Y. H., Campioli, M., Deckmyn, G., and Janssens, I. A.: The impact of winter and spring temperatures on temperate tree budburst dates: results from an experimental climate manipulation, PLoS One, 7, e47324, https://doi.org/10.1371/journal.pone.0047324, 2012.
Gou, X. H., Chen, F. H., Jacoby, G., Cook, E., Yang, M. X., Peng, J. F., and Zhang, Y.: Rapid tree growth with respect to the last 400 years in response to climate warming, northeastern Tibetan Plateau, Int. J. Climatol., 27, 1497–1503, 2007.
Gou, X. H., Peng, J. F., Chen, F. H., Yang, M. X., Levia, D. F., and Li, J. B.: A dendrochronological analysis of maximum summer half-year temperature variations over the past 700 years on the northeastern Tibetan Plateau, Theor. Appl. Climatol., 93, 195–206, https://doi.org/10.1007/s00704-007-0336-y, 2008.
Gou, X. H., Deng, Y., Chen, F. H., Yang, M. X., Fang, K. Y., Gao, L. L., Yang, T., and Zhang, F.: Tree ring based streamflow reconstruction for the upper Yellow River over the past 1234 years, Chin. Sci. Bull., 55, 4179–4186, 2010.
Haurwitz, M. W. and Brier, G. W.: A critique of the superposed epoch analysis method: its application to solar–weather relations, Mon. Weather. Rev., 109, 2074–2079, 1981.
He, M. H., Yang, B., and Datsenko, N. M.: A six-hundred-year annual minimum temperature history for the central Tibetan Plateau derived from tree-ring width series, Clim. Dynam., 43, 641–655, 2014.
Holmes, R. L.: Computer-assisted quality control in tree-ring dating and measurement, Tree-Ring Bull., 44, 69–75, 1983.
Hollesen, J., Buchwal, A., Rachlewicz, G., Hansen, B. U., Hansen, M. O., Stecher, O., and Elberling, B.: Winter warming as an important co-driver for Betula nana growth in western Greenland during the past century, Glob. Change Biol., 21, 2410–2423, https://doi.org/10.1111/gcb.12913, 2015.
Hosoo, Y., Yoshida, M., Imai, T., and Okuyama, T.: Diurnal difference in the amount of immunogold-labeled glucomannans detected with field emission scanning electron microscopy at the innermost surface of developing secondary walls of differentiating conifer tracheids, Planta, 215, 1006–1012, 2002.
Huang, R., Zhu, H., Liang, E., Liu, B., Shi, J., Zhang, R., Yuan, Y., and Grießinger, J.: A tree ring-based winter temperature reconstruction for the southeastern Tibetan Plateau since 1340 CE, Clim. Dynam., 53, 3221–3233, https://doi.org/10.1007/s00382-019-04695-3, 2019.
Jia, P. Q. and Shi, G. Y.: Study on the effects of volcanic eruption and solar activity on climate in China in recent 50 years, Plateau Meteorology, 20, 225–233, 2001 (in Chinese).
Krusic, P. J., Cook, E. R., Dukpa, D., Putnam, A. E., Rupper, S., and Schaefer, J.: Six hundred thirty-eight years of summer temperature variability over the Bhutanese Himalaya, Geophys. Res. Lett., 42, 2988–2994, 2015.
Lamarche, V. C. and Hirschboeck, K. K.: Frost rings in trees as records of major volcanic eruptions, Nature, 307, 121–126, 1984.
Li, T. and Li, J. B.: A 564-year annual minimum temperature reconstruction for the east central Tibetan Plateau from tree rings, Global Planet. Change, 157, 165–173, 2017.
Li, M. Q., Huang, L., Yin, Z. Y., and Shao, X. M.: Temperature reconstruction and volcanic eruption signal from tree-ring width and maximum latewood density over the past 304 years in the southeastern Tibetan Plateau, Int. J. Biometeorol., 61, 2021–2032, https://doi.org/10.1007/s00484-017-1395-0, 2017a.
Li, X., Liang, E., Gričar, J., Rossi, S., Čufar, K., and Ellison, A. M.: Critical minimum temperature limits xylogenesis and maintains treelines on the southeastern Tibetan Plateau, Sci. Bull., 62, 804–812, 2017b.
Liang, E. Y., Shao, X. M., and Qin, N. S.: Tree-ring based summer temperature reconstruction for the source region of the Yangtze river on the Tibetan Plateau, Global Planet. Change, 61, 313–320, 2008.
Liang, H. X., Lyu, L., and Wahab, M.: A 382-year reconstruction of August mean minimum temperature from tree-ring maximum latewood density on the southeastern Tibetan Plateau, China, Dendrochronologia, 37, 1–8, 2016.
Meko, D. and Graybill, D. A.: Tree-ring reconstruction of upper gila river discharge, J. Am. Water Resour. As., 31, 605–616, 1995.
Melvin, T. M. and Briffa, K. R.: A “signal-free” approach to dendroclimatic standardisation, Dendrochronologia, 26, 71–86, 2008.
Michaelsen, J.: Cross-validation in statistical climate forecast models., J. Appl. Meteorol., 26, 1589–1600, 1987.
Mitchell, T. D. and Jones, P. D.: An improved method of constructing a database of monthly climate observations and associated high-resolution grids, Int. J. Climatol., 25, 693–712, 2005.
Oman, L., Robock, A., Stenchikov, G., Schmidt, G. A., and Ruedy, R.: Climatic response to high-latitude volcanic eruptions, J. Geophys. Res., 110, 13, https://doi.org/10.1029/2004JD005487, 2005.
Pederson, N., Cook, E. R., Jacoby, G. C., Peteet, D. M., and Griffin, K. L.: The influence of winter temperatures on the annual radial growth of six northern range margin tree species, Dendrochronologia, 22, 7–29, 2004.
Robock, A.: Volcanic eruptions and climate, Rev. Geophys., 38, 191–219, 2000.
Robock, A. and Mao, J.: Winter warming from large volcanic eruptions, Geophys. Res. Lett., 19, 2405–2408, 1992.
Rossi, S., Deslauriers, A., Gricar, J., Seo, J. W., Rathgeber, C. B. K., Anfodillo, T., Morin, H., Levanic, T., Oven, P., and Jalkanen, R.: Critical temperatures for xylogenesis in conifers of cold climates, Global. Ecol. Biogeogr., 17, 696–707, 2008.
Salzer, M. W. and Hughes, M. K.: Bristlecone pine tree rings and volcanic eruptions over the last 5000 yr, Quaternary Res., 67, 57–68, 2007.
Shi, C., Sun, C., Wu, G., Wu, X., Chen, D., Masson-Delmotte, V., Li, J., Xue, J., Li, Z., Ji, D., Zhang, J., Fan, Z., Shen, M., Shu, L., and Ciais, P.: Summer Temperature over the Tibetan Plateau Modulated by Atlantic Multidecadal Variability, J. Climate, 32, 4055–4067, 2019.
Singh, Y. P. and Badruddin: Statistical considerations in superposed epoch analysis and its applications in space research, J. Atmos. Sol.-Terr. Phy., 68, 803–813, https://doi.org/10.1016/j.jastp.2006.01.007, 2006.
Schneider, D. P., Ammann, C. M., Otto-Bliesner, B. L., and Kaufman, D. S.: Climate response to large, high-latitude and low-latitude volcanic eruptions in the Community Climate System Model, J. Geophys. Res., 114, D15101, https://doi.org/10.1029/2008JD011222, 2009.
Steppe, K., Sterck, F., and Deslauriers, A.: Diel growth dynamics in tree stems: linking anatomy and ecophysiology, Trends Plant Sci., 20, 335–343, 2015.
Sun, D., Zheng, J. Y., Zhang, X. Z., and Hao, Z. X.: The relationship between large volcanic eruptions in different latitudinal zones and spatial patterns of winter temperature anomalies over China, Clim. Dynam., 53, 6437–6452, 2019.
Swetnam, T. W.: Fire history and climate change in giant Sequoia Groves, Science, 262, 885–889, https://doi.org/10.1126/science.262.5135.885, 1993.
Tognetti, R., Lasserre, B., Battipaglia, G., Saurer, M., Cherubini, P., and Marchetti, M.: Tree-ring responses in Araucaria araucana to two major eruptions of Lonquimay Volcano (Chile), Trees, 26, 1805–1819, 2012.
Toohey, M., Krüger, K., Schmidt, H., Timmreck, C., Sigl, M., Stoffel, M., and Wilson, R.: Disproportionately strong climate forcing from extratropical explosive volcanic eruptions, Nat. Geosci., 12, 100–107, 2019.
Yao, T. D., Thompson, L. G., Mosbrugger, V., Zhang, F., Ma, Y. M., Luo, T. X., Xu, B. Q., Yang, X. X., Joswiak, D. R., and Wang, W. C.: Third pole environment (TPE), Environ. Dev., 3, 52–64, 2012.
Williams, C. M., Henry, H. A., and Sinclair, B. J.: Cold truths: how winter drives responses of terrestrial organisms to climate change, Biol. Rev., 90, 214–235, https://doi.org/10.1111/brv.12105, 2015.
Zhang, X. G. and Zhang, F. G.: The relationship between large volcanic eruptions and the dryness/wetness and cold/warm in China, Acta Meteorol. Sin., 3, 196–207, 1985 (in Chinese).
Zhang, Y., Shao, X. M., Yin, Z.-Y., and Wang, Y.: Millennial minimum temperature variations in the Qilian Mountains, China: evidence from tree rings, Clim. Past, 10, 1763–1778, https://doi.org/10.5194/cp-10-1763-2014, 2014.
Zheng, J. Y., Bian, J. J., and Ge, Q. S.: The climate regionalization in China for 1981-2010, Chin. Sci. Bull., 58, 3088–3099, 2013.