1. Introduction
The European decarbonization targets to reduce greenhouse gas emissions by around 20% with respect to 2008 levels until 2030 impose significant economical, social and technological challenges in which electromobility plays a key role [
1]. Over 71% of the transport-related CO
2 emissions in Europe come from road transport while the majority of greenhouse gas emissions is associated with cars. Hence, the aim is to reduce, if not to forbid, the utilization of conventionally fueled vehicles in cities until 2050 [
1]. Electric vehicles do not cause the local pollution. The widespread use of electric cars instead of conventionally fueled ones will reduce the greenhouse gas emissions as well as environmental impacts from transport. Therefore, the electromobility topic is super highly up to date. This is evidenced by a number of scientific studies that have been published in recent years.
While in 2014 the battery electric vehicles (BEVs) and plug-in hybrid vehicles (PHEVs) constituted only 0.5% of the total new vehicle registrations in the European Union [
2], the world market of nowadays indicates the boom in sales of electric vehicles (EVs) and that the growth rate of worldwide sales is exponential [
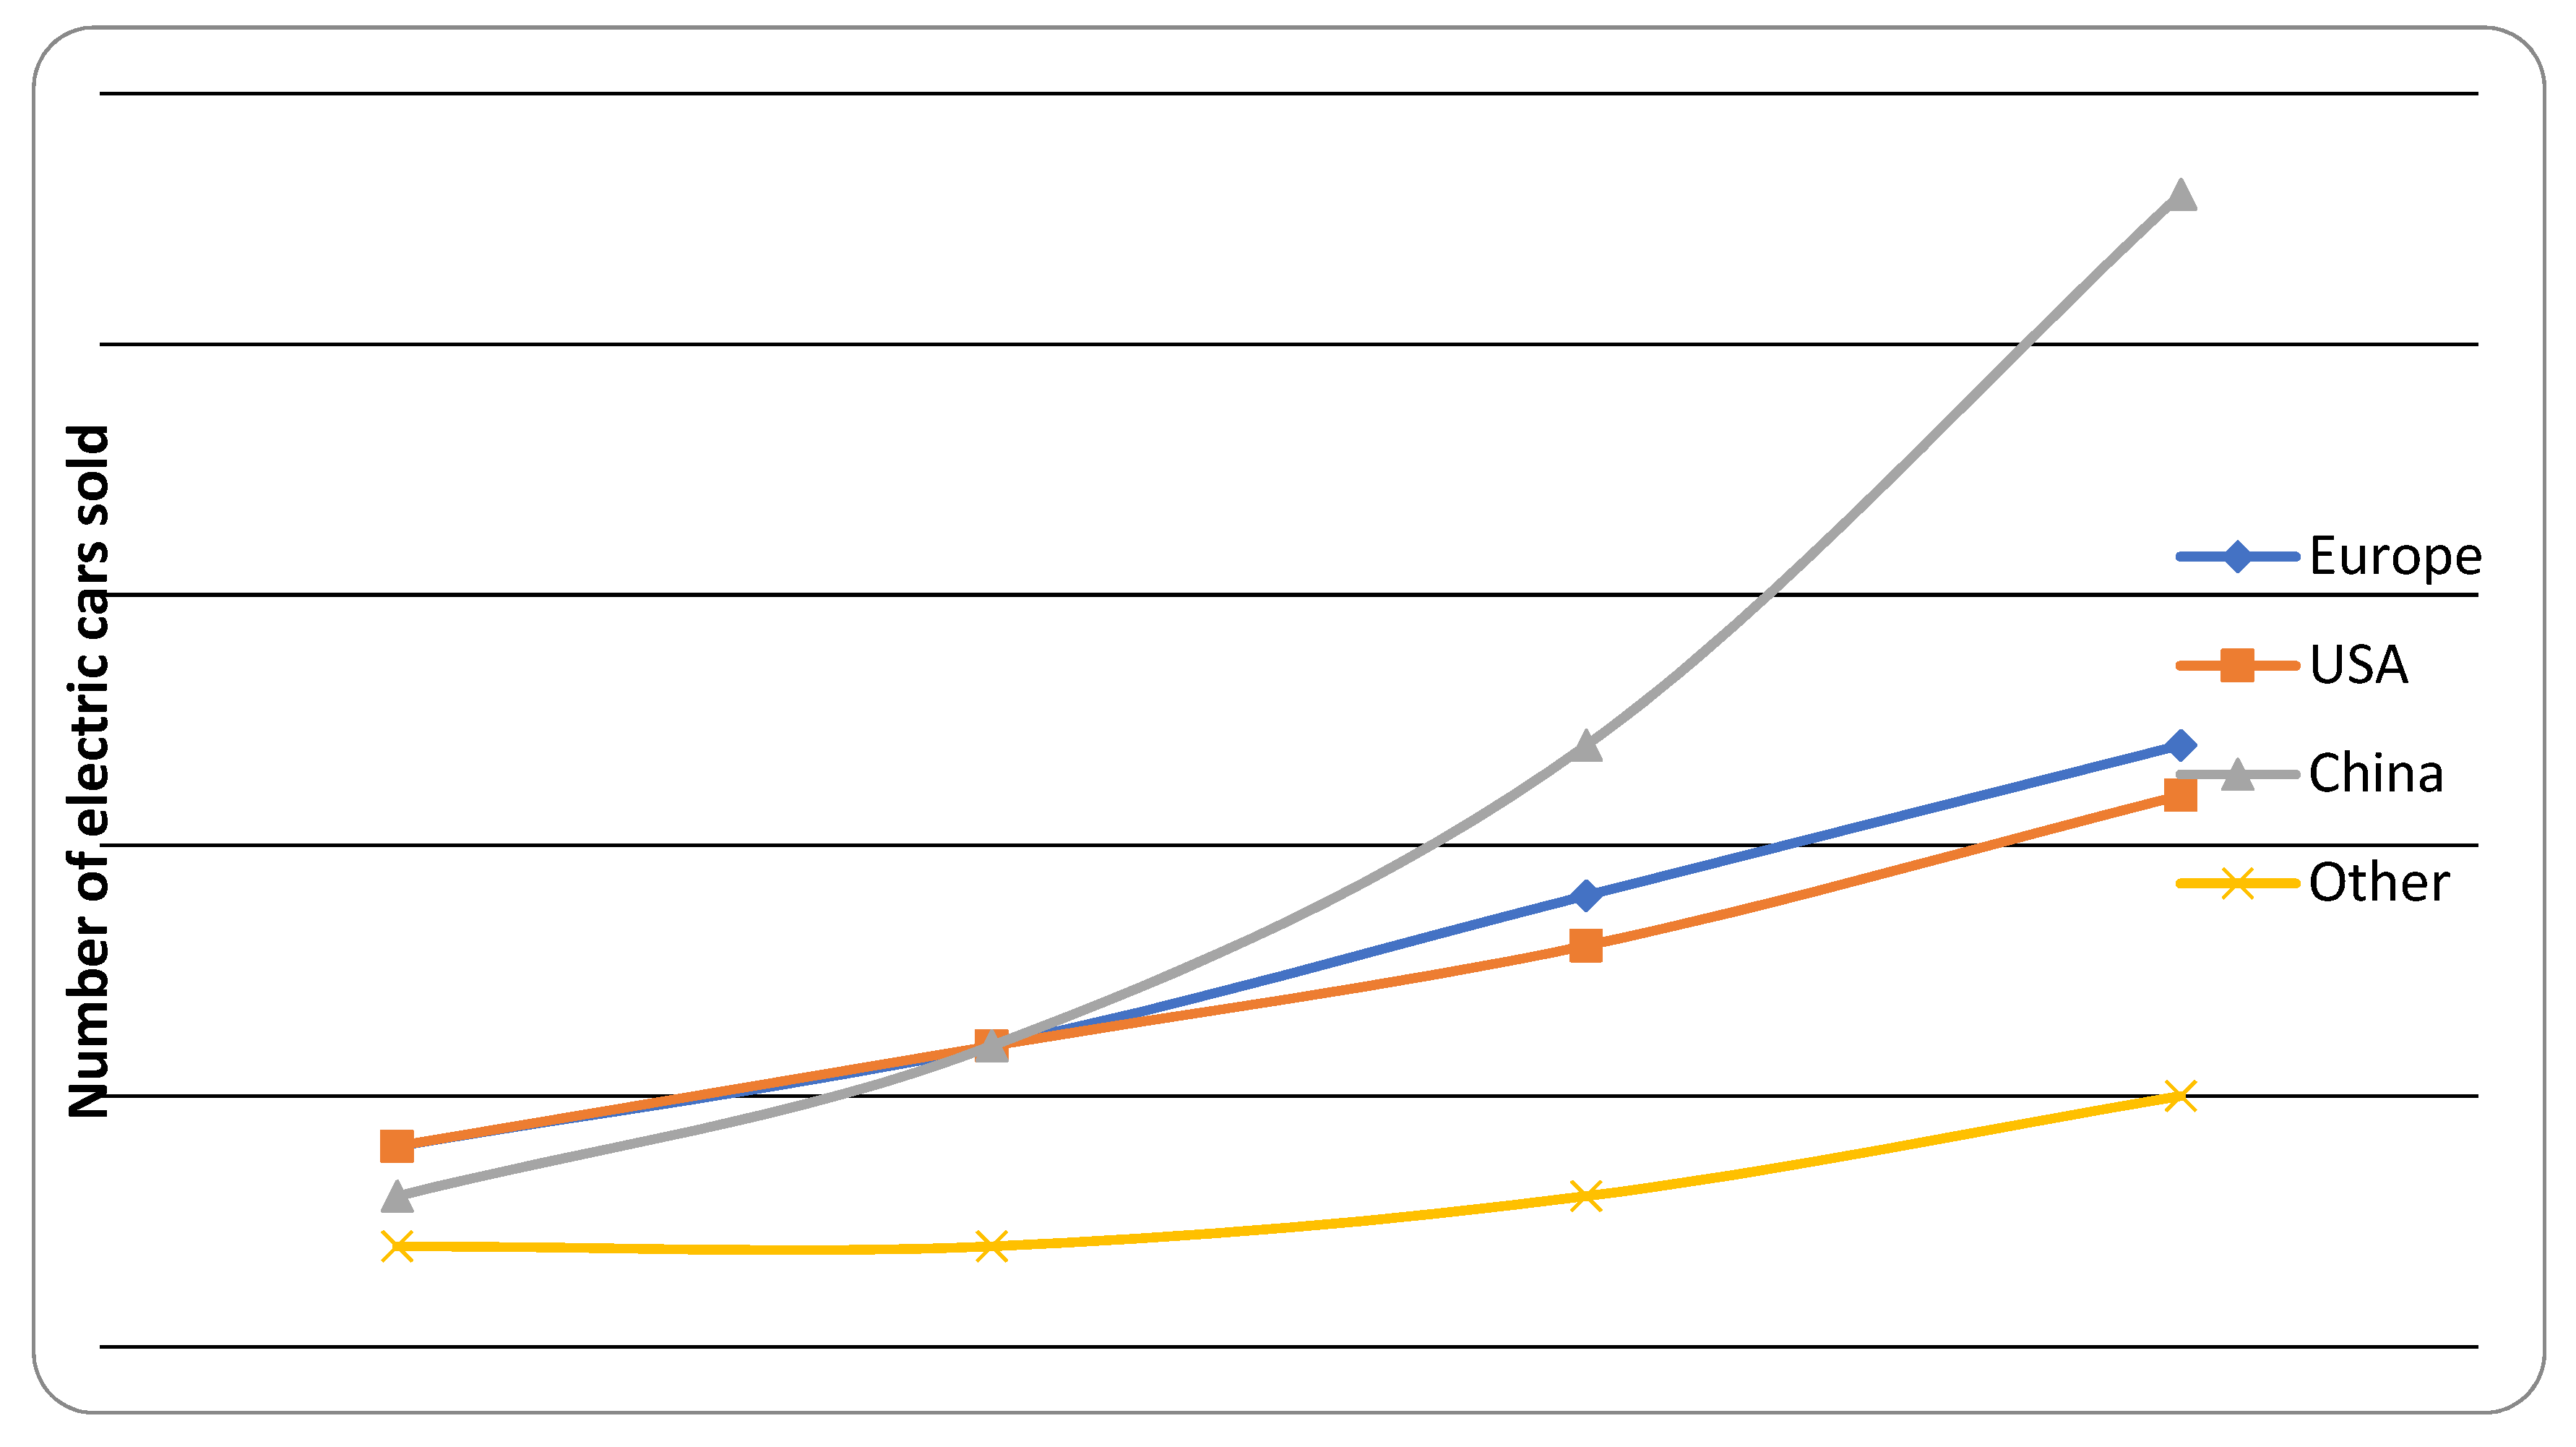
3]. Regions of China, Europe, and USA made up over 90% of global electric cars sales. The world statistics on battery electric cars plus plug-in hybrid electric cars sales can be find at
Figure 1 (own adaptation based on [
4]).
In this paper, we asked a question to which extend are countries of Visegrad Group (Czech Republic, Hungary, Poland, Slovak Republic) prepared for the widespread utilization of electric cars-in what follows, the car electromobility, or simply, electromobility. Before all we target on the electromobility preparation of Slovakia and compared it with V4 countries, European Union (EU) average, and selected electromobility leader countries of Europe. Aiming to reach our goal we have formulated the following 4 questions of research:
Q1: To which extend are Visegrád Group (V4) countries prepared for the widespread use of electric cars (car) electromobility (from the infrastructural point of view)?
Q2: Compared to European electromobility leaders and European Union average what is the situation in Visegrád Group countries considering the preparation for (car) electromobility?
Q3: Compared to V4 countries what is the situation in Slovakia as a member of Visegrád Group countries considering the preparation for (car) electromobility from the infrastructural point of view?
Q4: Compared to European electromobility leaders and European Union average what is the situation in Slovakia considering the preparation for (car) electromobility from the infrastructural point of view?
One of the main contributions of this paper is the data collection. Their processing, analyzing and visualization provided a comprehensive view of preparation for electromobility in the Visegrád Group countries from the infrastructural point of view. A comparison of their situation with European leaders in the field of electromobility and with the EU average made it possible to specify more in detail their position within Europe. Among V4 countries, the position of Slovakia has been investigated more in detail and compared to both situation in European electromobility leading countries and EU average. The drawing of the maps of fast charging stations’ distribution in Slovakia showing the situation in both 2018 and beginning of 2020 help to understand the development and trend tendencies within this area in the last years. Another contribution is the introduction of the infrastructural country electromobility coefficient, the index K, and its calculation for selected countries, that allows the easy cross-countries comparison considering the state of their (car) electromobility preparation from the infrastructural point of view.
2. Literature Review
The low carbon energy technologies should be developed and implemented in a cost-effective way under the Strategic Energy Technology Plan of the European Commission [
5]. In [
6] by Straka et al. the possibilities and limitations of electromobiles utilizations have been studied. Authors focus on electric cars and charging stations as the key element in electromobility development. They discuss the finance, legislation, landowners, location, electric cars quantification, technological and other aspects that affect electromobility development. The important element of electromobility deployment and expanding has been studied in [
7], as well. Shafiei et al. took into account a tax-induced electric vehicles transition here. Authors combine a technical-economic simulation model of an integrated energy transmission system with a macroeconomic model of general equilibrium. The impact of the new government’s tax reform proposal is compared with the current vehicle taxation policy, as well as with other incentives for EVs, which include a tax exemption, and a ban on the sale of new diesel vehicles. They examine individual scenarios in a wide range of future changes in fuel prices and emission cost reductions. The results show that the overall macroeconomic benefits will be negligible, but, sustainable and beneficial in the long run. Although a tax-based technological solution to support electric vehicles deployment will allow for long-term reductions in greenhouse gas emissions, it will not be enough to meet the short-term climate goals. The study on electric vehicles transition, obstructions, advantages, and likewise the socio-technical aspects followed through the multi-mode interaction and the multilevel perspective configuration was performed by Lin and Sovacool in [
8]. In their contribution, the conceptual framework of interaction with several regimes is visible. It illustrates the interaction between BEVs and other technologies, especially PHEVs. Authors summed up that BEVs may have an alignment and re-alignment path or a reconfiguration path depending on the interaction between different technologies.
An interesting view on the theme referred Ryghaug and Skjølsvold in [
9]. Authors claim that the general awareness indicates that transition to the electromobility is the consequence of a focused policies package for demand stimulation. The country of interest was Norway. The policies were initially pursued to support the progress of a Norwegian electric vehicle industry. Their paper focused on how the policies work, how the electric cars are produced and how their effects adapt across geographical borders. The electric vehicle sales on the present and historical data basis in the Norway and Netherlands with the visions for the future have been analyzed in [
10]. The specific dynamic model was used and upgraded here. Empirically, the model validation and evaluation were performed by executing three types of tests. Additionally, two particular model parts were detected for the further enhancement. Authors found out that in the connection with the transition to the new fossil fuels, new emission limits for manufacturers need to be introduced, as well. The findings suggest that only strong incentives have led to a high share of zero-emission vehicle sales in the Netherlands and Norway. Norwegian market was scrutinized also by Hovi et al. in [
11], who screened the impressions from battery-electric truck consumers. This case study reported that perceptions were mostly positive. Nevertheless, the tailoring of use patterns signified quite solicited element. Already in 2013, the share of EVs on Norwegian new vehicle market was 5.8%. 80% out of these vehicles were owned by private possessors. Figenbaum et al. in [
12] described the Norwegian electromobility story and gave some explanations to the Norwegian development. The inspiriting incentives, as well as interactions between private enterprises, non-government organizations, public authorities, and taxation system, that influenced the vehicle purchase, and supported the Norwegian electromobility diffusion, have been discussed here. Norway well managed the electromobility challenges and became European electromobility leader and the trendsetter for many countries. Authors point out the importance of social networks, which play an important role in the purchase of EVs. They found out that in average 36% of the EVs owners have friends who bought an electric vehicle after they had information about the experiences with electric vehicle from these friends and another 34% now consider buying an electric vehicle, what creates a potential for the market. The potential growth of EVs share in rural areas will be easier to be realized when the technological developments secure a longer range of electric vehicles, more charging stations are at the hand, and there is more of information on electric vehicles energy efficiency [
12].
The analyses of the Norwegian electric vehicle story became an inspiration for other (not only European) countries, as Norwegian policies led to the world’s fastest diffusion of EVs. An important role played the interaction of events in and between the niche, regime and landscape levels, how it shaped the Norwegian electro vehicles policies that led to the world’s fastest diffusion of EVs, also at user adoption from a socio-technical perspective. The process started in urban regions but is now covering other locations, as well [
13]. The incentives history of some countries, such as Norway, has been known for decades of years [
14], while the stimuli of other states, such as Slovakia, are only very recent [
15]. Clearly, new standards for fuel consumption and emissions, together with grants and changes in national vehicle taxation created more demand for electromobiles [
16] of all kinds and greater cognizance of electromobility.
Except of a few European countries such as Denmark, France, Germany, Netherland, the amount of electric vehicles in Europe is limited—see the development of annual registrations of BEVs and PHEVs in Europe at
Figure 2 (own adaptation based on [
17]). Despite many environmental benefits, the penetration is rather poor what might be explained by certain factors that daunt eventual purchasers. Therefore, EU states raise stimuli in order to balance these factors and support electromobility. The most important policy instruments to promote the use of EVs are tax and infrastructure measures along with financial incentives for purchasing and supporting R&D projects. The available information allowed authors of [
18] to conclude that higher penetration levels of EVs appear in countries where the registration tax, the ownership tax, or both taxes have developed into a partial green tax by including CO
2 emissions in the calculation of the final invoice. The countries with a more intensive use of EVs also fund charging stations to facilitate local electromobility [
18]. The current challenges and perspectives of the development of electromobility both under the conditions of the EU and on a global scale were discussed in [
19] too. The authors derived several recommendations concerning the development of electromobility in the EU. They point out to the importance of related services, such as the possibility of simple payments within the system, flat rate payment, management of vehicle charging over time, a detailed overview of the functionality and availability of charging stations or customer support. They consider electric vehicles being useful in meeting the goals to be achieved by introducing the zero-carbon urban logistics in the centers of major cities until 2030 [
19].
Johansen in his diploma thesis [
20] sees electric mobility as the key technology that will replace fossil energy in the long run. He claims that “looking at the e-mobility research area, little research has been focused on measuring maturity within the field” and that during his literature research he found “only one piece of literature focusing on evaluating maturity on battery electric vehicles”, namely [
21]. In fact, beside other literature, he sources from 2 papers, [
21,
22], where the latter one presents an improvement of the approach presented in the first one. Based on the literature review Johansen in [
20] understand the concept of electromobility as a complex system consisting of the following parts: smart grids, general infrastructure-intelligent charging and transport systems, policy aspects and regulation, economic aspects, sustainability, business models and market integration. Author in the thesis presents an electromobility maturity model-a framework for measuring electromobility readiness of countries. The chosen maturity indicators for e-mobility were sustainability, regulation, infrastructure, economic factors, consumer perception, and market integration. The model was constructed through an iterative process by going back and forth between through data to establish validity. It was evaluated by its application on Denmark and Germany. Based on the qualitative data it was found that the maturity of e-mobility is the same in each country, although it is strong in different indicators.
Papers [
21,
22] deal with the question how to identify whether the introduction of EVs is sustainable in megacities, as the potential for sustainable success depends on many local conditions such as energy mix, traffic and climate flow and even parameters like the human development index or corruption index. Authors focus only on BEVs and do not include any form of hybrid electric vehicles or two-wheelers in their calculations. They define the electromobility potential index—the parameter that should help the decision makers uncover the potential for sustainable and successful introduction of these vehicles in megacities, and answer the questions whether the city itself is ready for that and whether it provides supporting boundary conditions. Deriving three key topics–readiness, user acceptance, and sustainability, in [
22] the five key performance indicators have been identified: consumption, environmental impact, costs, infrastructure and socio-demographic conditions. With the help of numerous formulae using quantitative data from many sources, authors derive the values of the key performance indicators and some other performance indicators in order to define the values of the electromobility potential index for 47 major cities. The modified composition of the electromobility potential index presented in [
21] combines only four key performance indicators and their respective weightings. In order to have linearly independent data the consumption indicator has been removed, as its effects are already accounted in infrastructure indicator and costs indicator. The electromobility potential index has been in [
21] recalculated for the set of all cities from [
22] except of Riyadh, what effect in permutation of the sequence in which the cities stand according to descending electromobility potential index values. It was shown that in general, cities with well-developed infrastructure, high living standards and reliable governance show the best boundary conditions for successful and sustainable introduction of BEVs. The robustness of the electromobility potential index calculation has been confirmed in [
21], as well. Higueras-Castillo et al. in [
23] studied the marketing angle of view towards electromobility development. The crucial goal laid in the appreciation of the consumer attitudes towards electromobility. This recent study indicated the factors of perceived consumer effectiveness understood as the consumer’s assessment of his/her ability to contribute to specific results of sustainable development via specific behaviors. The conclusions of this study should be facilitated in order to improve established marketing strategies. The results show that trust and external incentives are the main factors when buying a battery electric vehicle or plug-in hybrid electric vehicle. Perceived consumer effectiveness has a significant impact on the intent. The effect of green self-identity on attitude is noticeable in consumers with high levels of perceived consumer effectiveness [
23]. According to 2018 statistics China is the world largest market with over 1,000,000 battery electric cars sold, followed by Europe (over 385,000 battery electric cars sold) and USA (over 361,000 battery electric cars sold). At the other hand, the China’s share is 4.5% and USA’s share is 2.4%, while the world’s highest market share, 46% (in 2018) for electric car sales, is associated to Norway [
4].
Many studies pay attention to the manifold policy tools of individual countries that try to motivate moving to the BEVs and PHEVs. One of them is [
24], where the emphasis was put on Greece. The work brought three policy assistance stimulants with regard on encouraging the utilization of the EVs until 2030. The results of the research show that the use of direct subsidies is more advantageous compared to the carbon taxation system. Similar stimulants have many European countries—see [
25]. The consumer attitude towards electromobility has been studied in [
26], as well. Authors focus here on electric vehicles, more concretely: plug-in hybrid electric vehicles, range extended electric vehicles, and battery electric vehicles. Although these electromobiles are perceived as secure and environmentally friendly, the high purchase prices form barriers for the widespread utilization of electric cars. Bühne et al. claim that these obstacles can be reduced by benefits in the shape of financial measures such as tax and energy cost reductions and dense network of charging stations [
26]. On the model example of Germany authors discuss the use of different promotion measures by the national government that can enhance the market share of electromobiles and based on Norway experiences they postulate that tax exemptions can raise the stock of electromobiles quite quickly.
The development of the electromobility sector in the EU and its particular states with focus on Poland was estimated in [
27]. The situation was compared with the one in Switzerland and Norway. Tucki et al. present a method for calculating primary energy which has been evaluated on the basis of methods proposed by the Fraunhofer Institute. Validation was performed based on a comparison of 4 proposed methods. It was proved that the method suggested by the authors is the most accurate. Increased demand for electric vehicles has been reflected in lower CO
2 emissions. Drożdż and Starzyński in [
28] presented the legal regulations implemented in Poland in the area of electromobility. Similar issues were also addressed by Sendek and Matysiak. They monitor electromobility in Poland with the introduction of BEVs and the most important factors stimulating its development [
29]. As the road transport is one of the major sources of air pollution in this country, the most important factors stimulating the current state of electromobility and its development were in focus of several research studies—see e.g., [
30,
31,
32,
33] and many others, where the country of the primary interest was Poland. Kupczyk et al. in [
31] presented actual trends as well as forecasting changes regarding the markets of chosen alternative fuels and the market of EVs. The legal framework was considered in this paper, as well. The research has been formed on a score-based sector attractiveness method to compare the selected units-the biofuel and the electric car markets. Electric cars along with charging stations have been discussed by Kłos et al. in [
32]. The effort to specify the impact on the demand for power and energy in the Polish electric power system caused by utilization of electric cars was the main point presented here. Kłos et al. consider it being necessary to take into account the development of electromobility both at the level of production and its transmission and distribution. The results of the research show that the impact of electromobility on the system depends mainly on the development of load curves associated with car charging. Authors prefer charging EVs during the night, what should be encouraged at the expense of discouraging fast charging during the day by an appropriate economic, legal, and technical environment. The connections between charging stations infrastructure and mentioned electric power system were analyzed by looking at the current conditions on the one hand, and by looking at the future and possible issues on the other hand. The potential negatives of the matter for the same country have been presented by Drożdż in [
27]. Although no greenhouse gas emissions are generated directly from the operation of EVs, a significant amount is produced during the production in power plants. In some Central European countries, the efficiency of primary energy consumption for the end users is half of that in the most efficient countries. In the case of greenhouse gas production, there is up to 5.8 fold difference [
33].
The environmental impact of electric power production considering the issue of electric vehicle operation has been discussed by Skrúcaný et al. in [
34]. Authors show the ecological footprint of electric vehicle operations focusing on selected European countries: Austria, Czech Republic, Germany, Hungary, Poland, Slovakia, and Slovenia. The reduction of greenhouse gas emissions by increasing energy efficiency, the share of zero-emission electricity production, and encouraging electromobility in Hungary has been studied in [
35]. The connections between CO
2 emissions in Austria, Czech Republic, Germany, Poland, and Slovak Republic and the public attitude to electromobility have been discussed by Jursová et al. in [
36]. Authors say that the inhabitants of Czech and Polish cross border region are interested in electromobility. The results of the research confirm that they believe in its ecological contributions and they would be interested in buying an electric vehicle will not be the worries about its distance range, the existence of insufficient amount of charging points, the high purchasing price and the worries on electric cars reliability. The respondents indicate lack of information about this technology. Approximately 60% of respondents consider the investment to be insufficient for the massive application of electromobility for everyday life [
36]. Igliński presented a research on electromobility development in Central Europe and Eastern Europe in [
37], where a comparative study on electromobility development in Poland and another 10 countries including Slovakia, Hungary and Czech Republic can be found. The development of electromobility in the EU and in Slovakia has been studied by Daňo and Rehák in [
38]. The paper has been published in 2018. Based on the data obtained in the previous time period they found out that one of the major problems hindering the development of electromobility in Slovakia is the lack of charging stations in the network. The only exception was the capital city-Bratislava. Another problem is the purchasing price of electric cars. It is at the level of 30,000 EUR, which is a high price for an average Slovak. Some recommendations that might increase the marketability of EVs in Slovakia can be found in [
39] published by Rehák. The conditions for development of electromobility in Slovak Republic have been studied in [
6,
40], as well. On an example of the city Senec in [
40] Hrudkay and Jaroš point out to a strategy for the development of electromobility with the aim of building some ecosystem with a gradual reduction of emissions from the local transport point of view. The options for the local micro electromobility in Liberec Region of Czech Republic and in the Middle Europe in general were discussed by Černohorský et al. in [
41]. Authors highlight that the development of electromobility in post-communist countries is not sufficiently supported. They see opportunities in promoting personal mobility on a bicycle, which they compare with the local public transport and individual car transport, in terms of time and cost. The biggest problem in mechanical as well as electrical implementation of electric drive on a bicycle addresses Svetlík in [
42].
Based on the literature review provided, one can sum up, that the sustainable traffic development is closely related to new technologies’ development focusing on the greenhouse gas emission reduction and hence, searching for possibilities of the widespread utilization of alternative fueled vehicles. Within these vehicles, electric cars have an important place. The development of car electromobility depends on many different factors. Although factors like purchasing prices of electric cars, personal income, stimulants and incentives of government, benefits in the financial measures in the form of tax or energy cost reductions and similar ones play an important role here, before all the existence of the dense network of charging stations is crucial factor affecting the car electromobility. At the one hand, European countries with longer electromobility history have better electromobile infrastructure, but also a greater number of electric vehicles in use. Other ones, like e.g., V4 countries, are just at the beginning of their electromobility age, what is usually connected both with lacking electromobile infrastructure and small number of electric cars in use. Therefore, our questions on the extent to which these countries are prepared for the widespread utilization of car electromobility from the infrastructural point of view are very up to date.
3. Materials and Methods
In this paper we aim to answer the question to which extend are selected European countries prepared for electromobility in the EU context and boundness juncture to selected European countries.
In order to reach our goal, we asked four research questions. The answer to the all research questions assumed a broad literature review. Hence, we conducted a literature review on the topic, analyze the data obtained, summarize, process and visualize these data via standard techniques with the help of tables, maps, and charts. The review was conducted in a similar way as by Okorie et al. in [
43] or Mohamad and Teh in [
44] based on principles of systematic review. Denyer and Tranfield in [
45] point out to the fact that systematic review has to be a self-contained research project and should not be regarded as a literature review in the traditional sense, as its aim is to find an answer to a clearly specified question. According to Moher et al. [
46] systematic reviews should be systematically planned and build on a protocol that describes the rationale, hypothesis, and planned methods of the review. Following the ideas presented in [
45,
46] here we have searched articles in the Web of Science, Scopus, IEEE Xplore, and Google Scholar databases. In 2019 we set the end of 2014 as the starting point of our review as we aimed to work with the data that are at most 5 years old. Although via manual screening of cross-references of some articles we have found some more relevant publications exceeding our time range of revised articles. As the work has been finalized only in 2020, we have processed also some data that have been published until the end of March 2020. In order to get the most up to date data we searched also statistical data published at Eurostat’s, European Automobile Manufacturers’ Association’s, World Bank Group’s and many other web pages and online databases from trusted sources such as Slovak Investment and Trade Development Agency, Vienna Institute of Demography and International Institute for Applied Systems Analysis. The most up to date news about technical parameters of nowadays electric vehicles and firstly public presented plans about building new electromobility infrastructure we got from a clean mobility exhibition—the Slovak Electric Car Salon 2020 in Bratislava. This process led to the final list of data sources.
In order to obtain required information we have studied and cross-country compared several relevant parameters such as the total number of cars, BEVs, and PHEVs registered in country and its recomputation for 1000 inhabitants of the country, the total number of charging stations, its recomputation for 1 registered plug-in electromobile, its recomputation for the area of the country, and its recomputation for 1000 inhabitants of the country, the yearly percentage growth of associated infrastructure and so on. As the most important building blocks of this infrastructure are the fast charging stations, we have discussed their number per 100 km of highways in each country. Since we have focused on Slovakia, we have studied the overall distribution of the fast charging stations in Slovak Republic. The main problem was to determine some parameter that could be useful for cross-country comparison considering the electromobility preparation, as analyzing both the standard ways of measuring, counting, and displaying disparities between regions via statistical tools such as the Atkinson index, coefficient of variation, Gini coefficient, Hoover index, real convergence method, standard deviation, Theil index, and so on (see e.g., [
47,
48,
49]) and less known ones via graph theory means (see e.g., [
50]), we could not find the appropriate fitting one. Therefore, we have defined the infrastructural country electromobility coefficient, abbreviated as
K–a parameter for infrastructural cross-countries (car) electromobility preparation comparison. For all the countries of selection we have counted and discussed the values of the introduced parameter K, defined as follows:
Ep is the number of (BEVs + PHEVs) per 1000 inhabitants of the country,
Nk is the number of public charging stations per km2 of the country,
Ne is the number of public charging points per plug-in electromobile,
Np is the number of public charging points per 1000 inhabitants of the country.
Hence, clearly,
K could be expressed in No∗km
−2, in SI units only km
−2, and defined alternatively:
N is the number of public charging stations,
P is the number of inhabitants of the country,
A is the total area of the country.
Obviously, the higher values of K refer to the higher extent of preparation of the country for electromobility. Although K could be counted according to (2), we prefer the Equation (1) to do so, as each element of Equation (1): Ep, Nk, Ne, Np, brings some particular information on countries electromobility preparation:
The higher is the normalized value of the number of BEVs and PHEVs already used by inhabitants of the country, the higher is the optimism about their worth utilization in daily life, the higher is the overall information about the benefits of EVs, the more positive is the overall environment towards electromobility, the more is the country prepared for the widespread utilization of BEVs and PHEVs. Therefore, K is directly proportional to Ep.
Although it is important to consider the exact spatial organization of the charging points within the country (as in the extreme case the charging stations can be concentrated only in urban areas and nowhere else), one can expect that similarly like in the case of mobile network providers, the large electric vehicle charging services providers would focus on good (in ideal case equidistant) coverage of the country by public charging points. Sure, the opportunities to charge a vehicle in big cities and the rest of the country might differ, but considering the text above, the average number of public charging stations per km2 of the country, Nk, also gives partial information about the infrastructural preparedness of the country for EVs utilization. As the higher is the density of public charging stations’ net, the more comfortable is the travelling using an electric car (even of a smaller range), K is directly proportional to Nk.
In a case of widespread utilization of EVs in the respective country, with the greater number of electric cars in use the demand on charging infrastructure grows. If there are more inhabitants of the country, there are more potential buyers of an electric car, each of which would like to use it in a comfort way, hence, without the fear where to charge it. Therefore, K is directly proportional to the number of public charging points per 1000 inhabitants of the country (Np).
The lesser is the number of BEVs and PHEVs per one public charging point (the inverse value of the parameter Ne), the better is the public electromobile infrastructure and the better is country prepared for the widespread utilization of EVs. Therefore, K is indirectly proportional to the inverse value of Ne, or, conversely, K is directly proportional to Ne. In mathematics, being directly proportional means that as one amount increases, another amount increases at the same rate. Therefore, in our definition of K the multiplication instead of addition is used, although the disadvantage of the calculation technique is clear—a very wide interval of K-values counted for countries of diverse electromobility incentives history.
Clearly, other indicators such as the average income or average vehicle prices should have been considered in order to find out to which extent selected countries are prepared for the widespread utilization of electric cars, as well. However, here we focus mainly on the diffusion of electric vehicles in reference of the charging infrastructure, what is reflected in the definition of the infrastructural country electromobility coefficient K. We understand its utilization being helpful especially for customers that are considering buying an EV and wonder whether the local environment and country infrastructure is satisfactory for its daily use. It is expected that the distance range, safety, as well as economic, legal and other aspects of purchasing an EV would be considered by customers separately.
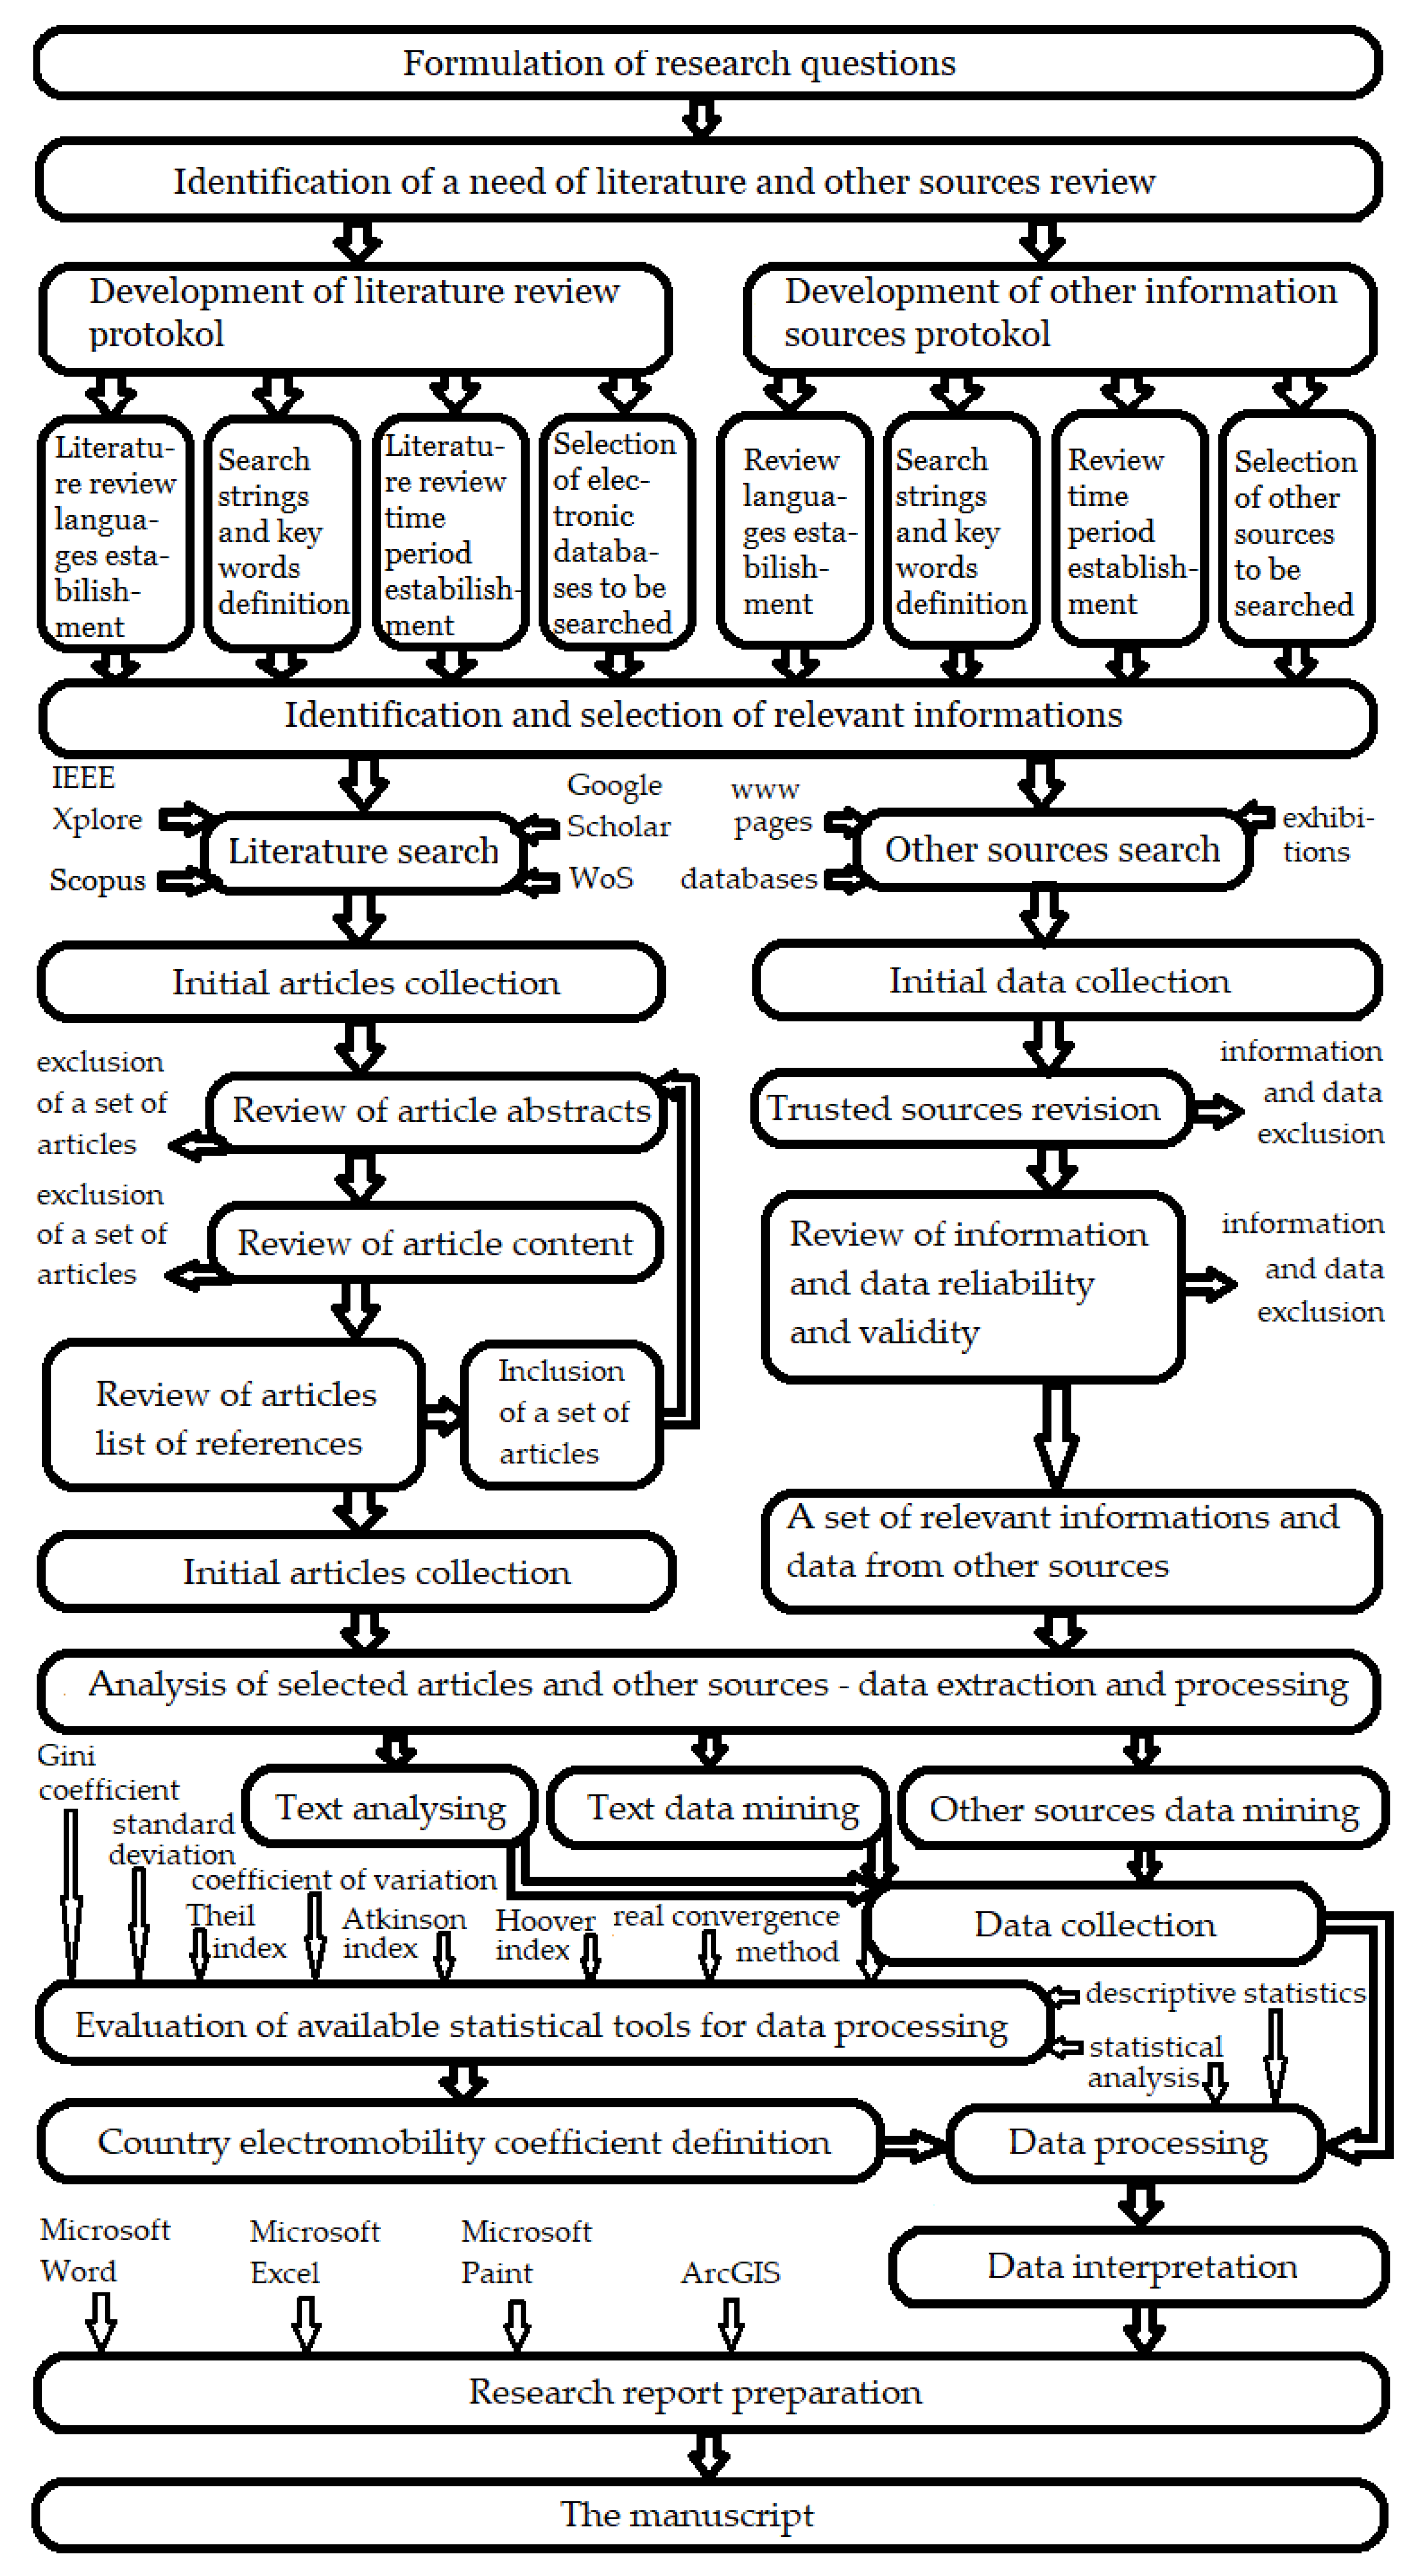
On the basis of carried out review, calculations, and objectively critical analysis of research results we have posted our conclusions regarding the research questions. The schema of processes that preceded the writing of this article is recorded at
Figure 3 (own structurogram based on the realized processes).
3.1. The Choice of Reference Countries
In our study we focused on the situation in V4 countries. The countries of Visegrád Group belong to Central European region and closely cooperate in several areas of common interest within the framework of pan-European integration. All V4 countries achieved the goal of being a part of the EU at the same time (1 May 2004), but not only their EU history has had the same features. These countries have always been a part of the same civilization based on the same cultural and intellectual values and common roots of traditions. The list of their mutual cooperation projects is long, including the projects relating to electromobility. In order to have the top and standard reference values for V4 countries comparison considering the electromobility preparation, we decided to analyze the same types of data for V4 countries as for European electromobility leaders and compare them with the EU average. EU is considered as the union of 28 states here, hence, inclusive United Kingdom, as all the data subject to the EU are from the range of years 2014–2019.
According to Electric Vehicle World Sales Database [
17] the European leader in the share of electric vehicles within new sold cars referred to 2019 is Norway. It clearly belongs to electromobility leaders of Europe. Although it is not a member of the EU, we decided to add it into our set of selected countries. Among other European electromobility leaders we have included into our countries of selection EU countries Denmark, Germany, and Netherlands.
Norway, Germany, Denmark and Netherlands have high potential within electromobility. All these countries have high level of economic power, good infrastructure and there are a lot of government incentives towards sustainable technology, green energy, and reductions of greenhouse gas emissions in these countries, as well. For example, Norway has agreed upon a ban against emission cars in 2025, while Denmark has a 100% renewable energy target towards 2050 [
20]. Netherlands uses renewable energy from many different sources (biofuels, waste, wind, sun, geothermal and hydro sources) and has one of the most ambitious targets for climate-change mitigation—the 49% reduction in carbon emissions by 2030 [
51]. Germany has also ambitious plans towards green energy. Five years ago, Germany’s share of renewable energy was 28% of its gross electricity consumption, with a goal of achieving a 40% share by the end of 2020 [
20]. Germany is also known for its strong history in car manufacturing and for its ambitions being the front-runner country in mobility and electromobility. Therefore, these countries have been chosen into our set.
3.2. Electric Vehicles-Cars
According to the degree that electricity is used in cars as their energy source there are three main types of electric vehicles (EVs): battery electric vehicles (BEVs), plug-in hybrid electric vehicles (PHEVs), and hybrid electric vehicles (HEVs): HEVs are powered by both electricity and gasoline. PHEVs can recharge the battery through either external source of electrical power or regenerative braking. The fully-electric vehicles with rechargeable batteries and no gasoline engine are those of BEV category. Their high-capacity battery packs allow using their electric motor and all onboard electronics without any harmful emissions, what is the point towards global warming mitigation [
52]. BEVs have to be charged from an external source (for details on these sources see [
53]).
3.3. The Data on Electric Vehicles-Cars
Actually, there are more than one million EVs in Europe. After the industry geared up to meet the 95 g CO
2/km target for 2020/2021, over 30 BEV and PHEV models were introduced or improved in 2019. The EV sales in Europe noticed 44% growth in 2019 and pushed the global BEV and PHEV share to 2.5%. The share leader for 2019 with 56% of new car from the PHEV class was Norway, followed by Iceland (24.5%) and the Netherlands (15%). The largest volume growth contributors were Germany, Netherlands and Norway (see Table 2). Among other markets with over 1 million total sales in 2019, China lead with a plug-in share of 5.2%, followed by United Kingdom (3.2%), Germany (2.9%), France (2.8%), and Canada (2.7%). By these facts within the year 2019 the Europe’s share in global BEV and PHEV sales increased from 20% to 26% [
17].
This trend is clearly notable from the time development of the total number of passenger cars, BEVs and PHEVs in the last years.
Table 1 and
Table 2 show these data for selected European countries, EU average and V4 countries for time range 2015–2017 and 2018–2019, respectively. These data were processed on the base of [
16,
25].
3.4. The Data on Charging Stations
The millionth EV sale reached in 2018 was important milestone on the road to electrification and meeting emission targets, as well as a clear signal of consumer intent. However, crucial for capturing this momentum is the access to low-cost, well-located charging stations (Viktor Irle and Matt Allen for The Guardian [
54]).
Table 3 and
Table 4 show the development of the alternative fuel infrastructure for BEVs and PHEVs in selected European countries, the average of European Union and the average of Visegrád Group alliance (processed based on charts published at [
25]). The data reflect remarkable growth of infrastructure between 2014 and 2019.
As
Table 3 reflects only the time development of the number of charging stations, it does not reflect their utilization. One can expect that charging stations of some country would be used mostly by inhabitants of this country and only rarely by foreigners. Hence, the total number of charging points has to be considered together with the total number of BEVs and PHEVs registered in the country. Therefore,
Table 5 shows the rounded values of plug-in electric vehicles per public charging point (processed based on available material at [
25]). In this case the small numbers are considered as the good ones. The higher numbers refer to the missing infrastructure.
Debating the public charging points, the highest importance has those of at least 22 kW, so called fast charging points (see [
53]). These are usually situated along highways. Their amount per 100 km of highway for countries of selection shows
Table 6 processed based on [
25]. In this case the greater number means the better developed infrastructure along highways, what is the main requested effect.
3.5. Combined Index Calculation
As some of the countries have higher density of highways or longer highways roads, the data in
Table 6 have to be discussed in wider context reflecting the highway net and area of the country. Therefore, it is worth to use the data from
Table 7 that was processed based on [
25,
51,
55,
56,
57,
58].
The data presented in
Table 1,
Table 2,
Table 3,
Table 4,
Table 5,
Table 6 and
Table 7 have been used in order to derive the base parameters that help to describe the countries’ development towards electromobility: the share of BEVs and PHEVs in passenger cars for the given country or alliance of countries, yearly or time horizon growth of this share, percentage yearly jump in number of BEVs and PHEVs, average yearly growth of infrastructure… But these data have been also used in order to count the infrastructural country electromobility coefficient
K obtained as a product of
Ep, Nk, Ne, and
Np, where
where
NB+P is the total number of battery electric vehicles and plug-in hybrid electric vehicles in the country,
P is the total number of inhabitants of the respective country,
N is the total number of public charging points, and
A is the total area of the country of selection.
4. Results and Discussion
The total number of passenger cars, BEVs and PHEVs grew fast between 2015 and 2019. While at the end of 2015 there were 252,075,544 passenger cars on European Union roads out of which 0.047% were BEVs and 0.051% were PHEVs (
Table 1), at the beginning of 2019 there were 267,834,417 passenger cars out of which 0.146% were BEVs and 0.144% were PHEVs (
Table 2). These average fractions of BEVs and PHEVs are small, as some countries, such as e.g., countries of Visegrád Group alliance, only very recently moved towards electromobility. At the end of 2015 there were 31,111,843 passenger cars in V4 countries out of which 0.005% were BEVs and 0.002% were PHEVs (
Table 1), at the beginning of 2019 there were 35,196,697 passenger cars out of which 0.019% were BEVs and 0.012% were PHEVs (
Table 2). Among V4 countries the fastest growth considering the BEVs and PHEVs share reached Hungary that between years 2015–2019 increased the BEVs share from 0.006% to 0.068% and PHEVs share from 0.003% to 0.035%, hence, in both cases, more than 11 times. BEVs’ shares of other V4 countries grew 1.75–6 times: the growth from 0.001% to 0.006% is associated with Poland, the growth from 0.007% to 0.034% is associated with Slovak Republic and the lowest growth from 0.020% to 0.035% is associated with Czech Republic. PHEVs’ shares of other V4 countries grew 3.4–7 times: the growth from 0.001% to 0.007% is associated with Poland, the growth from 0.004% to 0.015% is associated with Czech Republic and the lowest growth from 0.008% to 0.027% is associated with Slovak Republic. At the other hand, Poland steadily has the lowest both BEVs and PHEVs share among V4 countries, but all V4 countries are far below EU average and in a much worse position compared to countries like Germany, Netherlands or Norway. Considering the total numbers of both BEVs and PHEVs, except of the year 2014, when there were 156 registered PHEVs in Slovakia and only 99 in Hungary, Slovakia takes always the last position among V4 countries within the referenced time period. It points out to the fact that incentives towards electromobility in Slovakia came only in the recent years. However, they seem to be effective, as the amount of BEVs in Slovakia jumped by 20.3% (from 795 to 956) and the amount of PHEVs jumped by 33.2% within the last year (
Table 2).
Clearly, the total amount of vehicles, and hence, EVs, partially depends on the number of inhabitants of the country. Therefore, is worth to count the total number of BEVs and PHEVs per 1000 inhabitants of the country (
Ep) and compare it with the total number of passenger cars per 1000 inhabitants (
Cp)—see
Table 8. During the reference time period Hungary followed by Slovakia had the least number of passenger cars per 1000 inhabitants. Except of Denmark, there was roughly 1 car per 2 persons, if not less, in other countries. At the other side, Denmark together with Netherlands and Germany belong to those countries in the EU, where rough 1–12 people out of 1000 own an electric car, and in a case of non-European Union country Norway tens of people out of 1000 own it. The discussed ratio is very much smaller in the case of V4 countries, although, during the last 5 years it grew more than 19 times in a case of Hungary, more than 10 times in a case of Poland, more than 6 times in a case of Slovakia, and more than 3 times in a case of Czech Republic. This shows an increasing interest in buying an electric car in V4 countries. The growth in interest in Slovakia is similar to the growth in Germany.
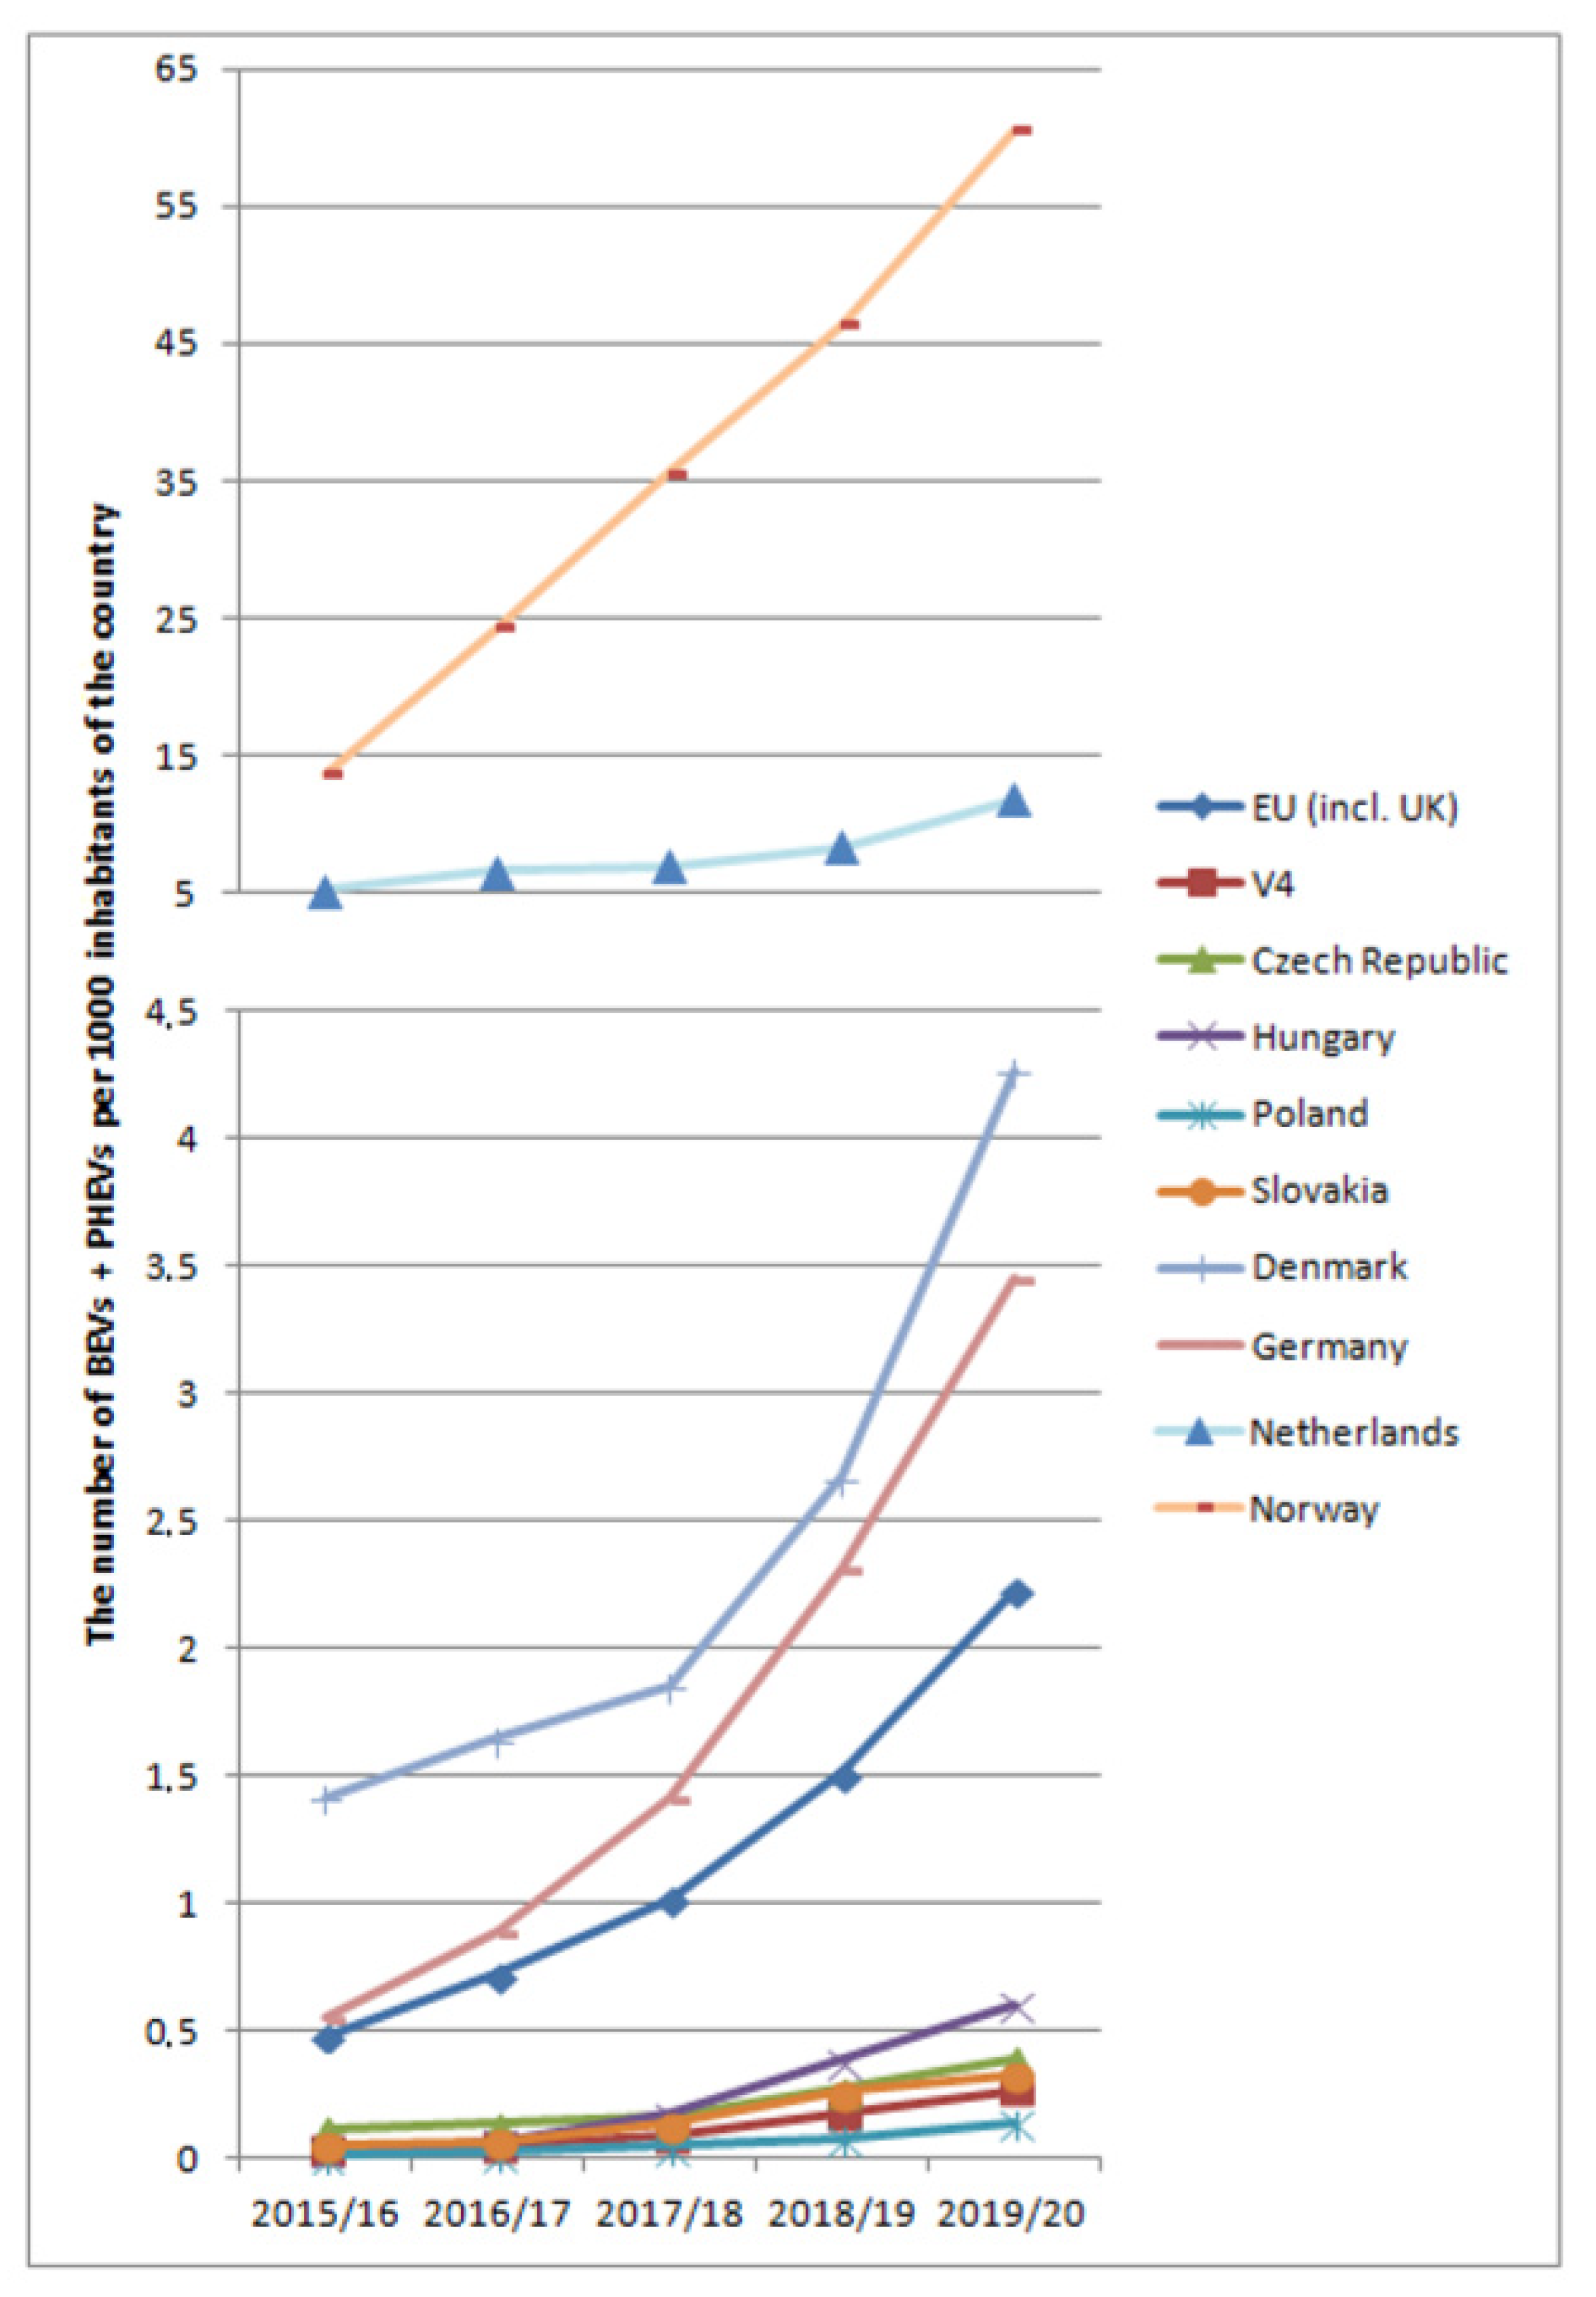
For the better visualization
Figure 4 (own chart based on obtained data) shows the development of the total number of BEVs and PHEVs per 1000 inhabitants of countries of selection.
Debating
Figure 4, one can see that there is a big difference between Norway and other European countries of selection. The very low share of electric cars in V4 countries reflects in the flat shape of the corresponding lines at
Figure 4. The similar is not true debating the parameter
Cp–the total number of passenger cars per 1000 inhabitants of the country. In this case V4 countries are not behind the EU countries of selection and even Norway, see
Table 8. The total number of charging stations in V4 countries jumped from several hundred in 2014 to several thousands in 2019 (
Table 3). Depending on the actual incentives, the yearly growth of infrastructure (
Table 4) in the countries of V4 varied from 2% (Czech Republic, 2017–2018) to 269% (Slovakia, 2015–2016). In average, the yearly growth of infrastructure reached 58.6% during the spotted time horizon. The highest was in Slovakia (81.6%), followed by Poland (57.2%), Czech Republic (49.4%) and Hungary (46.2%). Except of Hungary, this growth is higher like EU average (47.0%), what points out to the fast development of these countries regarding the electromobility infrastructure. However, it has to be remarked, that countries like Netherlands, Germany and Norway have nowadays decades of thousands charging stations (
Table 3), while the whole V4 alliance only 3244 (2019). Similarly, between 2016–2017 and 2017–2018 the yearly growth of electromobility infrastructure in Denmark reached only 3% (
Table 4), but it has to be noticed, that the total number of public charging stations in Denmark only, with the area of 43,094 km
2, has been each year from the range 2014–2018 higher than the total number of public charging stations in Visegrád Group alliance of the area 533,617 km
2. Only in 2019 the V4 countries overtake Denmark considering the cumulative number of public charging points.
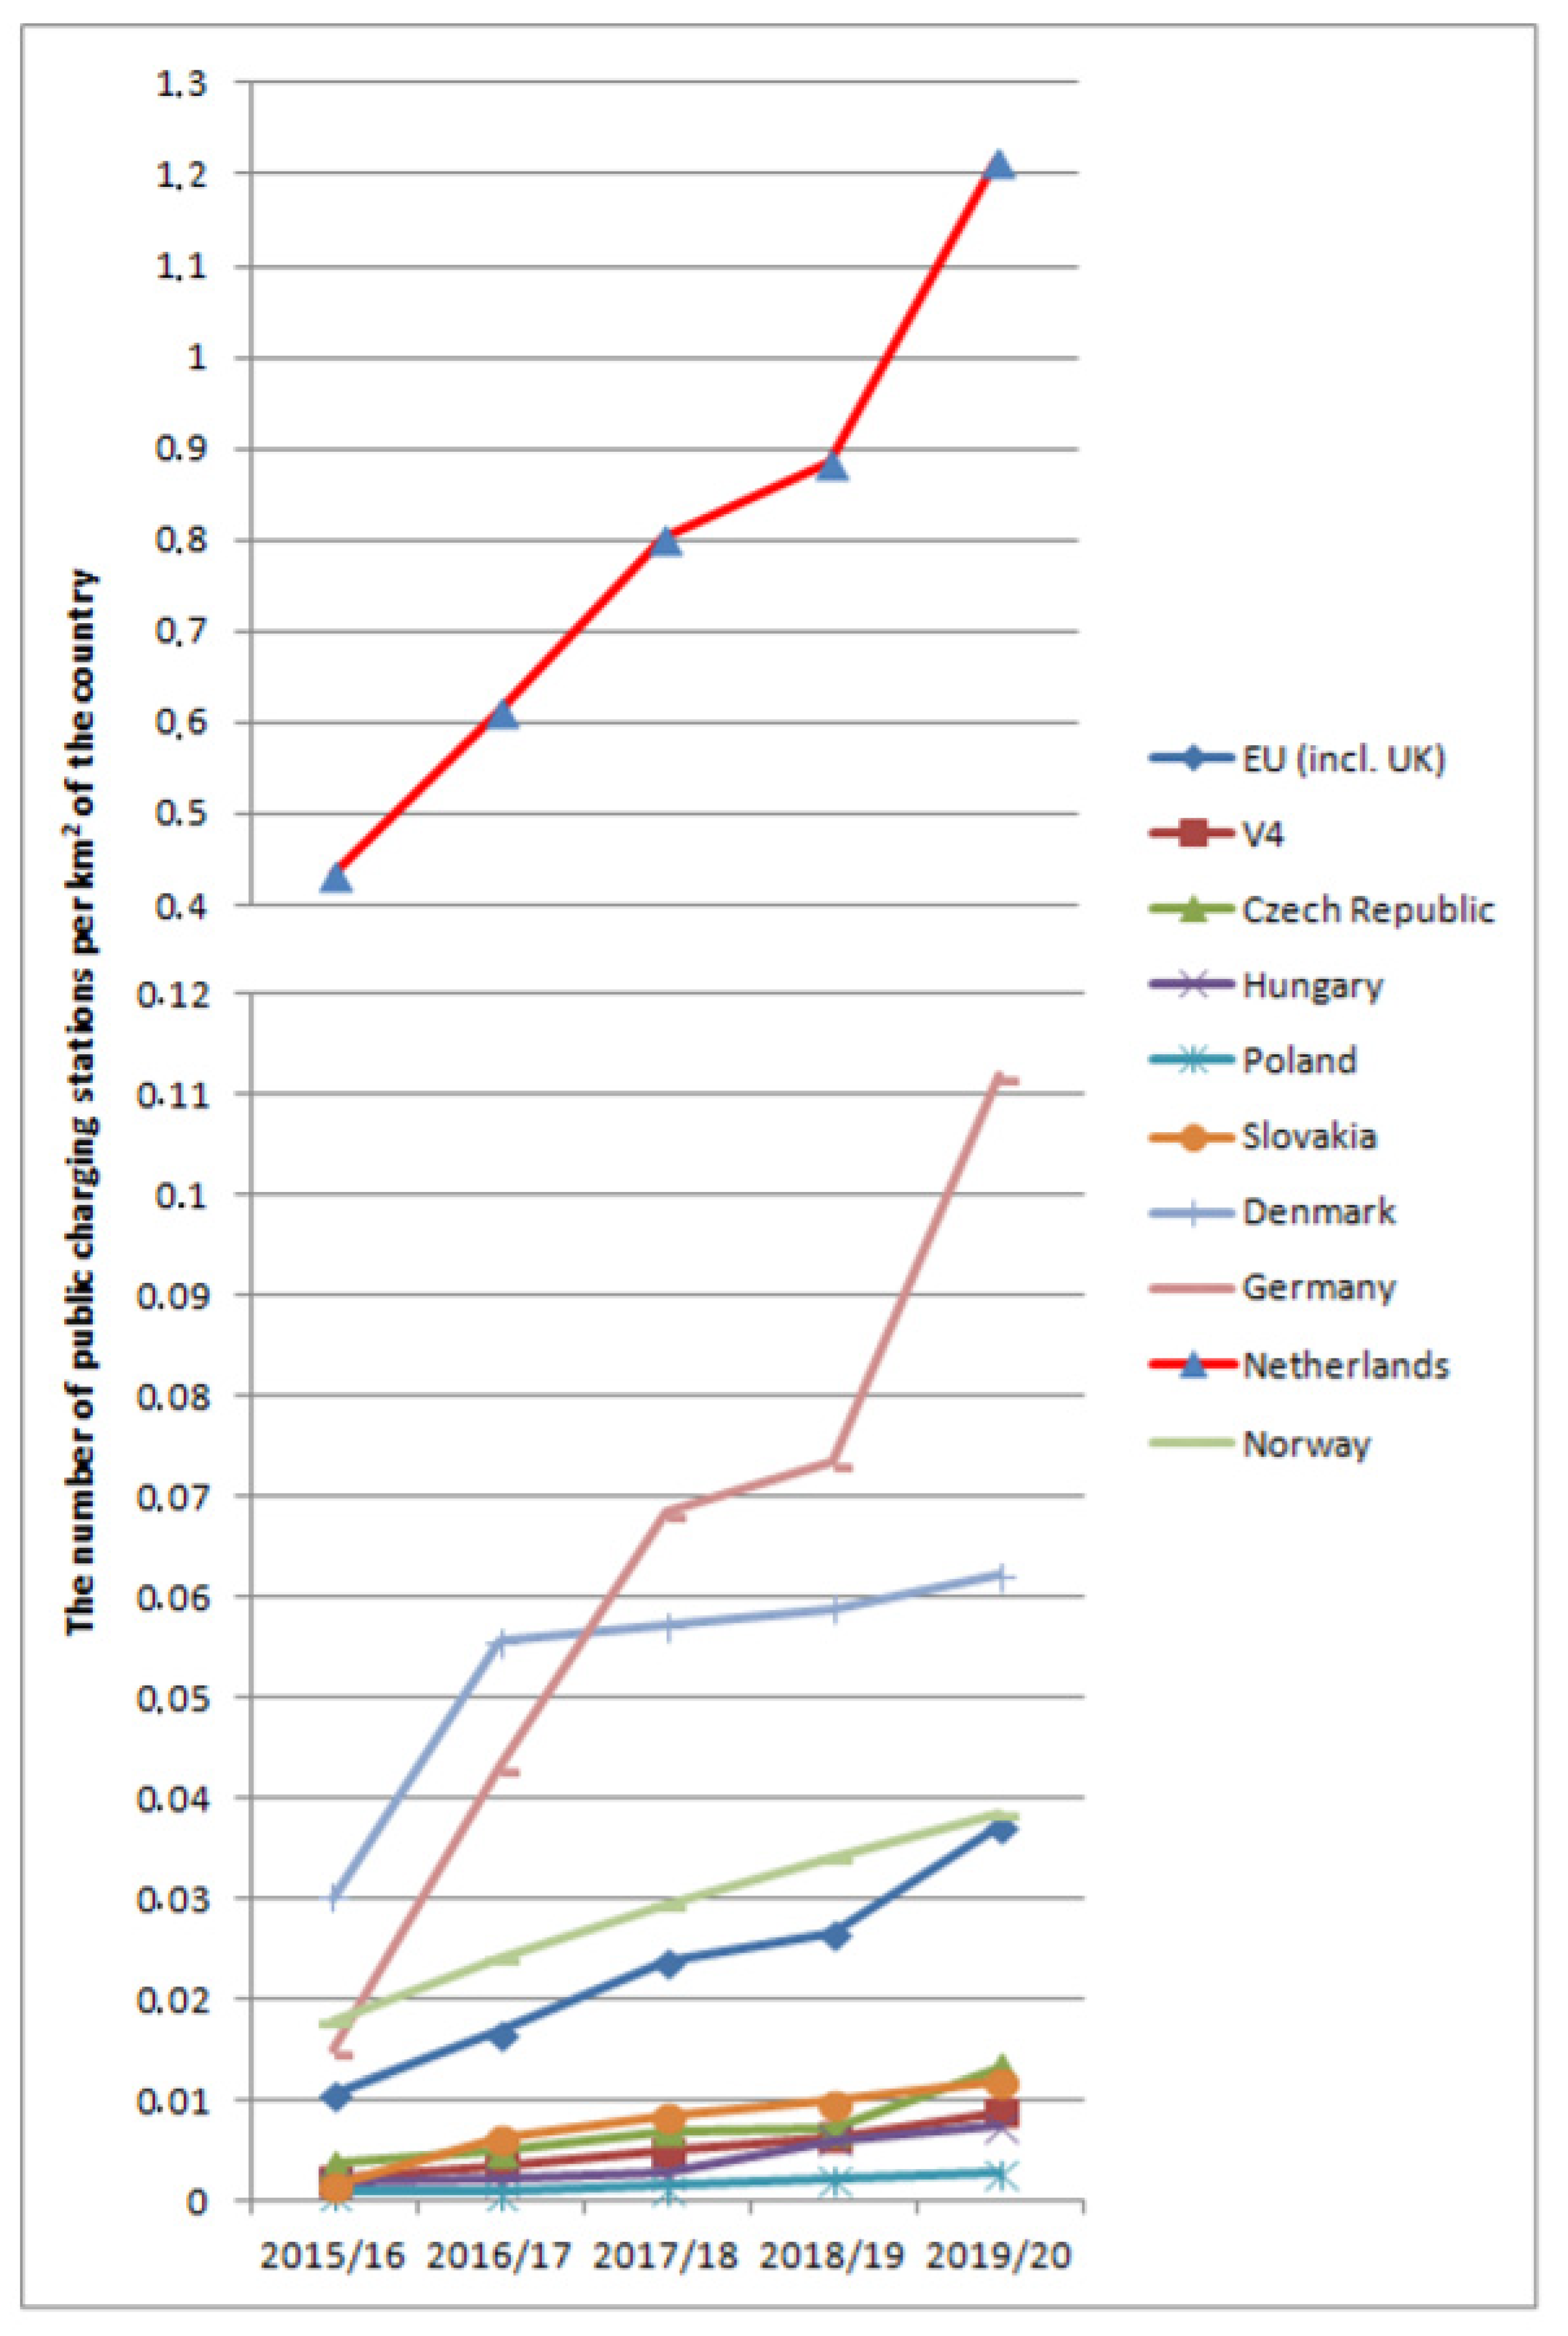
The above example of Denmark shows that it is important to consider the alternative fuel charging infrastructure depending on the area of considered country.
Table 9 shows the number of public charging stations per km
2 of the country.
While there was roughly 1 public charging point per 2 km
2 of Netherlands at the end of 2015, there was only a very small fraction (0.00171) of public charging point per 1 km
2 of Slovakia—see
Figure 5 (own chart based on obtained data), what was the second least number among V4 countries. Nowadays, when there is statistically more than 1 public charging point per 1 km
2 of Netherlands, Slovakia reached the value 0.01191. With a similar value as Czech Republic, it is 3 times lesser than in the case of European Union average and this average is approximately the same as the density of public charging stations in Norway. Although Slovakia is far behind the EU’s electromobility leaders and even behind the EU average considering this parameter, within V4 countries it is in a good position.
The lesser is the number of BEVs and PHEVs per one public charging point, the more satisfactory is the electromobility infrastructure in the country. As all the values in
Table 5 are rounded, there are several 0s in the line associated to Denmark. This means that there are lesser than 0.49 PHEVs for one public charging point. Among selected countries, the highest values in
Table 5 are associated with Norway. Although there were several thousands of public charging points during 2014–2017, and nowadays, there are more than 12,000 of them (
Table 3), due to the large volume of EVs in Norway, it is not satisfactory. According to the suggestions of the European Commission [
5] that qualify the sufficiency of the public charging stations, it is recommended that states should be at the ratio not more than 10 electric cars per one public charging point. Hence, it can be said that the percentage yearly growth of infrastructure here (see
Table 4) was insufficient, especially considering BEVs.
Thanks to the relatively small amount of EVs in Czech Republic, Hungary, Poland and Slovakia, the number of public charging points was almost sufficient during 2015–2018 in V4 countries and it only slightly moved up in the last two years—see
Table 5. However, the values are more favorable than in the EU average. Only Hungary as a part of V4 countries in the recent years has the discussed rate slightly above the EU average in the BEVs case.
From values of
Table 5 one can observe, that due to the relatively small number of BEVs and PHEVs on Slovak roads there are steadily 1–2 EVs per 1 public charging point during the recent 5 years’ time horizon. As the number of PHEVs and BEVs grow every year, the above fact points out to the accurately fast growth of electromobility infrastructure—see
Table 3. The asymmetric percentage yearly growth of Slovak electromobility infrastructure (see
Table 4) seems to be appropriate. On the basis of suggestions, the European Commission [
5] somebody should argue that 1–2 EVs per 1 public charging point reflect a very favorable position of Slovakia, not only the accurately fast growth of electromobile infrastructure. However, similarly like in the previous paragraph, we should not use too optimistic words here, as in both cases one has to take into account also the total number of EVs and charging points in the respective country. In the case when there are only 2 EVs in some country and singe 1 charging point, the statistics says the same, but, hardly it can be said that this is very good unless the area of the state itself is not larger than area of some city. According to pure statistics, Slovakia might make an impression to be very well prepared for electromobility from the infrastructural point of view. However, the above data do not reflect the spatial coverage of Slovakia by public charging stations.
Some partial information about the spatial coverage of Slovakia by public charging stations can be obtained from
Table 6. The existence of fast charging stations along highways is crucial in order to ensure electromobility. The bigger is their density, the better is country prepared for using EVs for large distance travels. The rapid growth of electromobility infrastructure in the last five years had a consequence that nowadays there are 50 charging points per 100 km of Slovak highway, what is 6.25 times more than in 2015. Hence, Slovakia is nowadays in a more than double better position than the average of EU. It was above the EU average during the whole monitored time horizon. In the last two years also Czech Republic among V4 countries overcame the EU average. By the recent values Slovakia and Czech Republic overtake countries like Denmark and Netherlands, and in a case of Slovakia also Germany.
However, one can complain by discussing the amount of highways in each country. Slovakia with 482 km highways on area of 49,036 km
2 is nowadays similarly equipped by highways’ fast charging points like Germany with 13,009 km highways on area of 357,121 km
2 (
Table 7). Norway with roughly the same amount of highways as Slovakia has 655 fast charging points per 100 km of highway and during the whole considered time horizon the number of fast charging stations along highways was counted in hundreds. Hence, it is worth to discuss the location of Slovak fast charging stations more in detail.
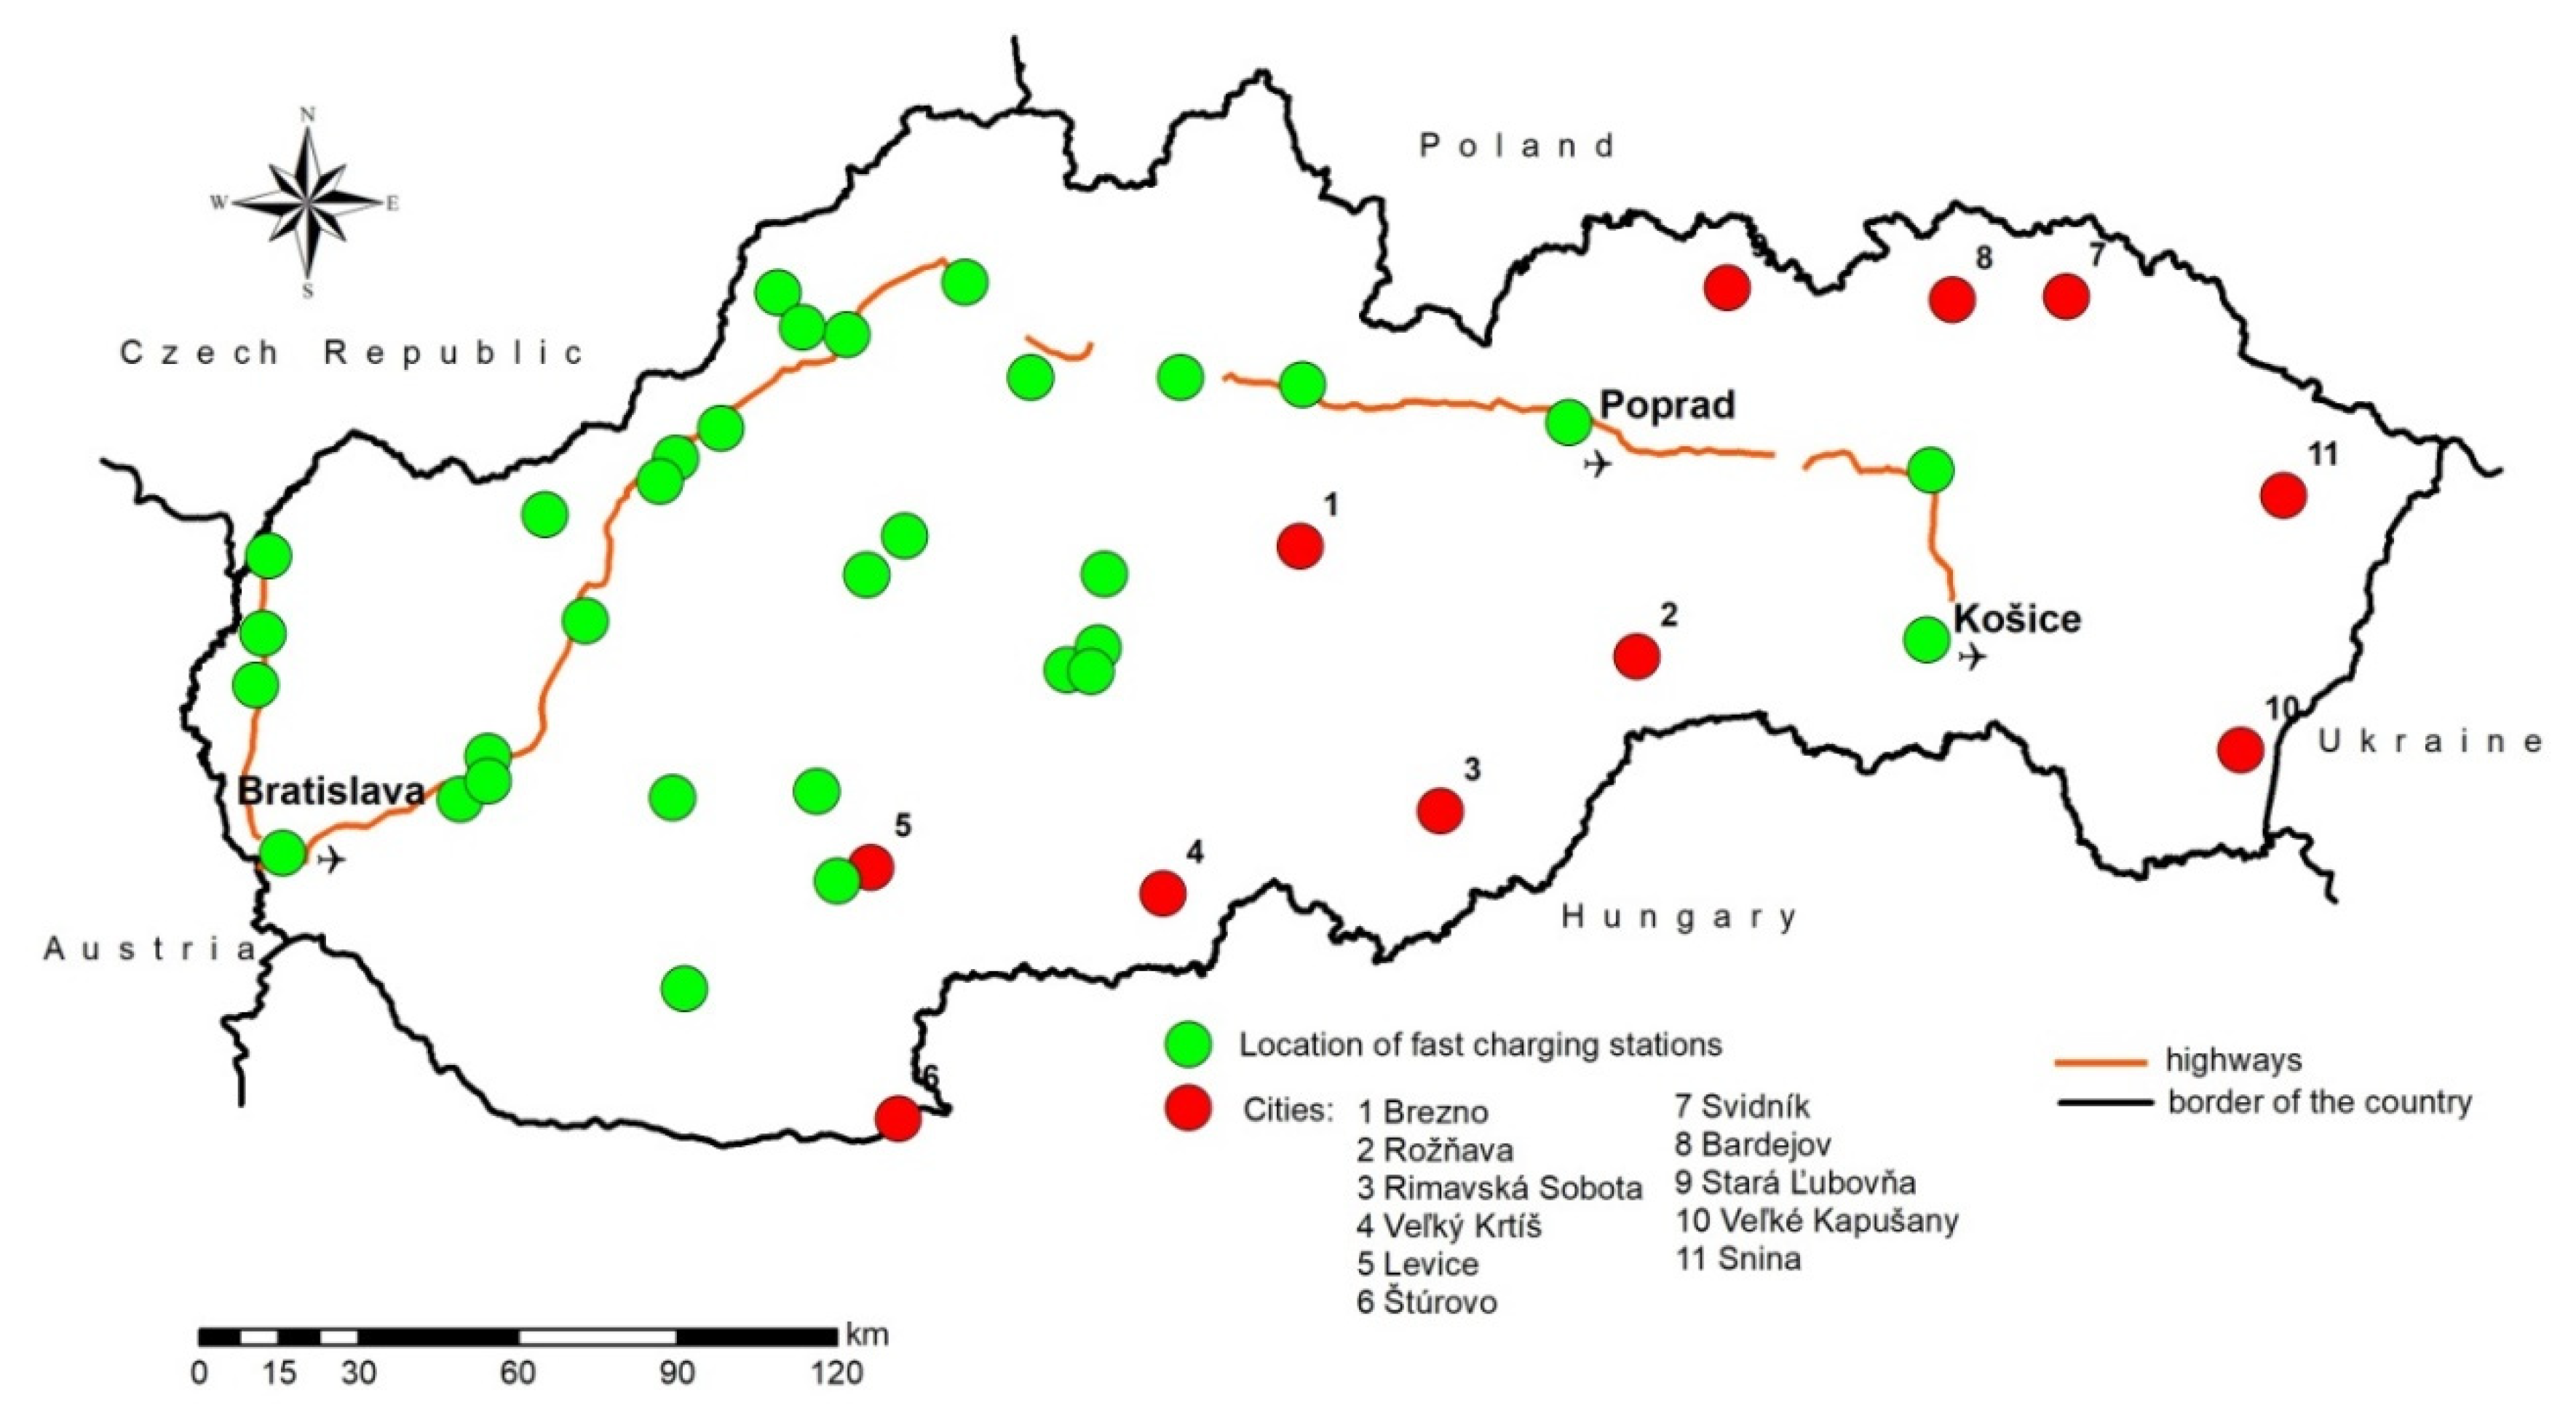
According to statistic referred to middle of 2018 [
53] there were 104 fast charging stations and 347 public charging places of lower power in Slovakia. In the same reference point Norway had 2267 fast charging stations and 8617 public charging places of lower power and Netherlands had 811 fast charging stations and 34,021 public charging points of lower power. Hence, there were 91 vehicles for 1 fast charging station and 19 vehicles for one charging place without differentiation of its power in Norway, and 160 vehicles for 1 fast charging station but only three vehicles for one charging place without differentiation of its power in Netherlands. It is known that Norway and Netherlands are the leading European countries considering the EVs penetration—see
Figure 4, but, within this comparison, Slovakia with 13 vehicles per one public fast charging place and three vehicles per one charging place without differentiation of its power was in some sense in the better position.
The growth of reliable charging infrastructure in big cities, along highways, and country roads is the key stimulus for sustainable traffic development. The position of fast charging stations (usually more than one at each location) in the middle of 2018 is depicted at
Figure 6, which we have created based on the data published in [
53].
One can see that the covering along highways was really good already in 2018. The problem was in the north-east, south-east, and outermost east of the country, what are exactly the areas without highways. It was more than uncomfortable to travel the distance e.g., between Košice and Brezno through Rožňava by affordable BEV of small range that is unable to travel this distance without charging the battery. The even worse situation was in a case of travelling from Košice (the second largest city of Slovakia, city with international airport) to Bratislava (the capital of Slovak Republic, the largest city in Slovakia, city with international airport) by so called southern route via Rožňava, Rimavská Sobota, Veľký Krtíš and Levice. Similar situation was between, let’s say, Štúrovo and Košice, Svidník and Poprad (city with international airport) trough Bardejov and Stará Ľubovňa, or from Veľké Kapušany (through Snina) to Svidník—see
Figure 6. In this case our results correspond to the findings of Daňo and Rehák [
38] that in 2018 point out to the lack of charging stations at some places of the Slovak road network.
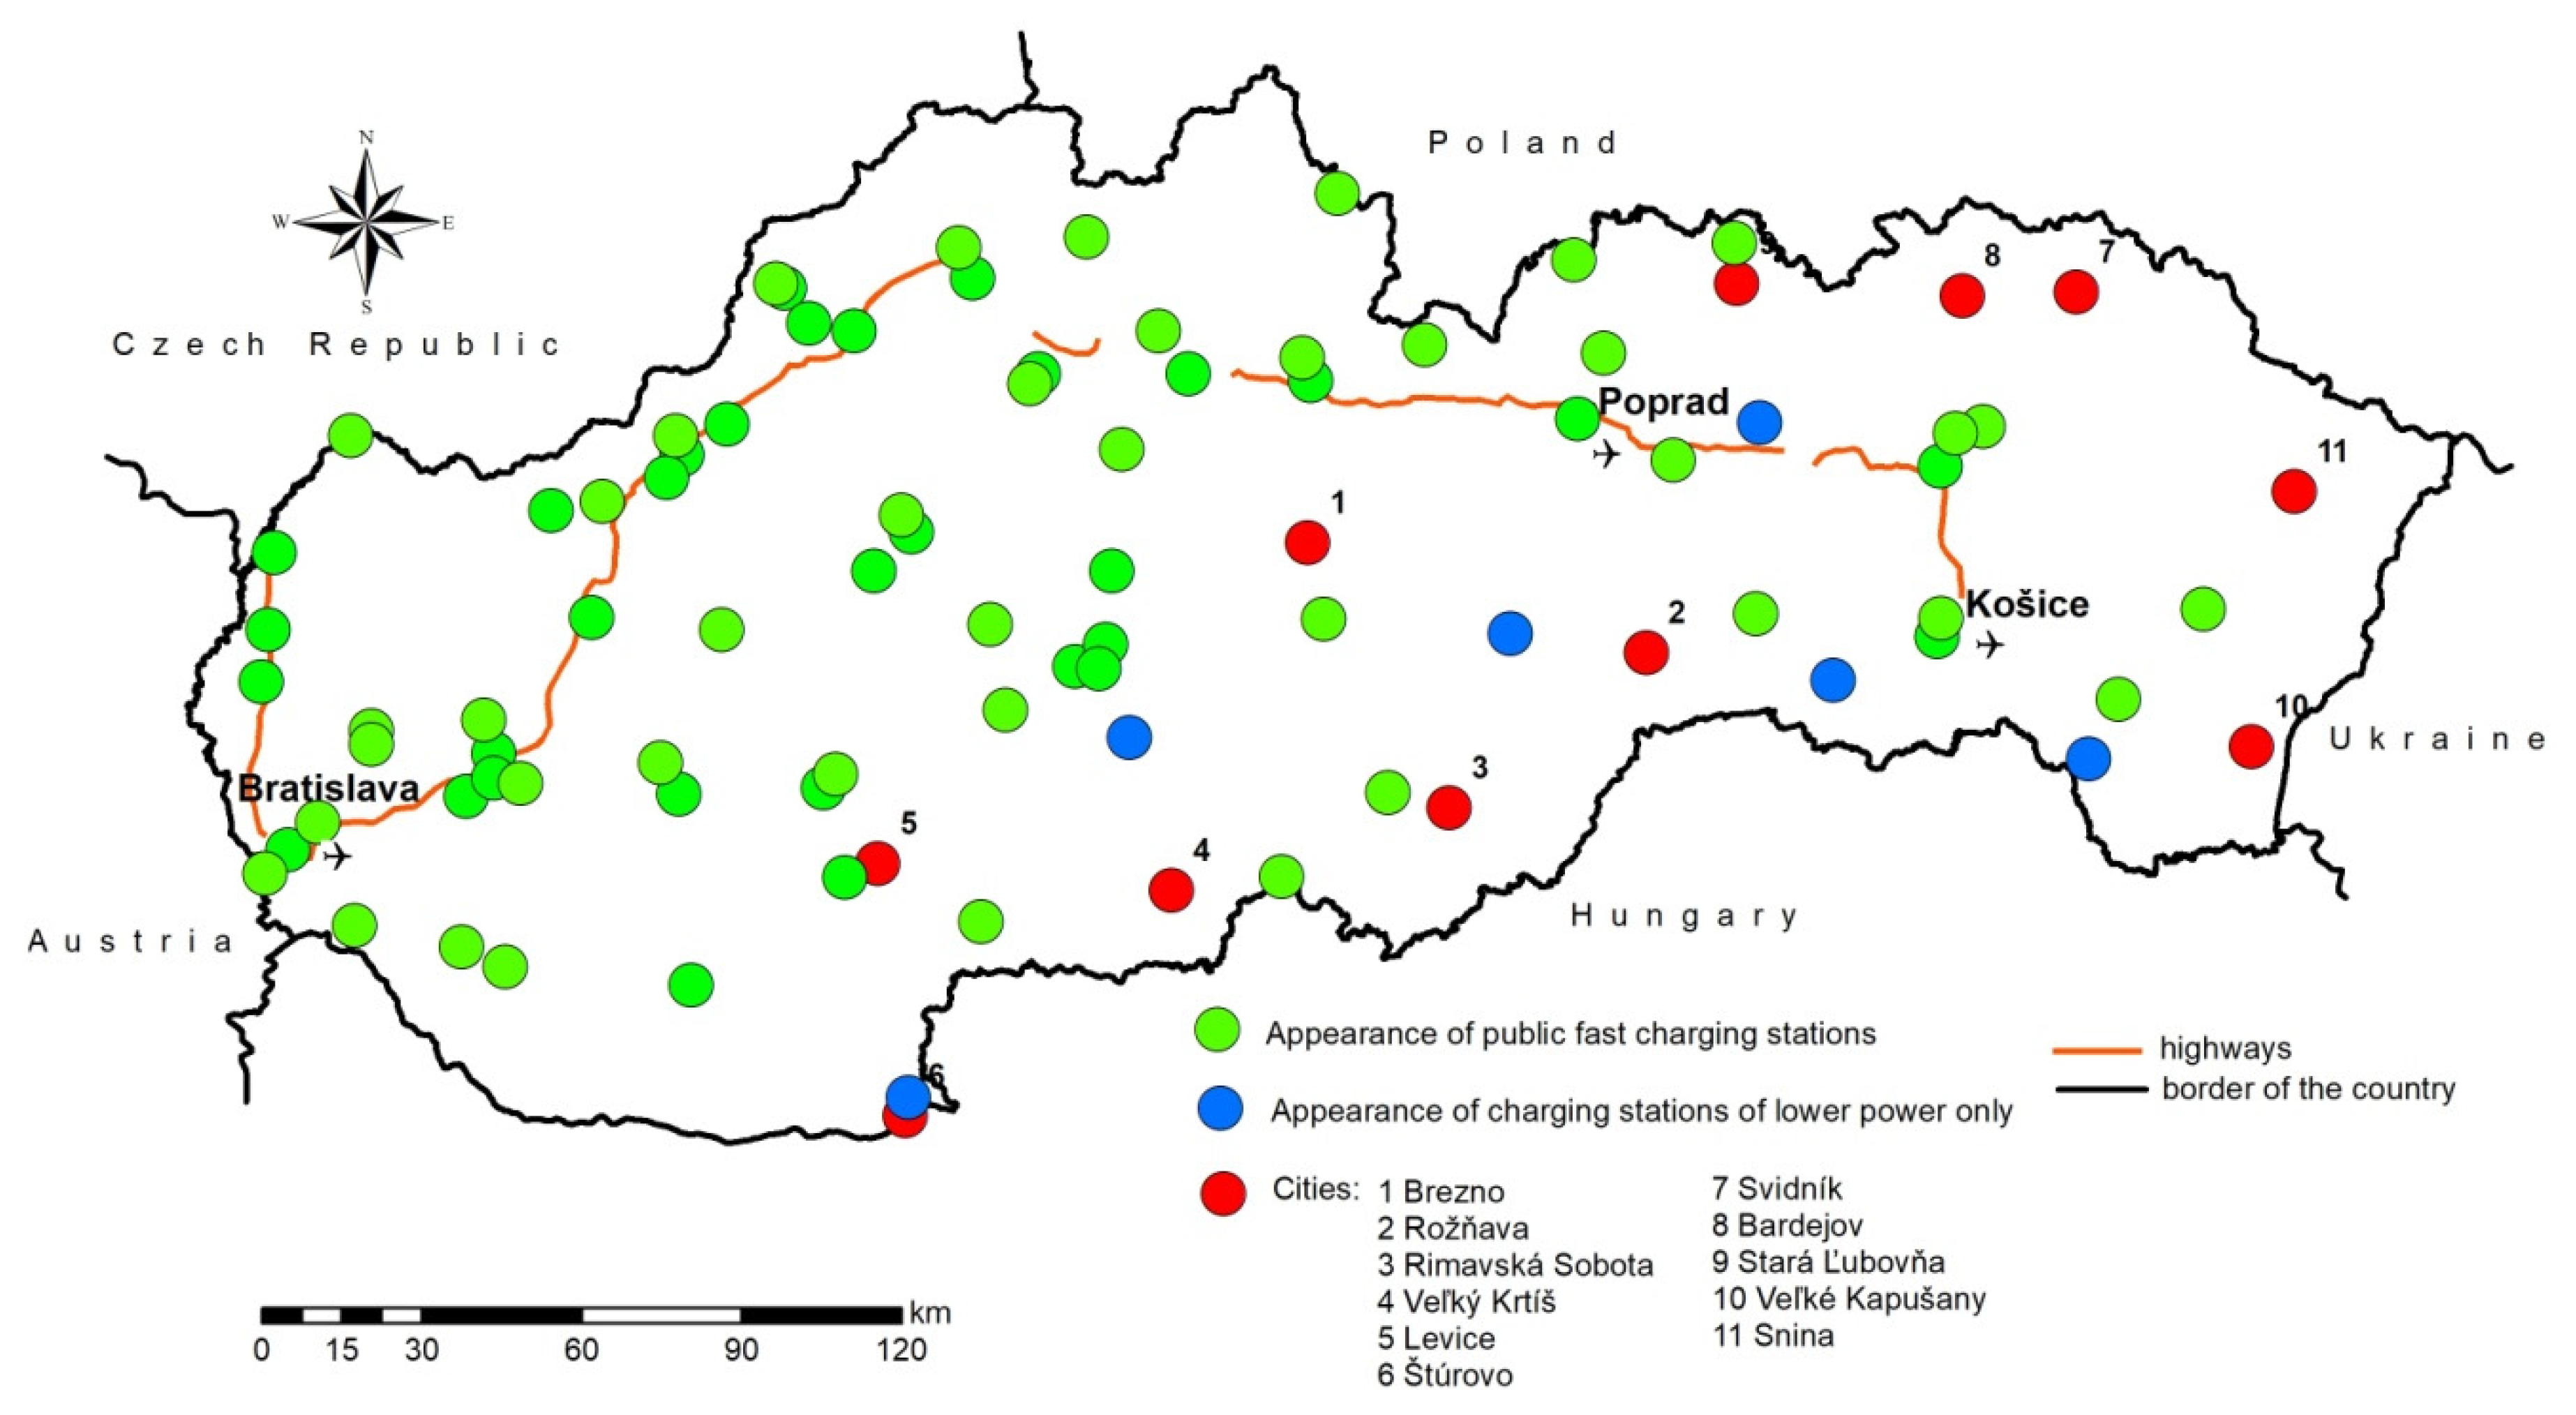
Actual position of the fast charging stations (usually more than one at each place) is depicted at
Figure 7. We have drawn the situation based on the union of data obtained from [
59,
60,
61] in March 2020.
As it is clear from
Figure 7 there is better electromobile infrastructure along Slovak highways in 2020 as it was two years before. Some of the fast charging stations appeared also on those, so called, problematic places. Moreover, for example, in a case of travelling from Košice to Bratislava by southern route, in necessity, one can also use public charging stations of lower power—their position is depicted by blue circles at
Figure 7. That means that Slovakia is fast moving forward country in building electromobile infrastructure. However, the bad situation considering the stage of preparation for electromobility is still in the north-east and outermost east of the country—see the missing green or blue circles nearby e.g., Bardejov, Svidník, Snina or Veľké Kapušany.
At the other side, it has to be noted, that owning public charging stations is a good commercial move for store chains, hotels and restaurants [
62]. Therefore, a lot of them offer their clients the possibility to charge their EVs during resting, shopping, eating or stay. Not all of these charging stations are depicted at
Figure 6 or
Figure 7, as, officially, charging of EV at some of these charging points might be conditioned by utilization of another provider’s service, hence, in this case we are not speaking about public charging stations in the true sense of the word.
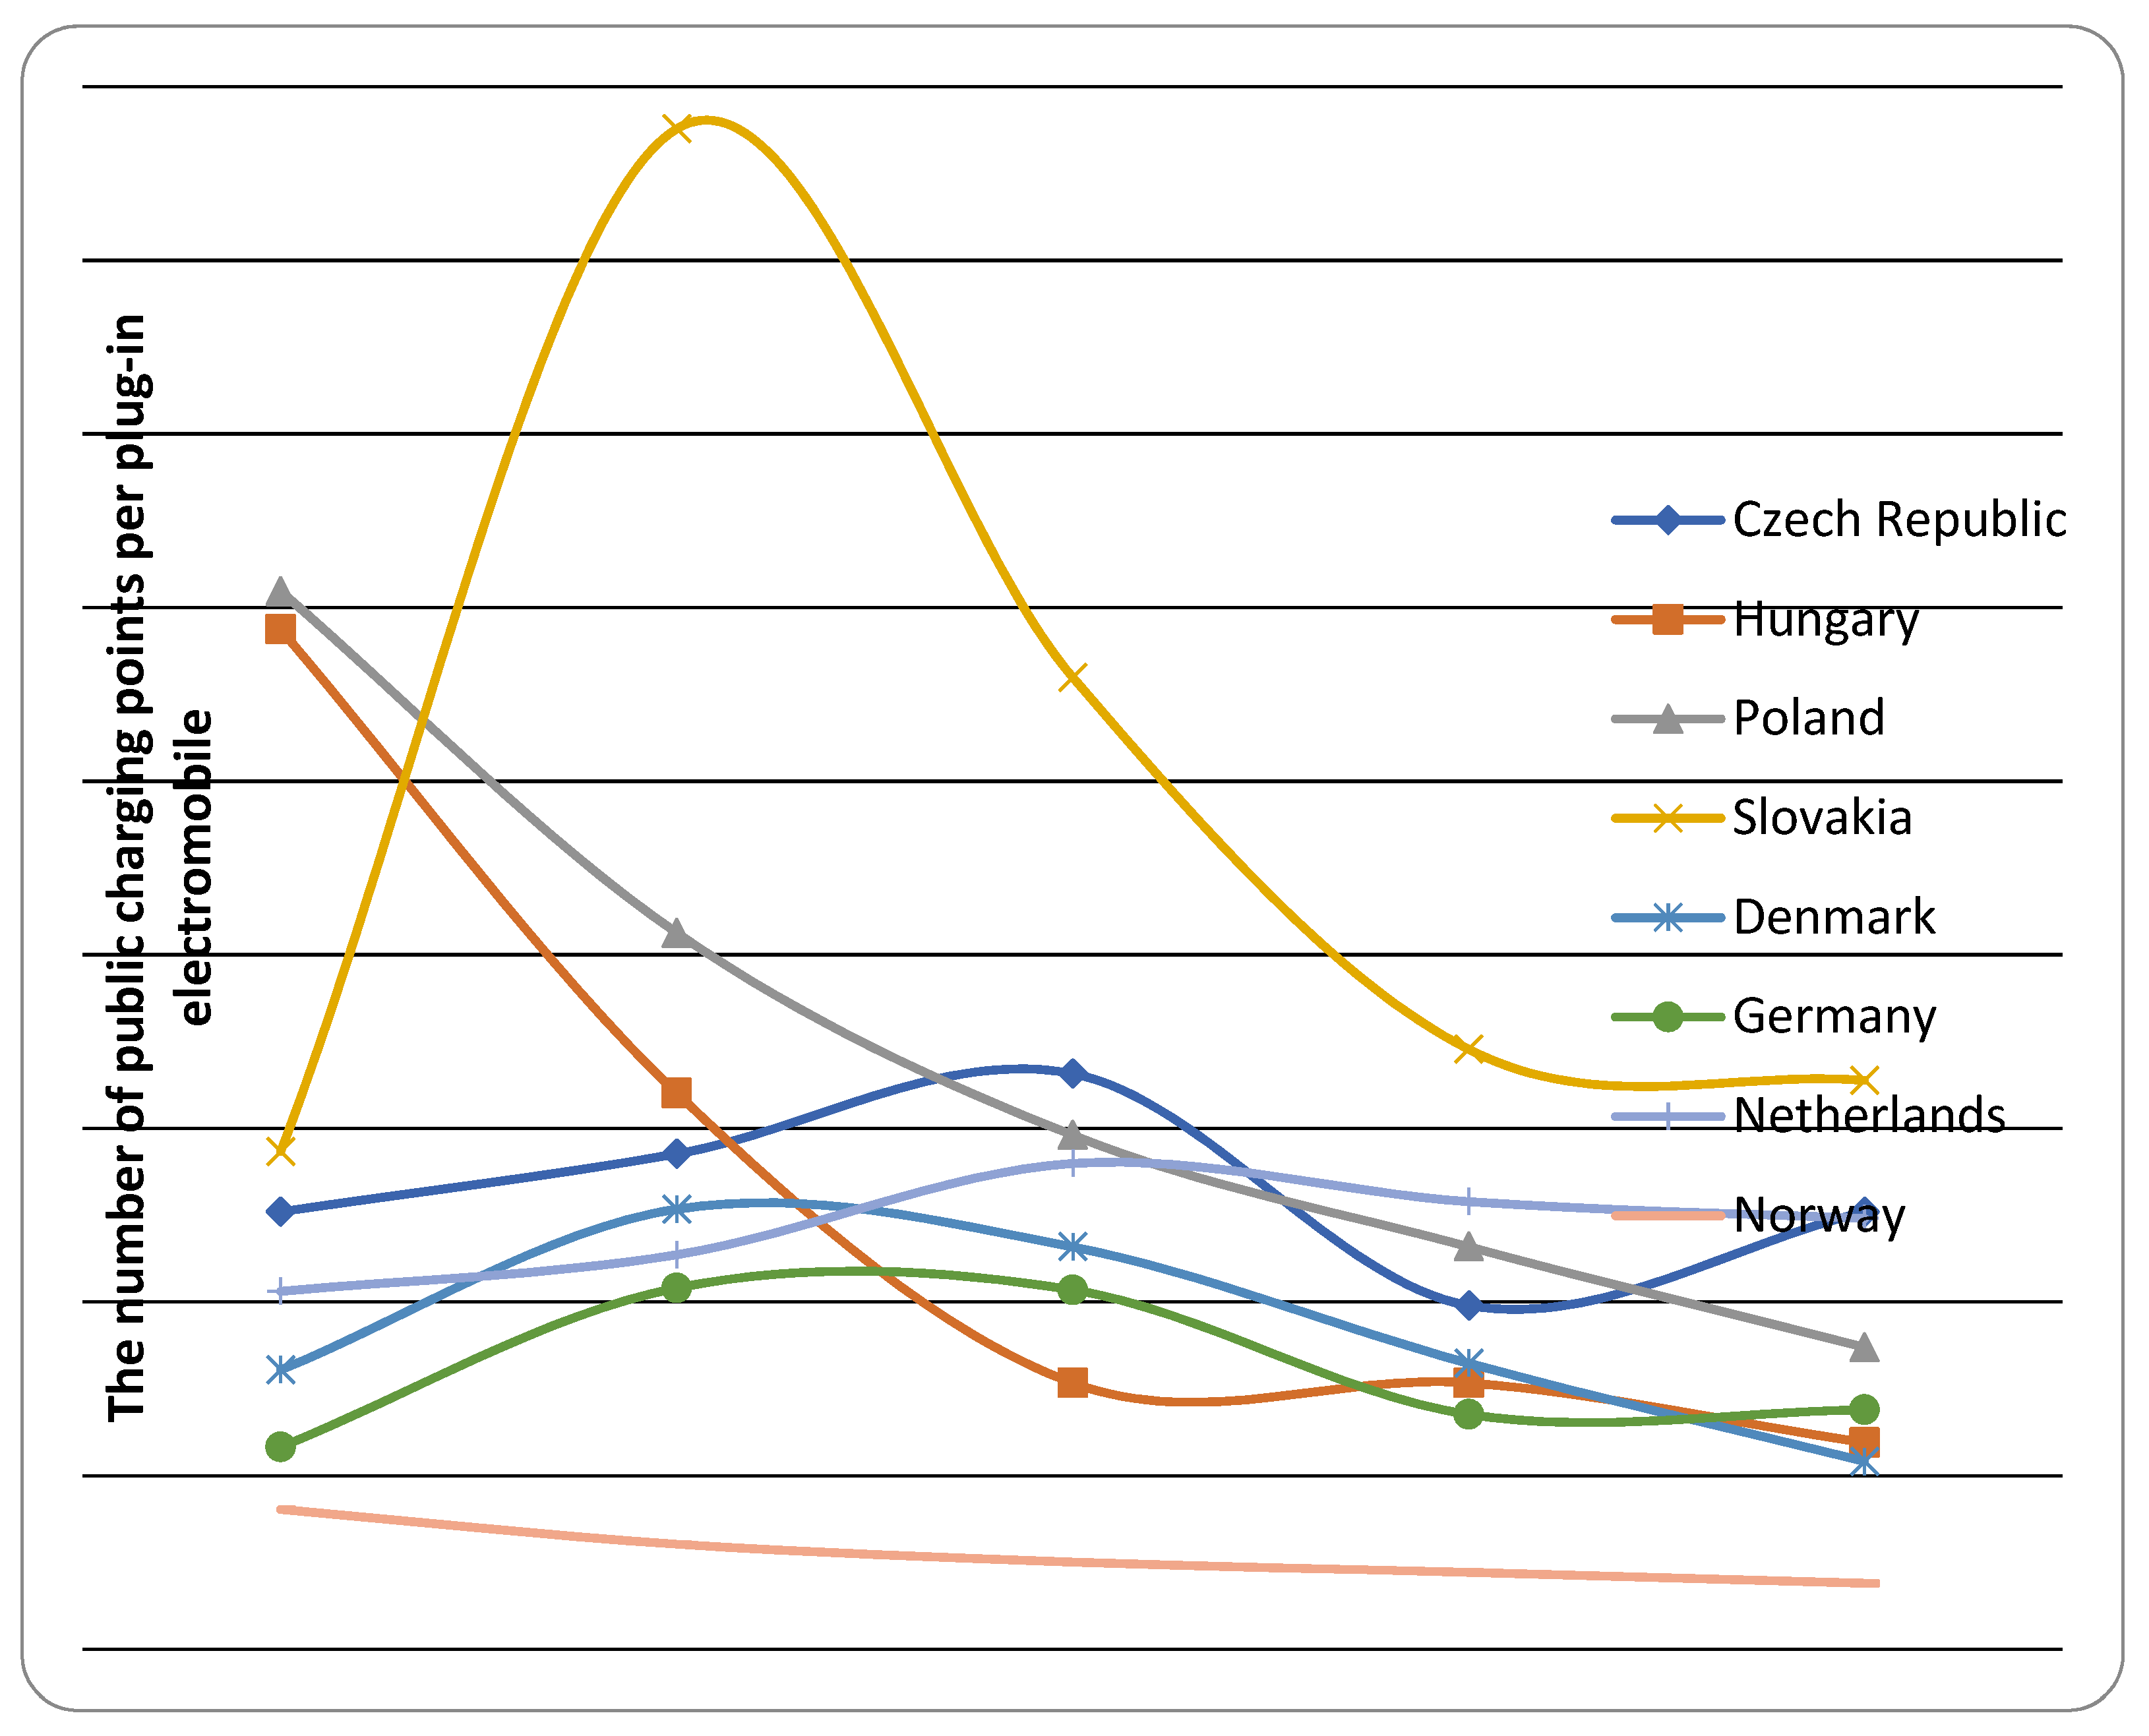
Table 10, which complements
Table 5, shows the rates of public charging stations per BEVs and PHEVs (cumulative) registered in countries and alliances of selection. These data supported by the chart at
Figure 8 (own chart based on obtained data) show that demands on infrastructure grew by number of EVs registered in countries. Therefore, EU is now in the worse situation like V4 countries considering this comparative criterion.
While between 2015 and 2018 there were roughly five vehicles registered in the EU per one public charging point, the share of charging point for one EV is 0.14581 now. At the other side, in average, lesser than five vehicles share one charging point in V4 countries also nowadays and this ratio was more favorable here several years ago.
The values of the infrastructural country electromobility coefficient
K can be found in
Table 11. The wide range of
K’s values reflects the diverse gauge of infrastructural electromobility preparation in the countries of selection. Clearly, countries of Visegrád Group alliance are far beyond the European electromobility leaders such as Netherlands, Denmark or Norway. However, example of Germany, which five years ago had
K’s value roughly double as big as Hungary has today, gives a hope, that with appropriate positive stimuli from the government it is possible to magnify the infrastructural country electromobility coefficient even several hundred times. Germany by multiplying its infrastructural country electromobility coefficient from the turn of the years 2015/2016 by almost 405 times at the turn of the years 2019/2020 overcame the value of infrastructural country electromobility coefficient of Denmark. Among V4 countries the similar trend follows Slovakia which multiplied its infrastructural country electromobility coefficient from the turn of the years 2015/2016 by almost 334 times at the turn of the years 2019/2020. The multiplying constant of other selected countries is in at most decades.
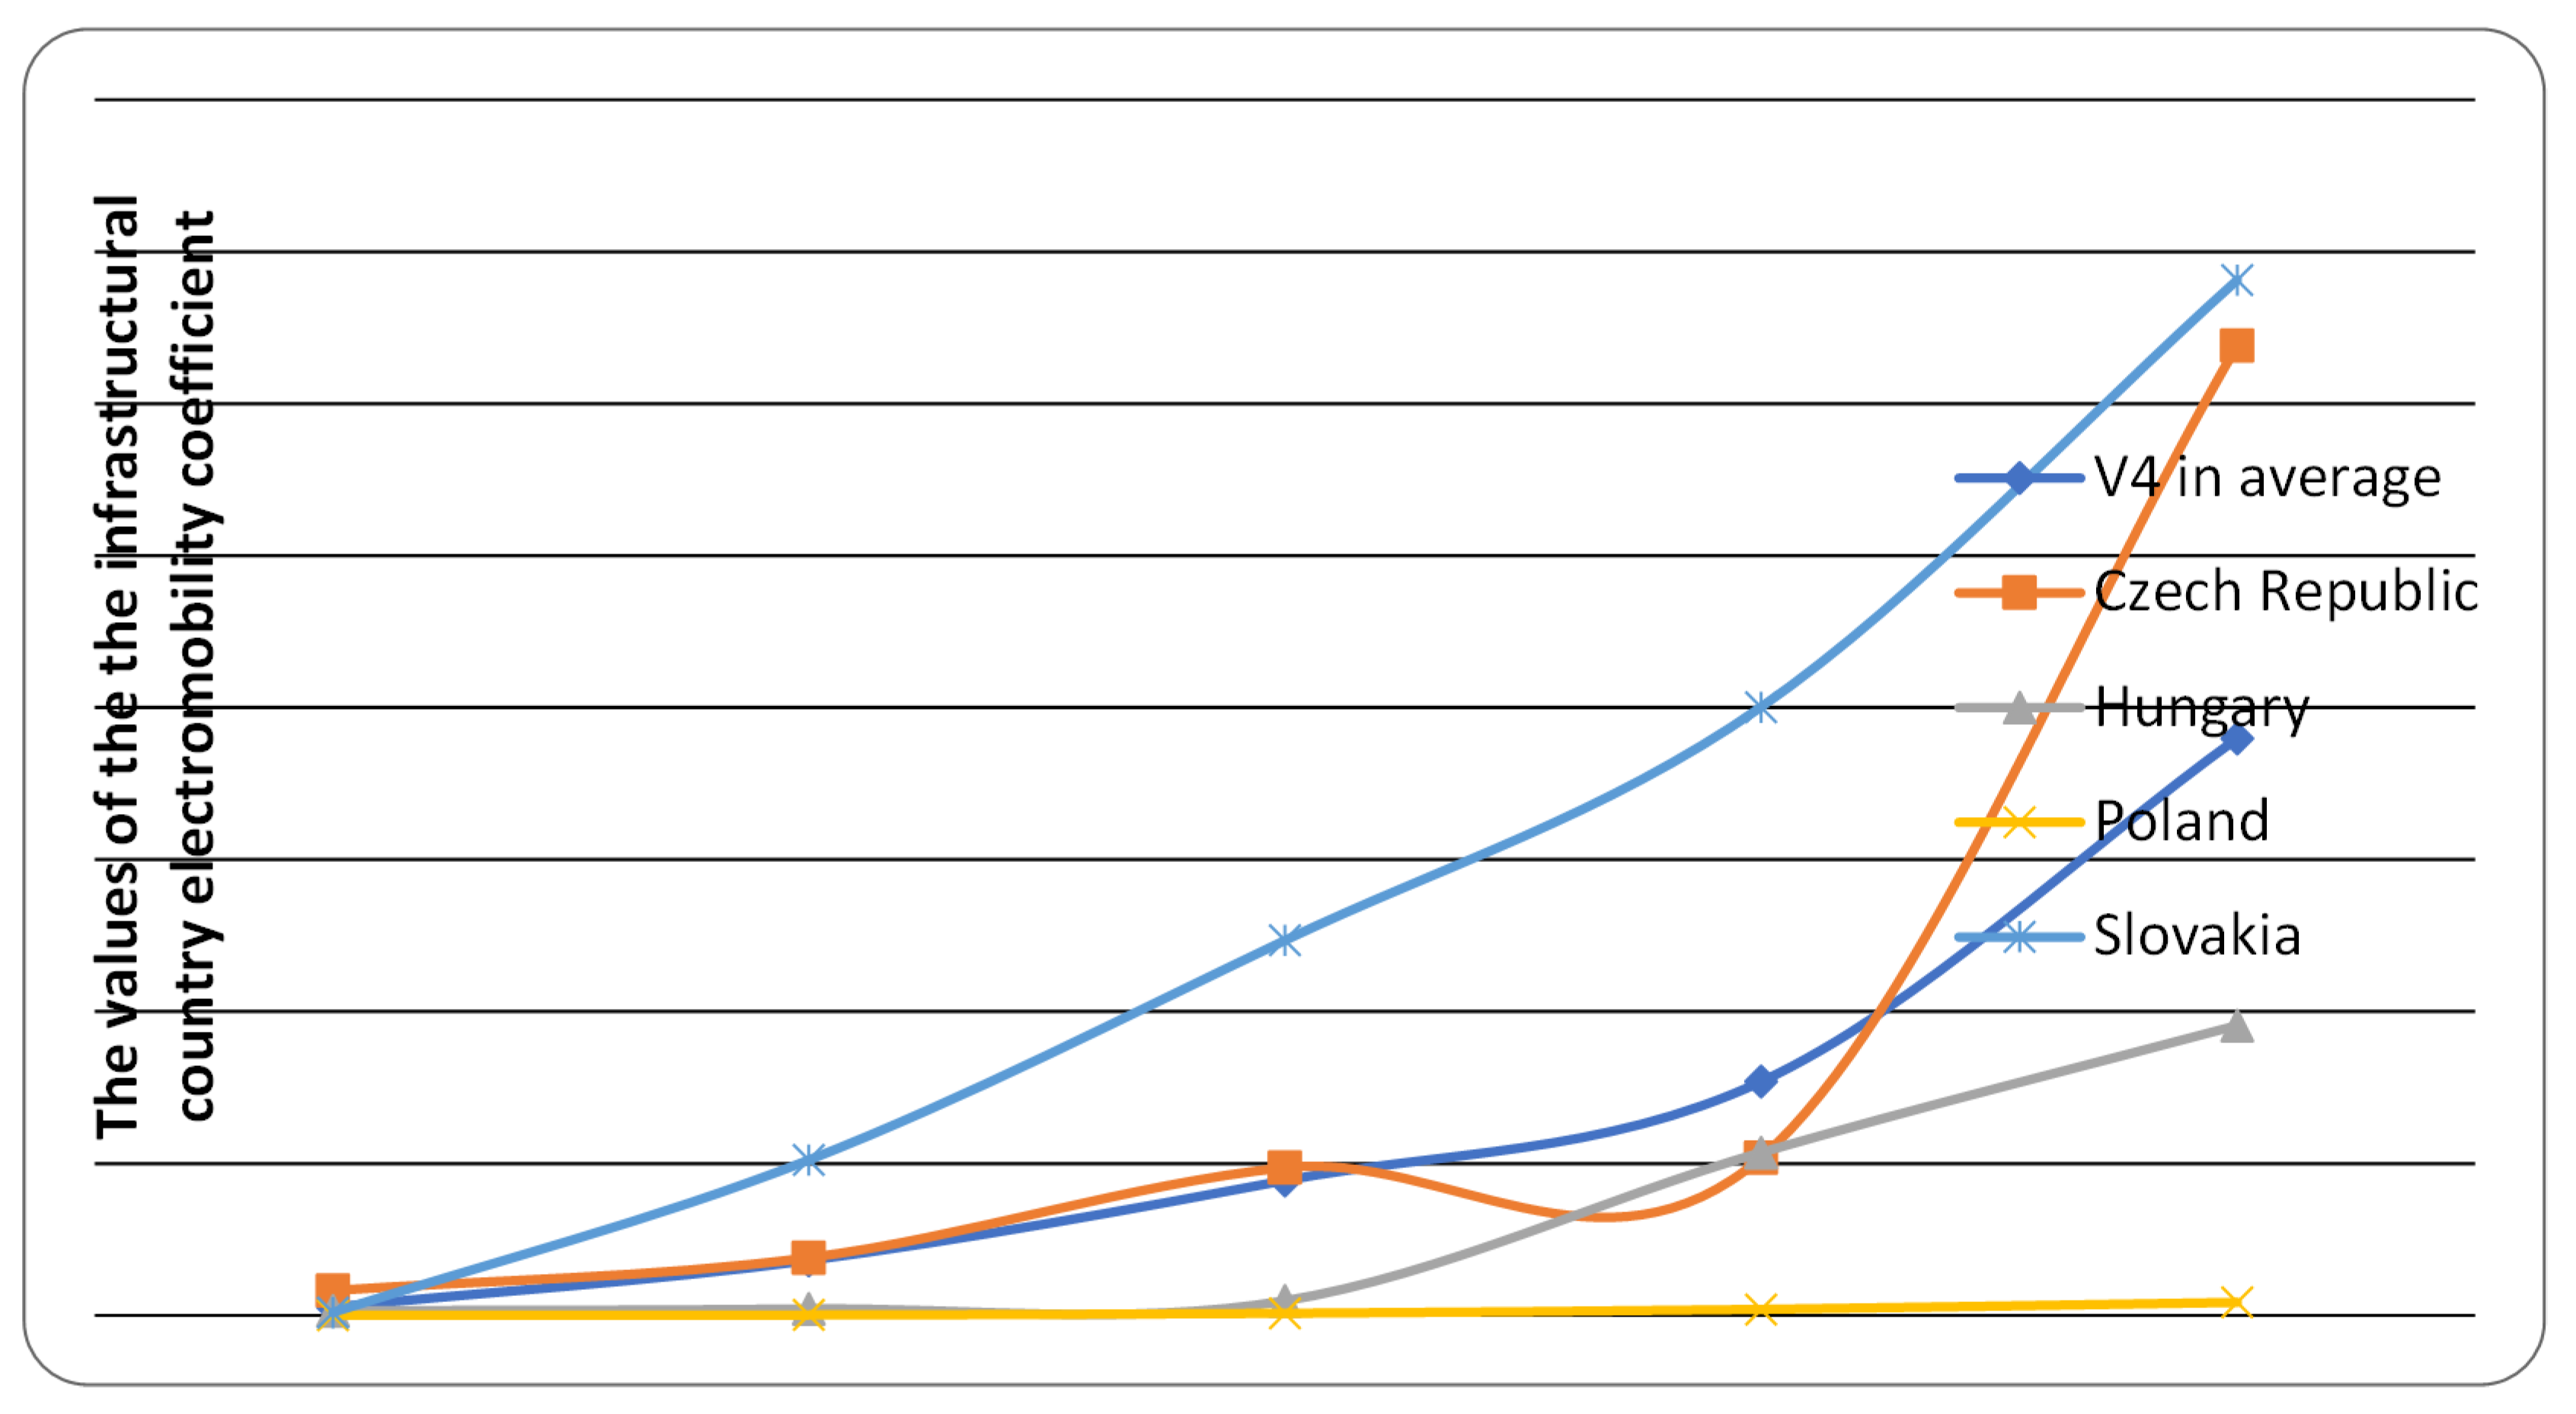
Extreme accession of Slovakia towards electromobility among V4 countries exposes
Figure 9. It is clear from the chart that Slovakia steadily holds the rapid growth of its infrastructural country electromobility coefficient which is far above the V4 average. Only in the last year the infrastructural country electromobility coefficient of Czech Republic jumped up to a similar value as the Slovak one. It can be expected that governments’ benefits towards electromobility development of both countries will secure this trend in the future, as well.
In order to better cross-country comparison of the infrastructural country electromobility coefficient values, the
K’s values can be normalized. For example, it can be done in such a way that the values associated to Netherlands—the country that reach the highest
K’s values within the whole reference time period, will be changed to 100 and the values associated to other countries will be proportionally recalculated so that all the rescaled values of the parameter reduce to fit between 0 and 100. These way normalized values of the infrastructural country electromobility coefficient can be found in
Table 12. Although again we have a wide range of parameter’s values, due to the normalization, the obtained
Kn’s values might be possibly easier evaluated.
Except of Netherlands, only Norway achieved within the whole reference time period the Kn’s values greater than 1. However, the descending sequence of Kn’s values points out to the fact that due to the increased interest of purchasing an electromobile in Norway the growth of electromobile infrastructure was not as satisfactory as in the case of the trendsetter Netherlands. Similar can be observed in the case of Denmark. The contrary to that fact is the ascending tendency of the sequence of normalized K’s values in the case of Germany.
Again, we can observe that considering Kn the V4 countries are far beyond the European electromobility leaders, especially Netherlands. The best position considering the normalized values of the infrastructural country electromobility coefficient within V4 countries belongs to Slovakia, while Poland is in the worst position considering the parameter’s values. However, in the case of both countries the positive is the non-descending tendency in the Kn’s values between the years 2015–2019 (2015–2020 in the case of Poland, respectively). The lesser value of the normalized K’s value associated to Slovakia at the turn of the years 2018/2019 compared to the turn of the years 2019/2020 can be explained by the government’s incentives towards the increase of the EV’s share on Slovak roads and proportionally not the same fast speed of infrastructural growth compared to the trendsetter.
Debating Slovakia, at the beginning of 2020, Slovak government in the first round approved support for the construction of charging stations for 72 towns and municipalities in the Slovak Republic, one third of which is situated in the least developed regions considering electromobile infrastructure. Another 60 charging stations, among which more than one half should be the fast charging stations of 100 kW and remarkable amount of them the ultra-fast charging stations of 350 kW, should be placed in Slovakia by one European charging stations provider until the end of 2020 with the aim of supporting the electromobile infrastructure in least developed regions considering the electromobility [
58]. New charging stations could be expected from the side of other European providers, as well. Government’s steps such as endowments for EVs purchasing will surely lead to the greater amount of EVs in Slovakia. At the beginning of 2020 in the first round Slovak government approved 110 grant applications for purchasing electric vehicles, in the second round another 115 grant applications [
63]. As a result of these and similar government measures the significant growth of the infrastructural country electromobility coefficient of Slovakia can be expected in the forthcoming years.
On the base of our results and the values of the infrastructural country electromobility coefficient, we disagree with Knapčíková, according to who Slovak Republic does not develop sufficiently in electromobility as it lags behind the surrounding countries [
64]. However, we agree with her that owners of electric vehicles have no extra benefits, what is together with missing infrastructure contra-productive considering the motivation towards electromobility. We also hope that the stimuli of the Ministry of Economy of the Slovak Republic in order to support electromobility narrowing to the promotion of the sale of vehicles, favor parking, or forgiveness of road tax and toll roads would lead to the development of electromobility in Slovakia, the lower greenhouse gas emissions, and the reduction of local pollution equal to sample of efficient and environmentally friendly smart cities [
65].
5. Conclusions
In this paper we aimed to find out in which position Visegrád Group countries are compared to EU average and the electromobility leaders of Europe. In order to fulfill our goal, we asked and answered four questions of research. Some of the contributions of the paper can be found in data collection, their processing, analyzing and visualization. As among V4 countries the position of Slovakia has been investigated more in detail, the drawings of the maps showing the development of charging stations in Slovakia help to understand the local trends of recent years, what is added value of the paper. The introduction and computation of the infrastructural country electromobility coefficient and its components help to decide whether the respective country itself is infrastructural prepared for (car) electromobility, what should be helpful, as well. The advantage of parameter’s utilization is in quick cross-country comparisons of its values. The greater values reflect the higher stage of electromobility preparedness from the infrastructural point of view. As the parameter itself is for the given set of countries within a wide interval of values, its normalized values rescaled on 0–100 interval might make the cross-country comparison easier. This is done in the paper, as well.
Regarding the questions
Q1 and
Q2 one can sum up, that all the countries of Visegrád Group alliance only very recently made their first steps and legislative arrangements in order to support electromobility. Therefore, in a lot of discussed indicators they are far away from the European electromobility leaders and even far away from EU average. However, important is that one can see the progress in the matter, what is clearly to be seen from the chart at
Figure 9 depicting the yearly growth of the infrastructural country electromobility coefficient of V4 countries. According to our opinion this parameter is worth for describing the extent to which is particular country prepared for car electromobility from the infrastructural point of view. Assuming the future, one can expect that thanks to the government intentions, the established trend will be preserved also in the forthcoming years. Restrictions connected with the 2020 coronavirus pandemic and the economic crisis after its beat might temporarily affect it. However, as the whole world is changing towards sustainability, lower emissions, waste reduction, renewable sources of energies, and environmentally friendly materials (see e.g., [
66]) one can await that the growth towards electromobility will be kept, as well.
Regarding the questions Q3 and Q4, based on the data obtained, we can sum up that although Slovakia within the referenced time period 2014–2019 had the least total number of registered BEVs + PHEVs and second least number of BEVs + PHEVs per 1000 inhabitants among V4 countries and all the countries of selection, its stage of preparation for electromobility is rather good. Very rapid yearly growth of infrastructure, especially along highways, pushed it with 50 fast charging stations per 100 km of highway to the double as good position as is European Union average. Moreover, by recent values it overtook countries like Denmark, Netherlands and Germany. Debating Slovakia, the problem of missing charging stations is in the north-east and outermost east, and partially in the south-east of the country, although, in average there are only 1–2 EVs per 1 public charging point here. As the number of PHEVs and BEVs grows every year, without reflecting the location, one can say that Slovakia has accurately rapid growth of electromobility infrastructure reverberative its needs. The rate of its moving forward in building electromobile infrastructure and overall preparation for electromobility can be discussed via its infrastructural country electromobility coefficient. Slovakia by multiplying its infrastructural country electromobility coefficient by 334 in the last five years is the fastest forward moving country towards electromobility from the V4 countries and has high potential of reduction of environmental impacts from the transport in the forthcoming years. Similar steep growth of K values is associated with Germany that is nowadays one of the EU electromobility leaders.
Clearly, the utilization of BEVs and PHEVs is possible with certain limits e.g., range, long-distance facilities, sufficient initial capital and similar. Other problems are associated with the production of energy itself. A large part of it is produced by so called “dirty process”, what is not sustainable. In order to support the sale of BEVs and PHEVs, future research should focus on the use of renewable energy sources and “clean energy” production.

 ,
, 


