
Abstract
Self-propelled nozzle is a critical component of the radial jet drilling technology. Its backward orifice structure has a crucial influence on the propulsive force and the drilling performance. To improve the working performance of the nozzle, the numerical simulation model is built and verified by the experimental results of propulsive force. Then the theoretical model of the energy efficiency and energy coefficient of the nozzle is built to reveal the influence of the structural parameters on the jet performance of the nozzle. The results show that the energy efficiency and energy coefficient of the backward orifice increase first and then decrease with the angle increases. The energy coefficient of forward orifice is almost constant with the angle increases. With the increase in the number and diameter, energy efficiency and energy coefficient of the forward orifice gradually decrease, but the backward orifice energy coefficient first increases and then decreases. Finally, it is obtained that the nozzle has better jet performance when the angle of backward orifice is 30°, the number of backward orifice is 6, and the value range of diameter is 2–2.2 mm. This study provides a reference for the design of efficiently self-propelled nozzle for radial jet drilling technology.
1 Introduction
The exploration study showed that the low-quality oil and gas resources take a higher proportion than the high-quality oil and gas resource in the world (Masters 1979). The high-quality oil and gas resource had already can’t meet the world demand with it reduces. Meanwhile, the low-quality oil and gas resource can’t compensate the world demand because its exploitation efficiency is very low. According to statistics of single well, the oil and gas production significantly reduce each year in the natural state, and its peak decrease rate could reach 60% (Love et al. 2001). How to improve the exploitation efficiency of low-quality oil and gas resource is an urgent problem now. Radial jet drilling technology using high-pressure jet to break rock in the oil and gas layer is low-cost, high efficiency and environmentally friendly. It had been proved that the radial jet drilling technology is an effective method for exploiting the low-quality oil and gas resource (Sun 2005; Dickinson et al. 1989; Abdel-Ghany et al. 2011).
As a core component in the radial jet drilling system, the self-propelled nozzle is a key factor influencing the oil and gas exploitation efficiency. Previous studies indicate that the oil and gas exploitation efficiency increases with the increase in the radial-hole length for a constant radial-hole diameter (Liu 2012; Chi et al. 2013). Moreover, the radial-hole length is affected mainly by the jet performance of the nozzle. Moreover, the jet performance depends on the nozzle structure. Therefore, it is necessary to research the effects of the nozzle structures on the jet performance. Many scholars have analyzed the influence of the nozzle structure on the jet performance of the nozzle. For example, (Mo and Wang 2015) revealed that the carrying efficiency and working life of a nozzle with six backward orifices increase with the numerical simulation method. Chen et al. (Chen et al. 2015) indicated that the rock-breaking depth increases with increasing nozzle diameter with the numerical simulation method. Buset et al. analyzed the rock-breaking mechanism and the self-propelling ability of the nozzle. The self-propelled mechanism, propulsive force and rock-breaking force of the nozzle were studied with numerical simulation (Buset et al. 2001; Wang et al. 2013; Chi et al. 2015, 2016; Li et al. 2015; Bi et al. 2016; Zhou 2017; Bi and He 2018). However, two important factors were ignored in these analyses: the impact force on the inner and outer wall of the nozzle induced by the high-pressure jet, and the cavitation effect when the propulsive force was calculated. Meanwhile, there are limited studies on the energy efficiency of the nozzle.
To obtain more reliable results and greater efficiency nozzle, these factors are considered comprehensively in this study. This study involves two parts: the calculation model of the radial-hole length is established; and then the energy efficiency and the jet performance of the self-propelled nozzle are studied by CFD. This research is important to improve the exploitation efficiency of low permeable oil and gas resources in shallow sea.
2 Theoretical analyses
2.1 Nozzle geometry
The self-propelled nozzle can be divided into two parts: the forward orifice and the backward orifice, as shown in Fig. 1. The propulsive force generated by the backward jet can pull the high-pressure hose forward, and thereby determine the radial-hole length. The rock-breaking force generated by the frontward jet determines the drilling capacity of the nozzle. The main structure parameters of the nozzle are shown in Table 1.

Self-propelled nozzle structure
2.2 Mechanical analyses
The jet performance of the self-propelled nozzle mainly includes the energy efficiency, energy coefficient of orifice, propulsive force, rock-breaking force and the cavitation. The energy efficiency is a measure of the ability to convert the input energy into propulsion energy and rock-breaking energy. The propulsive force includes the recoil force generated by the high-pressure jet, the impact on the internal and external wall of the nozzle produced by the high-pressure jet and the friction force. It is a driving force that pulls the nozzle and high-pressure hose. As the high-pressure hose length increases, the friction force increases, causing the propulsive force to decrease. The radial-hole length is at a maximum when the propulsive force equals zero. Moreover, the rock-breaking force is usually used to measure the rock-breaking effect. According to Newton’s third law, the rock-breaking force equals the recoil force generated by the forward jet. The cavitation has a significant effect on the discharge coefficient and the flow resistance of the nozzle (He et al. 2013).
As shown in Fig. 2, there are four forces on the self-propelled nozzle and high-pressure hose in the radial hole: the propulsive force induced by the high-pressure jet of the backward orifices, the friction force on the high-pressure hose generated by the high-pressure hose moving in the radial hole, the viscous force on the high-pressure hose due to water flowing in the annulus between the radial hole and high-pressure hose, and the diverter resistance force caused by the high-pressure hose moving in the diverter. The mechanical equilibrium equation is established as:
where Fj is the propulsive force, N; f is the friction force, N; Ff is the viscous force, N; FT is the diverter resistance force, N; mn is the nozzle quality, kg; and an is the accelerated velocity, m/s2. The propulsive force can be expressed as:
where Fp is the recoil force generated by the forward jet, N; Fr is the recoil force generated by the backward jets, N; Fw is the impact on the internal and external wall of the nozzle, N. Because \(F\Delta t = mv_{1} - mv_{2}\), \({m \mathord{\left/ {\vphantom {m {\Delta t}}} \right. \kern-0pt} {\Delta t}} = \rho q\), according to the continuity equation and Newton’s third law, the axial recoil force can be expressed as (Wei et al. 2007):
where F is the axial recoil force, N; ρ is the liquid density, kg/m3; S is the cross-sectional area of the orifice, m2; α is the angle between the axis of the backward orifice and the nozzle, °; and, q′ is the flow of backward orifice, m3/s; v′ is the average velocity, m/s; v is the axial average velocity of the cross-sectional area of backward orifice, m/s. According to Eq. (3), the sum of the axial recoil force can be expressed as:
where v1 is the forward jet velocity, m/s; v2 is the backward jet velocity, m/s; S1 is the cross-sectional area of the forward orifice, m2; and S2 is the cross-sectional area of the backward orifice, m2. The friction force can be expressed as:
where ρh is the line density of the high-pressure hose, kg/m; dh is the inner diameter of the high-pressure hose, m; Lh is the length of the high-pressure hose, m; and μf is the friction coefficient. The center axis of the high-pressure hose is supposed to parallel to the center axis of the radial hole. The length of the high-pressure hose can be considered equals the radial-hole length at this point. The expression of the radial-hole length is determined by substituting Eq. (2), (4) and (5) into Eq. (1).

Force analysis of the high-pressure hose and the nozzle
The accelerated velocity equals zero when the radial-hole length reaches the maximum value. Meanwhile, the viscous force and the diverter resistance force become fixed values, denoted A and B, respectively; the maximum radial-hole length can be expressed as:
Equation (7) indicates that the propulsive force is proportional to the maximum length of the radial hole. Thus, the change rule of the propulsive force is the same as the maximum length of the radial hole. If the diameter of the forward orifice is fixed, the structure parameters of the backward orifice are the main factors affecting the radial-hole length. Therefore, improving the structure of the backward orifice is the key to increasing the radial-hole length and finally enhancing the exploitation efficiency of oil and gas.
The input energy can be transformed to the propulsive energy, rock-breaking energy and the internal turbulence kinetic energy in the nozzle. To ensure good rock-breaking effect and drilling length, the nozzle should follow the principle that the rock-breaking energy and propulsive energy are all large simultaneously. Based on the energy conservation principle, the larger the forward jet energy, the smaller the backward jet energy. Owing to the greater influence of the backward orifice structure on the backward jet energy, improving the structure of the backward orifice can contribute to the distribution of the input energy to the forward and backward orifice properly, and further enhance the jet performance of the nozzle. The energy efficiency is defined as the ratio of the sum of the orifice jet energy and the input energy. It can be expressed as:
where η is the energy efficiency, %; Pi is the inlet pressure, Pa; di is the inlet diameter, m; and vi is the inlet velocity, m/s. To analyze the change law of the energy of the forward and backward jets, the energy coefficients of the forward and backward orifices are defined as follows:
where C1 is the energy coefficient of the forward orifice; and C2 is the energy coefficient of the backward orifice. It is obvious that the greater the energy coefficient, the larger the jet energy.
3 Numerical model
Only the single-phase is used to calculate the self-propelled nozzle jet model in the past, which didn’t consider the coupling effect of gas phase. However, the cavitation effect has an important influence on the results of the numerical simulation. The calculation model is more consistent with the actual working conditions when the multiphase flow model is used. The realizable \(k - \varepsilon\) turbulence model combined with the mixture model is used in the simulation (Xiao et al. 2007; Su et al. 2009), which has been well validated by experimental results.
3.1 Governing equations
The realizable \(k - \varepsilon\) turbulence model is used to solve the Navier–Stokes equations coupling with a mass transfer cavitation model in the numerical simulation. The main features of the solver are given below.
-
(1)
Physical cavitation model
The cavitation model used in this study is developed by Schnerr and Sauer (2001). The cavitation process is governed by the following mass transfer equation:
$$\frac{{\partial \left( {\rho_{v} \alpha_{v} } \right)}}{\partial t} + \frac{{\partial \left( {\rho_{v} \alpha_{v} u_{j} } \right)}}{{\partial x_{j} }} = \dot{m}^{ + } - \dot{m}^{ - }$$(10)where αv is the vapor volume fraction; ρv is the vapor density, kg/m3. uj is the velocity component in the j direction, m/s. The source terms \(\dot{m}^{ + }\) and \(\dot{m}^{ - }\) represents the effect of evaporation and condensation during the phase change. They are derived from the bubble dynamics equation for the generalized Rayleigh–Plesset equation and defined as:
$$\dot{m}^{ + } = \frac{{\rho_{v} \rho_{l} }}{\rho }\alpha_{v} \left( {1 - \alpha_{v} } \right)\frac{3}{{R_{b} }}\sqrt {\frac{2}{3}\frac{{\hbox{max} \left( {p_{v} - p,0} \right)}}{{\rho_{l} }}}$$(11)$$\dot{m}^{ - } = \frac{{\rho_{v} \rho_{l} }}{\rho }\alpha_{v} \left( {1 - \alpha_{v} } \right)\frac{3}{{R_{b} }}\sqrt {\frac{2}{3}\frac{{\hbox{max} \left( {p - p_{v} ,0} \right)}}{{\rho_{l} }}}$$(12)where ρl is the liquid density, kg/m3; ρ is the mixture density, kg/m3; pv is vapor pressure, Pa; p is the mixture pressure, Pa. The bubble radius is related to the vapor volume fraction. Nb is the bubble number density, and its expression as:
$$R_{b} = \left( {\frac{{\alpha_{v} }}{{1 - \alpha_{v} }}\frac{3}{4\uppi }\frac{1}{{N_{b} }}} \right)^{{{\raise0.7ex\hbox{$1$} \!\mathord{\left/ {\vphantom {1 3}}\right.\kern-0pt} \!\lower0.7ex\hbox{$3$}}}}$$(13)This cavitation model has been validated for many cases, such as cavitation flow around a 2D hydrofoil and a 3D hydrofoil (Li et al. 2001).
-
(2)
The homogeneous equilibrium model (HEM) is used to analyze cavitation flow in this paper (Schmidt and Corradini 2001; He et al. 2013; Salvador et al. 2010; Tahmasebi et al. 2017). The gas–liquid two-phase fluid can be considered as a mixing homogeneous and variable density single-phase fluid in the HEM. The mixture density and the mixture dynamic viscosity are defined as follows:
$$\rho = \alpha_{l} \rho_{l} + \alpha_{v} \rho_{v}$$(14)$$\mu = \alpha_{l} \mu_{l} + \alpha_{v} \mu_{v}$$(15)where αl is the volume fraction of liquid, μ is the mixture dynamic viscosity, Pa·s; μl and μv are liquid dynamic viscosity and vapor dynamic viscosity, Pa·s. For a control volume, the value of αl and αv can get in the range of 0 to 1. And the sum of αl and αv is 1. There is no cavitation phenomenon when αl equals to 1. There is completely cavitation phenomenon when αl equals to 0.
Under the precondition of isothermal homogeneous flow, the compressibility of liquid and vapor are small in the cavitation flow and they can be considered as incompressible fluid. Based on the above assumptions, the control equations of the two-phase turbulent flow in the nozzle are as follows:
The continuity equation
$$\frac{\partial \rho }{\partial t} + \nabla \left( {\rho {\text{v}}} \right) = 0$$(16)The momentum equation
$$\begin{aligned} \frac{{\partial (\rho {\text{v}})}}{\partial t} + \nabla \left( {\rho {\text{v}}} \right) &= - \nabla p \\ &\quad + \nabla \left[ {\mu \left( {\nabla {\text{v}} + \nabla {\text{v}}^{\varGamma } } \right)} \right] + \rho g + F_{x} \\ \end{aligned}$$(17)The \(k - \varepsilon\) equations
$$\frac{\partial }{\partial t}\left( {\rho k} \right) + \nabla \left( {\rho {\text{v}}k} \right) = \nabla \left( {\frac{{\mu_{t} }}{{\sigma_{k} }}\nabla k} \right) + G_{k} - \rho \varepsilon$$(18)$$\begin{aligned} \frac{\partial }{\partial t}\left( {\rho \varepsilon } \right) + \nabla \left( {\rho {\text{v}}\varepsilon } \right) &= \nabla \left( {\frac{{\mu_{t} }}{{\sigma_{\varepsilon } }}\nabla \varepsilon } \right) \\ &\quad + \frac{\varepsilon }{k}\left( {C_{1\varepsilon } G_{k} - C_{2\varepsilon } \rho \varepsilon } \right) \\ \end{aligned}$$(19)$$\mu_{t} = \rho C_{\mu } \frac{{k^{2} }}{\varepsilon }$$(20)$$G_{k} = \eta_{t} \nabla {\text{v}}\left[ {\nabla {\text{v}} + \left( {\nabla {\text{v}}} \right)^{\varGamma } } \right]$$(21)The logarithmic law conditions for the wall boundaries
$$u^{ + } = \frac{u}{{u_{\tau } }} = \frac{1}{k}\ln \left( {\frac{{yu_{\tau } }}{\text{v}}} \right) = \frac{1}{k}\ln \left( {y^{ + } } \right) + B$$(22)$$k = \frac{{\left( {u^{*} } \right)}}{{\left( {C_{t} } \right)^{{{\raise0.7ex\hbox{$1$} \!\mathord{\left/ {\vphantom {1 2}}\right.\kern-0pt} \!\lower0.7ex\hbox{$2$}}}} }},\varepsilon = \frac{{\left( {u^{*} } \right)^{3} }}{ky}$$(23)where v is the velocity vector, m/s; g is the acceleration of gravity, m/s2; Fx is the body force, N; k is the turbulence kinetic energy, m2/s2;\(\varepsilon\) is the dissipation rate, m2/s3; u+ is the velocity component tangential to the wall, m/s; μt is the friction velocity constructed from the wall stress, m/s; y+ is the dimensionless distance from the wall surface; Gk is the mean velocity gradients; B, Cμ, C1ε and C2ε are turbulent model constant, the values of them are 5.44, 0.09, 1.44 and 1.92. σk and σε are the Prandtl number, the values of them are 1.0 and 1.3.
3.2 Simulation step and mesh
-
1.
Material properties and boundary step
As shown in Fig. 3, the structure of the self-propelled nozzle has been made reasonable simplification. The connection thread of the nozzle is neglected; the annulus between the horizontal hole and high-pressure hose is extended to eliminate the circumfluence influence. Finally, the size of calculation model is ensured that the jet distance is 10 mm, the annulus is extended 20 mm and the radial-hole diameter is 30 mm. The material properties and boundary conditions are listed in Table 2 and Table 3.
Fig. 3 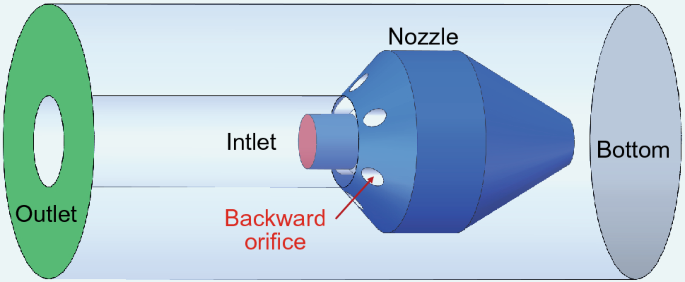
Boundary conditions
Table 2 Material properties Table 3 Initial boundary -
2.
Solution methods
With regard to discretization, the governing equations are treated by the following method (Ji et al. 2015). The pressure–velocity direct coupling method is used to solve the flow in this calculation. The momentum equations and turbulent kinetic equations are discretized by a first-order upwind scheme. The first-order upwind scheme is used for the discretization of the convection terms of the turbulence parameters due to stability reasons. Quick scheme is used for the vapor mass fraction transport equation. The pressure staggering option (PRESTO) is adopted for the vapor mass fraction transport equation. The analysis schemes are shown in Table 4. Fluent CFD software is used in the following analysis.
Table 4 Analysis scheme -
3.
Mesh description
The meshing importantly affects the calculation results of turbulence model. Compared with tetrahedral mesh, the hexahedral grid has less number and higher computational efficiency. So the hexahedral grid is used in this calculation model. In the calculation model, the scheme 1 of the nozzle is used to analyze the grid independence. Meanwhile, the inlet pressure and the outlet pressure are 50 MPa and 10 MPa. The calculation domain and the mesh details are shown in Fig. 4. Therefore, a mesh independency test is carried out to verify the proper mesh by using three different meshes. The properties of the meshes are shown in Table 5. From the results shown in Table 5, it is indicated that the difference between the medium and fine resolution meshes can be neglected. So the case 2 is used in the following analysis.
Fig. 4 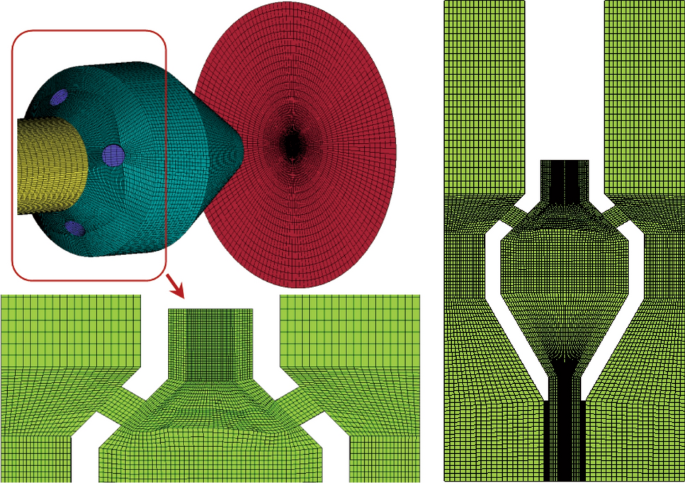
Mesh of nozzle
Table 5 Results of the mesh independence test -
4.
Model validation
To validate the simulation model, the measurement experiment system of the propulsive force. A schematic of the experimental facilities and the measurement experiment system are shown in Fig. 5. The calculation model can be validated by comparing the calculation results with the measured values.
Fig. 5 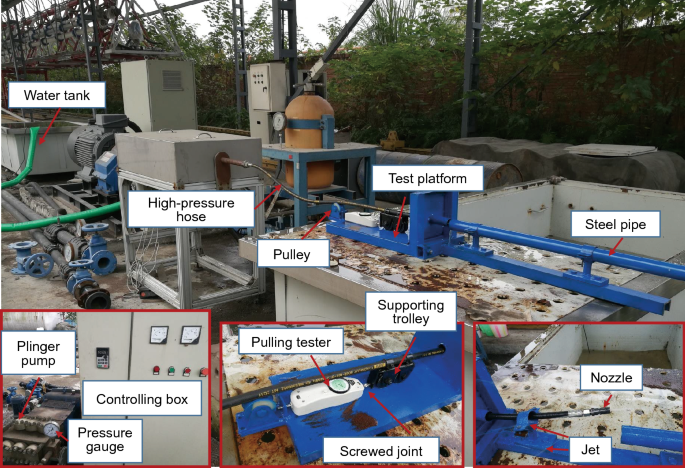
Self-propelled force and rock-breaking force measurement system
-
(1)
Experimental equipment In this experiment, Scheme 2 of the nozzle is selected to use in the test. The internal diameter of the high-pressure hose is 10 mm and the bursting pressure is 50 MPa. A high-pressure plunger pump is used as a power source with a working pressure of 50 MPa and a certified capacity of 63 L/min. The pointer pulling tester with a measuring range of 400 N and an accuracy of 2 N is used to measure the propelled force. Clear water is used as the working fluid.
-
(2)
Experimental procedure Firstly, the connected devices are designed to measure the propelled force accurately, which include testing platform with fixed groove of the tension meter, supporting trolley, and test box. The supporting trolley is connected to the high-pressure hose. The supporting trolley and the pulling tester are connected by the screwed joint. Secondly, the output pressure of the plunger pump is controlled to obtain the propelled force when the output pressures are 15, 20, 25, and 30 MPa. Under the different pressures, the nozzle drives the high-pressure hose and pulls the tester to measure the propulsive force. The experiment is repeated four times under the same conditions. And the average values of the propulsive force are reported in this paper.
-
(3)
Result analysis Under the same conditions, the calculation results and the test results are compared to validate the simulation model. The experimental results are basically consistent with the simulation results in Fig. 6, and thus the simulation model is proved correct. The experimental results are slightly lower than the simulation results because the high-pressure hose and the connection joint are influenced by the friction.
Fig. 6 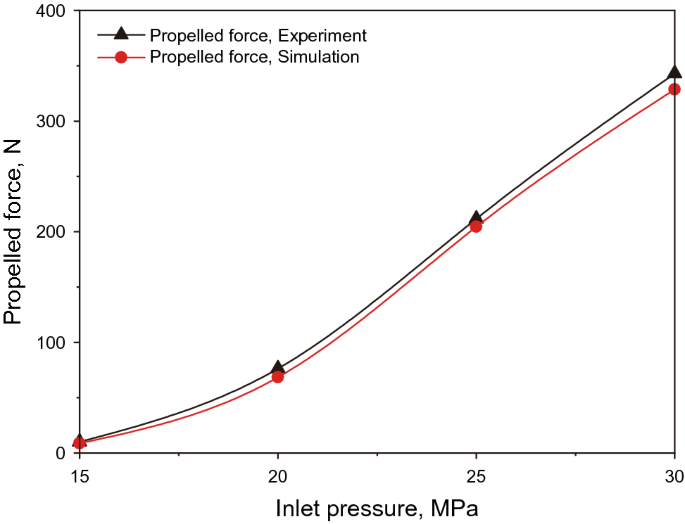
Curve of the propelled force of experiment and simulation as the inlet pressure increases
-
(1)


4 Results and discussion
4.1 Effect of the angle of backward orifices on the jet performance
The cavitation cannot be neglected in the jet performance study of the self-propelled nozzle. In Fig. 7, the black shadow regions are the cavitation area, and V is the maximum velocity of the backward jet. The backward jet velocity first increases and then decreases with increasing angle. In addition, the cavitation area gradually shifts from under-wall to upper-wall of the backward flow channel as the angle increases. Meanwhile, the cavitation area also extends to the axes of the backward orifice. The results indicate that the upper wall is impacted seriously by the high-pressure jet when the angle equals 15°. The impact on the wall of the backward orifice obviously reduces when the angle increases to 30°; this is because of the high-pressure water jets along the axis of the backward orifice. Then, the under-wall is impacted seriously by the high-pressure jet as the angle continues to increase. In conclusion, the impact becomes smaller when the angle equals 30°.

Cavitation region and velocity vector with different angles when the inlet pressure equals 60 MPa
Figure 8 shows that the cavitation position is unaltered. Moreover, the cavitation area of the backward orifice increases with increasing inlet pressure, which causes the discharge coefficient to decrease, but the flow resistance to increase (Molina et al. 2014). Therefore, more input energy is converted into rock-breaking energy as the inlet pressure increases.

Cavitation area and velocity vector with different inlet pressure when the angle equals 30°
The propulsive force and the rock-breaking force are affected significantly by the angle of the backward orifice. The dimensionless angle is defined as the ratio of β to α, and its values are 0.25, 0.50, 0.75, 1.00 and 1.25. Figure 9 shows that the energy efficiency first increases and then decreases with increasing angle under constant inlet pressure. The reason is that with the increase in the angle, the flow resistance decreases and the flow of the backward orifice increases. And then the axial jet velocity of the backward orifice increases. However with the angle increases further, it can be deduced from Eq. (3) that the axial jet velocity of the backward orifice rapidly decreases. Meanwhile, the velocity of the forward jet changes negligibly with increasing angle (Bai 2010; Yang 2012). According to Eq. (8), the energy efficiency first increases and then decreases as the angle increases when the other parameters are constant. It is also shown that the energy efficiency can achieve an optimal value when the range of the angle is between 0.5 and 0.75. As the inlet pressure increases, the growth rate of the energy efficiency decreases because the flow resistance increases. In conclusion, the self-propelled nozzle has a higher efficiency when the angle range is between 0.5 and 0.75.

Energy efficiency curves with increasing angle
Based on the previous analysis, the backward axial jet velocity first increases and then decreases, whereas the forward jet velocity changes negligibly with increasing angle. Moreover, according to Eq. (9), the energy coefficient of the backward orifice first increases and then decreases, and the energy coefficient of the forward orifice increases slowly when the other parameters are constant. Meanwhile, the energy coefficient of the forward orifice changes negligibly. These results are shown in Fig. 10. In addition, the figure shows that the energy coefficient of the backward orifice is larger when the angle is in the range of 0.5 to 0.75. Hence, the input energy can be properly allocated to the forward and the backward orifice at this time. Based on the previous analysis, it is determined that the flow resistance of the backward orifice increases an increase in the inlet pressure. At this point, the energy coefficient of the forward and backward orifices and the growth rate of the energy coefficient of the forward orifice gradually increase, but the growth rate of the energy coefficient of the backward orifice gradually decreases.

Curves of the energy coefficient of the forward and backward orifices with increasing angle
Figure 11 shows that the propulsive force increases first and then decreases, and the rock-breaking force is nearly invariable with increasing angle under constant inlet pressure. This is because the backward jet velocity first increases and then decreases, while the forward jet velocity changes little at this time. The value of the propulsive force at an angle of 0.5 is higher than that at an angle of 0.75. This is due to the axial component of the propulsive force decreasing with increasing angle, and the energy coefficient of the backward orifice changing negligibly when the angle is in the range of 0.5–0.75. Therefore, the propulsive force can reach a larger value when the angle is 0.5. The figure also shows that the propulsive force and the rock-breaking force gradually increase with increasing inlet pressure. In conclusion, the jet performance is better when the angle is 0.5, which means that the propulsive force, rock-breaking force and the energy efficiency are all large simultaneously.

Curves of the propulsive force and rock-breaking force with increasing angle
4.2 Effect of the number of backward orifices on the jet performance
As shown in Fig. 12, the backward jet velocity and the cavitation area decrease as the number of backward orifice increases. The surface of the backward orifice is impacted minimally by the high-pressure jet for six orifices. Thus, the six orifices should be selected to minimize the impact on the surface of the backward orifice. The figure also indicates that the backward jet velocity gradually decreases with increasing orifice number. This is because the equivalent diameter of the nozzle increases at this time, which causes the backward jet velocity to decrease when the inlet pressure is constant.

Cavitation region and velocity vector with different number when the inlet pressure equals 60 MPa
The number of backward orifices has an important influence on the jet performance, which must be investigated. According to previous research, the forward and backward jet velocity decreases with increasing number of orifices. Through the discussion regarding Eq. (8), it is determined that the energy efficiency influenced by the velocity reduction in the forward and backward jets is larger than the equivalent diameter increment. Because the relationship between velocity and efficiency is to the third power, and diameter is to the second power, the efficiency is more sensitive to the velocity. As a consequence of these two factors, it is shown in Fig. 13 that the energy efficiency decreases with increasing orifice number under constant inlet pressure. Moreover, the energy efficiency decreases significantly when the number exceeds seven because the jet velocity decreases rapidly at this time. The figure also shows that the energy efficiency increases, but its growth rate decreases gradually with increasing inlet pressure. To obtain a high-efficiency self-propelled nozzle, the number of the backward orifices must be considered at the design stage of the nozzle.

Energy efficiency curves with increasing number
Figure 14 shows that the energy coefficient of the backward orifice increases first and then decreases, but the energy coefficient of the forward orifice decreases gradually as the number of backward orifice increases under constant inlet pressure. Based on the foregoing analysis, it is known that the backward jet velocity and the cavitation intensity decrease simultaneously with increasing number. If the cavitation intensity decreases, the energy coefficient of the backward orifice increases. However, the energy coefficient of the backward orifice decreases with the decrease of backward jet velocity. Under the comprehensive function of the two factors, the effect of reduced cavitation intensity on the energy efficiency of the backward orifice is greater than the effect of the reduction in the jet velocity of the backward orifice. And the energy coefficient of the backward orifice increases first. Then, the energy coefficient of the forward orifice is stable when the number is five or six. This is because the energy coefficient affected by the backward jet velocity is in equilibrium with the cavitation intensity. Then, as the number increases further, the energy coefficient of the backward orifice decreases rapidly because the backward jet velocity reduces quickly. As the forward jet velocity continues to decrease with the increasing number of the backward orifice, the energy coefficient of the forward orifice decreases gradually.

Curves of the energy coefficient forward and backward orifices with increasing number
Figure 15 shows that the propulsive force increases gradually, but its growth rate decreases with increasing number. This is because the energy coefficient of the backward orifice increases with increasing number under constant inlet pressure. Meanwhile, the equivalent diameter of the nozzle increases so that the backward jet velocity decreases. As the forward jet velocity decreases with the increasing number, the rock-breaking force decreases, as shown in the figure. The rock-breaking force stabilizes when the number equals five, six, or seven. Thus, it is considered that the propulsive force and the rock-breaking force are all large simultaneously when the number equals six or seven. A greater number of backward orifices may cause higher cost and low-quality of processes, and thus, the number should be selected as 6 to ensure that the nozzle has good jet performance.

Curves of the propulsive force and rock-breaking force with increasing orifice number
4.3 Effect of the diameter of the backward orifice on the jet performance
As shown in Fig. 16, the cavitation area and the jet velocity decrease with the increase in diameter under constant inlet pressure. When the pressure is constant, the increase in the diameter leads to the increase of the flow cross-sectional area and the reduction of the jet velocity. Then it will lead to the reduction in the cavitation region.

Cavitation region and velocity vector with different diameters when the inlet pressure equals 60 MPa
The jet performance of the nozzle is significantly affected by the orifice diameter. The dimensionless diameter is defined as the ratio of d1 to d2, and its values are 0.4, 0.45, 0.50, 0.55 or 0.60. Figure 17 shows that the energy efficiency decreases with increasing diameter under constant inlet pressure. This is because the velocity decreases with the increase in the diameter. Meanwhile, the cavitation region decreases with the increase in the diameter, which leads to the decrease in the velocity. According to Eq. (8), the energy efficiency influenced by the velocity reduction in the jet is larger than the diameter increment. The increase in the inlet pressure can result in an increase in the energy efficient. According to Eq. (8), the effect of the increasing velocity on the energy utilization is far greater than the effect of increasing inlet pressure.

Curve of the energy efficient with increasing diameter
As shown in Fig. 18, the energy coefficient of the backward orifice increases first and then decreases rapidly with the increase in diameter. This is because the backward jet velocity and the cavitation intensity decrease as the diameter increases. In the initial period, the energy coefficient of the backward orifice affected by the decrease in cavitation intensity is larger than the decrease in the backward jet velocity. Thus, the energy coefficient of the backward orifice increases first. Then, as the diameter increases further, the influence relation between the decrease in cavitation intensity and the decrease in the backward jet velocity is reversed, which causes the energy coefficient of the backward orifice to decrease rapidly. Therefore, there is an optimal value for the diameter of the backward orifice to maximize the energy coefficient of the backward orifice. The energy coefficient of the forward orifice decreases linearly because the forward jet velocity continues to decrease with increasing the diameter. Moreover, the energy coefficients of the forward and backward orifices increase with the increase in the inlet pressure.

Curves of the energy coefficient of the forward and backward orifices with increasing diameter
When the inlet pressure is constant, the propulsive force increases gradually, but the rock-breaking force decreases gradually with an increase in diameter, as shown in Fig. 19. This is because the energy coefficient of the backward orifice increases with increasing diameter under constant inlet pressure. However, the forward jet velocity decreases because the equivalent diameter of the orifice increases. In addition, the growth rate of the propulsive force decreases significantly when the diameter exceeds 0.55. The energy coefficient of the orifice increases with increasing the inlet pressure, which causes the propulsive force and the rock-breaking force to increase. On the basis of the calculation results, the diameter should be selected in the range of 0.5–0.55 mm to ensure that these two factors are large simultaneously. Therefore, the nozzle has good jet performance when the diameter is in the range of 0.5–0.55.

Curves of the propulsive force and rock-breaking force with increasing diameter
4.4 Scheme optimum selection
Combination of the above results, the certain optimal schemes of the structure parameters of backward orifice are shown in Table 6. The case 1 can be directly used because the axial propulsive force and the rock-breaking force are moderate. In case 2, the axial propulsive force is larger, but the rock-breaking is too smaller to break rock. On the contrary, the rock-breaking is larger, but the axial propulsive force is too smaller to drive the nozzle in the case 3. In case 4, the propulsive force is moderate, but the rock-breaking force is smaller.
5 Conclusions
There are two main research topics in this paper: building the calculation models of the energy efficiency and energy coefficient of the nozzle; and analyzing the effect of the structure parameters of the backward orifice on the jet performance using the numerical simulation method. The following are concluded:
-
1.
The theoretical models of the energy efficiency and energy coefficient of the nozzle are built. They respectively reveal the relationship between the structure parameters and energy efficiency, the relationship between the structure parameters and energy coefficient. And the most significant factor that influences the energy efficiency is the jet velocity of the orifice.
-
2.
The influences of the structure parameters of the backward orifice on the jet performance are obtained. The angle of the backward orifice has an optimal value to ensure that the energy efficiency, the propulsive force, and the rock-breaking force all increase simultaneously. The energy efficiency decreases with the increase in the number and diameter of the backward orifices. As the number and diameter of the backward orifices increase, the propulsive force increases dramatically, but the rock-breaking force reduces. There is an optimal angle to minimize the impact on the surface of the backward orifice. The impact decreases with increasing number and the diameter of the backward orifice.
-
3.
The optimal structure parameters of the backward orifices are obtained. The self-propelled nozzle has a good jet performance when the angle is 30°, the number of the backward orifices is six and the diameter of backward orifices is in the range of 2–2.2 mm.
Abbreviations
- F j :
-
Propulsive force, N
- f :
-
Friction force, N
- F f :
-
Viscous force, N
- F T :
-
Diverter resistance force, N
- m n :
-
Nozzle quality, kg
- a n :
-
Accelerated velocity, m/s2
- F p :
-
Recoil force generated by the forward jet, N
- F r :
-
Recoil force generated by the backward jets, N
- F w :
-
Impact on the internal and external wall of the nozzle, N
- F :
-
Axial recoil force, N
- S :
-
Cross-sectional area of the orifice, m2
- q′:
-
Flow of backward orifice, m3/s
- v′:
-
Average velocity, m/s
- v :
-
Axial average velocity of the cross-sectional area of backward orifice, m/s
- v 1 :
-
Forward jet velocity, m/s
- v 2 :
-
Backward jet velocity, m/s
- S 1 :
-
Cross-sectional area of the forward orifice, m2
- S 2 :
-
Cross-sectional area of the backward orifice, m2
- L h :
-
Length of the high-pressure hose, m
- d h :
-
Inner diameter of the high-pressure hose, m
- P i :
-
Inlet pressure, Pa
- v i :
-
Inlet velocity, m/s
- C 1 :
-
Energy coefficient of the forward orifice
- C 2 :
-
Energy coefficient of the backward orifice
- u j :
-
Velocity component in the j direction, m/s
- \(\dot{m}^{ + }\) :
-
Source terms represent the effect of evaporation during the phase change
- \(\dot{m}^{ - }\) :
-
Source terms represent the effect of condensation during the phase change
- p v :
-
Vapor pressure, Pa
- p :
-
Mixture pressure, Pa
- N b :
-
Bubble number density
- g :
-
Acceleration of gravity, m/s2
- F x :
-
Body force, N
- k :
-
Turbulence kinetic energy, m2/s2
- u + :
-
Velocity component tangential to the wall, m/s
- \(\mu_{t}\) :
-
Friction velocity constructed from the wall stress, m/s
- \(y^{ + }\) :
-
Distance from the wall surface (dimensionless)
- G k :
-
Mean velocity gradients
- v :
-
Velocity vector, m/s
- α v :
-
Vapor volume fraction
- α l :
-
Volume fraction of liquid
- ρ v :
-
Vapor density, kg/m3
- ρ l :
-
Liquid density, kg/m3
- ρ :
-
Mixture density, kg/m3
- μ :
-
Mixture dynamic viscosity, Pa s
- μ l :
-
Liquid dynamic viscosity, Pa s
- μ v :
-
Vapor dynamic viscosity, Pa s
- ε :
-
Dissipation rate, m2/s3
- ρ h :
-
Line density of the high-pressure hose, kg/m
- α :
-
Angle between the axis of the backward orifice and the nozzle, °
- μ f :
-
Friction coefficient
- η :
-
Energy efficiency, %
- v :
-
Vapor
- l :
-
Liquid
- h :
-
Hose
References
Abdel-Ghany MA, Siso S, Hassan AM, et al. (2011) New technology application, radial drilling petrobel, first well in Egypt. In: Offshore mediterranean conference and exhibition. Offshore Mediterranean conference, 2011.
Bi G, Li GS, Qu Z, et al. Rock breaking efficiency of the self-propelled swirling jet. ACTA Petrolei Sinica. 2016;5(37):680–7. https://doi.org/10.7623/syxb201605012(In Chinese).
Bi G, He Y. Influencing factor analysis of self-propelled ability of the self-propelled nozzle. Petrochem Ind Appl. 2018;7(37):26–9 (In Chinese).
Buset P, Riiber M, Eek A. Jet Drilling tool: cost-effective lateral drilling technology for enhanced oil recovery. In: Presented at the SPE/ICoTA coiled tubing roundtable, Houston, Texas. 2001; 7–8 March. SPE-68504-MS. https://doi.org/10.2118/68504-ms.
Bai LH. Numerical simulation study on flow field and rock-breaking for self-propelled nozzle applied in hydraulic deep penetration. Harbin Institute of Technology. 2010; 45–8. (In Chinese).
Chen H, Li Z, Gao Z, et al. Numerical investigation of rock breaking mechanisms by high pressure water jet. Procedia Eng. 2015;126:295–9. https://doi.org/10.1016/j.proeng.2015.11.246.
Chi HP, Li GS, et al. Effects of parameters of self-propelled multi-orifice nozzle on drilling capability of water jet drilling technology. Int J Rock Mech Min Sci. 2016;86:23–8. https://doi.org/10.1016/j.ijrmms.2016.03.017.
Chi HP, Li GS, et al. Maximum drillable length of the radial horizontal micro-hole drilled with multiple high-pressure water jets. J Nat Sci Eng. 2015;26:1042–9. https://doi.org/10.1016/j.jngse.2015.07.044.
Chi HP, Li GS, Huang ZW, et al. A new method of productivity prediction and analysis for micro radial horizontal drainholes drilled by water jet. Socar Proc. 2013;3:45–54. https://doi.org/10.5510/OGP20130300167.
Li DQ, Grekula M, Lindell P. Towards numerical prediction of unsteady sheet cavitation on hydrofoils. J Hydrodyn. 2010;22(5):741–6. https://doi.org/10.1016/S1001-6058(10)60024-8.
Dickinson W, Anderson RR, Dickinson RW. The ultrashort-radius radial system. SPE Drill Eng. 1989;4(3):247–54. https://doi.org/10.2118/14804-PA.
Su HP, Suh HK, Chang SL. Effect of bioethanol–biodiesel blending ratio on fuel spray behavior and atomization characteristics. Energy Fuels. 2009;23(8):4092–8. https://doi.org/10.1021/ef900068a.
He ZX, et al. Effect of nozzle geometrical and dynamic factors on cavitating and turbulent flow in a diesel multi-hole injector nozzle. Int J Therm Sci. 2013;70(8):132–43. https://doi.org/10.1016/j.ijthermalsci.2013.03.008.
Ji B, Luo XW, et al. Large Eddy Simulation and theoretical investigations of the transient cavitating vortical flow structure around a NACA66 hydrofoil. Int J Multiph Flow. 2015;68:121–34. https://doi.org/10.1016/j.ijmultiphaseflow.2014.10.008.
Li J, Li G, Huang Z, et al. The self-propelled force model of a multi-orifice nozzle for radial jet drilling. J Nat Gas ence & Eng. 2015;24:441–8. https://doi.org/10.1016/j.jngse.2015.04.009.
Love TG, Mccarty RA, Surjaatmadja JB, et al. Selectively placing many fractures in openhole horizontal wells improves production. SPE Prod Facil. 2001;16(4):219–24. https://doi.org/10.2118/50422-MS.
Liu Y. The research of increasing production mechanistic of radial direction drilling in low permeability reservoir. Northeast Petroleum University. 2012; 15–6. (In Chinese).
Masters JA. Deep basin gas trap, western Canada. AAPG Bull. 1979;63(2):152–81. https://doi.org/10.1306/C1EA55CB-16C9-11D7-8645000102C1865D.
Molina S, Salvador FJ, et al. A computational investigation on the influence of the use of elliptical orifices on the inner nozzle flow and cavitation development in diesel injector nozzles. Energy Convers Manag. 2014;79(2):114–27. https://doi.org/10.1016/j.enconman.2013.12.015.
Mo L, Wang J. Numerical simulation for wellbore flow field of self-propelled nozzle. J Cent South Univ. 2015;46(10):3656–62. https://doi.org/10.11817/j.issn.1672-7207.2015.10.014(In Chinese).
Wang C, Wang M, Xu Y, et al. CFD-based parameter optimization for self-propelled nozzle. Oil Drill Prod Technol. 2013;35(1):108–11 (In Chinese) .
Schnerr GH, Sauer J. Physical and numerical modeling of unsteady cavitation dynamics. In: Proceedings of 4th international conference on multiphase flow, New Orleans, USA. 2001.
Schmidt DP, Corradini M. The internal flow of diesel fuel injector nozzles: a review. Int J Engine Res. 2001;2(1):1–22. https://doi.org/10.1243/1468087011545316.
Sun X C. Study on the water jet perforating technique. Dalian University of Technology. 2005; 1–2. (In Chinese).
Salvador FJ, Romero JV, Roselló MD, et al. Validation of a code for modeling cavitation phenomena in Diesel injector nozzles. Math Comput Model Int J. 2010;52(7-8):1123–32. https://doi.org/10.1016/j.mcm.2010.02.027.
Tahmasebi E, Lucchini T, D’Errico G, et al. An investigation of the validity of a homogeneous equilibrium model for different diesel injector nozzles and flow conditions. Energy Convers Manag. 2017;154:46–55. https://doi.org/10.1016/j.enconman.2017.10.049.
Wei Y, Zhang D, Wang L. Calculation of self-propelled rotary water jet propulsion. Coal Mine Mach. 2007;28(8):14–5 (In Chinese).
Xiao L, Long X. Cavitating flow in annular jet pumps. Int J Multiph Flow. 2015;71:116–32. https://doi.org/10.1016/j.ijmultiphaseflow.2015.01.001.
Yang X (2012) Jet parameters research of hydraulic injection radial drilling technology. Northeast Petroleum University. 2012; 20–1. (In Chinese).
Zhou Z. The mechanisms of impacting and drilling in coal by combined jets and its technology application. Chongqing University. 2017. (In Chinese) https://doi.org/10.27670/d.cnki.gcqdu.2017.000001.
Acknowledgements
This work of the paper was supported by the Natural Science Foundation of China (No.51974036 and No.51604039) and the Yangtze Fund for Youth Teams of Science and Technology Innovation (No. 2016cqt01).
Author information
Authors and Affiliations
Corresponding author
Additional information
Edited by Xiu-Qiu Peng
Rights and permissions
Open Access This article is licensed under a Creative Commons Attribution 4.0 International License, which permits use, sharing, adaptation, distribution and reproduction in any medium or format, as long as you give appropriate credit to the original author(s) and the source, provide a link to the Creative Commons licence, and indicate if changes were made. The images or other third party material in this article are included in the article's Creative Commons licence, unless indicated otherwise in a credit line to the material. If material is not included in the article's Creative Commons licence and your intended use is not permitted by statutory regulation or exceeds the permitted use, you will need to obtain permission directly from the copyright holder. To view a copy of this licence, visit http://creativecommons.org/licenses/by/4.0/.
About this article

Cite this article
Fu, BW., Zhang, S. & Liu, SH. Effect of the structure of backward orifices on the jet performance of self-propelled nozzles. Pet. Sci. 18, 245–258 (2021). https://doi.org/10.1007/s12182-020-00511-4
Received:
Published:
Issue Date:
DOI: https://doi.org/10.1007/s12182-020-00511-4