
Abstract
The necessity of image fusion is growing in recently in image processing applications due to the tremendous amount of acquisition systems. Fusion of images is defined as an alignment of noteworthy Information from diverse sensors using various mathematical models to generate a single compound image. The fusion of images is used for integrating the complementary multi-temporal, multi-view and multi-sensor Information into a single image with improved image quality and by keeping the integrity of important features. It is considered as a vital pre-processing phase for several applications such as robot vision, aerial, satellite imaging, medical imaging, and a robot or vehicle guidance. In this paper, various state-of-art image fusion methods of diverse levels with their pros and cons, various spatial and transform based method with quality metrics and their applications in different domains have been discussed. Finally, this review has concluded various future directions for different applications of image fusion.
1 Introduction
Image fusion (IF) is an emerging field for generating an Infrmative image with the integration of images obtained by different sensors for decision making [1]. The analytical and visual image quality can be improved by integrating different images. Effective image fusion is capable of preserving vital Information by extracting all important Information from the images without producing any inconsistencies in the output image. After fusion, the fused image is more suitable for the machine and human perception. The first step of fusion is Image Registration (IR) in which source image is mapped with respect to the reference image. This type of mapping is performed to match the equivalent image on the basis of confident features for further analysis. IF and IR are perceived as vital assistants to produce valuable Information in several domains [2]. According to the literature, the number of scientific papers has been increased dramatically since 2011 and reached to the peak 21,672 in 2019 which can be illustrated in Fig. 1. This fast-rising trend can be recognized due to the increased demand for high-performance image fusion techniques with low cost. Recently, various techniques like multi-scale decomposition and sparse representation have been introduced that bring several ways for improving the image fusion performance. There is a need for efficient fusion method due to variations between corresponding images in various applications. For instance, numerous satellites are increasing nowadays to acquire aerial images with diverse spectral, spatial and temporal resolutions in the domain of remote sensing. The IF is basically a collection of image Information achieved by several imaging parameters such as aperture settings or dynamic range, spectral response or position of the camera or the use of polarization filters. The Information of interest is extracted from different images with the help of appropriate image fusion methods which can further be used for traffic control, reconnaissance, driver assistance or quality assessment.

According to the literature, the number of articles related to image fusion
Various techniques of image fusion can be classified as pixel level, decision level and feature level. Pixel level techniques for image fusion directly integrate the Information from input images for further computer processing tasks [3]. Feature level techniques for image fusion entails the extractions of relevant features that is pixel intensities, textures or edges that are compounded to create supplementary merged features [4, 5]. In decision level fusion techniques for images, the input images are processed one at a time for the extraction of Information [4]. There are a variety of IF classifications based on the datasets such as multi-focus, multi-spectral, multi-scale, multi-temporal, and multi-sensor. In multi-focus techniques for image fusion, Information from several images of a similar scene is fused to get one composite image [6]. In addition, the multi-source and multi-sensor IF methods recommend superior features for representing Information which is not visible to a human visible system and are utilized for medical diagnosis applications. The Information generated from merged images can be employed for localization of abnormalities accurately [7]. The temporal modeling will give details of all clinical variables and reduce the risk of Information failure [8]. The fast-rising trend can be a major factor of image fusion techniques having low cost and high performance.
Currently, several techniques like sparse representation (SR) and multi-scale decomposition have been anticipated that help in enhancing the image fusion performance [3]. SR is a theory of image representation, which is employed to an image processing tasks such as interpolation, denoising, and recognition [1]. The multi-spectral (MS) image is used for remote sensing that merges their features to get an understandable image using the corresponding Information and spatiotemporal correlation [9]. IF has grown to be an influential solution by merging the images captured through diverse sensors. Images of diverse types such as infrared, visible, MRI and CT are superior input images for multimodal fusion [1]. Currently, Deep learning is a very active topic in image fusion. It has gained great success in this area for solving different type of problems such as image processing and computer vision. It is widely used for image fusion [10]. Due to recent technological advancements, various imaging fusion techniques have been utilized in many applications including video surveillance, security, remote sensing, machine vision, and medical imaging.
Still there are number of challenges associated with image fusion which have to be explored. Moreover, an appropriate, accurate and reliable fusion technique is required for the various types of images for different domains that should be easily interpretable to obtain better results. Besides, image fusion techniques must be robust against uncontrollable acquisition conditions or inexpensive computation time in real-time systems as mis-registration is a major error found while fusing images. This paper presents an outline of various IF techniques with their applications in diverse domains. Also, various challenges, shortcomings, and benefits of image fusion techniques have been discussed.
Rest of the paper is organized in different sections. Section 2 discusses the image fusion process. Section 3 gives the various image fusion techniques. Section 4 presents the taxonomical view of the image fusion methods. Section 5 explains various image fusion applications. In Sect. 6, the evaluation metrics of fusion are discussed. Section 7 delivered the perceptive deliberations and prospects for future work. Finally, the papers with an outline of major ideas are concluded.
2 Image Fusion Process
As discussed earlier, the goal of IF is to produce a merged image with the integration of Information from more than one image. Figure 2 demonstrates the major steps involved in IF process. In wide-ranging, the registration is measured as an optimization issue which is used to exploit the similarity as well as to reduce the cost. The Image registration procedure is used to align the subsequent features of various images with respect to a reference image. In this procedure, multiple source images are used for registration in which the original image is recognized as a reference image and the original images are aligned through reference image. In feature extraction, the significant features of registered images are extracted to produce several feature maps.
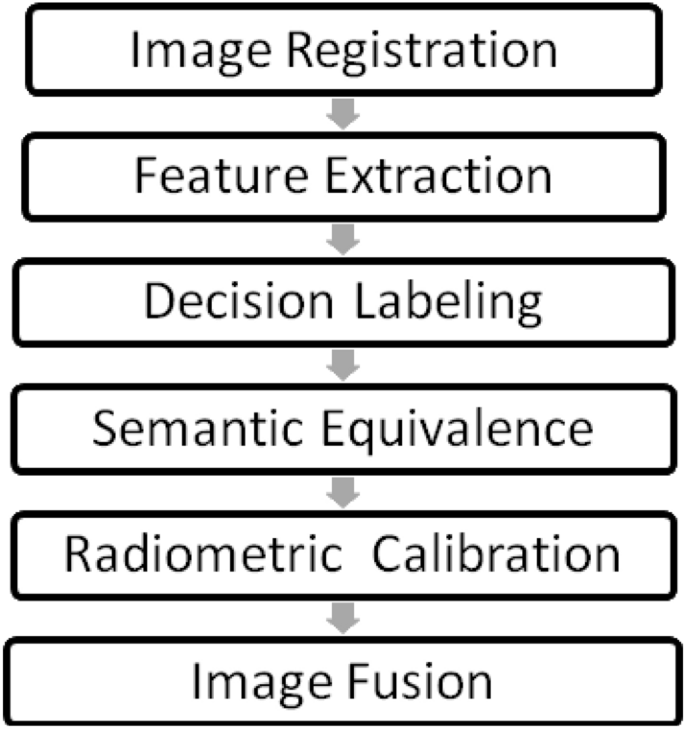
The main steps of IF procedure
By employing a decision operator whose main objective is to label the registered images with respect to pixel or feature maps, a set of decision maps are produced. Semantic equivalence obtained the decision or feature maps that might not pass on to a similar object. It is employed to connect these maps to a common object to perform fusion. This process is redundant for the source obtained from a similar kind of sensors. Then, radiometric calibration is employed on spatially aligned images. Afterward, the transformation of feature maps is performed on an ordinary scale to get end result in a similar representation format. Finally, IF merge the consequential images into a one resultant image containing an enhanced explanation of the image. The main goal of fusion is getting more Infrmative fused image [2].
3 Image Fusion Techniques
IF techniques can be classify as spatial and frequency domain. The spatial technique deals with pixel values of the input images in which the pixels values are manipulated to attain a suitable outcome. The entire synthesis operations are evaluated using Fourier Transform (FT) of the image and then IFT is evaluated to obtain a resulting image. Other IF techniques are PCA, IHS and high pass filtering and brovey method [12].
Discrete transform fusion techniques are extensively used in image fusion as compared to pyramid based fusion technique. Different types of IF techniques are shown in Fig. 3 [13].
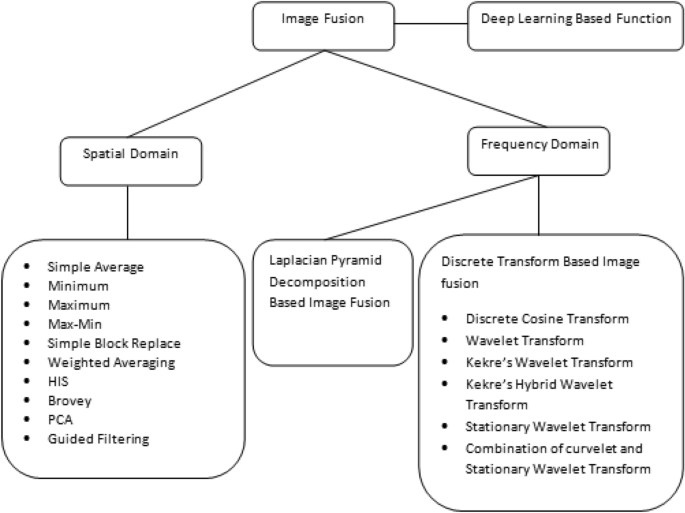
Image Fusion Techniques
3.1 Spatial Based Techniques
The Spatial based technique is a simple image fusion method consist of Max–Min, Minimum, Maximum, Simple Average and Simple Block Replace techniques [14][15]. Table 1shows the diverse spatial domain based methods with their pros and cons.
3.1.1 Simple Average
It is a fusion technique used to combined images by averaging the pixels. This technique focused on all regions of the image and if the images are taken from the same type of sensor then it works well [16]. If the images have high brightness and high contrast then it will produce good results.
3.1.2 Minimum Technique
It selects the lowest intensity value of the pixels from images andproduceda fused image [14]. It is used for darker images [17].
3.1.3 Maximum Technique
It selects the pixels values of high intensity from images to yield fused image [12].
3.1.4 Max–Min Technique
It selects the averaging values of the pixels smallest and largest from the entire source images and produced the resultant merged image.
3.1.5 Simple Block Replace Technique
It adds all images of pixel values and takes the block average for it. It is based on pixel neighboring block images.
3.1.6 Weighted Averaging Technique
It assigned the weights to every pixel in the source images. The resultant image is produced by the weighted sum of every pixel value in source images [18]. This method improves the detection reliability of the output image.
3.1.7 Hue Intensity Saturation (HIS)
It is a basic fusion color technique that converted the Red–Green–Blue image into HIS components and then intensity levels are divided with panchromatic (PAN) image. Spatial contains intensity Information and spectral contains both hue and saturation Information of the image. It performs in the bands and has three multispectral bands Red–Green–Blue (RGB) of low resolution. In the end, the inverse transformation is performed to convert the HIS space to the original RGB space for yielding fused image [12]. It is a very straightforward technique to combine the images features and provides a high spatial quality image. In remote sensing images it gives the best result and major drawback is that it involved only three bands [19].
3.1.8 Brovey Transform Method
Gillespie et al. suggested Brovey Transform in 1987. It is a straightforward technique for merging data from more than one sensor. It overcomes the three band problems. It standardized the three multispectral bands used for RGB to append the intensity and brightness into the image [13]. It includes an RGB color transform technique that is known as color normalization transform to avoid disadvantages of the multiplicative technique [12]. It is helpful for visual Interpretation but generates spectral distortion [19].
3.1.9 Principal Component Analysis (PCA)
It is a statistical method on the basis of orthogonal transformation for converting a set of observations of a possibly correlated variable into principal components that are set of linearly uncorrelated variables. The main drawback of PCA is spectral degradation and color distortion [9].
3.1.10 Guided filtering
It works as a boundary smoothing and preserving operator similar to the admired bilateral filter. It has enhanced performance near the boundaries. It has a hypothetical link with Laplacian matrix. It is a fast and non-estimated linear time algorithm, whose density is not dependent on the mask size. This filter is more efficient and effective in graphics and computer vision applications with joint upsampling, haze removal, detail smoothing and noise reduction [20]. IF is also used in medical domain to identity the various diseases. In which article, author perform experiment on brain images and prove that Guided filter provides better results as compared to Principal component analysis and multi-resolution singular value decomposition technique [161].
3.2 Frequency Domain
These techniques decomposed the multiscale coefficients from the input images [25]. Spatial distortion can be handled by the frequency method. Table 2 lists the various frequency domain based methods with their pros and cons.
3.2.1 Laplacian Pyramid Fusion Technique
It uses the interpolation sequence and Gaussian pyramid for multi-resolution analysis for image fusion. Saleem et al. have reported an improved IF technique using a contrast pyramid transform on multi-source images [151]. But it is suffered by the drawback of extraction ability which can be overcome by multi-scale decomposition. Further, Li et al. improved the gradient pyramid multi-source IF method which attains high band coefficient with the help of gradient direction operator [9].
3.2.2 Discrete Transform Fusion Method [14]
Discrete transform based fusion take composite images. Firstly, if the images are colored then RGB (Red–Green–Blue) components of the multiple images are separated subsequently, discrete transformation on images is applied and then the average of multiple images is computed an inverse transformation is applied at the end to obtain a fused image. DWT (Discrete wavelets transform) is a better IF method as compared to other fusion methods like Laplacian pyramid method, Curvelet transforms method etc [26].
3.2.3 Discrete Cosine Transform (DCT)
In image fusion, DCT has various types like DCTma (DCT magnitude), DCTcm (DCT contrast measure), DCTch (DCT contrast highest), DCTe (DCT energy) and DCTav (DCT average) [29]. This technique does not give a better result with the size of the block less than 8 × 8. In the DCT domain, DCTav is straightforward and basic method of image fusion. DCTe and DCTma methods performed well in image fusion. This technique is straightforward and used in factual time applications.
3.2.4 Discrete Wavelet Transform (DWT) Method
DWT method decomposes the two or more images into various high and low-frequency bands [31]. This method minimized the spectral distortion in the resultant fused images by producing the good signal to noise ratio with fewer spatial resolution as compared to the pixel-based method. Wavelet fusion performed superior to the spatial domain fusion method with respect to minimizing the color distortions [15].
3.2.5 Kekre’s Wavelet Transform (KWT) Method
Kekre’s Wavelet Transform method is obtained from Kekre’s transforms [32]. It can generate KWT matrices of ((2 N)*(2 N)), ((3 N)*(3 N)),…., ((N2)*(N2)) from Kekre’s transform method matrix [33]. It can be used for more than one images and the fused image is far good than other methods.
3.2.6 Kekre’s Hybrid Wavelet Transform (KHWT) Method
KHWT method has been derived from hybrid wavelet transforms. Many authors suggested that kekre-hadamard wavelet method gives more brightness. Hybrid kekre-DCT wavelet method gives good results. In this method, the best two matrices are combined into a hybrid wavelet transforms method. It cannot be used images integer power of two [45].
3.2.7 Stationary Wavelet Transform (SWT) Method
DWT method has a disadvantage of translation invariance and Stationary Wavelet Transform overcome this problem [34]. This technique provides a better output at decomposition level 2 and time inefficient process [35] [36] [37]. SWT derived from DWT method. It is a new type of wavelet transform method with translation invariance. It provides enhanced analysis of image facts. The next second invention curvelet transform method is additionally suitable for 2-D image edges.
3.2.8 Curvelet Transform Method
SWT has a better characteristic in time–frequency. It can achieve well result for devising in smooth. The second generation Curvelet is a new multi-scale transform; it breaks the disadvantages of wavelet method in representing directions of boundaries in the image [11, 40,41,42].
3.3 Deep Learning
Another technique which is most widely used for image fusion is Deep Learning in various domains. Several deep learning based image fusion methods have been presented for multi-focus image fusion, multi-exposure image fusion, multi-modal image fusion, multi-spectral (MS) image fusion, and hyper-spectral (HS) image fusion, showing various advantages. Various recent advances related to deep learning based image are discussed in [10]. In another way, deep learning and case-based reasoning techniques are used with image fusion to enhance the outcome of segmentation. In this article, author used artificial intelligence to improve the results of segmentation and its implementation done on kidney and tumour images. This process complete in three layers: Fusion layer, Segmentation layer, Data layer [159]. The multi-view deep learning model is also used in Covid-19 for validation and testing sets of chest CT images. It is more helpful to identify the diagnosis problem. Data is collected from various hospitals of china [160]. The reasons behind the popularity of deep learning based methods for image fusion are presented as that deep learning model are able to extract the most elective features automatically from data without any human intervention. These models are also able to characterize various complex relationships between targeting data and input. Deep learning models are gaining popularity in providing potential image representation approaches which could be useful to the study of image fusion. Commonly used deep learning models in image fusion are Convolutional Neural Network (CNN), Convolutional Sparse Representation (CSR) and Stacked Autoencoder (SAE). Table 3.listed the various advantages and disadvantages of deep learning based image fusion methods.
4 Image Fusion categorization
It is the process which integrates the source image and reference image into one image. Diverse techniques were anticipated by different authors to achieve the required fusion objective. A Single sensor, multi-sensor, multi-modal, multi-view, multi-focus, and multi-temporal illustrates major classes of such methods which are discussed below.
4.1 Single Sensor
A number of images are merged to produce a fused image with the best possible Information. For instance, human operators are not able to perceive desired objects in lighting variant and noisy environment which can be highlighted in the end fused image. The inadequacy of this type of system is due to imaging sensors that are used in many sensing areas. The resolution of images is limited by the sensors and the conditions in which the system is operated in its dynamic range. Such as visible band sensor (digital camera) is appropriate for illuminated day-light scenes but is not appropriate for the badly illuminated nighttime environment or under fog or rain that is unfavorable conditions [47].
4.2 Multi Sensors
Multi-sensor IF overpowers the confines of a one sensor IF by integration of images from a number of sensors to form a compound image. An infrared (IR) camera accompanies the digital camera to obtain the final image from individual images. The infrared camera is suitable in inadequate illuminated environments and the digital camera is suitable for day-light views. It is used in machine vision, a military area such as in medical imaging, robotics and object detection. It is mostly used to resolve the merged Information of the numerous images [47]. According to the literature review, Table 4 shows the various Multi-sensors techniques discussed by several authors.
4.3 Multi-view Fusion
Multi-view images have diverse views at the similar time. It is also known as Mono-modal fusion [47]. The existing methods didn’t achieve acceptable performances in all cases, especially when one of the estimations is not high-quality; in this case, they are unable to discard it [49, 86, 152]. According to the literature review, Table 5 shows the various Multi-view techniques discussed by several authors.
4.4 Multi-modal Fusion
It is the process of integrating multi-modal images from one or more imaging modalities to enhance the quality of an image. The various models are multispectral, panchromatic, infrared, remote sensing and visible images. Table 6 evident the various Multi-modal techniques discussed by several authors according to the literature review.
4.5 Multi-focus Fusion
It is an efficient method for integrating the Information from several images with a similar sight into a wide-ranging image. The compound image is more Infrmative than input images [6]. It gives better visual quality of an image. According to the literature review, Table 7 shows the various Multi-focus techniques discussed by several authors.
4.6 Multi-temporal Fusion
Multi-temporal fusion captures the same scene at different times. Long and short-term observations are required because of the estimation of the occurrence of changes on the ground. Because of the revisit observation satellites, remote sensing images are obtained at diverse times for a given area. Multi-temporal images are vital for detecting land surface variations in broad geographical areas. According to the literature review; Table 8 shows the various Multi-temporal techniques discussed by several authors.
5 Main Applications in Diverse Domains
In current years, IF has been widely used in many different applications such as medical diagnosis, surveillance, photography and remote sensing. Here, various challenging and issues are discussed related to different fields [3].
5.1 Remote Sensing Applications
In accumulation to the modalities discussed above, it has numerous IF techniques such as Synthetic Aperture Radar, ranging and light detection and moderate resolution imaging spectroradiometer that have been useful in IF applications. Byun et al. have given the area based IF scheme for combining panchromatic, multispectral and synthetic aperture radar images [1]. Temporal data fusion and high spatial approach is used to produce synthetic Landsat imagery by combining Landsat and moderate resolution imaging spectroradiometer data [1]. Moreover, the synthesis of air-bone hyper-spectral and Light Detection and Ranging (LiDAR) data is researched recently by a combination of spectral Information. Various datasets have been provided by Earth imaging satellites like Quickbird, Worldview-2, and IKONOS for the applications of pansharpening. Co-registered hyper-spectral and multispectral images are more complex to obtain as compared to multispectral and panchromatic images. Moreover, air-bone hyper-spectral data and LiDAR are accessible. For occurrence, the IEEE Geoscience and Remote Sensing Society Data Fusion 2013 and 2015 Contests have distributed numerous hyper-spectral, color and light detection and ranging data for research purposes. In this field application, numbers of satellites are mounted to acquire remote sensing images with diverse spatial, temporal and spectral resolutions. Moreover, in this field, classification and change detection has been providing by Google Maps or Earth products that are effectively applied to construct the imagery seen. This is a supplementary difficult problem as compared with pansharpening, the multichannel multispectral image contains both spatial Information and spectral Information. Therefore, pansharpening is unsuitable or incompetent for the IF of hyperspectral and multispectral images. The foremost challenge in this domain is accomplished as below:
-
(1)
Spatial and spectral distortions The image datasets frequently reveal variations in spatial and spectral structures which causes more distortions with spatial or spectral artifacts during image fusion.
-
(2)
Mis-registration The next most important challenge in this domain is how to decrease the misregistration rate. The remote sensing input images are regularly obtained from diverse times, acquisitions or spectral bands. Even the panchromatic and multispectral datasets provided by a similar platform, the one or more sensors may not give accurate results in the same direction; their gaining moments may be different. Therefore, in order to resolve this, prior to IF, the images are required to be registered. Conversely, registration is the challenging process because of the variations between input images as they are provided with diverse acquisitions. Figure 4 shows the fusion of Panchromatic and Multi-spectral images that is achieved by the Principal Component Analysis (PCA) transformation correspondingly.

Examples of IF in remote sensing domain. a PAN b MS c Fused image
5.2 Medical Domain Applications
Harvard Medical School has provided a brain image dataset of registered Computerized Tomography and Magnetic Resonance Imaging. Figure 6 shows an example of IF in medical diagnosis by fusing CT and MRI. The CT is used for capturing the bone structures with high spatial resolutions and MRI is used to capture the soft tissue structures like the heart, eyes, and brain. The CT and MRI can be used collectively with IF techniques to enhance accuracy and sensible medical applicability. The main challenging of this field is also accomplished as below.
-
(1)
Lack of medical crisis oriented IF methods The main motive of IF is to assist the improved clinical results. The clinical crisis is still a big challenge and nontrivial tasks in the medical field.
-
(2)
Objective image fusion performance estimate The main difficulty in this domain is how to evaluate the IF performance. There are diverse clinical issues of IF, which preferred the IF effect may be fairly dissimilar.
-
(3)
Mis-registration The inaccurate registration of objects suffered from poor performance in the medical domain. Figure 5 illustrates the fusion of MRI and CT images. In this, the fusion of images is achieved by the guided filtering based technique with image statistics.

Examples of IF in medical diagnosis domain. a MRI b CT c Fused image
5.3 Surveillance Domain Applications
Figure 6 shows examples of IF in the surveillance domain that is infrared and visible images fusion. Its high temperature makes it able to “see in the night” even without enlightenment as it is sensitive to objects. Infrared images give bad spatial resolution and it can be overcome by fusion technique by the visible and infrared image. Moreover, the fusion of visible and infrared images has been introduced for another surveillance domain problem in face recognition, image dehazing, and military reconnaissance. The main challenges of in this domain are as:
-
(1)
Computing efficiency In this domain, effective IF algorithms should merge the Information of innovative images to get the final resultant image. Other prominently, in these domains usually engages continuous real-time monitoring.
-
(2)
Imperfect environmental conditions The major difficulty in this field, the images may be acquired at imperfect circumstances. Due to the weather and enlightenment condition, the input images may contain under-exposure and serious noise. Fusion of visible and infrared image is shown in Fig. 6a, b. In this outline, the fusions of both images are achieved by the guided filtering and image statistics.

Examples of IF in surveillance domain. a Visible image b Infrared image c Fused image
5.4 Photography Domain Applications
Figure 7 shows examples of IF in the photography domain, the fusion of multi-focus images. It is not possible for all objects with diverse distances from camera due to its restricted depths to be all-in-focus within a single shot of cameras. Due to the restricted depths of the camera, it is not possible to be all-in-focus within a single shot of cameras for all objects with diverse distances. To overcome this, the multi-focus IF method is used to merge several images with a similar scene having diverse focus points for generating an all-in-focusresultant image. This resultant compound image can well defend the significant Information from the source image. It is more desirable in several image processing tasks and machine vision. In Fig. 8, the data sources used in the photography domain. The various challenges which are faced in this domain are:
-
(1)
Effect of moving target objects In this domain, multi-exposure and multi-focus images are constantly provided by diverse times. In these circumstances, during the capturing process moving objects may become visible in diverse locations. The moving objects might produce inconsistencies into the fused image.
-
(2)
Relevance in consumer electronics In this, images are taken from numerous shots with diverse settings of the camera. The challenge is to combine the multi-exposure and multi-focus IF methods into consumer electronics to produce a compound image of high quality in real-time. IF of multi-focus images (Back-focus image and Fore-focus image) is shown in Fig. 7a, b. In this outline, IF of multi-focus images is achieved by guided filtering based technique and image.
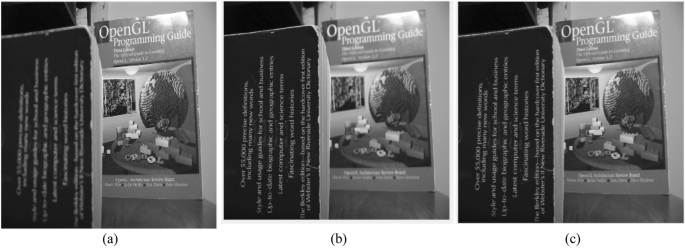
Examples of IF in photography domain. a Back-focus Image b Fore-focus image c Fused image
5.5 Applications in Other Domains
Many other applications that are used for fusion like object recognition, tracking, object detection etc.
5.6 Recognition Application
In an image one or more objects are visible. The main aim of recognition to recognize the objects clearly. Face recognition is a major application in this domain. Recognition algorithm used infrared and visible IF method. It has two types to recognize the image. In the first type, first fused the images after that recognize its objects. In the next type, it is embedded with the reorganization process,and it isproposed by Faten et al. It can help for improving the recognition precision with the help of narrowband and enhancement the fusion results.
5.7 Detection and Tracking Application
Detection and tracking are used in infrared and visible IF. It isused in real-life applications: fruit detection, object detection. It determines the accurate place of the objects at a similar time. Detection fusion algorithm can be differentiate into two classes, in the first class detect the objects before fusing and in the second classes, fuse the images before detecting objects. He at el. introduced an algorithm with multilevel image fusion and it enhanced the target detection of the object. Pixel and feature level image fusion isalso considered in this method and it shows the relationship between high and low-frequency Information, which is ignored in the wavelet transform IF. The main motive of this method to enhance target visibility.
Target tracking algorithm is similar to the detection algorithm. It should determine the relationship between the frames of the target objects in a particular time sequence. Stephen et al. introduced an enhanced target tracking approach through visible and infrared IF by using PCA-weighted fusion rule. In most of the algorithms: detection, recognition and tracking are independent to each other which is designed to recover the features or visibility of the actual images [4].
5.8 Performance Evaluation Measure
A number of performance evaluation metrics have been anticipated to evaluate the performances of diverse IF techniques. They can be categorized as subjective and objective assessment measures [52]. Subjective assessment measures play important role in IF as it evaluates the fused image quality based on human visual perception. It can compare various fusion techniques and methods according to standards like image details, image distortion, and object competence. In the infrared and visible IF subjective evaluation is more popular and reliable. Its disadvantages are high cost, time-consuming, irreproducibility and human intervention. Objective assessment is carried out to quantify the fused image quality quantitatively. It is not biased by observers and highly consistent with visual perception. It’s arriving from diverse types, which are based on image gradient, similar structure, Information theory, human visual perception and statistics [1]. A number of metrics for quantifying the quality of fused images is presented in this survey. Some other evaluation measures of fused images are divided into two groups. Evaluation measures are further categorized as a reference and non-reference evaluation measures. Evaluation measures based on the reference image are given below.
-
i.
The mean of the square error (MSE) computes the error and the real differentiation between the ideal or expected results [1, 147]. This metric is defined as follow:
$$ MSE = \frac{1}{mn}\mathop \sum \limits_{i = 1}^{m} \mathop \sum \limits_{j = 1}^{n} \left( {A_{ij} - B_{ij} } \right)^{2} $$(1)where A and B is the ideal and compound image respectively that can be evaluated, i and j is the pixel row and column index respectively, m and n is the height and width of image implying the numeral or pixel rows and columns respectively.
-
ii.
The Structural similarity index metric (SSIM) quantifies the similarity between one or more images. It is designed by modeling any contrast distortion and radiometric. It is a combination of the luminance image distortion and the combination of contrast distortion, loss correlation and structure distortion between source images and the final image [1, 11, 147,148,149,150]. This metric is defined as follow:
$$ SSIM\left( {x,y} \right) = \frac{{\left( {2\mu_{x} \mu_{y} + c_{1} } \right)\left( {2\sigma_{xy} + c_{2} } \right)}}{{\left( {\mu_{x}^{2} + \mu_{y}^{2} + c_{1} } \right)\left( {\sigma_{x}^{2} + \sigma_{y}^{2} + c_{2} } \right)}} $$(2)where the \({\mu }_{x}\) average of x, \({\mu }_{y}\) the average of y, \({\sigma }_{x}^{2}\) the variance of x, \({\sigma }_{y}^{2}\) the variance of y, \({\sigma }_{xy}\) the covariance of x and y,\({c}_{1}\) and \({c}_{2}\) two variable to stabilize the division with the weak denominator
-
iii.
The peak signal to noise ratio (PSNR) is used to compute the ratio of peak power and noise value power [1, 11, 147, 149, 150]. This metric is defined as follow:
$$ PSNR = 10log_{10 } \left\{ {\frac{{r^{2} }}{MSE}} \right\} $$(3)Here, r indicates the peak value of the fused image. If the PSNR value is high that means fused image closer to the input image and less distortion in the fusion method
-
iv.
Erreur Relative Globale Adimensionnelle de Synthese employed to quantify the image quality from the fusion of high spatial resolution images. This method is introduced by Lucien Wald [148, 151]. This metric is defined as follow:
$$ ERGAS = 100\frac{h}{l}\sqrt {\frac{1}{N}\mathop \sum \limits_{k = 1}^{N} {\raise0.7ex\hbox{${RMSE\left( {B_{k} } \right)^{2 } }$} \!\mathord{\left/ {\vphantom {{RMSE\left( {B_{k} } \right)^{2 } } {\left( {M_{k} } \right)^{2 } }}}\right.\kern-\nulldelimiterspace} \!\lower0.7ex\hbox{${\left( {M_{k} } \right)^{2 } }$}}} $$(4)where \(h\) and \(l\) show the size of the PAN and MS images, \(N\) indicates the total number of pixels in the fused image. \({M}_{k}\) is the mean radiance value of the MS image for the \({B}_{k}\) band [151]
-
v.
Overall cross entropy (OCE) is used to determine the difference between one or more source images to get a fused image. If the OCF value is smaller, it means it provide better results [11, 12]. This metric is defined as follow:
$$ OCE\left( {f_{A} ,f_{B} ;F} \right) = CE(f_{A} ;F) + CE(f_{B} ;F)/2 $$(5)Here CE indicates the cross-entropy of the images, it effects the entropy of two source images \({f}_{A}\) and \({f}_{B}\) and F is fused image
-
vi.
Visual Information fidelity (VIF) is used to measure the distortions of images. It includes blur, local or global contrast changes and additive noises [1, 150]. This metric is defined as follow:
$$ VIF \, = \, Distorted \, image \, information/Reference \, image \, information $$(6) -
vii.
Mutual Information provides the Information quantity detail of source images, which are merged in the resultant image. The highest Mutual Information represents the effectiveness of the IF technique [1, 11, 141, 150, 151]. This is defined as follows
$$ MI_{AF} = \mathop \sum \limits_{a,f} P_{A,F } \left( {a,f} \right)log\left[ {\frac{{P_{AF } \left( {a,f} \right)}}{{P_{A } \left( a \right)P_{F } \left( f \right)}}} \right] $$(7)where \({P}_{A }(a)\) and \({P}_{F }(f)\) denote the marginal histogram of input image A and the fused image is F. \({P}_{A,F }(a,f)\) indicate joint histogram of input image A and fused image is F. if mutual Information value is high it means fusion performance is good
-
viii.
Spectral Angle Mapper (SAM) calculates spectral similar content between original and final fused images by looking between two vectors at the angle [21]. This metric is defined as follow:
$$ {\upalpha } = \cos^{ - 1} \left( {\frac{{\mathop \sum \nolimits_{i = 1}^{b} t_{i} r_{i} }}{{\left( {\mathop \sum \nolimits_{i = 1}^{b} t_{i}^{2} } \right)^{{{\raise0.7ex\hbox{$1$} \!\mathord{\left/ {\vphantom {1 2}}\right.\kern-\nulldelimiterspace} \!\lower0.7ex\hbox{$2$}}}} \left( {\mathop \sum \nolimits_{i = 1}^{b} r_{i}^{2} } \right)^{{{\raise0.7ex\hbox{$1$} \!\mathord{\left/ {\vphantom {1 2}}\right.\kern-\nulldelimiterspace} \!\lower0.7ex\hbox{$2$}}}} }}} \right) $$(8)Here, b is denoted the number of bands and \({\mathrm{t}}_{\mathrm{i}}\) and \({\mathrm{r}}_{\mathrm{i}}\) stand for an ith band of test and reference images
-
ix.
Signal to noise Ratio (SNR) is used to determine the noise. The larger the signal to noise value enhanced the resultant compound image [11, 12]. This metric is defined as follow:
$$ {\text{S}}NR = 10log_{10} \left\{ {\frac{{\mathop \sum \nolimits_{x = 1}^{P} \mathop \sum \nolimits_{y = 1}^{Q} \left( {I_{r} (x,y} \right))^{2} }}{{\mathop \sum \nolimits_{x = 1}^{P} \mathop \sum \nolimits_{y = 1}^{Q} \left( {I_{r} (x,y} \right) - I_{f} \left( {x,y} \right))^{2} }}} \right\} $$(9)where \({I}_{r}(x,y)\) indicates the intensity of the pixel of the estimated image and \({I}_{f}(x,y)\) indicates the intensity of the pixel of the source image. If the signal to noise value is high it means estimation error is small and better performance in the fusion.
Non-reference image quality evaluation measures which do not need reference image are given below.
-
i.
Standard Deviation (SD) spread the data in the whole image [1, 151]. This metric is defined as follow:
$$ {\text{SD}} = \sqrt {\mathop \sum \limits_{i = 1}^{m} \mathop \sum \limits_{j = 1}^{n} \left( {h\left( {i,j} \right) - \overline{H}} \right)^{2} } $$(10)where \(\stackrel{-}{H}\)denotes the mean value of fused image. If the value of SD is high that means fused images achieve a good visibility effect.
-
ii.
Spatial Frequency error (SFE) is a quantitative measure to objectively assess the superiority of the final the fused image [149]. This is defined as follow:
$$ SFE = \frac{{SF_{f} - SF_{r} }}{{SF_{r} }} $$(11)where \({SF}_{f}\)-SF of the fused image, \({SF}_{r}\)-SF of the reference image.
-
iii.
Entropy (EN) is used to evaluate the Information content of an image and it produce sensitive noise in the image. Image with large Information content has low cross entropy [1, 11, 12, 149, 151]. This metric is defined as follow:
$$ EN = - \mathop \sum \limits_{l = 0}^{L - 1} p_{l} log_{2} p_{l} $$(12)where, L is denotes the total number of gray levels and \({p}_{l}\) denotes the normalized histogram of the corresponding gray level in the IF. If the EN value is higher it means it contains more Information and better performance in the image fusion.
-
iv.
The universal image quality index (UIQI) is motivated by Human Visual System. It is based on the structural Information of final fused resultant images with the combination of loss of correlation, contrast distortion, and luminance distortion [11, 150]. This metric is defined as follow:
$$ UIQI = \frac{{\sigma_{{I_{1} I_{F} }} }}{{\sigma_{{I_{1} \times }} \sigma_{{I_{F} }} }}.\frac{{\mu_{{I_{1} I_{F} }} }}{{\left( {\mu_{{I_{1} }} } \right)^{2 } + \left( {\mu_{{I_{1} }} } \right)^{2 } }}.\frac{{2\sigma_{{I_{1} \times }} \sigma_{{I_{F} }} }}{{\left( {\sigma_{{I_{1} }} } \right)^{2 } + \left( {\sigma_{{I_{1} }} } \right)^{2 } }} $$(13)where \(\sigma \) is variance, \(\mu \) is the average.
-
v.
Fusion mutual Information metric evaluates the degree of dependence of the one or more images. It is based on Mutual Information (MI) and measures the feature Information which is transformed from input image to fused image. It enhanced the image quality [1, 11]. This metric is defined as follow:
$$ FMI = MI_{A,F} + MI_{B,F} $$(14)where A, B are input images and F is the fused image. If FMI value is high it indicates that considerable Information transfer from input to the fused image.
-
vi.
Spatial frequency (SF) is an image quality index it’s called spatial row frequency (RF) and column frequency (CF) based on horizontal and vertical gradients. The Spatial frequency evaluation metric can calculate the gradient distribution of an image effectively and it gives more texture detail of the image [1, 11, 150, 151]. This metric is defined as follow:
$$ SF = \sqrt {RF^{2} + CF^{2} } $$(15)$$ RF = \sqrt {\mathop \sum \limits_{i = 1}^{M} \mathop \sum \limits_{j = 1}^{N} \left( {F\left( {i,j} \right) - F\left( {i,j - 1} \right)} \right)^{2} } $$(16)$$ {\text{CF}} = \sqrt {\mathop \sum \limits_{i = 1}^{M} \mathop \sum \limits_{j = 1}^{N} \left( {F\left( {i,j} \right) - F\left( {i - 1,j} \right)} \right)^{2} } $$(17)where F is a fused image. A fused image with high SF contain the rich edges and textures Information.
-
vii.
The large Mean gradient (MG) measurement implies that the composite image capture the rich edges and textures Information. Its fusion performance is better [1, 149]. This metric is defined as follow:
$$ {\text{MG}} = \frac{1}{{\left( {{\text{M}} - 1} \right)\left( {{\text{N}} - 1} \right){ }}} \times \mathop \sum \limits_{{{\text{x}} = 1}}^{{{\text{M}} - 1}} \mathop \sum \limits_{{{\text{y}} = 1}}^{{{\text{N}} - 1}} \sqrt {{\raise0.7ex\hbox{${(\left( {{\text{F}}\left( {{\text{x}},{\text{y}}} \right) - {\text{F}}\left( {{\text{x}} - 1,{\text{y}}} \right)} \right)^{2} + \left( {{\text{F}}\left( {{\text{x}},{\text{y}}} \right) - {\text{F}}\left( {{\text{x}}, - 1{\text{y}}} \right)} \right)^{2} )}$} \!\mathord{\left/ {\vphantom {{(\left( {{\text{F}}\left( {{\text{x}},{\text{y}}} \right) - {\text{F}}\left( {{\text{x}} - 1,{\text{y}}} \right)} \right)^{2} + \left( {{\text{F}}\left( {{\text{x}},{\text{y}}} \right) - {\text{F}}\left( {{\text{x}}, - 1{\text{y}}} \right)} \right)^{2} )} 2}}\right.\kern-\nulldelimiterspace} \!\lower0.7ex\hbox{$2$}}} $$(18)where F is a final fused image.
-
ix.
Average Difference (AD) is the propositional value of the differentiation between the actual or ideal data. [147]. This metric is defined as follow:
$$ {\text{AD}} = \frac{1}{{{\text{mn}}}}\mathop \sum \limits_{{{\text{i}} = 1}}^{{\text{m}}} \mathop \sum \limits_{{{\text{j}} = 1}}^{{\text{n}}} \left| {\left( {{\text{A}}_{{{\text{ij}}}} - {\text{B}}_{{{\text{ij}}}} } \right)} \right| $$(19) -
ix.
Average Gradient (AG) measurement is used to measure the gradient Information of the composite image. It provides the texture detail of an image [1, 150, 151]. The AG metric is defined as follow:
$$ {\text{AG}} = \frac{1}{{{\text{MN}}}}\mathop \sum \limits_{{{\text{i}} = 1}}^{{\text{M}}} \mathop \sum \limits_{{{\text{j}} = 1}}^{{\text{N}}} \sqrt {\frac{{\nabla {\text{F}}_{{\text{x}}}^{{2{ }}} \left( {{\text{i}},{\text{j}}} \right) + \nabla {\text{F}}_{{\text{y}}}^{{2{ }}} \left( {{\text{i}},{\text{j}}} \right)}}{2}} $$(20)If AG metric value is high that means it contains more gradient Information and better performance in the fused algorithm.
-
x.
Normalized cross correlation (NCC) is employed to determine similar content between input and fused image [147]. This metric is defined as follow:
$$ {\text{NCC}} = \frac{{\mathop \sum \nolimits_{{{\text{i}} = 1}}^{{\text{m}}} \mathop \sum \nolimits_{{{\text{j}} = 1}}^{{\text{n}}} \left( {{\text{A}}_{{{\text{ij}}}} {\text{*B}}_{{{\text{ij}}}} } \right)}}{{\mathop \sum \nolimits_{{{\text{i}} = 1}}^{{\text{m}}} \mathop \sum \nolimits_{{{\text{j}} = 1}}^{{\text{n}}} \left( {{\text{A}}_{{{\text{ij}}}}^{2} } \right)}} $$(21) -
xi.
Mean absolute error (MAE) of the related pixels in original and final fused images [11]. This is defined as follow:
$$ {\text{MAE}} = \frac{1}{{{\text{N}}^{2} }}\mathop \sum \limits_{{{\text{i}} = 1}}^{{\text{M}}} \mathop \sum \limits_{{{\text{j}} = 1}}^{{\text{N}}} {\text{s}}\left( {{\text{i}},{\text{j}}} \right) - {\text{y}}\left( {{\text{i}},{\text{j}}} \right) $$(22) -
xii.
Normalized Absolute Error (NAE) is a quality measure that normalized the error value with respect to the expected or ideal value. It isprovide the dissimilarity between the actual and desired outcome which is further divided bythe sum of the expected values [147]. This metric is defined as follow:
$$ {\text{NAE}} = \frac{{\mathop \sum \nolimits_{{{\text{i}} = 1}}^{{\text{m}}} \mathop \sum \nolimits_{{{\text{j}} = 1}}^{{\text{n}}} \left| {\left( {{\text{A}}_{{{\text{ij}}}} - {\text{B}}_{{{\text{ij}}}} } \right)} \right|}}{{\mathop \sum \nolimits_{{{\text{i}} = 1}}^{{\text{m}}} \mathop \sum \nolimits_{{{\text{j}} = 1}}^{{\text{n}}} \left( {{\text{A}}_{{{\text{ij}}}} } \right)}} $$(23) -
xiii
Correlation determines the correlation between referenced and resultant image. If the reference image and resultant image value are one it means both images are exactly the same and if it is less than one it means both images have more dissimilarity [11].
6 Discussion
Despite the various constraints which are handled by several researchers, still number of research and development in the field of image fusion is growing day by day. Image fusion has several open-ended difficulties in different domains. The main aim is to discuss the current challenges and future trends of image fusion that arise in various domains, such as surveillance, photography, medical diagnosis, and remote sensing are analyzed in the fusion processes. This paper has discussed various spatial and frequency domain methods as well as their performance evaluation measures. Simple image fusion techniques cannot be used in actual applications. PCA, hue intensity saturation and Brovey methods are computationally proficient, high-speed and extremely straightforward but resulted in distortion of color. Images fused with Principal component analysis have a spatial advantage but resulted in spectral degradation. The guided filtering is an easy, computationally efficient method and is more suitable forreal-world applications. The number of decomposition levels affects the pyramid decomposition in image fusion outcome. Every algorithm has its own advantages and disadvantages. The main challenge faced in remote sensing field is to reduce the visual distortions after fusing panchromatic (PAN), hyperspectral (HS) and multi-spectral (MS) images. This is because source images are captured using different sensors with similar platform but do not focus on a same direction as well as their gaining moments are not exactly the same. The dataset and its accessibility represent a restriction that is faced by many researchers. The progress of image fusion has increased its interest in colored images and its enhancement. The aim of color contrast enhancement is to produce an appealing image with bright color and clarity of the visual scene. Recently, researchers have used neutrosophy in image fusion, used to remove noise and to enhance the quality of single photon emission tomography (SPET), computed tomography (CT), magnetic resonance imaging (MRI), and positron emission tomography (PET) image. This integration of neutrosophy with image fusion resulted in noise reduction and better visibility of the fused image. Deep learning is the rising trend to develop the automated application. It extremely applied in various applications such as face recognition, speech recognition, object detection and medical imaging. The integration of quantitative and qualitative measures is the accurate way to determine which particular fusion technique is better for certain application. The various challenges which generally are faced by researchers is to design image transformation and fusion strategies. Moreover, the lack of effective image representation approaches and widely recognized fusion evaluation metrics for performance evaluation of image fusion techniques is also of great concern. Whereas the recent progresses in machine learning and deep learning based image fusion shows a huge potential for future improvement in image fusion.
7 Conclusion
Recently, the area of image fusion is attracting more attention. In this paper, various image fusion techniques with their pros and cons, different methods with state-of-art has been discussed. Different applications like medical image, remote sensing, photography and surveillance images have been discussed with their challenges. Finally, the different evaluation metrics for image fusion techniques with or without reference has been discussed. Therefore, it is concluded from survey that each image fusion technique is meant for a specific application and can be used in various combinations to obtain better results. In future, new deep neural networks based image fusion methods will be developed for various domains to improve the efficiency of fusion procedure by implementing the algorithm with parallel computing unit.
References
Ma J, Ma Y, Li C (2019) Infrared and visible image fusion methods and applications: a survey. Inf Fus 1(45):153–178
El-Gamal FE, Elmogy M, Atwan A (2016) Current trends in medical image registration and fusion. Egyptian Inform J 17(1):99–124
Li S, Kang X, Fang L, Hu J, Yin H (2017 Jan) Pixel-level image fusion: a survey of the state of the art. Inf Fus 1(33):100–112
Maruthi R, Lakshmi I (2017) Multi-focus image fusion methods–a survey. Comput Eng 19(4):9–25
Meher B, Agrawal S, Panda R, Abraham A (2019) A survey on region based image fusion methods. Inf Fus 1(48):119–132
Liu Z, Chai Y, Yin H, Zhou J, Zhu Z (2017) A novel multi-focus image fusion approach based on image decomposition. Inf Fus 1(35):102–116
James AP, Dasarathy BV (2014) Medical image fusion: a survey of the state of the art. Inf Fus 1(19):4–19
Madkour M, Benhaddou D, Tao C (2016) Temporal data representation, normalization, extraction, and reasoning: a review from clinical domain. Comput Methods Programs Biomed 1(128):52–68
Bai L, Xu C, Wang C (2015) A review of fusion methods of multi-spectral image. Optik-Int J Light Electron Optics 126(24):4804–4807
Liu Y, Chen X, Wang Z, Wang ZJ, Ward RK, Wang X (2018) Deep learning for pixel-level image fusion: recent advances and future prospects. Inf Fus 1(42):158–173
Du J, Li W, Lu K, Xiao B (2016) An overview of multi-modal medical image fusion. Neurocomputing 26(215):3–20
Morris C, Rajesh RS (2014) Survey of spatial domain image fusion techniques. Int JAdv Res Comput Sci Eng Inf Technol 2(3):249–254
Mishra D, Palkar B (2015) Image fusion techniques: a review. Int J Comput Appl 130(9):7–13
Jasiunas MD, Kearney DA, Hopf J, Wigley GB (2002) Image fusion for uninhabited airborne vehicles. In: 2002 IEEE International conference on field-programmable technology, 2002.(FPT). Proceedings, p 348–351. IEEE
Dong J, Dafang Z, Yaohuan H, Jinying F (2011) Survey of multispectral image fusion techniques in remote sensing applications. In: Zheng Y (ed) Image fusion and its applications. Alcorn State University, USA
Banu RS (2011) Medical image fusion by the analysis of pixel level multi-sensor using discrete wavelet Transform. In: Proceedings of the national conference on emerging trends in computing science, p 291–297
Bavachan B, Krishnan DP (2014) A survey on image fusion techniques. IJRCCT 3(3):049–052
Song L, Lin Y, Feng W, Zhao M (2009) A novel automatic weighted image fusion algorithm. In: 2009. ISA 2009. International Workshop on Intelligent Systems and Applications, p 1–4
Singh N, Tanwar, P (2012) Image fusion using improved contourlet transform technique. Int J Recent Technol Eng (IJRTE), vol 1, no. 2
He K, Sun J, Tang X (2010) Guided image filtering. European conference on computer vision. Springer, Berlin, pp 1–14
Harris JR, Murray R, Hirose T (1990) IHS transform for the integration of radar imagery with other remotely sensed data. Photogramm Eng Remote Sens 56(12):1631–1641
Smith LI (2002) A tutorial on principal components analysis. Statistics 51(1):52
Li S, Kang X, Hu J (2013) Image fusion with guided filtering. IEEE Trans Image Process 22(7):2864–2875
Sadjadi F (2005) Comparative image fusion analysais. In: 2005 Computer society conference on computer vision and pattern recognition-workshops (CVPR’05)-Workshops, p 8–8. IEEE
Yang J, Ma Y, Yao W, Lu WT (2008) A spatial domain and frequency domain integrated approach to fusion multifocus images. The International archives of the photogrammetry, remote sensing and spatial Inf sciences, 37(PART B7).
Wu D, Yang A, Zhu L, Zhang C (2014) Survey of multi-sensor image fusion. International conference on life system modeling and simulation. Springer, Berlin, pp 358–367
Olkkonen H, Pesola P (1996) Gaussian pyramid wavelet transform for multiresolution analysis of images. Graphic Models Image Process 58(4):394–398
Ramac LC, Uner MK, Varshney PK, Alford MG, Ferris DD (1998) Morphological filters and wavelet-based image fusion for concealed weapons detection. In Sensor Fusion: Architectures, Algorithms, and Applications II vol 3376, p 110–120. International Society for Optics and Photonics.
Toet A (1989) Image fusion by a ratio of low-pass pyramid. Pattern Recogn Lett 9(4):245–253
Burt PJ (1992) A gradient pyramid basis for pattern-selective image fusion. Proc SID 1992:467–470
Chandrasekhar C, Viswanath A, NarayanaReddy S (2013) FPGA Implementation of image fusion technique using DWT for micro air vehicle applications. 4(8): 307–315
Krishnamoorthy S, Soman KP (2010) Implementation and comparative study of image fusion algorithms. Int J Comput Appl 9(2):25–35
Kekre HB, Sarode T, Dhannawat R (2012) Kekre’s wavelet transform for image fusion and comparison with other pixel based image fusion techniques. Int J Comput Sci Inf Secur 10(3):23–31
Klein LA (1993) Society of photo-optical instrumentation engineers (SPIE) 405 fieldston road Bellingham. United States, WA
Borwonwatanadelokd P, Rattanapitak W, Udomhunsakul S (2009) Multi-focus image fusion based on stationary wavelet transform and extended spatial frequency measurement. In: 2009 International Conference on Electronic Computer Technology, p 77–81. IEEE
Udomhunsakul S, Yamsang P, Tumthong S, Borwonwatanadelok P (2011) Multiresolution edge fusion using SWT and SFM. Proc World Congr Eng 2:6–8
Kannan K, Perumal SA, Arulmozhi K (2010) Performance comparison of various levels of fusion of multi-focused images using wavelet transform. Int J Comput Appl 1(6):71–78
Naidu VPS (2012) Discrete cosine transform based image fusion techniques. J Commun, Navig Signal Process 1(1):35–45
Singh R, Khare A (2013) Multiscale medical image fusion in wavelet domain. Sci World J 1–10. https://doi.org/10.1155/2013/521034
Mallat S (1999) A wavelet tour of signal processing. Academic press, Elsevier
Pajares G, De La Cruz JM (2004) A wavelet-based image fusion tutorial. Pattern Recogn 37(9):1855–1872
Burrus CS, Gopinath RA, Guo H, Odegard JE, Selesnick IW (1998) Introduction to wavelets and wavelet transforms: a primer, vol 1. Prentice hall, New Jersey
Kekre HB, Athawale A, Sadavarti D (2010) Algorithm to generate Kekre’s Wavelet transform from Kekre’s Transform. Int J Eng Sci Technol 2(5):756–767
Kekre HB, Sarode T, Dhannawat R (2012) Implementation and comparison of different transform techniques using Kekre’s wavelet transform for image fusion. Int J Comput Appl 44(10):41–48
Dhannawat R, Sarode T (2013) Kekre’s Hybrid wavelet transform technique with DCT WALSH HARTLEY and kekre’s transform for image fusion. Int J Comput Eng Technol (IJCET) 4(1):195–202
Kekre HB, Sarode T, Dhannawat R (2012) Image fusion using Kekre's hybrid wavelet transform. In: 2012 International Conference on Communication, Information & Computing Technology (ICCICT), p 1–6
Sharma M (2016) A review: image fusion techniques and applications. Int J Comput Sci Inf Technol 7(3):1082–1085
Paramanandham N, Rajendiran K (2018) Infrared and visible image fusion using discrete cosine transform and swarm intelligence for surveillance applications. Infrared Phys Technol 88:13–22
Ehlers M, Klonus S, Astrand PJ (2008) Quality assessment for multi-sensor multi-date image fusion. In: Proceedings of the XXIth International Congress ISPRS, p 499–506.
Choi Y, Latifi S (2012) Contourlet based multi-sensor image fusion. In: Proceedings of the 2012 International Conference on Information and Knowledge Engineering IKE, vol 12, p 16–19
Ross WD, Waxman AM, Streilein WW, Aguiiar M, Verly J, Liu F, Rak S (2000) Multi-sensor 3D image fusion and interactive search. In: 2000. FUSION 2000. Proceedings of the Third International Conference on Inf Fusion, vol 1, p TUC3–10
Li M, Cai W, Tan Z (2006) A region-based multi-sensor image fusion scheme using pulse-coupled neural network. Pattern Recogn Lett 27(16):1948–1956
Nirmala DE, Vignesh RK, Vaidehi V (2013). Fusion of multisensor images using nonsubsampled contourlet transform and fuzzy logic. In: 2013 IEEE International conference on fuzzy systems (FUZZ) p 1–8
Pohl C, Van Genderen JL (1998) Review article multisensor image fusion in remote sensing: concepts, methods and applications. Int J Remote Sens 19(5):823–854
Kumar U, Mukhopadhyay C, Ramachandra TV (2009) Fusion of multisensor data: review and comparative analysis. In: 2009. GCIS'09. WRI Global Congress on Intelligent Systems. vol 2, p 418–422, IEEE
Subhas AM Multi sensor data fusion for sensor validation. International Journal of Advanced Computer Technology (IJACT), Survey Paper ISSN:2319–7900.
Makode PN, Khan J (2017) A review on multi-focus digital image pair fusion using multi-scale image. Wavelet Decomposition 3(1):575–579
Chang NB, Bai K, Imen S, Chen CF, Gao W (2016) Multisensor satellite image fusion and networking for all-weather environmental monitoring. IEEE Syst J 12(2):1341–1357
Hall DL, Llinas J (1997) An introduction to multisensor data fusion. Proc IEEE 85(1):6–23
Kumar NS, Shanthi C (2007) A survey and analysis of pixel level multisensor medical image fusion using discrete wavelet transform. IETE Tech Rev 24(2):113–125
Panwar SA, Malwadkar S (2015) A review: image fusion techniques for multisensor images. Int J Adv Res Electr, Electr Instrum Eng 4(1):406–410
Lemeshewsky GP (1999) Multispectral multisensor image fusion using wavelet transforms. In Visual information processing VIII, vol. 3716, p 214–223. International Society for Optics and Photonics
Deng C, Cao H, Cao C, Wang S (2007) Multisensor image fusion using fast discrete curvelet transform. In: MIPPR 2007: Remote sensing and GIS data processing and applications and innovative multispectral technology and applications, vol. 6790, p 679004. International Society for Optics and Photonics
Li H, Manjunath BS, Mitra SK (1995) Multisensor image fusion using the wavelet transform. Graphic Models Image Process 57(3):235–245
Zheng Y, Zheng P (2010) Multisensor image fusion using a pulse coupled neural network. International conference on artificial intelligence and computational intelligence. Springer, Berlin, pp 79–87
Li Y, Song GH, Yang SC (2011) Multi-sensor image fusion by NSCT-PCNN transform. Int Conf Comput Sci Automat Eng (CSAE) 4:638–642
Petrazzuoli G, Cagnazzo M, Pesquet-Popescu B (2013) Novel solutions for side Information generation and fusion in multiview DVC. EURASIP J Adv Signal Process 2013(1):154
Cheung G, Ortega A, Cheung NM (2011) Interactive streaming of stored multiview video using redundant frame structures. IEEE Trans Image Process 20(3):744–761
Gelman A, Dragotti PL, Velisavljević V (2011) Interactive multiview image coding. In: 2011 18th IEEE international conference on image processing (ICIP), p 601–604
Maugey T, Miled W, Cagnazzo M, Pesquet-Popescu B (2009) Fusion schemes for multiview distributed video coding. In: 2009 17th European signal processing conference. p 559–563
Artigas X, Angeli E, Torres L (2006) Side Information generation for multiview distributed video coding using a fusion approach. In: Proceedings of the 7th nordic signal processing symposium-NORSIG 2006, p 250–253, IEEE
Rubio-Guivernau JL, Gurchenkov V, Luengo-Oroz MA, Duloquin L, Bourgine P, Santos A, Ledesma-Carbayo MJ (2011) Wavelet-based image fusion in multi-view three-dimensional microscopy. BioInfrmatics 28(2):238–245
Guillemot C, Pereira F, Torres L, Ebrahimi T, Leonardi R, Ostermann J (2007) Distributed monoview and multiview video coding. IEEE Signal Process Mag 24(5):67–76
Guo X, Lu Y, Wu F, Gao W, Li S (2006) Distributed multi-view video coding. Vis Commun Image Process (VCIP) 6077:60770T
Wang RS, Wang Y (2000) Multiview video sequence analysis, compression, and virtual viewpoint synthesis. IEEE Trans Circuits Syst Video Technol 10(3):397–410
Rajpoot K, Noble JA, Grau V, Szmigielski C, Becher H (2009) Multiview RT3D echocardiography image fusion. International conference on functional imaging and modeling of the heart. Springer, Berlin, pp 134–143
Ferre P, Agrafiotis D, Bull D (2007) Fusion methods for side information generation in multi-view distributed video coding systems. In: 2007 IEEE International conference on image processing ICIP, vol 6, p VI-409. IEEE
Zhang ZG, Bian HY, Song ZQ, Xu H (2014) A multi-view sonar image fusion method based on nonsubsampled contourlet transform and morphological modification. Appl Mech Mater 530:567–570
Li Y, Liu H, Liu X, Ma S, Zhao D, Gao W (2009) Multi-hypothesis based multi-view distributed video coding. In: 2009. PCS 2009 Picture coding symposium. p. 1–4
Dufaux F (2011) Support vector machine based fusion for multi-view distributed video coding. In: 2011 17th International conference on digital signal processing (DSP), p 1–7
Das R, Thepade S, Ghosh S (2015) Content based image recognition by Information fusion with multiview features. Int J Inf Technol Comput Sci 7(10):61–73
Swoger J, Verveer P, Greger K, Huisken J, Stelzer EH (2007) Multi-view image fusion improves resolution in three-dimensional microscopy. Opt Express 15(13):8029–8042
Seng CH, Bouzerdoum A, Tivive FHC, Amin MG (2010) Fuzzy logic-based image fusion for multi-view through-the-wall radar. In: 2010 International conference on digital image computing: techniques and applications (DICTA), p 423–428
Kavi R, Kulathumani V, Rohit F, Kecojevic V (2016) Multiview fusion for activity recognition using deep neural networks. J Electron Imaging 25(4):043010
Kisku DR, Mehrotra H, Rattani A, Sing JK, Gupta P (2009) Multiview Gabor face recognition by fusion of PCA and canonical covariate through feature weighting. In: Applications of Digital Image Processing XXXII (vol 7443, p 744308). International Society for Optics and Photonics.
Liu K, Kang G (2017) Multiview convolutional neural networks for lung nodule classification. Int J Imaging Syst Technol 27(1):12–22
Li W, Zhu XF (2005) A new algorithm of multi-modality medical image fusion based on pulse-coupled neural networks. International conference on natural computation. Springer, Berlin, pp 995–1001
Viergever MA, van den Elsen PA, Stokking R (1992) Integrated presentation of multimodal brain images. Brain Topogr 5(2):135–145
Rodrigues D, Virani HA, Kutty S (2014) Multimodal image fusion techniques for medical images using wavelets. Image 2(3):310–313
Yang Y, Que Y, Huang S, Lin P (2016) Multimodal sensor medical image fusion based on type-2 fuzzy logic in NSCT domain. IEEE Sens J 16(10):3735–3745
Kor S, Tiwary U (2004) Feature level fusion of multimodal medical images in lifting wavelet transform domain. In: 2004 26th Annual international conference of the IEEE engineering in medicine and biology society IEMBS'04, vol. 1: p 1479–1482. IEEE
Zhao Y, Zhao Q, Hao A (2014) Multimodal medical image fusion using improved multi-channel PCNN. Bio-Med Mater Eng 24(1):221–228
Singh R, Vatsa M, Noore A (2009) Multimodal medical image fusion using redundant discrete wavelet transform. In: 2009 Seventh international conference on advances in pattern recognition ICAPR'09, p 232–235. IEEE
Qu G, Zhang D, Yan P (2001) Medical image fusion by wavelet transform modulus maxima. Opt Expr 9(4):184–190
Wang A, Sun H, Guan Y (2006) The application of wavelet transform to multi-modality medical image fusion. In: 2006. Proceedings of the IEEE International conference on networking, sensing and control ICNSC'06, p 270–274, IEEE
Sharmila K, Rajkumar S, Vijayarajan V (2013) Hybrid method for multimodality medical image fusion using discrete wavelet transform and entropy concepts with quantitative analysis. In: 2013 International conference on communications and signal processing (ICCSP), p 489–493
Singh R, Khare A (2014) Fusion of multimodal medical images using Daubechies complex wavelet transform–a multiresolution approach. Inf Fus 19:49–60
Bhavana V, Krishnappa HK (2015) Multi-modality medical image fusion using discrete wavelet transform. Procedia Comput Sci 70:625–631
Anitha S, Subhashini T, Kamaraju M (2015) A novel multimodal medical image fusion approach based on phase congruency and directive contrast in NSCT domain. Int J Comput Appl 129(10):30–35
Pure AA, Gupta N, Shrivastava M (2013) An overview of different image fusion methods for medical applications. Int J Sci Eng Res 4(7):129
Gomathi PS, Kalaavathi B (2016) Multimodal medical image fusion in non-subsampled contourlet transform domain. Circuits Syst 7(8):1598–1610
Patil MPP, Deshpande KB (2015) New technique for image fusion using DDWT and PSO in medical field. Int J Rec Innov Trends Comput Commun 3(4):2251–2254
Guruprasad S, Kurian MZ, Suma HN (2013) A medical multi-modality image fusion of CT/PET with PCA, DWT methods. J Dental Mater Tech 4(2):677–681
Parmar K, Kher RK, Thakkar FN (2012) Analysis of CT and MRI image fusion using wavelet transform. In: 2012 International conference on communication systems and network technologies (CSNT), p 124–127
Bhatnagar G, Wu QJ, Liu Z (2013) Directive contrast based multimodal medical image fusion in NSCT domain. IEEE Trans Multimed 15(5):1014–1024
Al-Bakrei AFP (2012) Brian image fusion of MRI-CT multimodality systems using DWT and hybrid enhancement fusion algorithms. J Babylon Univ/Eng Sci 20(1):258–269
Swathi PS, Sheethal MS, Paul V (2016) Survey on multimodal medical image fusion techniques. Int J Sci, Eng Comput Technol 6(1):33
Anish A, Jebaseeli TJ (2012) A Survey on multi-focus imagefusion methods. Int J Adv Res Comput Eng Technol (IJARCET) 1(8):319–324
Li H, Chai Y, Yin H, Liu G (2012) Multifocus image fusion and denoising scheme based on homogeneity similarity. Optics Commun 285(2):91–100
Wang Z, Ma Y, Gu J (2010) Multi-focus image fusion using PCNN. Pattern Recogn 43(6):2003–2016
Li S, Kwok JT, Wang Y (2002) Multifocus image fusion using artificial neural networks. Pattern Recogn Lett 23(8):985–997
Huang W, Jing Z (2007) Multi-focus image fusion using pulse coupled neural network. Pattern Recogn Lett 28(9):1123–1132
Garg R, Gupta P, Kaur H (2014) Survey on multi-focus image fusion algorithms. In: 2014 Recent Advances in Engineering and Computational Sciences (RAECS). p 1–5
Kaur G, Kaur P (2016) Survey on multifocus image fusion techniques. In: International conference on electrical, electronics, and optimization techniques (ICEEOT). p 1420–1424
Kaur P, Sharma ER (2015) A study of various multi-focus image fusion techniques. Int J Comput Sci Info Techonol 6(5):1139–1146
Liu L, Bian H, Shao G (2013) An effective wavelet-based scheme for multi-focus image fusion. In 2013 IEEE International conference on mechatronics and automation (ICMA), p 1720–1725
Malhotra G, Chopra DV (2014) Improved multi-focus image fusion using ac-dct, edge preserving smoothing & DRSHE. In: Proceedings of international conference on computer science, cloud computing and applications, p 24–25
Sulaiman M (2016) A survey on various multifocus image fusion techniques. Int J Sci Technol Eng IJSTE 3(5):107–111
Li Q, Du J, Song F, Wang C, Liu H, Lu C (2013) Region-based multi-focus image fusion using the local spatial frequency. In: 2013 25th Chinese control and decision conference (CCDC), p 3792–3796
Haghighat MBA, Aghagolzadeh A, Seyedarabi H (2011) Multi-focus image fusion for visual sensor networks in DCT domain. Comput Electr Eng 37(5):789–797
Tian J, Chen L (2012) Adaptive multi-focus image fusion using a wavelet-based statistical sharpness measure. Signal Process 92(9):2137–2146
Yang Y (2011) A novel DWT based multi-focus image fusion method. Procedia Eng 24:177–181
Malik AS (ed) (2011) Depth map and 3D imaging applications: algorithms and technologies: algorithms and technologies. Hershey, IGI Global
Chai Y, Li H, Li Z (2011) Multifocus image fusion scheme using focused region detection and multiresolution. Optics Commun 284(19):4376–4389
Qu X, Yan J (2007). Multi-focus image fusion algorithm based on regional firing characteristic of pulse coupled neural networks. In: 2007 BIC-TA 2007 Second international conference on bio-inspired computing: theories and applications, p 62–66
Maruthi R, Sankarasubramanian K (2007) Multi focus image fusion based on the Inf level in the regions of the images. J Theor Appl Inf Technol 3(4):80–85
Anitha AJ, Vijayasangeetha S (2016) Building change detection on multi-temporal VHR SAR image based on second level decomposition and fuzzyrule. Int J 4(7)
Pawar TA (2014) Change detection approach for images using image fusion and C-means clustering algorithm. Int J 2(10):303–307
Parthiban L (2014) Fusion of MRI and CT images with double density dual tree discrete wavelet transform. Int J Comput Sci Eng Technol 5(2):168–172
Momeni S, Pourghassem H (2014) An automatic fuzzy-based multi-temporal brain digital subtraction angiography image fusion algorithm using Curvelet transform and content selection strategy. J Med Syst 38(8):70
Pan H, Jing Z, Liu R, Jin B (2012) Simultaneous spatial-temporal image fusion using Kalman filtered compressed sensing. Opt Eng 51(5):057005
Dellepiane SG, Angiati E (2012) A new method for cross-normalization and multitemporal visualization of SAR images for the detection of flooded areas. IEEE Trans Geosci Remote Sens 50(7):2765–2779
Jan S (2012) Multi temporal image fusion of earthquake satellite images. Int J Adv Res Comput Sci 3(5)
Ferretti R, Dellepiane S (2015) Color spaces in data fusion of multi-temporal images. International conference on image analysis and processing. Springer, Cham, pp 612–622
Du P, Liu S, Xia J, Zhao Y (2013) Inf fusion techniques for change detection from multi-temporal remote sensing images. Inf Fusion 14(1):19–27
Wang B, Choi J, Choi S, Lee S, Wu P, Gao Y (2017) Image fusion-based land cover change detection using multi-temporal high-resolution satellite images. Remote Sens 9(8):804
Mittal M (2015) Hybrid image fusion using curvelet and wavelet transform using PCA and SVM. Int J Sci Emerg Technol Latest Trends 22(1):28–35
Wisetphanichkij S, Dejhan K, Cheevasuvit F, Mitatha S, Netbut C (1999) Multi-temporal cloud removing based on image fusion with additive wavelet decomposition. Faculty of Engineering and Research Center for Communication and Inf Technology.
Visalakshi S (2017) Multitemporal image fusion based on stationary wavelet transform and change detection using LDP analysis. International Journal of Engineering Science and Computing, p 14082
Bovolo F (2009) A multilevel parcel-based approach to change detection in very high resolution multitemporal images. IEEE Geosci Remote Sens Lett 6(1):33–37
Liu S, Bruzzone L, Bovolo F, Du P (2015) Hierarchical unsupervised change detection in multitemporal hyperspectral images. IEEE Trans Geosci Remote Sens 53(1):244–260
Celik T, Ma KK (2011) Multitemporal image change detection using undecimated discrete wavelet transform and active contours. IEEE Trans Geosci Remote Sens 49(2):706–716
Yang X, Chen L (2010) Using multi-temporal remote sensor imagery to detect earthquake-triggered landslides. Int J Appl Earth Obs Geoinf 12(6):487–495
Bruzzone L, Serpico SB (1997) An iterative technique for the detection of land-cover transitions in multitemporal remote-sensing images. IEEE Trans Geosci Remote Sens 35(4):858–867
Demir B, Bovolo F, Bruzzone L (2012) Detection of land-cover transitions in multitemporal remote sensing images with active-learning-based compound classification. IEEE Trans Geosci Remote Sens 50(5):1930–1941
Zhong J, Wang R (2006) Multi-temporal remote sensing change detection based on independent component analysis. Int J Remote Sens 27(10):2055–2061
Patil V, Sale D, Joshi MA (2013) Image fusion methods and quality assessment parameters. Asian J Eng Appl Technol 2(1):40–46
Kosesoy I, Cetin M, Tepecik A (2015 Jul) A toolbox for teaching image fusion in matlab. Procedia-Soc Behav Sci 25(197):525–530
Paramanandham N, Rajendiran K (2018) Multi sensor image fusion for surveillance applications using hybrid image fusion algorithm. Multimedia Tools Appl 77(10):12405–12436
Jin X, Jiang Q, Yao S, Zhou D, Nie R, Hai J, He K (2017 Sep) A survey of infrared and visual image fusion methods. Infrared Phys Technol 1(85):478–501
Dogra A, Goyal B, Agrawal S (2017) From multi-scale decomposition to non-multi-scale decomposition methods: a comprehensive survey of image fusion techniques and its applications. IEEE Access 5:16040–16067
Saleem A, Beghdadi A, Boashash B (2012 Dec 1) Image fusion-based contrast enhancement. EURASIP J Image Video Process 2012(1):10
Liu Y, Chen X, Peng H, Wang Z (2017) Multi-focus image fusion with a deep convolutional neural network. Inf Fusion 36:191–207
Du C, Gao S (2017) Image segmentation-based multi-focus image fusion through multiscale convolutional neural network. IEEE Access 5:15750–15761
Liu Y, Chen X, Cheng J Peng H (2017) A medical image fusion method based on convolutional neural networks. In: 2017 Proceedings of 20th International conference on information fusion, p 1–7, IEEE
Masi G, Cozzolino D, Verdoliva L, Scarpa G (2016) Pansharpening by convolutional neural networks. Remote Sens 8(594):1–22
Liu Y, Chen X, Ward R, Wang Z (2016) Image fusion with convolutional sparse representation. IEEE Signal Process Lett 23(12):1882–1886
Huang W, Xiao L, Wei Z, Liu H, Tang S (2015) A new pan-sharpening method with deep neural networks. IEEE Geosci Remote Sens Lett 12(5):1037–1041
Corbat L, Nauval M, Henriet J, Lapayre JC (2020) A fusion method based on deep learning and case-based reasoning which improves the resulting medical image segmentations. Expert Syst Appl 147:113200
Wu X, Hui H, Niu M, Li L, Wang L, He B, Yang X, Li L, Li H, Tian J, Zha Y (2020) Deep learning-based multi-view fusion model for screening 2019 novel coronavirus pneumonia: a multicentre study. Eur J Radiol. https://doi.org/10.1016/j.ejrad.2020.109041
Kaur H, Koundal D, Kadyan V (2019) Multi modal image fusion: comparative analysis. In: 2019 International conference on communication and signal processing (ICCSP), p 0758–0761. IEEE
Author information
Authors and Affiliations
Corresponding author
Ethics declarations
Conflict of Interest
There is no conflict of interest.
Additional information
Publisher's Note
Springer Nature remains neutral with regard to jurisdictional claims in published maps and institutional affiliations.
Rights and permissions
About this article

Cite this article
Kaur, H., Koundal, D. & Kadyan, V. Image Fusion Techniques: A Survey. Arch Computat Methods Eng 28, 4425–4447 (2021). https://doi.org/10.1007/s11831-021-09540-7
Received:
Accepted:
Published:
Issue Date:
DOI: https://doi.org/10.1007/s11831-021-09540-7