
Abstract
The multifaceted data from Indian remote sensing satellite (IRS)-1C with Panchromatic (PAN, 5.8 m, 0.50–0.75 μm), Linear Imaging Self-Scanning Sensor-III (LISS-III, 23.5 m, four multi-spectral bands) and Wide Field Sensor (WiFS, 188 m, red and near-infrared bands) sensors onboard, along with stereo imaging and 5-day revisit capability have been effectively utilised for mapping, monitoring, planning and development of urban and regional areas. It made possible to explore urban and regional areas either independently or in combination with other remote sensing data for base map preparation, land use survey and planning, growth modelling, environment and hazards analysis, utilities and infrastructure planning, etc. This review article articulates the scale and mapping potential of IRS-1C data for urban and regional areas, data fusion methods and information retrieval based on visual or digital image processing techniques, including advanced classifiers. It recapitulates the application potential demonstrated in last 25 years in urban and regional studies, and for infrastructure planning.
Introduction
Cities sprawl into surrounding landscapes while encroaching into natural environment, mostly ignorant of social and environmental consequences arising out of their ‘urban footprints’. Though the human settlements occupy nearly 5% of the Earth’s terrestrial surface, they consume 75% of its natural resources causing environmental degradation, pollution and harmful waste production. Nearly 55% of the global population today lives in urban areas, which is anticipated to grow into 68% by 2050. These urban areas are projected to add-up additional 2.5 billion people by 2050, and 90% of this increment shall happen in Asia and Africa (Revision of World Urbanisation Prospects 2018). This anticipated population growth will further transform urban landscapes, pose newer challenges and unfold opportunities for urban planners and decision makers while necessitating an unprecedented investment in infrastructure. Besides, the overall impact of coronavirus disease (COVID-19) on urban population, cities and their environment is yet to be ascertained.
Indian remote sensing satellite (IRS)-1C mission, a second generation satellite under IRS series launched in 1995, provided continuity of services to the users while enhancing the application potential as compared to its predecessor, IRS-1A/1B. The spacecraft carried three sensors onboard (Table 1), namely Panchromatic (PAN, 5.8 m, 0.50–0.75 μm), Linear Imaging Self-Scanning Sensor-III (LISS-III, 23.5 m, four multi-spectral bands) and Wide Field Sensor (WiFS, 188 m, red and near-infrared bands). PAN camera was steerable up to ± 26° to acquire images over the same area from multiple orbits to capture topographic features through photogrammetric techniques (Rao et al. 1996b; Jayaraman et al. 2000; Diwakar et al. 2013). The three-tier and unique imaging capability of IRS-1C with enhanced resolution and capability to generate digital elevation model (DEM) has created opportunities to extract information at varied scales of mapping using visual interpretation techniques or conventional to advanced classifiers, and opened up new vistas for diverse applications, including urban and regional studies. This review article illustrates the scale and mapping potential of IRS-1C data for urban and regional areas, data fusion methods and information retrieval based on visual or digital image processing techniques. It further recapitulates the application potential demonstrated in last 25 years in urban and regional studies, and for infrastructure planning.
IRS-1C: Urban and Regional Mapping Potential
The sensors onboard IRS-1C demonstrated the application potential to map earth’s surface at varying resolution and scales, e.g. WiFS data can generate land use/land cover (LULC) at Level-I useful for perspective or regional level applications, whereas the LISS-III can generate the Level-II information at 1:25,000 scale for district/tehsil-level applications. The composite data of LISS-III and PAN can map features at 1:10,000 scale for city-level applications (Gautam 1997; Elghazali 2006). LISS-III and PAN merged data facilitated extraction of Level-II urban features such as urban and rural settlements, and minor water bodies. It additionally permitted to decipher and segregate a couple of Level-III classes such as industrial and recreational areas, and vacant land/layouts. (Rao et al. 2013). IRS-1C data have unlocked avenues to use it for various maps preparation as required for urban or regional planning (Cheng and Toutin 1998). Meinel et al. (1998) reported these data as an ideal vehicle for land use plans preparation and landscape planning, urban structure types and biotopes studies, municipal maps preparation, etc. Figure 1 shows the data processing, information extraction techniques and applications demonstrated using IRS-1C data. Table 2 summarises various studies on information extraction using IRS-1C data and demonstrated applications in urban and regional studies, and infrastructure planning.

IRS-1C data processing, information extraction and demonstrated applications
Image Fusion
The potential applications of remote sensing data in urban studies are strongly dependent on its spatial and spectral resolutions (Sliuzas et al. 2010). Thus for urban studies, merging two datasets with independent advantage of spatial or spectral resolution produces data with best of both characteristics (Saraf 1999). Sanjeevi et al. (2001) analysed the data fusion techniques with IRS-1C LISS-III and PAN images and observed that wavelet transformation appreciably retained the spectral information content (up to 85% of LISS-III data) with superior visual quality as compared to intensity–hue–saturation (IHS), principal component analysis (PCA) and Brovey transformation methods. Park et al. (1999) compared the features of fused images prepared with multi-sensor/multi-resolution data (including IRS-1C PAN) and reported that an enhanced combination of IHS and Brovey transform (3H and 3S) as best image sharpening technique. Park et al. (2001) found the Daubechies wavelet method to be superior as compared to Haar wavelet and IHS transform for multi-resolution image fusion. Teggi et al. (2003) used ‘a tròus’ algorithm for Landsat-TM and IRS-1C PAN data fusion and found it outperformed the conventional fusion techniques with respect to spectral contents preservation. Zhang et al. (2002) utilised the local mean and variance matching algorithm to blend IRS-1C PAN and Landsat ETM + ortho-rectified images. The merged data classification yielded superior results as compared to information obtained from LISS-III image alone.
Dwivedi et al. (1998) compared Radarsat fine beam mode synthetic-aperture radar (SAR) data derived features with information extracted from IRS-1C LISS-III and PAN sensors. The intensity element of IHS transformed LISS-III product was substituted with speckle suppressed Radarsat-SAR data. The urban areas were comparatively easier to detect in Radarsat-SAR image because of high returns from the buildings/complexes acting as corner reflectors. Peinsipp-Byma and Roller (1999) examined the IRS-1C LISS-III and ERS-l data individually or in combination for urban features extraction for a German town, Kiel, and found that features detection with multiple images produced best results, whereas LISS-3 interpretation had lower false alarm rate.
Discussion
Urban and Regional Information Extraction
Urban and rural settlements are identified through contrasts in spectral signatures between vegetation and bare surfaces on remote sensing images. Usually, such image classifiers work in spectral domain, but the contemporary methods also involve spatial descriptors and morphological variability of human settlements. The recently developed image classification methods include both semi-automatic and automatic techniques such as fuzzy classification and spectral mixture analysis. Lu and Weng (2007) have elaborated upon the taxonomy of various image classification methods. Accordingly, the image classifiers are categorised as supervised or unsupervised, parametric or nonparametric, and per-pixel or subpixel classifiers. Following sections describe various algorithms used by researchers to extract information using IRS-1C data.
-
Fuzzy classification Shalan et al. (2003) analysed IRS-1C LISS-III data using fuzzy classification method with PAN as reference image. The three dominant classes within study area of West Bengal state, India, were better discriminated with fuzzy classification than the conventional maximum likelihood classifier.
-
Morphological and neural approaches were used for extracting features from IRS-1C PAN data (Pesaresi and Benediktsson 2000). Benediktsson et al. (2003) reported improved accuracy with three-step-based classification of IRS-1C PAN and IKONOS data of urban areas using morphological and neural methods, i.e. an arrangement of geodesic operations to build a differential morphological profile, discriminant analysis and decision boundary-based feature extraction and a neural network-based technique to characterise the features. Pathak and Dikshit (2005) experimented with artificial neural network (ANN) classification of IRS-1C data and observed that a larger sample size was found superior; overall classification accuracy was not affected by number of neurons in hidden layer; and higher accuracy was achieved by lesser number of epochs.
-
Texture-based approaches Pesaresi (1999) demonstrated the classification performance using large area textural windows and also reported the detection of small textural patches within IRS-1C PAN data. Kontoes et al. (2000) integrated the texture and spatial context properties for the classification of IRS-1C PAN data for Athens (Hellas) city using ANN and kernel reclassification algorithm. The study demonstrated high potential of kernel classifiers to discriminate residential categories on 5 m resolution imagery. Ansari and Buddhiraju (2019) used IRS-1C PAN image for multiresolution strategy-driven texture-based segmentation analysis for slum area identification for a dense mix of slums and formal built-up areas in Mumbai city. The method outperformed the wavelet-based multiresolution analysis method of segmentation with an overall classification accuracy of 91.4–95.4%.
-
Object-based classification Zoleikani et al. (2017) did correlation analysis of pixel and object-based classification of hyperspectral pan-sharpened images (Hyperion and IRS-1C PAN images) for Tehran, Iran, and found that object-oriented procedure presented more accurate outcomes (90.47%) than those obtained by pixel-based classification method (77.33%). It was also observed that Haar wavelet approach has good quality in preserving spectral information as well as spatial information.
-
Spectral mixture analysis (SMA) Rashed et al. (2001) applied SMA with four end-members (vegetation, impervious surface, soil and shade) to an IRS-1C multispectral data and found it superior to other standard classification methods for urban areas. Rashed et al. (2005) later carried out change detection using temporal multi-source data (Landsat-TM and IRS-1C) for modelling urban morphology in Cairo city to highlight land cover change within classes (as opposed to between classes), e.g. vertical growth of buildings, increase in housing density, decrease in open spaces, etc., which is usually reflected by an aggregation of land cover and urban materials.
-
Change detection Spatiotemporal analyses of remote sensing images are useful for understanding urban sprawl and growth (Jensen and Im 2007). Three major approaches are used for change analyses of urban areas: a) image transformation and radiometric values comparison using temporal data; b) classification of temporal dataset; and c) comparison of independent classification performed with temporal data (Bochenek 2005). Bochenek (2005), while working with IRS-1C data, reported that the method of post-classification analysis is the most effective technique for producing change detection maps. Turker and Asik (2005) carried out land-use transition analysis between rural to urban landscape using Landsat-TM and IRS-1C PAN images of Batikent, Ankara, Turkey, utilising a blend of multi-date classification and visual analysis technique. However, the categorisation of smaller undeveloped plots was found as difficult. Jain and Sharma (2019) utilised a nearest neighbourhood classification approach with hierarchical segmentation technique to extract built-up area in some small, medium and large cities of India, and the change analysis was carried out with object-based temporal inversion method. Their investigation revealed a declining pattern in built-up area growth rate in small and medium sized-cities, rather than large cities. Moreover, small and medium cities showed more prominent propensity for scattered development in contrast with large cities.
-
Topographic mapping The ortho-rectification process corrects for terrain induced distortion using DEM for near-perfect representation of terrain features. A DEM is also useful for 3D city modelling, drainage or urban flood analysis, etc. Srivastava et al. (1996) assessed the precision of height determination using IRS-IC stereo data and concluded that for regions having moderate radiometric contrast, the elevation information derived is sufficient for 1:25,000 scale mapping. Rao et al. (2003) evaluated a combination of IRS-1C PAN stereo and ERS-1&2 tandem data for test sites in Koyna and Mumbai cities, India, for DEM generation and concluded that phase unwrapping techniques shall yield better DEM using InSAR technique. Jayaprasad et al. (2002) used IRS-1C PAN stereo data of Alwar, Rajasthan, India, for DEM generation and later to generate contours and extract drainage patterns. Topan et al. (2009) analysed the information contents of panchromatic and multispectral images (including IRS-1C) for Zonguldak test field, Turkey, for large-scale topographic maps generation. The rule of thumb for topographic mapping of at least 0.1 mm ground sample distance in map scale with its maximum limit of 5 m for smaller map scales was confirmed. Zhang et al. (2002) merged Landsat-7 ETM MS and IRS-1C PAN ortho-rectified images using a digital terrain model (DTM) for Greater Kunming Area, Southwest China, to produce a photorealistic 3D map with superior characteristics for urban planning applications. Jacobsen (1999) obtained a ground accuracy of ± 7.l m (X), ± 5.0 m (Y) and ± 9.7 m (Z) with IRS-1C PAN stereo images. A comparison of mapping the same area with SPOT images has shown the advantage of higher-resolution IRS-1C images. Armenakis and Savopol (1998) reported an accuracy between 0.5 and 1 pixel over moderate relief terrain with IRS-1C data, yet the images had low contrast due to 6-bit quantisation, thus making the features identification as difficult task. Kumar et al. (2004) evaluated the DEM and its topographic derivatives produced from IRS-1C PAN stereo data and observed that error in height is higher than planimetry.
Urban Structure and Growth
Urban planners and engineers need information on present and predicted urban growth and urban structure to understand growth trajectories of cities, their underlying systems and to plan for future. Geospatial data and techniques provide reliable information on sprawl and various built-forms, whereas the growth indicators assist in urban growth modelling.
-
Land Use/Land Cover (LULC) information is a prerequisite for optimal land use planning. IRS-1C data helped in 1:250,000 scale district-wise LULC maps generation for land use planning of 15 agro-climatic zones in the country (Rao et al. 1996a). Steinnocher et al. (1999) carried out land use database generation using temporal multi-source (including IRS-1C) data. The geocoding of IRS-1C PAN image was performed by applying a nonparametric approach using second order polynomials with a maximum planimetric error as 0.9 pixel, and the mean error less than 0.5 pixel. Mondal et al. (2015) analysed LULC change (1987–1997) in Kamrup district, Assam, India, and analysed its trend in terms of relative changes, gross gains, gross losses and persistence. Turker and Asik (2005) analysed the land use change at urban–rural fringe using multi-sensor data for Ankara, Turkey. Kaur et al. (2002) used IRS-IC LISS-III and PAN merged data to identify various LULC classes in Delhi, and also to identify the environmentally fragile areas based on their socio-economic attributes, proximity to drainage systems and other attributes. Wurm et al. (2010) used colour-infrared aerial photographs, SPOT panchromatic (1994) and IRS-1C (1998) data for Leipzig city to extract 25 different urban structure types.
Typically, the LULC classifications are based on per-pixel methods which produce outputs with speckled appearance. Smith and Fuller (2001) integrated raster images with vector-based land parcels, and ancillary data to perform contextually enhanced classification on a per-parcel basis. They identified 21 land cover types and its validation against reference land parcel data gave a correspondence of between 85% and 95% depending on the level of class aggregation. Pathak and Dikshit (2004) obtained improved classification accuracy up to 25% with per-field (segment) classification as compared to the conventional per-pixel approach using IRS-1C data. Short-wave infrared (SWIR) band further helped in features discrimination for classes with higher heterogeneity.
-
Impervious surface analysis The variation in material and land cover types, and the complexity of urban morphology create challenges in remote sensing data analysis. Ridd (1995) introduced the concept of vegetation–impervious surface–soil (V–I–S) for analysing urban/peri-urban milieus. The method suggested that depending on the interplay between spatial resolution and complexity of urban environment (object size), a given pixel may be pure (100%) V, I or S, or mixed, i.e. a combination of three types and/or water. Rashed et al. (2001) analysed IRS-1C data with V–I–S model for Greater Cairo using end-member fractions. The shade was also added as an end-member to accommodate the shadowing effect of tall buildings, a common feature in large cities, and usually grouped spectrally with water as dark objects. It was reported that the spectral mixture analysis/decision tree fractions produced more accurate output than either the maximum likelihood or minimum distance to means techniques. Hamdi (2010) analysed the changes in impervious surfaces using temporal IRS-1C data and aerial ortho-photographs with 1 ha of minimum mapped area for artificial surfaces and 3 ha for other surfaces, and reported that percentage of impervious surfaces has increased from 26% (1955) to 39% (1985).
-
Landscape metrics and Entropy Landscape metrics are used to numerically describe landscape structure. Kirstein and Netzband (2001) evaluated the landscape metrics for regional studies of Leipzig and Hanover cities, Germany, using IRS-1C data. Sudhira et al. (2004) studied the sprawl of Mangalore city, India, over 3 decades using IRS-1C LISS-III data with landscape metrics and predicted nearly 106% urban growth by year 2050 as compared to the current sprawl of 61.77 km2. Jain et al. (2013) analysed the landscape pattern of Dehradun city and surroundings using Landsat-TM (1986) and IRS-1C/1D LISS-III (1998 and 2011) data using Fragstatsver 4.1 software and reported a three-fold increase in the built-up area with drastic decrease in river/water body and open spaces during 1986–2011.
The urban sprawl analyses through ‘Entropy Approach’ have been attempted using temporal remote sensing data. Lata et al. (2001) quantified the trend of urban sprawl with Entropy using IRS-1C PAN-sharpened data where its larger value manifested the urban sprawl. Jha et al. (2008) analysed IRS-1C images during 1989–2002 to assess the spatial extent and direction of urban development in Haridwar, India, with Entropy approach. The dispersed pattern of land development indicated towards a higher degree of unplanned urban development which needs due attention. Ramachandra and Kumar (2009a) reported a higher degree of built-up dispersion in Bengaluru city using the Shannon’s entropy technique. It was also reported that the urbanisation has also increased the runoff by 2 to 6 times and land surface temperature due to higher degree of anthropogenic activities.
-
Urban sprawl and growth modelling It is imperative to predict the urban growth to regulate urban sprawl, so that future urbanisable areas should have adequate facility and infrastructure. Gupta (2013) analysed the urban growth in Dehradun city based on eight-directional wind rose scheme using multi-source remote sensing data (including IRS-1C) and reported that city has grown 160% in size from 1987 to 2008. Fazal (2000) used IRS-1C data for assessing rural–urban land use transition in Saharanpur city and highlighted the nature of land use changes. Parveen and Kulkarni (2019) used IRS-1C LISS-III data and supervised fuzzy classification method for Kalaburagi city, India, and reported 5.53% area under urban LULC change with 80% overall accuracy and 0.78 as kappa coefficient. Nigam (2000) used IRS-1C data for assessing the land use transition between urban and peri-urban areas for Enschede City, The Netherlands, from 1993 to 1998 with a minimum mapping unit of 5 mm × 5 mm at 1:25,000 scale using visual interpretation technique. Barranco et al. (2014) derived LULC data from multi-source remote sensing images (including IRS-1C) of European cities for urban growth analysis with a reference scale of 1:10,000 and a minimum mapping unit of 0.25 hectare for artificial surfaces, and 1 hectare for all other classes. The positional accuracy was observed as ± 5 m and thematic accuracy as 80%.
Cellular automata (CA) has been used to model future urban growth. Nadoushan et al. (2012) used the CA-Markov to forecast the non-built-up to built-up transition using multi-source remote sensing images (including IRS-1C PAN) of 5 decades for Arak city, Iran. Maithani (2010) simulated future urban growth for an Indian city using the CA model, where the multi-criteria evaluation technique was used to build relationship between future urban growth potential and site attributes. ANN method can be used for urban growth prediction to reduce the subjectivity involved with conventional approaches. Maithani et al. (2010) used a feed forward multilayer perceptron-based ANN architecture for urban growth analysis in Dehradun city, India. Figure 2 shows the predicted urban growth in Dehradun during (a) 1997–2000 and (b) 2001–2005 time-frame using IRS-1C LISS-III data. Maithani (2015) developed a model for Doon valley using IRS LISS-III data products of year 2001, 2005 and 2009 in response to baseline, compact and hierarchical growth scenarios. Mondal et al. (2016) carried out statistical independence test and validity of CA Markov process for projecting future LULC changes using multi-resolution and temporal satellite data (including IRS-1C LISS III image).
Fig. 2 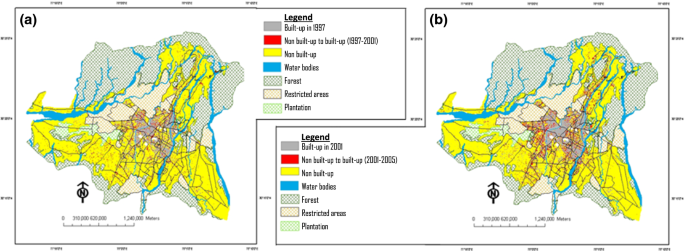
Source: Maithani et al. (2010)
Urban growth in Dehradun during a 1997–2000 and b 2001–2005.

Urban Plans and Cadastre
In urban areas and its surroundings, the problems related to rapid LULC transformation are very pronounced. Remote sensing data is immensely useful for creating database as required for urban and regional plans preparation and geographic information system (GIS) tools can be effectively utilised for data integration and analyses. Banzhaf and Netzband (2000) assessed the feasibility of using IRS-1C&1D data for urban planning activities such as understanding urban structure types and biotopes, surface-sealing surveys, municipal survey maps, land use plans updation and working maps preparation for landscape planning.
-
Regional plan These plans are prepared for metro regions, city/town conurbation and special economic zones. In a significant study carried out for the regional planning of National Capital Region (NCR), Delhi, following GIS database were prepared: a) LULC proposed for year 2021, b) identifying zones for implementing various developmental policies, c) settlement plans for years 2001 and 2021, d) transport plan (road and rail) for years 2001 and 2021, e) groundwater rechargeable areas and f) environmentally sensitive zones delineation (Rao et al. 2013). Tapiador and Casanova (2003) prepared the regional planning directives for Segovia, Spain, using Landsat-TM, IRS-1C/1D PAN and aerial oblique photographs. Improved synthetic variable ratio method was used for data fusion, and a neural network was employed for image classification.
-
Master and Development Plan Since remote sensing data and GIS can contribute significantly in Development Plans preparation, a study was carried out using IRS-1C PAN and LISS-III merged data to prepare Development Plan-2011 for Ahmedabad city (AUDA 1997). This study has helped in identifying suitable areas for urbanisation, growth of urban agglomeration, minimise the loss of productive agricultural land due to urban sprawl, land encroachment/illegal occupation, areas suitable for development of water resources, areas for greenery preservation, high erosion prone areas and suggested methods for conservation, etc. Draft Master Plan for Hyderabad Metropolitan area using IRS-1C (PAN and LISS-III) merged data was prepared for Hyderabad Urban Development Authority (HUDA) for year 2020 with following objectives: a) base maps updation, b) existing land use mapping on 1:12,500 scale, c) land use register (proposed and existing) and d) allied digital database creation. Similarly, the Master Plan/Zonal Development Plans for Poppalguda zone in HUDA was prepared using GIS techniques (Rao et al. 1998, 2013). Davudirad et al. (2016) analysed the impact of Development Plans on hydrological changes in Shazand Watershed, Iran. The flow durations, sediment rating curves and trend analyses for pre- and post-development period indicated the distinct variations.
-
Deviation from Master Plan Dutta (2012) assessed the land use change using multi-source temporal data (including IRS-1C) in urban and peri-urban areas of Lucknow city, India, to understand the land use deviation from Master Plan-2021. The analysis revealed following trends between 1997 and 2010: a) urban densification in central core areas at the expense of vacant land and water bodies and b) urban expansion in peri-urban/suburban areas on crop land and pastures.
-
Cadastral applications Rao et al. (1996b) highlighted the cadastral applications of IRS-1C data on 1:12,500 scale and suggested that LISS-III and PAN merged data can be co-registered with cadastral maps and better than one-pixel accuracy can be achieved. It was perceived that both voids (filled with structures) and non-voids (vacant lands) can be delineated on a plot by plot basis.
Urban Environment
The urban environmental parameters such as land surface temperature, urban green spaces (UGS) and extent of water bodies can be studied using remote sensing data. The natural or man-made hazards or disasters and the vulnerability analysis can also be analysed with such data which helps in identifying the locations which are at risk from hazards. Further, post-disaster analysis, for example, the extent of flooding and related damages can also be assessed using remote sensing data. Kumar et al. (2019) evaluated multi-source remote sensing data for understanding urban environment in Northwest Himalaya and the role of Geospatial technology.
-
Urban green spaces Vegetation richness and their distribution are important determinants of urban environmental characteristics. Weeks et al. (2005) used IRS-1C data and SMA technique to assess UGS and the percentage of impervious material in Cairo, Egypt, with an objective to build an index to rapidly analyse the dynamic characteristics of urban spaces. Rafiee et al. (2009) carried out a study for Mashhad city, Iran, to analyse the extent and pattern of UGS using Landsat TM and IRS LISS-III data based on landscape ecology principles and functioning of the green spaces. Kirstein and Netzband (2001) estimated the UGS as per ring-sector-model using IRS-1C LISS-III data to analyse intra-regional occupation commuter relations in Switzerland. They observed that the extent of small trees and bushes in suburban landscape is very poor and these are distributed in regular manner around city centres. Faryadi and Taheri (2009) assessed the effects of UGS dispersal and density on environmental quality in Tehran city and its surroundings based on green space per capita and vegetation cover density measured as ecological indices. Parveen et al. (2018) used Normalised Difference Vegetation Index (NDVI) and colour-based vegetation extraction for UGS analysis. The study showed that NDVI output was threshold dependent, whereas the proposed colour-based feature extraction was an automatic method with higher accuracy.
-
Solid waste management Rokade (2019) used multi-source data (including IRS-1C PAN) for GIS-based landfill sites selection in southern part of Jalgaon city by converting input layers (LULC, soil, wastelands, geology, road, etc.) into binary coverage, where class-1 and 0 indicated favourable and unfavourable classes, respectively. Azimov and Shevchuk (2020) explored the pollution factors from municipal solid waste (MSW) landfill areas and their surroundings using IRS-1C/1D data of Kyiv’s Oblast and the results highlighted the unfavourable sites being used as waste disposal landfills. Dikshit et al. (2001) utilised IRS-1C data to propose six potential landfill sites in Nilgiri block of Balasore district, Orissa, India, by considering the availability of cover material and land cost. Pandey (2012) carried out the waste disposal sites selection for Gondia Municipal Council using multi-source data (including IRS-1C LISS-III) with an objective to identify landscape which is functionally non-hazardous, environmental protective and economically viable. Natesan and Suresh (2002) utilised IRS-1C LISS-III derived GIS layers along with ancillary data for landfill sites selection and concluded that ANN produced better results and reduced uncertainty in fixing the importance of decision factors, which exists in analytical hierarchy process (AHP) and factor importance coefficient (FIC) methods. Seker et al. (2010) used multi-source data (including IRS-1C PAN) to visualise the differences between reserved area and utilised territory of landfill sites and reported that the spatial and temporal analyses have added important capability towards waste-disposal management.
-
Urban heat islands Arathyram and Rao (2013) found a positive correlation between urbanisation trend assessed from optical data (IRS-1C PAN for 1997 and Cartosat-1 for 2011) and the extent of Urban Heat Island (UHI) phenomenon. They reported that UHI intensity of higher than 1°K indicates significant thermal modification and the study area was characterised by large temperature differential. Hamdi (2010) analysed the UHI effects for Uccle (Brussels, Belgium) based on urban parameterisation and impervious surfaces fraction analysis using IRS-1C PAN images.
-
Air quality and pollutants dispersion The real-time modelling (as a hypothesized case) of atmospheric dispersion from a nuclear power plant in Lithuania as an accidental nuclear release was analysed by Hasager and Thykier-Nielsen (2001) using IRS-1C LISS-III data. They reported that 1-km resolution is adequate for real-time deposition modelling. Sundaram (2011) analysed the green-cover associated parameters, namely hydrological processes regulation, air quality and microclimatic amelioration based on LULC derived from IRS-1C/1D data for Chennai city. The study outcome confirmed the difference in city’s environmental performance between 1997 and 2001, and in some parts of the city, due to green-cover change, the extent of modification was nearly 38%.
-
Water quality The physical, chemical and biological deterioration of urban water bodies is drawing the attention worldwide. Tripathi and Singh (2000) carried out spectral reflectance analysis to determine the concentration of chlorophyll-A and suspended solids, and secchi depth in upper lake, Bhopal, India, and later IRS-1C LISS III data was used for pollutants zonation. Hwang et al. (2007) examined whether the shape complexity of reservoirs moderate the land use impact on water quality (chemical and biological oxygen demand, total nitrogen and phosphorus) of adjacent reservoirs. Land-use types within a 1-km buffer region of randomly sampled 153 reservoirs were analysed with fractal dimensions using Landsat-TM and IRS-1C PAN data. Shukla et al. (2020) emphasised that for sustainable development in a river basin, it is pertinent to understand LULC transformations (which was derived from Landsat ETM + and IRS-1C LISS-III data)—population growth—water quality nexus. Various parameters such as hardness, CaCO3 and total dissolved solids, biological oxygen demand, chlorides, coliform total, colour, dissolved oxygen%, pH and turbidity were studied to conclude that the urbanisation greatly pollutes the water quality. Ramachandra and Mujumdar (2009) used multi-source remote sensing data (Landsat, IRS LISS-III and MODIS) for long-term analysis of water bodies in Greater Bengaluru and reported 466% increase in built-up area from 1973 to 2007 leading to 61% area reduction in water bodies. Kim et al. (2016) investigated the effects of streamline complexity on urban land use and ecological communities using various biological indicators for 80 sampling sites in Nakdong River, Korea, and observed that greater streamline complexity could enhance the biochemical effects of edges and littoral zones, resulting in enhanced ecological conditions of streams.
-
Urban hazards Markandeya and Suryanarayana (2009) analysed urban floods in municipal area of Hyderabad, India using IRS (LISS-III + PAN) data. Maathuis et al. (1999) mapped the physical expansion of Dhaka city, Bangladesh, using temporal multi-source data (including IRS-1C PAN) and prepared flood extent maps with ground level ranging from 2.0 m to 8.5 m at 0.5 m interval. Suribabu and Bhaskar (2015) used the temporal IRS data (1A/B/C, P6 and Cartosat) for urban growth analysis of Tiruchirapalli city, India, and to assess its impact on surface runoff. The study revealed that the impact of LULC change is more significant for longer duration storm than short duration storm. Rahman (2006) used a combination of RADARSAT-SAR and IRS-1C LISS-III images for studying the spatial extent and temporal pattern of flood inundation and damage assessment. It was reported that 29.63% of geographical area was flooded during the flood event of year 2003. Pandey et al. (2018) analysed the damages from slow-rise flood depth based on lateral pressure for sustainable drainage systems planning of Gondia city, India and examined the lateral pressure from flood depth differential between the inside and outside of a residence and flood velocity. Zavala and Chuvieco (2003) used textural features to derive construction fragility maps from digitally classified IRS-1C image to study seismic vulnerability of Arica city in Chile. The buildings height estimation was done and verified for 20 buildings with an average error of 1.5 m. The homogeneity and dissimilarity-based texture measurements were computed from IRS-1C image and the derived images along with original digital values, and heights were used to discriminate construction quality levels.
Infrastructure Planning
Remote sensing data provide cost-effective information for infrastructure planning, and GIS helps in the data integration (spatial and non-spatial data) for spatial analysis to support the decision process. Thus, the geospatial techniques help in carrying out the feasibility study of route alignment along a proposed corridor based on cost or impedance of influencing factors falling along its path or the multi-criteria driven site suitability analysis.
-
Transportation analysis IRS-1C (LISS-III and PAN merged) data were used for preparing the transport network map for a part of Ahmedabad city (Raghavswamy et al. 1996) on 1:15,000 scale which contained major and minor roads and intersections, crossings and bridges, railway lines, etc. Pundir and Garg (2020) assessed the terrain conditions for off-road trafficability assessment for corridor planning during military operations which was performed by evaluating the relative direct and in-direct parameters extracted from IRS-1C/1D and ancillary data, and terrain characteristics. Rajaram et al. (2001) carried out environmental impact assessment of Konkan railway alignment in India using temporal IRS data and ground information on air and water quality and reported that the environmental conditions have not changed significantly. In another study, the detailed urban land use pattern along the proposed route on 1:12,500 scale was analysed for routing and feasibility study of Bangalore Elevated Light Rail Transit System. The planning of International Airport near Devanahalli, north of Bangalore, was done with a large-scale data and baseline information on natural resources prepared for the 10 planning districts (Rao et al. 1998). In another endeavour, a feasibility study for expressway between Bengaluru and Mysore cities, India, was carried out using IRS-1C PAN and LISS-III merged data and about 15 locations were identified on the expressway for development into counter magnet townships. Chaudhuri and Samal (2008) carried out a study to detect bridges over water bodies based on knowledge-based approach which exploited the spatial arrangement of bridges and their surroundings. The algorithm designed was tuned to the IRS-1C/1D satellite imagery which can also be adjusted for higher-resolution satellite imagery.
-
Power plants and transmission analysis A route alignment study of power transmission line between Teesta-V hydroelectric power plant (HEP), Sikkim and New Siliguri town in West Bengal, India, was conducted using the remote sensing data and collateral data, topographical maps, ground traverses to identify three most feasible routes based on ‘maximum avoidance’ criteria (Fig. 3). The final route selected had a ground distance of 106.05 km between Teesta and New Siliguri towns (Rao et al. 2013). Uniyal et al. (2016) utilised IRS datasets (including IRS-1C LISS-III) for lineaments identification around Meja Thermal Power Plant site in Allahabad, Uttar Pradesh, India.
Fig. 3 
Source: Rao et al. (2013)
Route alignment study of Teesta-V HEP to New Siliguri Transmission line.
-
Tele-geoinformation service Talukdar (1999) reviewed the geospatial applications in tele-services and described it as a potential tool for decision-making for the twenty-first century. He demonstrated its potential using IRS-1C PAN and SPOT-HRV multispectral data for parts of Delhi, India using an automatic object extraction method. Muralikrishnan et al. (2007) studied a planning strategy for establishing a network of mobile communications towers using the IRS-1C LISS-III and PAN stereo data and identified fifty-six cell towers using parameters such as elevation, slope, land use, population, cost, etc. Richter et al. (2006) used the ‘EuroMaps’, a high-resolution natural colour composite mosaic for Germany built from IRS-1C/1D data to produce urban land use for universal mobile telecommunications system services.
-
Industrial area planning The industrial corridors need good connectivity, energy distribution systems, piped network, etc. The spatial pattern of land use dynamics in two major industrial corridors (Mumbai–Pune and Chennai–Mangalore) in India with growth prediction was done with CA–Markov model (Ramachandra et al. 2019). It was found that a segment size of 25 km was optimal to understand the spatial patterns of landscape dynamics. This study helped in analysing the future urban growth to evolve appropriate management strategies to mitigate its environmental impacts.
-
Facilities management Facilities management of an urban set-up calls for analysing existing urban features and their integration with collateral information for efficient planning. Sebastian et al. (1998) used IRS-1C (LISS-III and PAN) data for facility management in an urban environment using various social and environmental parameters.

Archeology
Satellite data have remarkable applications in landscape archaeology. It is used for identifying historical human settlements or archaeological sites based on soil and crop marks as seen on satellite images. The paleo-drainage courses in Saraswati basin, India, was studied using remote sensing data by Gupta et al. (2004). It was observed that the river Sarasvati had its course through Ghaggar basin and did not pass along the Aravalli hills. The study suggested towards rise in Himalaya/Siwaliks and consequent displacements in the Siwaliks and its foot hills region (in the form of Yamuna and Sutlej tear faults) as the main cause for drainage desiccation and disappearance of river Sarasvati. A comprehensive management plan for cultural resources management at Hampi, Karnataka, India, was undertaken using IRS PAN and LISS-III merged data for baseline resource inventory, parcel-wise land use, identification of major monuments and site-management plan for conservation and development of the site (Fig. 4).

Source: Ravindranath and Raj (2005)
Cultural resources management for ruins of Hampi world heritage site, Karnataka, India.
IRS: Data and Applications beyond IRS-1C
Urban environments are portrayed by complex and dynamic physical and socioeconomic attributes that vary in time and space. The ability to map, monitor and analyse such attributes from remote sensing data immensely relies upon the attributes of imaging instruments. Since the launch of IRS-1A satellite, the Earth Observation (EO) capabilities demonstrated by IRS satellites have increased manifolds. The IRS-1C and its follow-on IRS-1D, the second-generation remote sensing satellites were built with three-tier imaging capability based on the experiences gained with IRS-1A/1B data. Later, the IRS-P6/Resourcesat-1 (RS-1) and its follow-on Resourcesat-2 (RS-2) satellite carried onboard the improved three-tier imaging system where the LISS-III camera had improved SWIR band with 23.5 m resolution as compared to 70 m earlier with IRS-1C/1D; AWiFS sensor (56 m resolution) upgraded from WiFS (188 m resolution) with four bands (including SWIR) instead of two bands earlier; and three band LISS-IV with 5.8 m resolution (Samudraiah 2013). The Cartosat-1 satellite with stereoscopic capability has Fore and Aft cameras providing concurrent views of earth’s surface with 2.5 m resolution. The Technology Experiment Satellite (TES) with panchromatic band provided meter class imagery as needed for large-scale mapping which was carried forward in Cartosat-2 series satellites. The recently launched Cartosat-3 satellite is a third-generation agile and advanced satellite having high-resolution imaging capability. The RISAT series was launched with microwave-based sensors to provide remote sensing data with all-weather day & night capability. Thus, for the last 4-decades, the low- to high-resolution data from IRS-1A/1B, IRS-1C/1D, Resourcesat-1/2 and Cartosat-1/2 satellites have provided data with proven applications in urban and regional studies.
IRS-1A/1B satellites were widely used for land use mapping (with Level-1 capability), monitoring urban sprawl, change detection and urban demographic studies (Rao et al. 2013). The IRS-1C/1D satellites enhanced the capability to extract urban features up to Level-II. It additionally permitted to interpret and discriminate a few of Level-III classes at 1:12,500 scale. SWIR band further helped in features discrimination for classes with higher heterogeneity. Resourcesat-1 (IRS-P6) satellite has further enhanced the capabilities in carrying out many urban-related applications and infrastructure studies. Its LISS-IV data provided a good alternative to IRS-1C/1D (PAN + LISS III) merged product as detailed LULC with field boundaries at Level-III and road network up to Level-II could be extracted with improved accuracy. Cartosat-1 satellite has helped in generating baseline DEM and ortho-products at national level, and also facilitated drainage network analysis, applications in Master Plan formulation and infrastructure planning. Cartosat-1 & 2 series of satellites have enabled cartographic and thematic maps preparation at 1:10,000 scale and updating capability up to 1:5,000 scale (Rao et al. 2013).
As the urban environment is a complex ensemble of man-made features, vegetation, soils and others; the spatial, spectral and radiometric resolutions should be considered concurrently to achieve highest possible separability of features of interest. The spatial resolution required for a given study could be determined by the size of smallest target objects (Cowen and Jensen 1998). Herold and Roberts (2010) distinguished 14 spectral bands most appropriate for distinguishing urban land cover classes. These bands are dispersed across the visible and near-infrared spectral range and the sensors on-board IRS series of satellites mostly cover this spectral range. The temporal resolution of IRS series of satellites of relevance to urban and regional applications ranges from 5 to 24 days. While this resolution is generally sufficient, the availability of usable, cloud-free data may actually be significantly lower, e.g. the number of usable images per year may be as low as one for cities in humid climatic zones (Rashed and Jürgens 2010). In such cases, the utilisation of RISAT data which can penetrate cloud cover is an alternative, either as a solitary information source or in combination with optical data. In terms of radiometric resolution, the 6-bit quantisation tends to have saturation, impeding discrimination of urban environment features due to insufficient contrast (Jensen and Cowen 1999). However, the sensors following the IRS-1C PAN have payloads that produce output images equal or better than 7-bit quantisation level. The recently launched (November 2019) Cartosat-3 satellite, the third-generation agile and advanced satellite holds promise to provide larger scale maps useful for comprehensive urban planning at city to ward level. In the near future, the high-resolution satellite (HRSAT) with three satellites constellation and specific viewing capability shall provide not only high-resolution imagery of 1 m, but will also have Longwave Infrared channels (LWIR) to cater to day and night monitoring requirements. The future mission of Resourcesat-3S, with multi-view panchromatic stereoscopic capability having high spatial resolution of 1.25 m shall further enhance the capability towards large-scale urban plans preparation. Indian Space Research Organisation (ISRO) has also built specific sensors with high-resolution and hyperspectral imaging from aerial platforms. The present suit of sensors includes multi-view panchromatic, visible and near-infrared (VNIR) multispectral and VNIR hyperspectral instruments. Both panchromatic and multispectral sensors generate imageries with approximately 30 cm spatial resolution from an altitude of 6 km (Misra 2017).
Conclusions
The remote sensing images along with collateral data are immensely useful to understand the extent and the pattern of urban sprawl, and their growth analysis. In the absence of such information and desirable planning interventions, most of the sprawled areas lack basic infrastructure facilities. The IRS-1C and its follow-on IRS-1D, the second-generation remote sensing satellites were built with three-tier imaging capability based on the experiences gained with IRS-1A/1B data. Over the last 25 years, IRS-1C data have provided valuable insights into the variety of issues faced by cities and their environment. The studies conducted have demonstrated the application potential to map urban and regional areas at varying scales ranging from perspective or regional level applications supported by WiFS data to city-level applications by the composite data of LISS-III and PAN sensors. The level of details in maps produced also varied as WiFS was helpful to generate Level-I LULC information and LISS-III and PAN merged data facilitated Level-II/III details. The merged data produced from LISS-III and PAN sensors with independent advantages of their spectral and spatial resolution using conventional to advanced algorithms produced the enhanced data. The information from IRS-1C data was extracted with either visual interpretation techniques or digital classifiers such as supervised or unsupervised, parametric or nonparametric, and per-pixel or subpixel algorithms. Thus, the IRS-1C data found wide usage for base map preparation, urban land use survey, UGS and open space mapping, monitoring urban and peri-urban dynamics, land use zoning, and planning of utilities and infrastructure, etc., as revealed through several studies conducted in India and other parts of the world. It has also provided valuable information on urban environment to manage UGS, to mitigate urban hazards and to improve the quality of life of urban dwellers. In later years after IRS-1C/1D satellites, other satellites with varying resolution and imaging capabilities have been launched by ISRO which have data with proven applications in urban and regional studies. The recently launched Cartosat-3 and the forthcoming satellites holds promise to derive 2D/3D information at much larger scale and enhanced features distinction capabilities for Master Plan/Municipal Plan/Zonal Plan and other detailed town planning schemes.
References
Ansari, R. A., & Buddhiraju, K. M. (2019). Textural segmentation of remotely sensed images using multiresolution analysis for slum area identification. European Journal of Remote Sensing, 52(sup2), 74–88.
Arathyram, R. K., & Rao, V. (2013). Characterisation of urban heat islands in one of the most urbanised corridors of India from space based multi-sensor, spatio-temporal data. In AGSE 2013 ‘Geospatial Momentum for Society and Environment’. Ahmedabad, Gujarat, India: Applied Geoinformatics for Society and Environment.
Armenakis, C., & Savopol, F. (1998). Mapping potential of the IRS-1C PAN satellite imagery. International Archives of Photogrammetry and Remote Sensing, 32, 23–26.
AUDA. (1997). Revised development plan of Ahmedabad Development Authority area-2011, Vol.1: Remote Sensing and GIS approach. Technical Report: SAC/RSAG/TR/12.
Azimov, O. T., & Shevchuk, O. V. (2020). Geoinformation systems in monitoring studies of environmental pollution factors in the areas of municipal solid waste landfills. Geoinformatics: Theoretical and Applied Aspects, 2020(1), 1–7.
Banzhaf, E., & Netzband, M. (2000). Analysis and evaluation of nature space potential in peri-urban spaces using remote sensing data and GIS. International Archives of Photogrammetry and Remote Sensing, 33(B7/1; PART 7), 118–125.
Barranco, R. R., Silva, F. B. E., Marin Herrera, M., & Lavalle, C. (2014). Integrating the MOLAND and the urban atlas geo-databases to analyse urban growth in European cities. Journal of Map & Geography Libraries, 10(3), 305–328.
Benediktsson, J. A., Pesaresi, M., & Amason, K. (2003). Classification and feature extraction for remote sensing images from urban areas based on morphological transformations. IEEE Transactions on Geoscience and Remote Sensing, 41(9), 1940–1949.
Bochenek, Z. (2005). Application of various change detection methods for analysis of urban environment. In New Strategies for European Remote Sensing, Oluiþ (ed.), Millpress, Rotterdam.
Chaudhuri, D., & Samal, A. (2008). An automatic bridge detection technique for multispectral images. IEEE Transactions on Geoscience and Remote Sensing, 46(9), 2720–2727.
Cheng, P., & Toutin, T. (1998). Unlocking the potential for IRS-1C data. Earth Observation Magazine, 7(3), 24–26.
Cowen, D. J., & Jensen, J. R. (1998). Extraction and modeling of urban attributes using remote sensing technology. In D. Liverman, E. F. Morna, R. R. Rindfuss, & P. C. Stern (Eds.), People and pixels: linking remote sensing and social science (pp. 164–188). Washington, DC: National Academy Press.
Davudirad, A. A., Sadeghi, S. H., & Sadoddin, A. (2016). The impact of development plans on hydrological changes in the Shazand Watershed, Iran. Land Degradation & Development, 27(4), 1236–1244.
Dikshit, A. K., Padmavathi, T., & Das, R. K. (2001). Locating potential landfill sites using geographic information systems. Journal of Environmental Systems, 28(1), 43–54.
Diwakar, P. G., Raghavaswamy, V., Saha, S. K., Kiran Kumar, A. S., Dadhwal, V. K., & Shivakumar, S. K. (2013). Indian remote sensing satellite series and applications: a saga of 25 years. Bulletin of National Natural Resources Management System, NNRMS (B)-37.
Dutta, V. (2012). Land use dynamics and peri-urban growth characteristics: Reflections on master plan and urban suitability from a sprawling north Indian city. Environment and Urbanization Asia, 3(2), 277–301.
Dwivedi, R. S., Satyanarayana, P., Rao, C. V., & Manjunath, A. S. (1998). Evaluation of RADARSAT SAR data for detection of terrain features. International Archives of Photogrammetry and Remote Sensing, 32, 196–203.
Elghazali, E. S. (2006). Assessment of Indian satellite (IRS-1C) imagery for production of 1: 25,000 planimetric city maps. ISPRS WG VIII/10 Workshop, Part-7.
Faryadi, S., & Taheri, S. (2009). Interconnections of urban green spaces and environmental quality of Tehran. International Journal of Environmental Research, 3(2), 199–208.
Fazal, S. (2000). Urban expansion and loss of agricultural land—A GIS based study of Saharanpur City, India. Environment and Urbanization, 12(2), 133–149.
Gautam, N. C. (1997). IRS-1C applications for land use/land cover mapping, change detection and planning. In IGARSS’97: IEEE international geoscience and remote sensing symposium proceedings. Remote Sensing—A Scientific Vision for Sustainable Development, 4 (pp. 1775–1777).
Gupta, A. K., Sharma, J. R., Sreenivasan, G., & Srivastava, K. S. (2004). New findings on the course of river Sarasvati. Journal of the Indian Society of Remote Sensing, 32(1), 1–24.
Gupta, K. (2013). Unprecedented growth of Dehradun urban area: a spatio-temporal analysis. International Journal of Advanced Remote Sensing and GIS Geography., 1(2), 6–15.
Hamdi, R. (2010). Estimating urban heat island effects on the temperature series of Uccle (Brussels, Belgium) using remote sensing data and a land surface scheme. Remote Sensing, 2(12), 2773–2784.
Hasager, C. B., & Thykier-Nielsen, S. (2001). IRS-1C LISS-III land cover maps at different spatial resolutions used in real-time accidental air pollution deposition modelling. Remote Sensing of Environment, 76(3), 326–336.
Herold, M., & Roberts, D. A. (2010). The spectral dimension in urban remote sensing. Remote sensing of urban and suburban areas (pp. 47–65). Dordrecht: Springer.
Hwang, S. J., Lee, S. W., Son, J. Y., Park, G. A., & Kim, S. J. (2007). Moderating effects of the geometry of reservoirs on the relation between urban land use and water quality. Landscape and Urban Planning, 82(4), 175–183.
Jacobsen, K. (1999). Geometric and information potential of IRS-1C PAN-images. In IEEE International geoscience and remote sensing symposium. IGARSS’99 (Cat. No. 99CH36293), 1 (pp. 428–430).
Jain, G. V., & Sharma, S. A. (2019). Spatio-temporal analysis of urban growth in selected small, medium and large Indian cities. Geocarto International, 34(8), 887–908.
Jain, S., Laphawan, S., & Singh, P. K. (2013). Tracing the changes in the pattern of urban landscape of Dehradun over last two decades using RS and GIS. nternational Journal of Advanced Remote Sensing and GIS, 2, 351–362.
Jayaprasad, P., Narender, B., Arya, A. S., & Ajai. (2002). Extraction of terrain parameters from IRS-1C PAN stereo data using photogrammetric techniques. Current Science (pp. 333–337).
Jayaraman, V., Srivastava, S. K., Raju, D. K., & Rao, U. R. (2000). Total solution approach using IRS-1C and IRS-P3 data. IEEE Transactions on Geoscience and Remote Sensing, 38(1), 587–604.
Jensen, J. R., & Cowen, D. C. (1999). Remote sensing of urban/suburban infrastructure and socio-economic attributes. Photogrammetric Engineering and Remote Sensing, 65, 611–622.
Jensen, J. R., & Im, J. (2007). Remote sensing change detection in urban environments. In Geo-spatial technologies in urban environments (731). Springer, Berlin.
Jha, R., Singh, V. P., & Vatsa, V. (2008). Analysis of urban development of Haridwar, India, using entropy approach. KSCE Journal of Civil Engineering, 12(4), 281–288.
Joseph, G. (1996). Retrospective and prospective of remote sensing in India. Journal of the Indian Society of Remote Sensing, 24(3), 133–144.
Kaur, A., Banger, S. K., Jain, N., Kumar, P., & Manchanda, M. L. (2002). Study on environmentally fragile areas of Delhi using remote sensing & GIS technology. Environmental Pollution and Agriculture (p. 455).
Kim, J. A., Lee, S. W., Hwang, G. S., Hwang, S. J., Kim, C., & An, K. J. (2016). Effects of streamline complexity on the relationships between urban land use and ecological communities in streams. Paddy and Water Environment, 14(2), 299–312.
Kirstein, W., & Netzband, M. (2001). Landscape metrics as a tool for the comparison of different urban regions (p. 35). Regensburger Geographische Schriften: Remote Sensing of Urban Areas/Fernerkundung in urbanen Räumen.
Kontoes, C. C., Raptis, V., Lautner, M., & Oberstadler, R. (2000). The potential of kernel classification techniques for land use mapping in urban areas using 5 m-spatial resolution IRS-1C imagery. International Journal of Remote Sensing, 21(16), 3145–3151.
Kumar, P., Kumar, S., & Manchanda, M. L. (2004). Satellite stereo data for DEM surfaces and derivatives. Journal of the Indian Society of Remote Sensing, 32(1), 81–90.
Kumar, P., Siddiqui, A., Gupta, K., Jain, S., Bharath, B. D., & Maithani, S. (2019). understanding urban environment in northwest Himalaya: Role of geospatial technology. In Remote Sensing of Northwest Himalayan Ecosystems (pp. 403–431). Springer, Singapore.
Lata, K. M., Rao, C. S., Prasad, V. K., Badrinath, K. V. S., & Raghavasamy, V. (2001). Measuring urban sprawl: A case study of Hyderabad. GIS Development, 5(12), 26–29.
Lu, D., & Weng, Q. (2007). A survey of image classification methods and techniques for improving classification performance. International Journal of Remote Sensing, 28(5), 823–870.
Maathuis, B. H. P., Mannaerts, I. C., & Khan, N. N. I. (1999). Evaluating urban stormwater drainage using GIS and RS techniques—A case study in Dhaka, Bangladesh. Geocarto International, 14(4), 21–32.
Maithani, S. (2010). Cellular automata based model of urban spatial growth. Journal of the Indian Society of Remote Sensing, 38(4), 604–610.
Maithani, S. (2015). Neural networks based simulation of land cover scenarios in Doon valley, India. Geocarto International, 30(2), 163–185.
Maithani, S., Arora, M. K., & Jain, R. K. (2010). An artificial neural network based approach for urban growth zonation in Dehradun city, India. Geocarto International, 25(8), 663–681.
Markandeya, K., & Suryanarayana, G. (2009). Urban floods: Case study of Hyderabad. Disaster & Development: Journal of the National Institute of Disaster Management, 3(2), 121–138.
Meinel, G., Lippold, R., & Netzband, M. (1998). The potential use of new high resolution satellite data for urban and regional planning. The International Archives of the Photogrammetry, Remote Sensing, 32(B7), 250–257.
Misra, T. (2017). Indian remote sensing sensor system: Current and future perspective. In Proceedings of the National Academy of Sciences, India section A: Physical Sciences 87(4), 473–486.
Mondal, M., Sharma, N., Kappas, M., & Garg, P. K. (2015). Critical assessment of land use land cover dynamics using multi-temporal satellite images. Environments, 2(1), 61–90.
Mondal, M. S., Sharma, N., Garg, P. K., & Kappas, M. (2016). Statistical independence test and validation of CA Markov land use land cover (LULC) prediction results. The Egyptian Journal of Remote Sensing and Space Science, 19(2), 259–272.
Muralikrishnan, S., Muralikrishna, I. V., Manjunath, A. S., & Rao, K. M. M. (2007). Spatially integrated approach for terrain modelling and analysis for mobile communication applications. Geocarto International, 22(4), 297–307.
Nadoushan, M. A., Soffianian, A., & Alebrahim, A. (2012). Predicting urban expansion in Arak metropolitan area using two land change models. World Application Science Journal, 18, 1124–1132.
Natesan, U., & Suresh, E. S. M. (2002). Site suitability evaluation for locating sanitary landfills using GIS. Journal of the Indian Society of Remote Sensing, 30(4), 261–264.
Navalgund, R. R., Jayaraman, V., Kirankumar, A. S., & Dadhwal, V. K. (2007). Future indian earth observation systems. In 58th International Astronautical Congress (IAC-07-B1. 2.03).
Nigam, R. (2000). Application of Remote Sensing and GIS for LULC mapping and change detection in the rural urban fringe area of Enschede city, The Netherlands. International Archives of Photogrammetry and Remote Sensing 33(B7/3; PART 7), 993–998.
Pandey, D. (2012). Selection of prospective waste disposal sites for Gondia Municipal Council of Maharashtra, India. International Journal of Life Sciences Biotechnology and Pharma Research, 1(3), 174–181.
Pandey, D., Katpatal, Y. B., Kundal, P. P., & Chandrayan, V. R. (2018). Integrated drainage design using GIS technique of Gondia city, Maharashtra, India. International Journal of Recent Scientific Research, 3(C), 24811–24816.
Park, J. H., Kim, K. O., & Yang, Y. K. (2001). Image fusion using multiresolution analysis. In IGARSS 2001: scanning the present and resolving the future. Proceedings IEEE 2001 International Geoscience and Remote Sensing Symp. (Cat. No. 01CH37217), 2, (pp. 864–866).
Park, J. H., Tateishi, R., Wikantika, K., & Park, J. G. (1999). The potential of high resolution remotely sensed data for urban infrastructure monitoring. In IEEE 1999 international geoscience and remote sensing symposium IGARSS’99 (Cat. No. 99CH36293), 2 (pp. 1137–1139).
Parveen, R., & Kulkarni, S. (2019). Urban land use dynamics and change implication by using low-resolution LISS-III imagery. International Journal of Computers and Applications, 1–6.
Parveen, R., Kulkarni, S., & Mytri, V. D. (2018). Automated extraction and discrimination of open land areas from IRS-1C LISS-III imagery. International Journal of Computers and Applications, 1–10.
Pathak, V., & Dikshit, O. (2004). Per-field classification of Indian urban environment using IRS-1C satellite data. In: 3rd International symposium on new technologies for urban safety of mega cities in Asia, 18–19 October 2004, Agra, India.
Pathak, V., & Dikshit, O. (2005). Neuro-textural classification of Indian urban environment. Geocarto International, 20(3), 65–73.
Peinsipp-Byma, E., & Roller, W. (1999). Examination of ERS and IRS-1C images for interactive image interpretation. In Sensors, systems, and next-generation satellites III. International Society for Optics and Photonics, (3870) (pp. 663–671).
Pesaresi, M. (1999). Textural classification of very high-resolution satellite imagery: Empirical estimation of the interaction between window size and detection accuracy in urban environment. In Proceedings of 1999 International Conference on Image Processing, 1 (pp. 114–118). IEEE.
Pesaresi, M., & Benediktsson, J. A. (2000). Classification of urban high-resolution satellite imagery using morphological and neural approaches. In IGARSS 2000. IEEE 2000 international geoscience and remote sensing symposium. taking the pulse of the planet: the role of remote sensing in managing the environment. 7 (pp. 3066–3068).
Pundir, S. K., & Garg, R. D. (2020). Development of mapping techniques for off road trafficability to support military operation. Spatial Information Research, 1–12.
Rafiee, R., Mahiny, A. S., & Khorasani, N. (2009). Assessment of changes in urban green spaces of Mashad city using satellite data. International Journal of Applied Earth Observation and Geoinformation, 11(6), 431–438.
Raghavswamy, V., Pathan, S. K., Mohan, P. R., Bhanderi, R. J,. & Priya, P. (1996). IRS-1C applications for urban planning and development. Current Science, 582–588.
Rahman, M. R. (2006). Flood inundation mapping and damage assessment using multi-temporal RADARSAT and IRS-1C LISS-III Image. Asian Journal of Geoinformatics, 6(2), 11–21.
Ravindranath S., & Raj, U. (2005). Cultural resources management for ruins of Hampi—World heritage site. Presented in the workshop on ‘Space Inputs to Archaeology’, July 5th 2005, at National Institute of Advanced Studies (NIAS), Bengaluru, India.
Rajaram, B., Nagarajan, R., & Khire, M. V. (2001). Synergistic use of orbital satellite image and ground-based information in environmental monitoring of railway alignment construction—A case study. International Journal of Remote Sensing, 22(16), 3187–3201.
Ramachandra, T. V., & Kumar, U. (2009a). Geoinformatics for urbanisation and urban sprawl pattern analysis. Geoinformatics for Natural Resource Management, 235–272.
Ramachandra, T. V., & Mujumdar, P. P. (2009). Urban floods: Case study of Bangalore. Disaster Development, 3(2), 1–98.
Ramachandra, T. V., Sellers, J. M., Bharath, H. A., & Vinay, S. (2019). Modelling urban dynamics along two major industrial corridors in India. Spatial Information Research, 27(1), 37–48.
Rao, D. P., Gautam, N. C., Nagaraja, R., & Mohan, P.R. (1996a). IRS-1C applications in land use mapping and planning. Current Science, 575–581.
Rao, D. P., Navalgund, R. R., & Murthy, Y. V. N. (1996b). Cadastral applications using IRS-1C data–Some case studies. Current Science, 624–628.
Rao, K. V., Kamini J., Ramesh B., & Raghavaswamy V. (2013). Achievements and applications for urban planning using data from IRS Satellites. Bulletin of the National Natural Resources Management System, NNRMS (B)-37, 123–130.
Rao, M., Krishnamurthy, J., Raj, U., Patan, S. K., Ragavaswamy, V., & Jayaraman, V. (1998). Classification of high resolution satellite imagery—The experience from IRS-1C/1D. In IAF, international astronautical congress, 49th, Melbourne, Australia.
Rao, Y. S., Rao, K. S., Venkataraman, G., Khare, M., & Reddy, C. D. (2003). Comparison of DEMs derived from INSAR and optical stereo techniques. In Proceeding of FRINGE workshop, Frascati, Italy.
Rashed, T., & Jürgens, C. eds. (2010). Remote sensing of urban and suburban areas (Vol. 10). Springer, Berlin.
Rashed, T., Weeks, J. R., Gadalla, M. S., & Hill, A. G. (2001). Revealing the anatomy of cities through spectral mixture analysis of multispectral satellite imagery: a case study of the Greater Cairo region, Egypt. Geocarto International, 16(4), 7–18.
Rashed, T., Weeks, J. R., Stow, D., & Fugate, D. (2005). Measuring temporal compositions of urban morphology through spectral mixture analysis: Toward a soft approach to change analysis in crowded cities. International Journal of Remote Sensing, 26(4), 699–718.
Revision of World Urbanization Prospects. (2018). Produced by the Population Division of the UN Department of Economic and Social Affairs (UN DESA).
Richter, R., Weingart, U., Wever, T., & Kahny, U. (2006). Urban land use data for the telecommunications industry. Photogrammetrie Fernerkundung Geoinformation, 2006(4), 297.
Ridd, M. K. (1995). Exploring a VIS (vegetation-impervious surface-soil) model for urban ecosystem analysis through remote sensing: comparative anatomy for cities. International Journal of Remote Sensing, 16(12), 2165–2185.
Rokade, V. M. (2019). Geoscientific investigations for searching suitable solid waste disposal site using Remote Sensing and GIS. International Journal of Economic and Environmental Geology, 27–35.
Samudraiah, D. R. M. (2013). Indian Electro-optical payloads for earth observation. Bulletin of the National Natural Resources Management System, NNRMS (B)-37, 19–26.
Sanjeevi, S., Vani, K., & Lakshmi, K. (2001). Comparison of conventional and wavelet transform techniques for fusion of IRS-1C LISS-III and PAN images. In 22nd Asian conference on remote sensing (pp. 65–85).
Saraf, A. K. (1999). IRS-1C-LISS-III & PAN data fusion: an approach to improve remote sensing based mapping techniques. International Journal of Remote Sensing, 20(10), 1929–1934.
Sebastian, M., Jayaraman, V., & Chandrasekhar, M. G. (1998). Facilities management using remote sensing data in a GIS environment. Acta Astronautica, 43(9–10), 487–491.
Seker, D. Z., Kaya, S., Musaoglu, N., Demirel, H., Tanik, A., & Sertel, E. (2010). Spatial analyses for environmental impacts of landfill areas. In Survival and sustainability (pp. 691–697). Springer, Berlin.
Shalan, M. A., Arora, M. K., & Ghosh, S. K. (2003). An evaluation of fuzzy classifications from IRS-1C LISS-III imagery: A case study. International Journal of Remote Sensing, 24(15), 3179–3186.
Shukla, S., Gedam, S., & Khire, M. V. (2020). Implications of demographic changes and land transformations on surface water quality of rural and urban sub-basins of Upper Bhima River basin, Maharashtra, India. Environment, Development and Sustainability, 22(1), 129–171.
Sliuzas, R., Kuffer, M., & Masser, I. (2010). The spatial and temporal nature of urban objects. In Remote sensing of urban and suburban areas. Springer, Dordrecht (pp. 67–84).
Smith, G. M., & Fuller, R. M. (2001). An integrated approach to land cover classification: an example in the Island of Jersey. International Journal of Remote Sensing, 22(16), 3123–3142.
Srivastava, P. K., Krishna, B. G., & Majumder, K. L. (1996). Cartography and terrain mapping using IRS-1C data. Current Science, 562–567.
Steinnocher, K., Ries, C., Köstl, M., Ehrlich, D., & Lavalle, C. (1999). Monitoring urban dynamics by earth observation–The Vienna case study (pp. 502–509). Heidelberg: Angewandte Geographische Informationsverarbeitung XI, Wichmann Verlag.
Sudhira, H. S., Ramachandra, T. V., & Jagadish, K. S. (2004). Urban sprawl: Metrics, dynamics and modelling using GIS. International Journal of Applied Earth Observation Geoinformation, 5(1), 29–39.
Sundaram, A. M. (2011). Urban green-cover and the environmental performance of Chennai city. Environment, Development and Sustainability, 13(1), 107–119.
Suribabu, C. R., & Bhaskar, J. (2015). Evaluation of urban growth effects on surface runoff using SCS-CN method and Green-Ampt infiltration model. Earth Science Informatics, 8(3), 609–626.
Talukdar, K. K. (1999). Tele-geoinformation service for sustainable urban management: A satellite-based observation approach for the 21st century. In Space and the Global Village: Tele-services for the 21st Century, Springer, Dordrecht (pp. 149–155).
Tapiador, F. J., & Casanova, J. L. (2003). Land use mapping methodology using remote sensing for the regional planning directives in Segovia, Spain. Landscape and Urban Planning, 62(2), 103–115.
Teggi, S., Cecchi, R., & Serafini, F. (2003). TM and IRS-1C PAN data fusion using multiresolution decomposition methods based on the ‘a tròus’ algorithm. International Journal of Remote Sensing, 24(6), 1287–1301.
Topan, H., Maktav, D., Jacobsen, K., & Buyuksalih, G. (2009). Information content of optical satellite images for topographic mapping. International Journal of Remote Sensing, 30(7), 1819–1827.
Tripathi, N. K., & Singh, P. (2000). Integrated GIS and remote sensing approach to map pollution in upper lake, Bhopal, India. Geocarto International, 15(4), 51–58.
Turker, M., & Asik, O. (2005). Land use change detection at the rural-urban fringe using multi-sensor data in Ankara, Turkey. International Journal of Geoinformatics, 1(3), 27–36.
Uniyal, A., Shah, P. N., Mohan, R., & Rao, S. (2016). Image processing and GIS techniques applied to high resolution satellite data for lineament mapping of thermal power plant site in Allahabad district, UP, India. Geocarto International, 31(9), 956–965.
Weeks, J. R., Larson, D., & Fugate, D. (2005). Patterns of urban land use as assessed by satellite imagery: An application to Cairo, Egypt. In Population, Land Use, and Environment: Research Directions (pp. 265–286).
Wurm, M., Taubenböck, H., & Dech, S. (2010). Quantification of urban structure on building block level utilizing multisensoral remote sensing data. Earth Resources and Environmental Remote Sensing/GIS Applications, International Society for Optics and Photonics, 7831, 78310H.
Zavala, P., & Chuvieco, E. (2003). Analysis of seismic vulnerability using remote sensing and GIS techniques. International Journal of Emergency Management, 1(4), 319–331.
Zhang, L., Feiner, J., Louy, O., Gruen, A., & Schmid, W. A. (2002). Photo-textured digital terrain models as a basis for regional and local planning. International Archives of Photogrammetry, Remote Sensing and Spatial Information Science, 30, 1682–1777.
Zoleikani, R., Zoej, M. V., & Mokhtarzadeh, M. (2017). Comparison of pixel and object oriented based classification of hyperspectral pansharpened images. Journal of the Indian Society of Remote Sensing, 45(1), 25–33.
Acknowledgements
The authors are grateful to Director, National Remote Sensing Centre (NRSC), Hyderabad, India; Director, Indian Institute of Remote Sensing (IIRS), Dehradun, India; Dr. Y.V.N. Krishna Murthy, former Director, NRSC and IIRS and presently, Senior Professor, Indian Institute of Space Science and Technology (IIST), Thiruvananthapuram, India; Sh. Uday Raj, former Chief General Manager, Regional Centres, NRSC and Dr. K. Ganesha Raj, General Manager, Regional Remote Sensing Centre-South, Bengaluru, India, for their guidance and encouragements in carrying out various projects on geospatial technology and applications for societal benefits.
Author information
Authors and Affiliations
Corresponding author
Additional information
Publisher's Note
Springer Nature remains neutral with regard to jurisdictional claims in published maps and institutional affiliations.
About this article

Cite this article
Kumar, P., Rao, K.V., Ravindranath, S. et al. A Review of IRS-1C Applications in Urban and Regional Studies, and Infrastructure Planning. J Indian Soc Remote Sens 49, 161–177 (2021). https://doi.org/10.1007/s12524-020-01283-5
Received:
Accepted:
Published:
Issue Date:
DOI: https://doi.org/10.1007/s12524-020-01283-5