Summer Regional Pentad Extreme Precipitation in Eastern China and Their Possible Causes
 Yaqin Ji
 Xuguang Sun
 Yiming Xu
 - CMA-NJU Joint Laboratory for Climate Prediction Studies, School of Atmospheric Sciences, Nanjing University, Nanjing, China
Persistent extreme precipitation covering a large area usually causes severe flooding disasters in China, but how to depict it and what are the possible causes are still open questions. With Climate Prediction Center global unified gauge-based analysis of daily precipitation and NCEP/NCAR daily reanalysis dataset from 1979 to 2019, summer regional pentad extreme precipitation (RPEP) is defined according to the threshold of the 95th percentile of pentad precipitation with more than 5% land grids coverage in eastern China. While the definition of RPEP highlights the climate features of both the persistence and the regionality of extreme precipitation, it is distinctly different from the previous definitions that mainly reflect the synoptic aspects with daily data and have strictly temporal-spatial constraints. Four categories of RPEPs are objectively identified by K-means cluster analysis, i.e., South China (SC), South of Yangtze River (SYR), Jianghuai River (JHR), and North China (NC). Along the Yangtze River (SYR and JHR), intensity and area of RPEP are positively correlated with each other, and with the increase of RPEP intensity, its center of gravity tends to move eastward in all the four cluster regions and southward in Jianghuai River and North China, respectively, and vice versa. The RPEPs mostly persist for one pentad but can reach up to two to three pentads at most, and along with the duration of RPEP, its intensity and area are both enhanced accordingly. Furthermore, the frequency of RPEP increased significantly since the late 1990s in SYR, JHR, and SC. Associated with RPEP, strong pentad-mean convergence and ascending motion occur in the middle-lower troposphere, and except for SC that is dominated by the local low-pressure and cyclone anomalies, the other three cluster regions are all forced by the western Pacific subtropical high to the southeast and weak low-pressure trough to the north, and the low-level anticyclone anomaly to the southeast transports abundant water vapors to the RPEP regions accordingly. Besides, all the RPEPs are closely in accordance with obvious subseasonal oscillations, especially the 10–30-day and 30–60-day oscillations, which can be regarded as the potential sources of RPEP predictability in eastern China.
Introduction
At present, extreme weather and climate events are posing a serious threat to people’s life and health and are also one of the important causes of natural disasters. Extreme heat wave will lead to droughts and forest fires, and extreme precipitation is often associated with flood disasters. Changes in precipitation may have a more direct adverse impact on society, and extreme precipitation needs to be paid more attention to. Extreme precipitation has a huge impact on people’s life and social economy, especially when it has a long duration. If so, a wide range of influence and large cumulative intensity will contribute to a large amount of runoff on the surface, easily causing serious floods, landslides, mud-rock flows, and other meteorological and geological disasters, even with serious national economic losses. For example, the 1993 summer flooding in the Upper Mississippi River Basin is the most devastating flood of modern times, with damage estimates in the range of $15–20 billion (National Oceanic and Atmospheric Administration, 1993; Kunkel et al., 1994). In 1998, the persistent extreme rainfall event in the Yangtze River basin caused great losses over wide areas, and it is very severe and rare in recent decades.
Extreme precipitation events are low-probability events. The study of persistent extreme precipitation has been a hot topic for scientists around the world (Yuan et al., 2012; Liu et al., 2016; Sun et al., 2016). China is the main area affected by the East Asian summer monsoon that brings heavy precipitation, especially in eastern China, like the Jianghuai River basin. Furthermore, most of eastern China is composed of plain terrains, and these places are rather sensitive to disaster events, such as flood and waterlogging disasters. The extreme precipitation events in China are highly complex with obvious regional features (Chen and Zhai, 2013), so it is of great significance to figure out their climatological characteristics and mechanisms in eastern China.
The definition of extreme precipitation is still evolving. Tao (1980) firstly defined that if a single station with mean precipitation of more than 50 mm during 3 days or more, it is called a continuous rainstorm for a station. Later, regional extreme precipitation event is defined, which requires that precipitation is greater than or equal to 50 mm and lasts for at least five consecutive days or more, involving more than 10 grids (resolution 0.25 × 0.25°) in the region, wherein the coincidence rate of rainbands in the two adjacent days is not less than 20% (Wang et al., 2014). Another definition also considers both the persistence and the regionality of daily precipitation; that is, daily precipitation amount must exceed 50 mm for at least three consecutive days and, at the same time, the distance of neighboring stations must be less than 200 km from each other (Chen and Zhai, 2013). Among all these definitions, 50 mm per day is chosen as an absolute threshold for all over China, regardless of the regional differences between north and south and coast and inland.
Many previous studies have studied the extreme precipitation in different regions over China from various perspectives. Chen and Zhai (2013) found that most persistent extreme precipitation events occur in the central and southern parts of eastern China (primarily in the Jianghuai River basin and South China) and only a small fraction of them appear in northern China. Besides, they are more frequent after 1990, with higher mean intensity, longer mean duration, and larger affected areas. In recent 50 years, extreme heavy precipitation events increased in most areas of northwest China and decreased in most areas of northeast China and North China (Zhai and Pan, 2003; Zhai et al., 2007), meanwhile, precipitation intensity has increased significantly in most China (Zhai et al., 2007). Wang and Li (2005) showed that extreme precipitation events in Yangtze River basin increased sharply by 10–20 percent every decade in summer. However, Xie et al. (2005) pointed out that both the durative heavy rainfall events and the durative rainstorm events showed notable decreasing trends, especially in the upper and middle reaches of Yangtze River and Huaihe River basin.
Persistent extreme precipitation is often associated with stable large-scale circulation anomalies (Higgins and Mo, 1997; Sun et al., 2016; Zhai et al., 2016). Previous studies indicated that extreme precipitation in North China is possibly caused by strong low-pressure system in the middle and lower troposphere, and during the extreme precipitation event, the western Pacific subtropical high has obvious west-north uplifting phenomenon (Li et al., 2019). As for the persistent heavy rainfall events from May to August in South China, it is controlled by cyclone anomalies; meanwhile, the South China Sea is dominated by “tongue-like” anticyclone anomalies, which is the favorable circulation pattern for the formation of extreme precipitation in South China (Hong and Ren, 2013). Furthermore, the persistent extreme precipitation events in South China can be mainly categorized into two types, which are corresponding to the two types of South Asian high and, accordingly, the pathways of anomalous moisture have a large difference between them (Wu et al., 2016). Moreover, subseasonal oscillations are also responsible for the persistent extreme precipitation (Yang et al., 2010; Sun et al., 2016). For instance, the remarkable persistent extreme precipitation along the Yangtze River basin in 1998 is regulated by both 10–30-day and 30–60-day subseasonal oscillations, which in turn are triggered by local air-sea interaction and latent heat forcing in the western Pacific and the Indian Ocean, respectively (Sun et al., 2016).
With an overview of previous studies, extreme precipitation is mainly defined by the absolute threshold rather than the relative one, and it is generally considered as a synoptic phenomenon and an individual case for mechanism investigations, which has not formed a systematic and complete conceptual model of extreme precipitation in eastern China. Besides, more emphasis on extreme precipitation should be placed on southern China, where a large amount of climatological precipitation resides. However, the specific regions of regional extreme precipitation mentioned above are usually based on administrative divisions, which may not accurately reflect their actual locations. Instead, this study will redefine the regional extreme precipitation from the aspect of climate, identify the key regions in eastern China, and finally reveal the corresponding formation mechanisms. It is expected to deepen the understanding of regional extreme precipitation and to improve the prediction capability eventually.
The article is organized as follows: data, definition, and method are described in the next section; Characteristics of RPEP section presents the features of RPEPs in four cluster regions. Mechanism and Conceptual Model of RPEP section investigates the possible formation mechanism and subseasonal oscillations of RPEP. Finally, conclusions and discussion are provided in Summary and Discussion section.
Data, Definition, and Method
Data and Preprocessing
Climate Prediction Center (CPC) global unified gauge-based analysis of daily precipitation is used for definition and analysis of regional extreme precipitation, and it is only available on land grids with a resolution of 0.5 × 0.5° from 1979 to the present (Xie et al., 2007; Chen et al., 2008a; Chen et al., 2008b). National Centers for Environmental Prediction/National Center for Atmospheric Research (NCEP/NCAR) daily reanalysis dataset (Kalnay et al., 1996) is employed to investigate the associated atmospheric circulations, and it is from 1948 to the present with the resolution of 2.5 × 2.5°. In order to keep the consistency of the research period, summer daily data (June, July, and August, JJA) from 1979 to 2019 are used in this study.
Instead of using daily precipitation for extreme precipitation, daily data are firstly converted into pentad data so as to highlight the climate characteristics of extreme precipitation. Therefore, 1 year can be divided into 73 pentads, and summertime is the period from the 32nd pentad to the 48th pentad (from June 5th to August 28th accordingly) with a total of 17 pentads for each year. The pentad anomaly is obtained by subtracting the climatological mean of the corresponding pentad during the whole study period, and all the variables are processed in the same way.
Definition of RPEP
Pentad precipitation is used to judge whether extreme heavy precipitation occurs according to its relative threshold at every grid, which is determined by the 95th percentile of reordered ascending pentad precipitation in summer from 1979 to 2019, similar to Zhai and Pan (2003). When the pentad precipitation exceeds its threshold, the corresponding grid is marked with extreme heavy precipitation. The relative threshold considers both the requirement of extreme and the geographical differences of climatological precipitation between northern and southern China, which makes it more objective and practical compared with the fixed threshold (50 mm) in previous studies.
To reflect the persistence of extreme precipitation, at least three consecutive days were required in previous studies (Chen and Zhai, 2013), which may exclude some particular extreme situations that can also contribute to a certain degree of flooding; for example, the extreme precipitation happens every other day in a pentad. It is reasonable to take pentad extreme precipitation into account in this study, which is not strictly requiring the continuity of daily extreme precipitation and only concerns the statistical effect of high-frequency signals.
The regionality of pentad extreme precipitation is identified as follows; i.e., the number of grids with pentad extreme precipitation exceeds 5% of the total number of land grids in eastern China (20°N–43°N, 105°E–123°E) and it needs at least 70 grids (about 3.5 × 5°) actually. The regionality requirement also has no strict spatial continuity for the adjacent grids, which is suitable for examining the climate characteristics of extreme precipitation. If a pentad meets the above two requirements, the pentad precipitation is defined as the RPEP. According to the definition of RPEP, 277 RPEPs are selected out of the total 697 pentads in the 41 years, which should include the regional extreme precipitation events obtained by previous studies with strict temporal and spatial constraints.
Some RPEP metrics are defined to depict its characteristics: frequency is the pentad number of RPEPs at each grid; intensity refers to the ratio of the cumulative amount and frequency number of RPEPs at each grid; area ratio is the ratio between the number of grids with RPEP and the total land grids in research; location of the center of gravity is expressed based on the latitudes and longitudes weighted by the RPEP amount at each grid; duration is counted by how many consecutive pentads last in the RPEP.
Method
Because of the high heterogeneous spatial distribution of RPEP in eastern China (Figure 1B), it is necessary to investigate the RPEP from region to region. K-means cluster analysis is the most commonly used nonlinear clustering technique (Pike and Lintner, 2020), and it can divide the whole data into a given number of clusters in which the data are closest to their centroid with minimized variance (Hartigan and Wong, 1979). By applying the K-means cluster analysis to the 277 RPEPs, four categories of RPEPs are objectively obtained. According to their spatial distributions of the frequency of RPEP, they are identified and named South China (SC) (20°N–27°N, 105°E–123°E), South of Yangtze River (SYR) (24°N–31°N, 105°E–123°E), Jianghuai River (JHR) (29°N–35°N, 105°E–123°E), and North China (NC) (34°N–43°N, 105°E–123°E), respectively, which cover the large center of the probability density of RPEP, as shown in Figure 2.
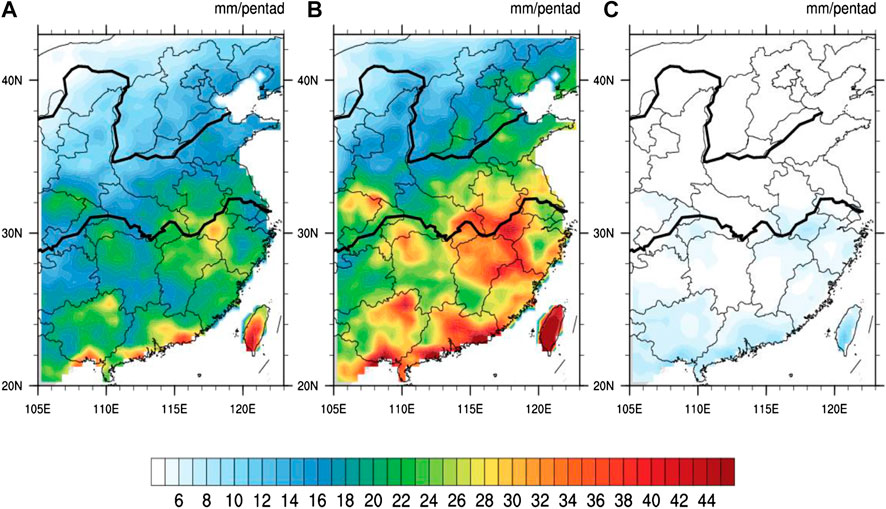
FIGURE 1. The spatial distributions of threshold according to 95th percentile of pentad precipitation (A), mean intensity of RPEP (B), and common summer pentad precipitation (C) during summer from 1979 to 2019 (unit: mm per pentad).
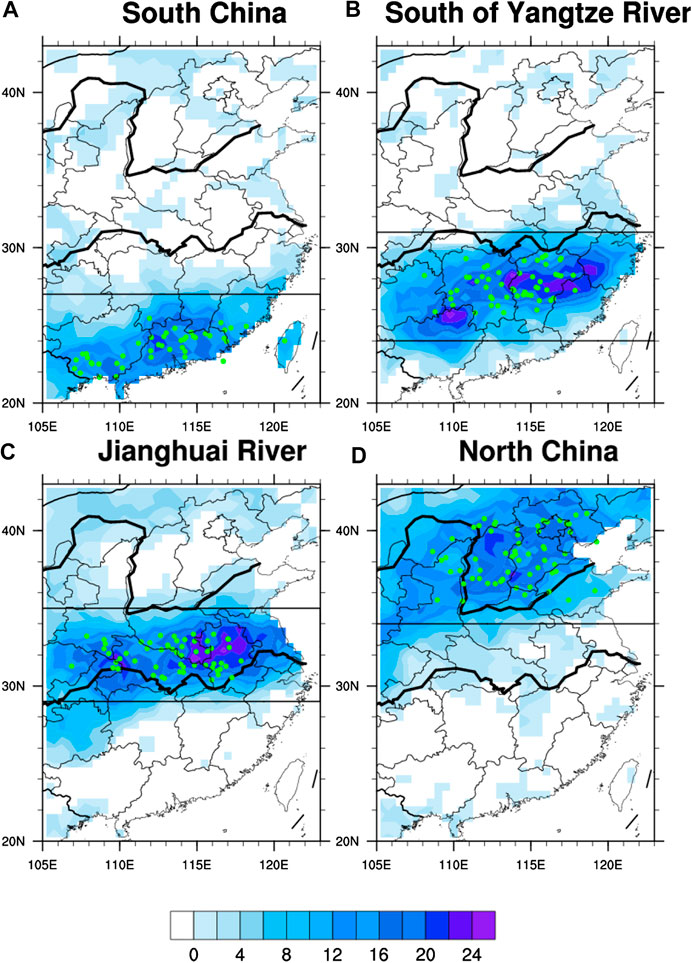
FIGURE 2. The frequency (shading) and center of gravity (green dot) of RPEP in SC (A), SYR (B), JHR (C), and NC (D). The black box indicates the specific cluster region.
As for the four categories of RPEPs, the detailed information, including occurrence time, coverage area ratio, center of gravity (longitude and latitude), and intensity, is summarized in Supplementary Tables S1–S4. Accordingly, the frequency, intensity, area ratio, location, and duration of each category of RPEPs are analyzed separately, so are the related atmospheric circulations. In addition, the wavelet analysis (Liu et al., 2007) with mother wavelet “Morlet” is also carried out to reveal the RPEP related subseasonal oscillation periods.
Characteristics of RPEP
As can be seen from the relative threshold of pentad extreme precipitation during summer from 1979 to 2019 (Figure 1A), it generally decreases from southeast to northwest in eastern China, and there are two large value bands along the Yangtze River and the coast of South China, which are consistent with the great total precipitation amounts over there. Specifically, in most of southern China, the thresholds are above 22 mm per pentad and exceed 28 mm per pentad in some mountain areas along the Yangtze River and coastal areas in South China, while in the western and northern inland areas over China, they are basically below 16 mm per pentad. Such significant spatial differences of RPEP threshold further confirm the necessity of considering relative threshold for each grid, and it also implies that the larger the threshold is, the stronger the intensity of RPEP is (Figure 1B). Especially, the maximum intensity of RPEP is above 40 mm per pentad in the middle reaches of the Yangtze River valley and coastal areas of South China (Figure 1B). In comparison, common summer precipitation excluding the RPEP has a much smaller intensity (Figure 1C); however, its spatial distribution is almost the same as the RPEP, which means amplitude of intensity rather than its spatial distribution is the most significantly different factor between RPEP and common summer precipitation (Figures 1B,C).
As revealed by the K-means cluster analysis, frequency and center of gravity for the four categories of RPEPs in SC, SYR, JHR, and NC are shown in Figure 2, wherein those with centers of gravity out of the specific cluster regions are removed out, and finally, 214 RPEPs are used in the following studies, among which there are 44 RPEPs in SC, 53 RPEPs in SYR, 56 RPEPs in JHR, and 61 RPEPs in NC during the past 41 years. The climatological frequency of RPEPs is decreasing from north to south in China, which is contrary to the spatial distributions based on the absolute threshold of 50 mm per day (e.g., Chen and Zhai, 2013), but consistent with Zhai and Pan (2003) by using the similar relative threshold, which emphasized that there are still a great number of extreme precipitations in northern China. At the same time, the large centers of frequency are in accordance with the locations of center of gravity for the four categories of RPEPs, and both of them are well confined in the cluster regions and distinctly separated from each other (Figure 2), indicating that it is reasonable and suitable to investigate RPEPs in terms of the above-mentioned four categories by the K-means cluster analysis.
Figure 3 shows the temporal distribution of area ratio and intensity of RPEPs in the four cluster regions. As we have known that SYR (Figure 3B) and JHR (Figure 3C) are both located in the Yangtze River basin and accompanied by the rainy season over there, the RPEPs in the two cluster regions mostly occur before the 44th pentad (early August), especially concentrating on the Meiyu period, when the quasistationary front provides sufficient water vapor and instability energy. The major occurrence time of RPEP in JHR is a little later than that in SYR, and compared with the SYR, the JHR may have a smaller mean intensity of RPEP, but the number of RPEPs with stronger intensity over there is larger than that in SYR, and the maximum intensity RPEP in JHR is about 45 mm per pentad in contrast to that in SYR with about 40 mm per pentad. Moreover, the mean coverage area ratio in JHR is also larger than that in SYR, which means the RPEPs in JHR tend to be more extreme than those in SYR though they both occur in the same Meiyu rain band.
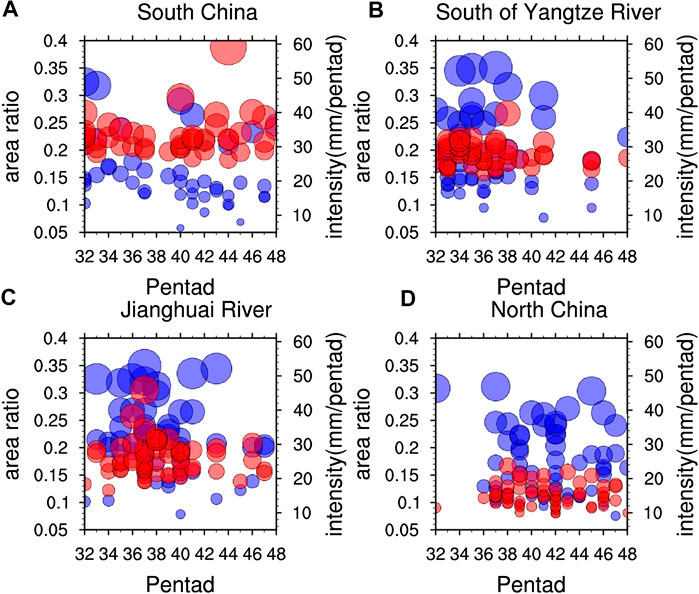
FIGURE 3. The temporal distribution of area ratio and intensity (unit: mm per pentad) of RPEPs in the four cluster regions, SC (A), SYR (B), JHR (C), and NC (D) during summer, where the blue dot and red dot indicate area ratio and intensity, respectively, and the larger the dots are, the larger the area ratio and intensity are.
Associated with the northward advance of East Asian summer monsoon, rainband marches from southern China to northern China as well. In NC (Figure 3D), most RPEPs occur after the 35th pentad (the end of June), consistent with the major rainy season in July and August over there. The intensity of RPEP in NC is generally below 22 mm per pentad, much weaker than those in SYR and JHR, albeit with a comparable coverage area ratio. For SC (Figure 3A), the RPEP could occur during the whole summer period. Corresponding to the first and second rainy seasons in SC, area ratio and intensity of RPEP are relatively higher at the beginning and end of summer, and both of them show a decreasing trend from the 32nd pentad (the beginning of June) to the 39th pentad (the middle of July) and an increasing trend from the 40th pentad (late July) to the 48th pentad (the end of August) accordingly. The coverage area ratio of RPEP is larger in the first SC rainy season than the second one, but it is the reverse for the intensity of RPEP. Furthermore, the intensity of RPEP in SC is generally above 28 mm per pentad with a maximum around 60 mm per pentad, much larger than the other three cluster regions, which is consistent with the spatial distribution of threshold (Figure 1A). However, on the contrary, the area ratio of RPEP in SC is much smaller, which demonstrates the smallest spatial scale of RPEP among the four cluster regions.
Since the intensity of RPEP is the most concerning factor in evaluating extreme precipitation caused disasters, its relationships with area ratio and center of gravity (longitude and latitude) of RPEPs are further examined separately in the four cluster regions (Figure 4), wherein both latitude and longitude at the center of gravity are converted into anomaly data for clear representation. In the relationship of intensity and area ratio (Figure 4A), the intensity is significantly proportional to area ratio in SYR and JHR, i.e., along the Yangtze River, especially in JHR, the stronger the RPEP is, the much more area it will cover, and vice versa. However, in SC and NC, the intensity has no significant relationship with area ratio, and RPEPs with different coverage areas could have similar intensity. As for the relationship of intensity with center of gravity (Figures 4B,C), the intensity is significantly positively correlated with the longitude of the center of gravity in all the four cluster regions, with the largest correlation in JHR (Figure 4B). However, it shows a significantly negative correlation between intensity and latitude of the center of gravity in JHR and NC, while there were no obvious relations in SYR and SC (Figure 4C). It indicates that the intensity will get stronger when the center of gravity of RPEP moves toward the southeast in JHR and NC and toward the east in SYR and SC, and vice versa, which could be further deduced that if the rainband moves from west to east in eastern China, it will probably turn into stronger RPEP.
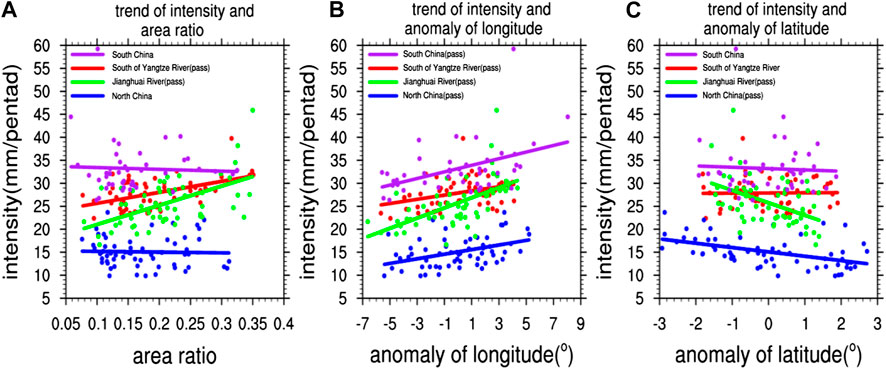
FIGURE 4. Scatter plots of intensity (unit: mm per pentad) with area ratio (A), anomalous longitude (unit: °) (B), and latitude (unit: °) (C) of RPEPs in four cluster regions. Purple dot, red dot, green dot, and blue dot with their fitting lines represent SC, SYR, JHR, and NC, respectively; “pass” in the legend means that the fitting line has a significant trend at the 95% confidence level.
Figures 5A–D show the occurrence time of RPEPs in the four cluster regions during the summer from 1979 to 2019. It can be seen that the occurrence time of all the individual RPEPs is consistent with their corresponding climatology as shown in Figure 3, and except for NC (Figure 5D), its frequency tends to obviously increase since the late 1990s (Figures 5A–C). As for persistence, most of RPEPs only last for one pentad in all the four cluster regions, and some of them can reach up to three pentads. Among which, the frequency of RPEP with more than one pentad is largest in NC (12 events), followed by SYR (9 events), JHR (6 events), and SC (2 events) in turn (Figures 5E–H). Specifically, in NC (Figure 5D), RPEP with more than one pentad tends to occur during the period between the 37th pentad and the 42nd pentad (in July), whereas it appears near the 34th pentad (middle of June) in SYR (Figure 5B). In terms of duration of RPEP, all the four cluster regions show that larger area and stronger intensity are both accompanied with the longer duration of RPEP, especially in SYR, NC, and SC (Figure 6).
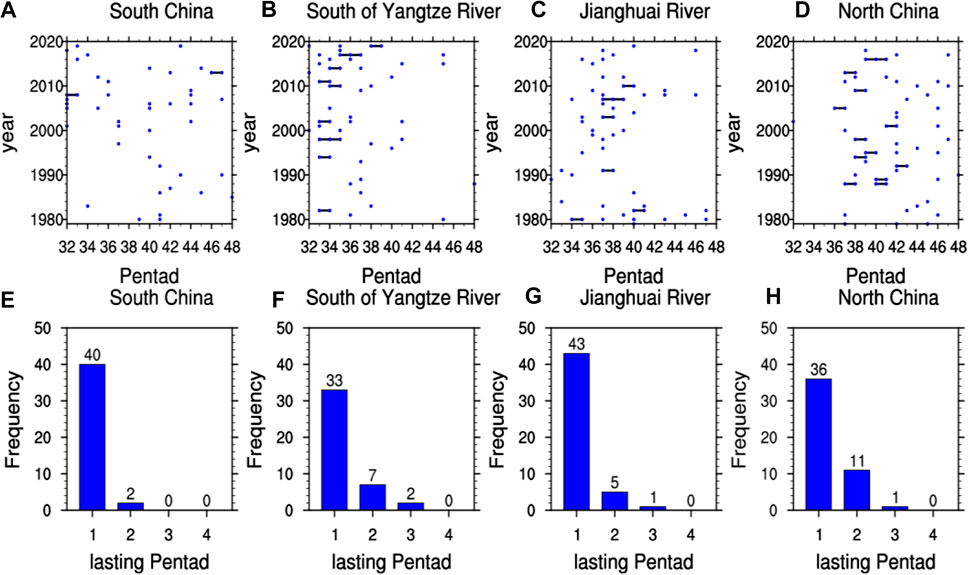
FIGURE 5. The occurrence time (A–D) and frequency of RPEP with different lasting pentads (E–H) in SC (A,E), SYR (B,F), JHR (C,G), and NC (D,H). In (A–D), one blue dot indicates one RPEP, and the black solid line links the consecutive RPEPs.
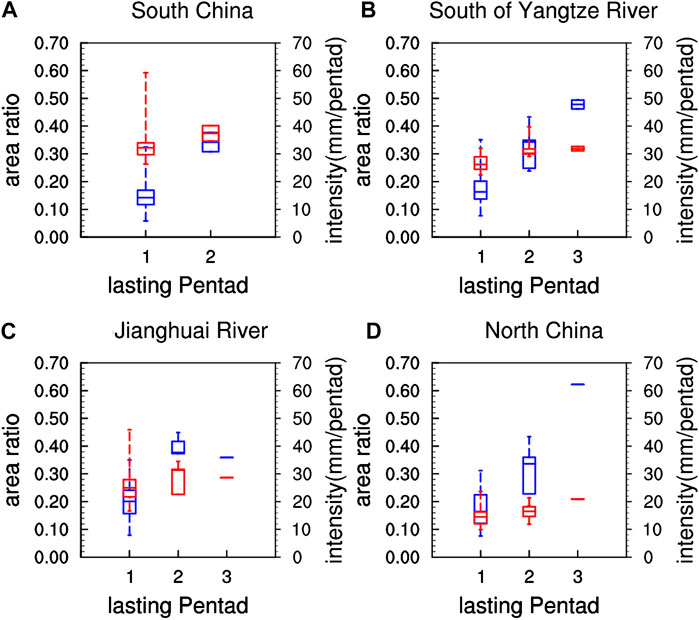
FIGURE 6. Box-whisker plot for area ratio and intensity (unit: mm per pentad) against lasting pentad of RPEP in SC (A), SYR (B), JHR, (C) and NC (D). The blue and red box-whiskers indicate area ratio and intensity, respectively.
Mechanism and Conceptual Model of RPEP
The composite anomalies of 850 hPa wind field, 500 hPa height field, 500 hPa vertical velocity, and precipitation for the four categories of RPEPs are used to explore the possible formation mechanism (Figure 7). At 850 hPa, strong convergent anomalies are all located right in the four cluster regions associated with the RPEPs (Figures 7A–D), which are corresponding to the greatly enhanced local convective activities and much more precipitation (Figures 7I–L). Specifically, as for the RPEP in SC, a cyclone anomaly at 850 hPa dominates the local region, and the strong westerly anomaly over South Asia may supply abundant moisture along with enhanced South Asian summer monsoon (Figure 7A). Accordingly, a significant negative 500 hPa geopotential anomaly locates above the SC as well, indicating the local deep low-pressure anomaly is responsible for the RPEP in SC (Figure 7E). Besides, anomalous 850 hPa anticyclone and cyclone are also over the Yellow Sea and the Sea of Okhotsk, respectively, accompanied with positive and negative geopotential anomalies at 500 hPa, which demonstrates a quasi-barotropic teleconnection from SC to North Pacific (Figures 7A,E). It is actually the Rossby wave train triggered by the diabatic heating release due to the RPEP in SC (Zhu and Li, 2016). On the other hand, according to the China Meteorological Administration tropical cyclone database from 1949 to 2019 available on the website http://tcdata.typhoon.org.cn/dlrdqx_zl.htm (Ying et al., 2014), about 1/2 of RPEPs in SC have the overlapped time period with the landfall tropical cyclone in SC, which means tropical cyclone activity may have some important influence on the RPEP in SC.
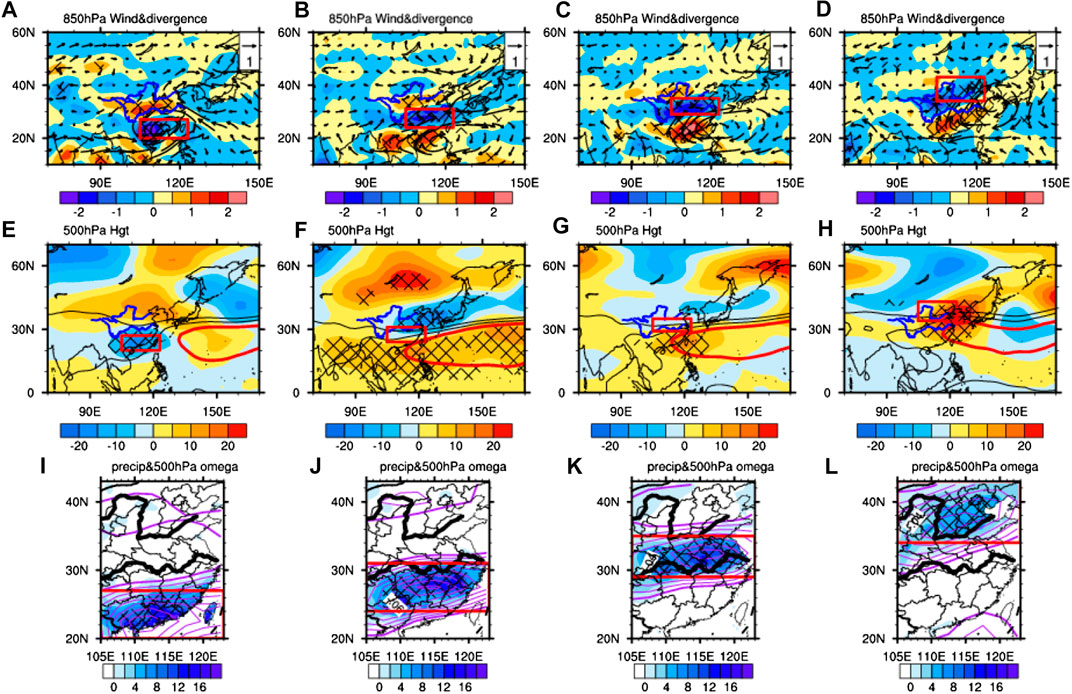
FIGURE 7. The composite anomalies of wind (vectors, unit: m s−1) and divergence (shading, unit: 106 s−1) at 850 hPa (A–D), geopotential height (shading, unit: gpm) at 500 hPa (E–H), vertical velocity at 500 hPa (contours, unit: Pa s−1), and precipitation (shading, unit: mm per pentad) (I–L) in SC (A,E,I), SYR (B,F,J), JHR (C,G,K), and NC (D,H,L). In (E–H), the thick red curly line is 588 gpm isoline that is used to indicate the western Pacific subtropical high. The red box in (A–L) indicates the specific cluster region. The hatched area indicates the 95% confidence level.
Regarding the RPEPs in SYR, JHR, and NC, an anticyclone anomaly at 850 hPa to their southeast is located in South China Sea, SC, and JHR, respectively, and the anomalous southwesterly could bring much more warm moisture into the three cluster regions in favor of the RPEPs over there (Figures 7B–D). Accordingly, significant positive 500 hPa geopotential height anomalies can also be seen above the 850 hPa anticyclone anomaly, which is associated with the western Pacific subtropical high at different latitudes, indicating RPEPs in SYR, JHR, and NC tend to occur on the northwest edge of the western Pacific subtropical high. At the same time, a negative albeit somewhat weak 500 hPa geopotential height anomaly is located to the north of the three cluster regions, providing an anomalous weak trough for the RPEPs over there (Figures 7F–H). Therefore, RPEPs in SYR, JHR, and NC share the common configuration features of local atmospheric circulation anomalies, i.e., western Pacific subtropical high- and low-level anticyclone anomaly to the southeast and weak low-pressure trough to the north. In particular, associated with the RPEPs along the Yangtze River valley (SYR and JHR), a clear meridional teleconnection appears over East Asia (Figures 7F,G), and it is much similar to the seasonal counterpart that may originate from the tropical northwestern Pacific and extratropical Eurasian continent (Sun et al., 2010; Sun et al., 2019). The teleconnections related to the RPEP in NC are more zonally oriented in the middle latitudes of the Eurasian continent (Figure 7H), which resembles the anomalous atmospheric circulation pattern responsible for much more summer precipitation in NC (Sun et al., 2010; Greatbatch et al., 2013) implying that RPEP in NC could be mainly affected by signals from the middle-high latitudes of the Eurasian continent.
Subseasonal oscillations of area-averaged precipitation in the four cluster regions are further examined for RPEPs by the wavelet analysis (Figure 8), because persistent extreme precipitation could be closely related to the combined influences of different subseasonal oscillations (Sun et al., 2016). In SYR (Figure 8B), RPEPs frequently occur in June (Figures 3B, 5B), and they are greatly in accordance with two distinct periods, i.e., 10–30 days and 30–60 days (Figure 8B), which favors long duration of RPEPs over there (Figures 5B,F), responsible for the significant persistent extreme precipitation and severe flood disaster along the Yangtze River in 1998 summer (Sun et al., 2016). The RPEPs in NC mainly occur in July and August (Figures 3D,5D,8D), and they are primarily accompanied with the obvious albeit weak 30–60-day oscillation together with weak 5–10-day synoptical oscillation (Figure 8D), which may also be the major reason that NC has the maximum number of RPEPs with more than one pentad among the four cluster regions (Figures 5D,H). In SC and JHR (Figures 8A,C), the period of precipitation is a little complicated, although RPEPs are still embedded in the notable subseasonal oscillation periods. The periods range from 5–10 days to 10–30 days and 30–60 days, and they are overlapped with each other, which cannot be clearly discerned from the precipitation signal. Nevertheless, 10–30-day and 30–60-day oscillations are still very important for the formation of RPEP over there, especially in JHR (Figures 5A,C,E,G; Sun et al., 2016; Yang et al., 2010).
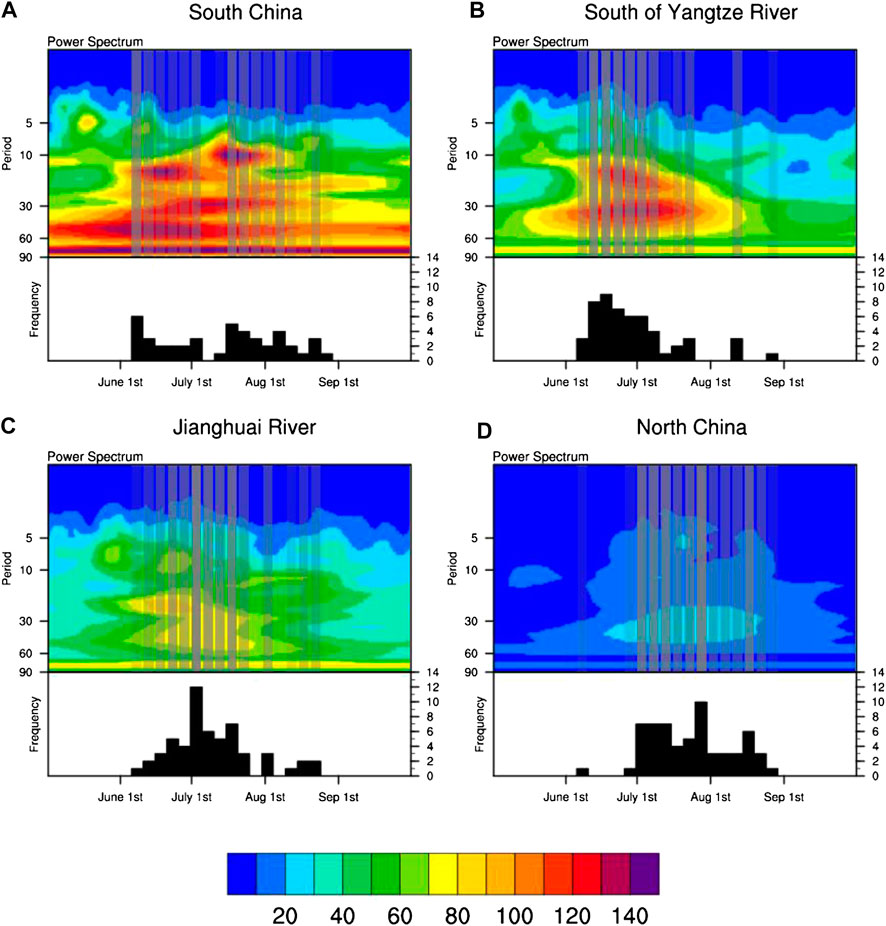
FIGURE 8. The composite wavelet analysis of area-averaged precipitation during the period from May 1st to September 30th and the frequency of RPEP during summer for RPEP years in SC (A), SYR (B), JHR (C), and NC (D). The gray thick line represents the occurrence of RPEP, and the darker the gray line is, the more RPEPs occur in the specific pentad.
Summary and Discussion
In this study, to examine the climate characteristics of extreme precipitation from the aspects of extreme, persistence and regionality, the RPEP is defined with pentad precipitation that is greater than the relative threshold with more than 5% of total land grids in eastern China. K-means cluster analysis is further applied to the selected RPEPs, and four categories of RPEPs are obtained, i.e., SC, SYR, JHR, and NC. In terms of some metrics of RPEPs, features of the RPEPs in the four cluster regions are revealed as well as their possible mechanism. The main conclusions are as follows.
RPEP along the Yangtze River (SYR and JHR) mainly occurs in June and July, and it appears in July and August in NC and almost the whole summer in SC, which is closely related to the seasonal evolution of rain band in eastern China. The intensity of RPEP is generally weakening from southern China to northern China, whereas it is the reverse in frequency. In SYR and JHR, the area and intensity of RPEP are usually both increasing and decreasing simultaneously, but similar intensity could appear with any coverage area of RPEP in NC and SC. The enhancement of the intensity of RPEP is mainly accompanied by the eastward movement of the center of gravity in all the four cluster regions, and vice versa, which may be used as a precursor for the emergence and intensity variation of RPEP. Most RPEPs last for one pentad, and some can reach up to two to three pentads, and the frequency of RPEP with more than one pentad is largest in NC and smallest in SC. In addition, both area ratio and intensity are generally positively correlated with the duration of RPEP.
The local strong low-level convergence and mid-level upward vertical motion may be responsible for triggering and maintenance of RPEP, which are the common features in the four cluster regions. However, the structures of atmospheric circulations are different between SC and the others, whereas SC is dominated by the local deep low-pressure anomalies and the other three cluster regions are all controlled by the enhanced western Pacific subtropical high to the southeast and the weak trough to the north; accordingly, the strong low-level anticyclone anomaly conveys abundant water vapor into the RPEP regions by southwesterly wind, favoring the formation of RPEP over there. Besides, all the four categories of RPEPs are in accordance with the subseasonal oscillations of precipitation; especially, the 10–30-day and 30–60-day oscillations are well separated and quite remarkable in SYR, and they have been proved to be very important for some specific persistent extreme precipitation events (Yang et al., 2010; Sun et al., 2016).
In addition, owing to the definition of RPEP based on pentad precipitation, a high-frequency signal like the synoptic weather perturbation is basically removed, which could let us focus more on the large-scale climate characteristics of extreme precipitation. And the distinct conceptual model of RPEPs in the four cluster regions and its close linkage to the subseasonal oscillations can provide us with a good chance to predict them. However, the early signals and potential sources of RPEP predictability are still open questions, which warrant further studies in the future.
Data Availability Statement
Publicly available datasets were analyzed in this study. These data can be found here: the data used in this study are provided by CPC global unified gauge-based analysis of daily precipitation (https://psl.noaa.gov/data/gridded/data.cpc.globalprecip.html). The reanalysis datasets are from the National Centers for Environment Prediction and National Center for Atmospheric Research (NCEP/NCAR) (https://psl.noaa.gov/data/gridded/data.ncep.reanalysis.html).
Author Contributions
YJ produced the figures and wrote the manuscript. XS was responsible for the main idea of the manuscript and contributed to the manuscript revision. YX, JY, and X-QY provided input to figure and text editing. All the authors contributed to the article and approved the submitted version.
Funding
This study was jointly funded by the National Key R&D Program of China (2018YFC1505803), the National Natural Science Foundation of China (Grant Nos. 41775074, 41621005, 41275069, and 41330420), and the Fundamental Research Funds for the Central Universities.
Conflict of Interest
The authors declare that the research was conducted in the absence of any commercial or financial relationships that could be construed as a potential conflict of interest.
Supplementary Material
The Supplementary Material for this article can be found online at: https://www.frontiersin.org/articles/10.3389/feart.2020.598025/full#supplementary-material.
References
Ai, W. X., and Chen, X. F. (2000). Assessment to summer flood caused by rainfall in the changjiang River valley in 1998 (in Chinese). Meteorol. Mon. 26, 15–19.
Chen, M., and Xie, P.Co-authers (2008a). CPC unified gauge-based analysis of global daily precipiation. Cairns, Australia: Western Pacific Geophysics Meeting.
Chen, M. Y., Shi, W., Xie, P. P., Silva, V. E., Kousky, R., and Higgins, W. (2008b). Assessing objective techniques for gauge-based analyses of global daily precipitation. J. Geophys. Res. Atmos. 113, D04110. doi:10.1029/2007JD009132
Chen, Y., and Zhai, P. M. (2013). Persistent extreme precipitation events in China during 1951–2010. Clim. Res. 57, 143–155. doi:10.3354/cr01171
Greatbatch, R. J., Sun, X. G., and Yang, X. Q. (2013). Impact of variability in the Indian summer monsoon on the East Asian summer monsoon. Atmos. Sci. Lett. 14, 14–19. doi:10.1002/asl2.408
Hartigan, J. A., and Wong, M. A. (1979). Algorithm as 136: a K-means clustering algorithm. Appl. Stat. 28 (1), 100–108. doi:10.2307/2346830
Higgins, R. W., and Mo, K. C. (1997). Persistent north Pacific circulation anomalies and the tropical intraseasonal oscillation. J. Clim. 10, 223–244. doi:10.1175/1520-0442(1997)010<0223:PNPCAA>2.0.CO;2
Hong, W., and Ren, X. J. (2013). Persistent heavy rainfall over South China during May–August: subseasonal anomalies of circulation and sea surface temperature, Acta Meteor. Sinica. 27, 769–787. doi:10.1007/s13351-013-0607-8
Kalnay, E., Kanamitsu, M., Kistler, R., Collins, W., Deaven, D., Gandin, L., et al. (1996). The NCEP/NCAR 40-year reanalysis project, Bull. Am. Meteorol. Soc. 77, 437–472. doi:10.1175/1520-0477(1996)077<0437:TNYRP>2.0.CO;2
Kunkel, K. E., Changnon, S. A., and Angel, J. R. (1994). Climatic aspects of the 1993 upper Mississippi River basin flood. Bull. Am. Meteorol. Soc. 75, 811–822. doi:10.1175/1520-0477(1994)075<0811:CAOTUM>2.0.CO;2
Li, X. R., Fan, K., and Xu, Z. Q. (2019). Decrease in extreme precipitation in summer over east northern China and the water-vapor transport characteristics after year 2000 (in Chinese). Chin. J. Atmos. Sci. 43, 1109–1124. doi:10.3878/j.issn.1006-9895.1902.18198
Liu, R. X., Sun, J. H., Wei, J., and Fu, S. M. (2016). Classification of persistent heavy rainfall events over south China and the associated water vapor source analysis. J. Meteor. Res. 30, 678–693. doi:10.1007/s13351-016-6042-x
Liu, Y. G., Liang, X. S., and Weisberg, R. H. (2007). Rectification of the bias in the wavelet power spectrum. J. Atmos. Ocean. Technol. 24, 2093–2102. doi:10.1175/2007JTECHO511.1
National Oceanic and Atmospheric Administration (1993). Weekly weather and crop bulletin. Washington, DC: U.S. Department of Commerce, 24.
Pike, M., and Lintner, B. R. (2020). Application of clustering algorithms to TRMM precipitation over the tropical and south pacific ocean. J. Clim. 33, 5767–5785. doi:10.1175/JCLI-D-19-0537.1
Sun, X. G., Greatbatch, R. J., Park, W., and Latif, M. (2010). Two major modes of variability of the East Asian summer monsoon. Q. J. R. Meteorol. Soc. 136, 829–841. doi:10.1002/qj.635
Sun, X. G., Jiang, G. X., Ren, X. J., and Yang, X. Q. (2016). Role of subseasonal oscillation in the persistent extreme precipitation over Yangtze River basin during June 1998. J. Geophys. Res. Atmos. 121, 10453–10469. doi:10.1002/2016JD025077
Sun, X. G., Xu, Y. M., Zhang, Z. Q., and Yang, X. Q. (2019). The tropical and extratropical-origin summer meridional teleconnections over East Asia. Clim. Dynam. 53, 721–735. doi:10.1007/s00382-018-04610-2
Wang, H. J., Sun, J. H., Wei, J., and Zhao, S. X. (2014). Classification of persistent heavy rainfall events over southern China during recent 30 years (in Chinese). Clim. Environ. Res. 19, 713–725. doi:10.3878/j.issn.1006-9585.2013.13143
Wang, Y. Q., and Li, Z. (2005). Observed trends in extreme precipitation events in China during 1961–2001 and the associated changes in large-scale circulation. Geophys. Res. Lett. 32, L09707. doi:10.1029/2005GL022574
Wu, H., Zhai, P. M., and Chen, Y. (2016). A comprehensive classification of anomalous circulation patterns responsible for persistent precipitation extremes in South China. J. Meteor. Res. 30, 483–495. doi:10.1007/s13351-016-6008-z
Xie, P. P., Chen, M. Y., Yang, S., Yatagai, A., Hayasaka, T., Fukushima, Y., and Liu, C. M. (2007). A gauge-based analysis of daily precipitation over East Asia. J. Hydrometeorol. 8, 607–626. doi:10.1175/JHM583.1
Xie, Z. Q., Du, Y., Jiang, A. J., and Ding, Y. G. (2005). Climatic trends of different intensity heavy precipitation events concentration in China. J. Geogr. Sci. 15, 459–466. doi:10.1360/gs050409
Yang, J., Wang, B., Wang, B., and Bao, Q. (2010). Biweekly and 21-30-day variations of the subtropical summer monsoon rainfall over the lower reach of the Yangtze River Basin. J. Clim. 23, 1146–1159. doi:10.1175/2009JCLI3005.1
Ying, M., Zhang, W., Yu, H., Lu, X. Q., Feng, J. X., Fan, Y. X., Zhu, Y. T., and Chen, D. Q. (2014). An overview of the China meteorological administration tropical cyclone database. J. Atmos. Ocean. Technol. 31, 287–301. doi:10.1175/JTECH-D-12-00119.1
Yuan, F., Chen, W., and Zhou, W. (2012). Analysis of the role played by circulation in the persistent precipitation over South China in June 2010. Adv. Atmos. Sci. 29, 769–781. doi:10.1007/s00376-012-2018-7
Zhai, P. M., Li, L., Zhou, B. Q., and Chen, Y. (2016). Progress on mechanism and prediction methods for persistent extreme precipitation in the Yangtze-huai River valley (in Chinese). J. Appl. Meteor. Sci. 27, 631–640. doi:10.11898/1001-7313.20160511
Zhai, P. M., and Pan, X. H. (2003). Change in extreme temperature and precipitation over northern China during the second half of the 20th century (in Chinese). Acta Geograph. Sin. 58, 1–10. doi:10.11821/xb20037s001
Zhai, P. M., Wang, C. C., and Li, W. (2007). A review on study of change in precipitation extremes (in Chinese). Adv. Clim. Change Res. 3, 144–148. doi:10.3321/j.issn:0577-6619.2008.05.007
Keywords: regional pentad extreme precipitation, relative threshold, low-level convergence, ascending motion, subseasonal oscillation, predictability
Citation: Ji Y, Sun X, Xu Y, Yao J and Yang X-Q (2021) Summer Regional Pentad Extreme Precipitation in Eastern China and Their Possible Causes. Front. Earth Sci. 8:598025. doi: 10.3389/feart.2020.598025
Received: 23 August 2020; Accepted: 13 November 2020;
Published: 22 January 2021.
Edited by:
Pang-chi Hsu, Nanjing University of Information Science and Technology, ChinaReviewed by:
Fei Huang, Ocean University of China, ChinaAilan Lin, Guangzhou Institute of Tropical and Marine Meteorology (GITMM), China
Copyright © 2021 Ji, Sun, Xu, Yao and Yang. This is an open-access article distributed under the terms of the Creative Commons Attribution License (CC BY). The use, distribution or reproduction in other forums is permitted, provided the original author(s) and the copyright owner(s) are credited and that the original publication in this journal is cited, in accordance with accepted academic practice. No use, distribution or reproduction is permitted which does not comply with these terms.
*Correspondence: Xuguang Sun, xgsun@nju.edu.cn