Comparative Investigation of Different CO2 Capture Technologies for Coal to Ethylene Glycol Process
by
 ,
,
Yanqing Ma
1, 
Yitao Liao
1,
Yi Su
1,
Baojie Wang
1,
Yong Yang
2,
Dong Ji
2,
Hongwei Li
2,
Huairong Zhou
2 and
Dongliang Wang
2,* 1
Lanzhou Petrochemical Research Center, Petrochemical Research Institute, PetroChina, Lanzhou 730060, China
2
School of Petrochemical Engineering, Lanzhou University of Technology, Lanzhou 730050, China
*
Author to whom correspondence should be addressed.
Processes 2021, 9(2), 207; https://doi.org/10.3390/pr9020207
Submission received: 25 December 2020
/
Revised: 17 January 2021
/
Accepted: 18 January 2021
/
Published: 22 January 2021
(This article belongs to the Special Issue Advances in Energy System Synthesis and Energy-Water Nexus in Industry)
Abstract
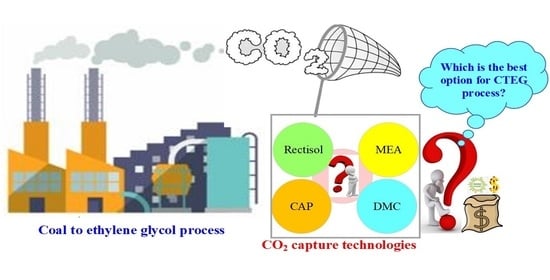
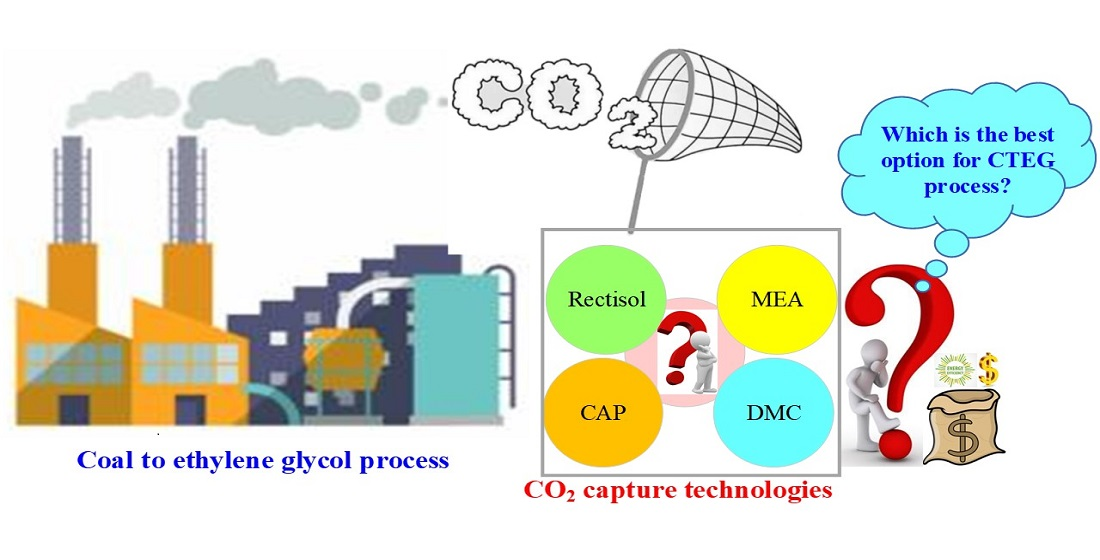
:The coal to ethylene glycol (CTEG) process has drawn much attention due to the serious conflict between supply and demand of ethylene glycol in China. However, it is inevitably accompanied by the problem of high CO2 emissions. Carbon capture is one of the most promising potential effective ways to address this issue. However, the CTEG process, integrated with carbon capture technology, will lead to energy and economic penalties. Thus, a comprehensive evaluation of CTEG process with different CO2 capture technologies is urgently needed. This study analyzed the technoeconomic performance of four CO2 capture alternatives for the CTEG process: Rectisol, mono-ethanol amine (MEA), chilled ammonia process (CAP) and dimethyl carbonate (DMC) technologies. Results show the energy consumption of CO2 capture of the Rectisol process is the lowest, 1.88 GJ/tCO2, followed by the DMC process, 2.10 GJ/tCO2, the CAP process, 3.64 GJ/tCO2, and the MEA process, 5.20 GJ/tCO2. The CO2 capture cost of the Rectisol process is lowest, CNY 169.5/tCO2, followed by the DMC process, CNY 193.2/tCO2, the CAP process CNY 232.6/tCO2, and the MEA process CNY 250.5/tCO2. As the Rectisol technology has the best comprehensive performance, it is the best option for CTEG industry in comparison with the MEA, CAP, and DMC technologies.
1. Introduction
Ethylene glycol (EG) is one of the basic raw material of many chemical products. However, its domestic production capacity cannot meet the market demand in China. Improving the production capacity of ethylene glycol is of great significance to China’s economic development. The traditional ethylene glycol production route is based on the petroleum-based route, which consists of three steps: first, ethylene is first produced from petroleum; then, the produced ethylene is oxidized to produce ethylene oxide; finally, the ethylene oxide is hydrated to produce ethylene glycol [1]. Thus, the production scale of this route cannot be greatly increased because it depends on the scale of the supporting ethylene plant. Facing with the energy structure of rich coal and less oil, coal to ethylene glycol (CTEG) technology is drawing more and more attention in China. In 2016, the National Development and Reform Committee of China pointed out that the annual production capacity of China’s coal-based ethylene glycol will be more than 15.25 million tons by the year 2020 in the "13th Five-Year" Development Guide for Modern Coal Chemical Industry [2]. It also shows the aggressive ambitions of Chinese government to large-scale and efficient development of the CTEG industry.
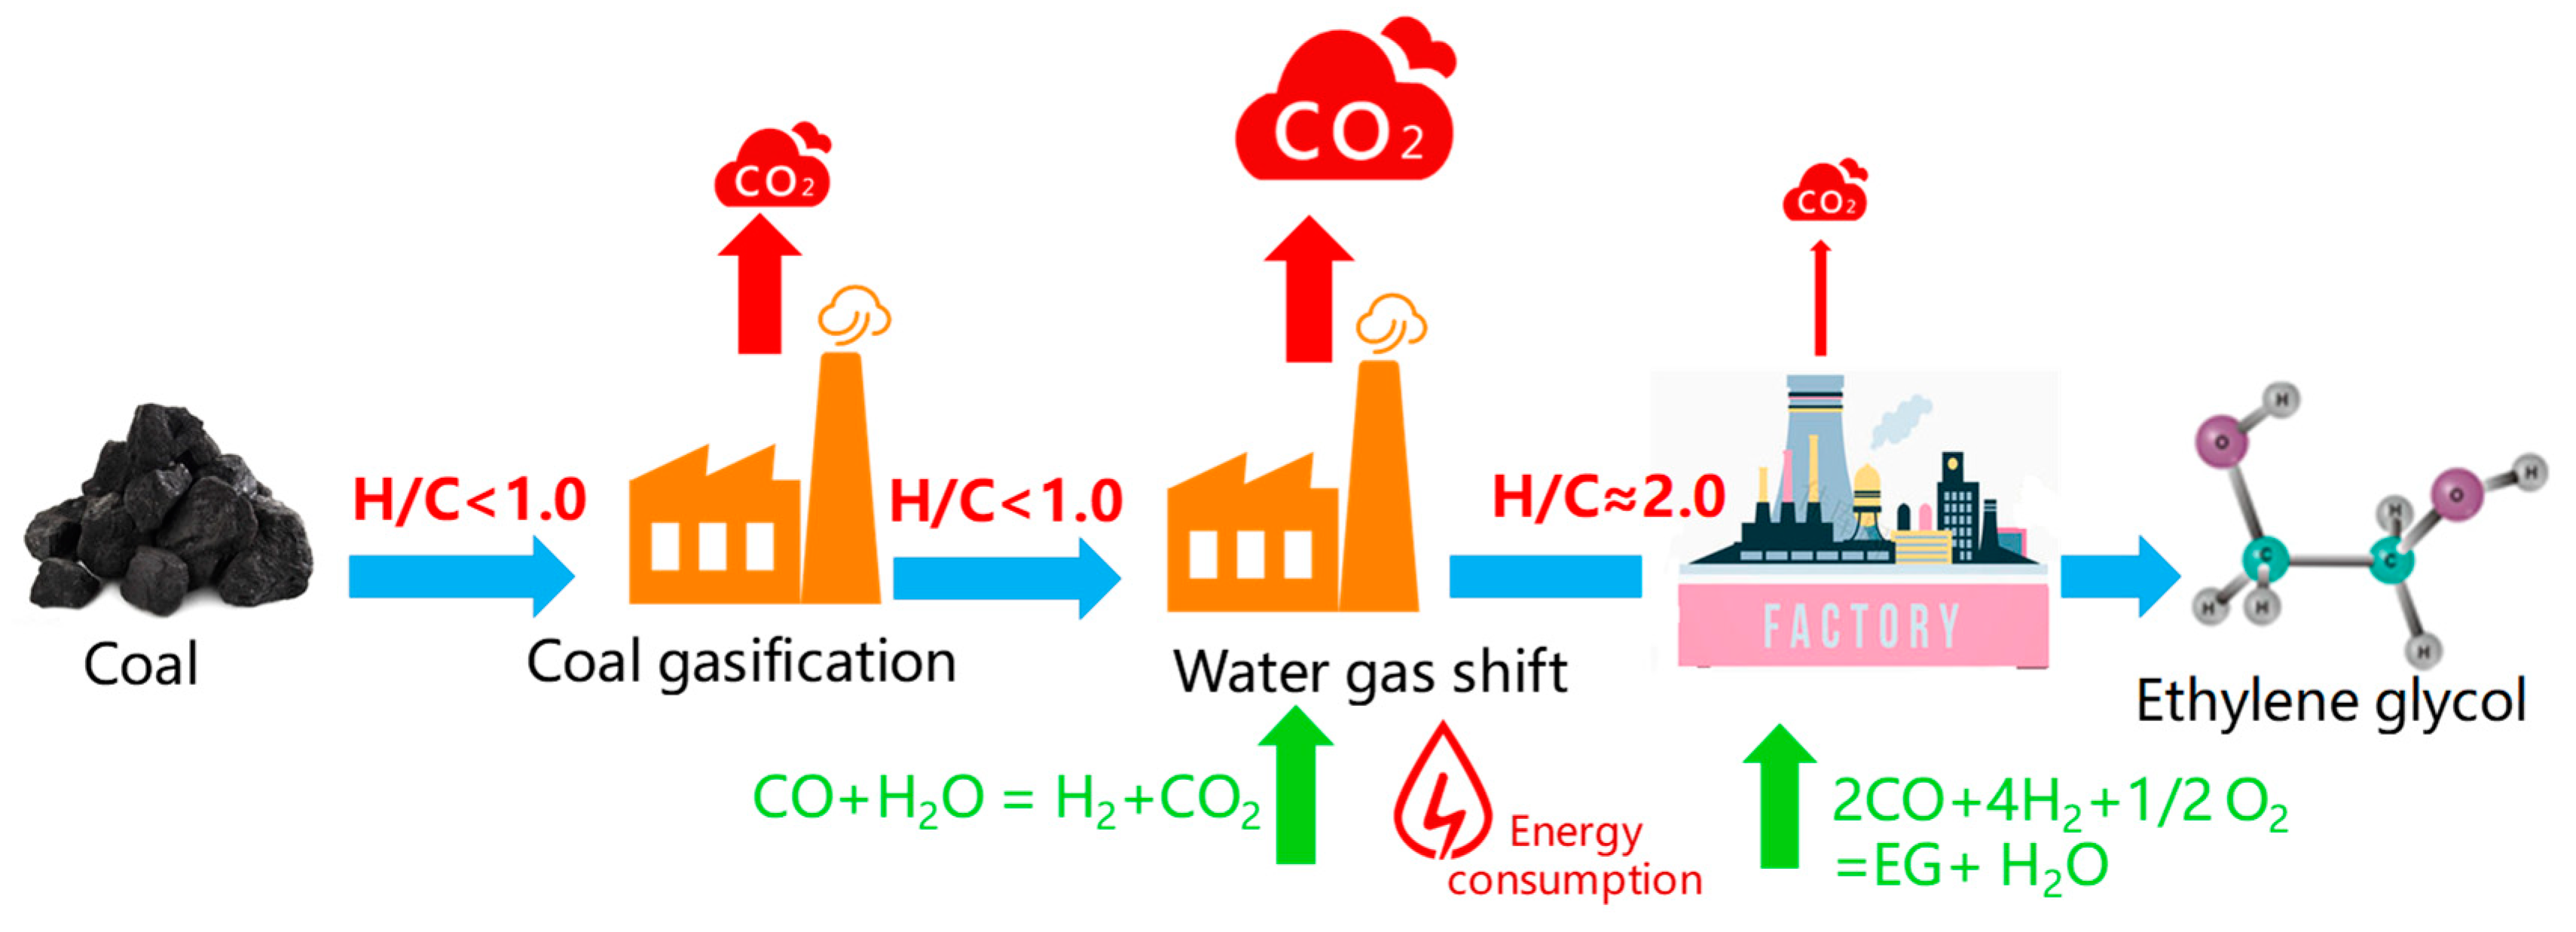
The first set of 0.2 million t/y CTEG projects was built in Tongliao in 2009. By 2018, 22 sets of CTEG plants had been successfully operated, and the total production capacity is more than 4.42 million t/y [3]. However, the CTEG technology is inevitably accompanied by high CO2 emissions as shown in Figure 1. It is mainly caused by the difference of hydrogen–carbon (H/C) ratio between raw coal and ethylene glycol product. Namely, raw coal is rich in carbon and less hydrogen, while ethylene glycol is rich in hydrogen and less carbon. In fact, the H/C ratio of raw coal is less than 1.0, resulting in that of the gasified gas is less than 1.0 [4]. However, it is required to be 2.0 for synthesizing ethylene glycol. Thus, there is a big difference of H/C ratio between the input and output of CTEG process. As a result, the CTEG process is inevitably required to add a water gas shift (WGS) unit for adjusting and increasing the H/C ratio of syngas. A large amount of CO2 generated by the water gas shift reaction, however, cannot be fixed or reused. Thereby, it causes the CTEG process to suffer from high CO2 emission.
Carbon dioxide is one of the greenhouse gases causing global warming, which contributes more than 60% of the enhanced greenhouse effect, thus reducing CO2 emissions has become one of the top goals of the world [5]. In addition, after the water gas shift unit, the shifted syngas contains a large amount of CO2, which has a significantly negative impact on subsequent ethylene glycol synthesis and refining (EGSR) unit, for example, catalyst poisoning. Thus, high CO2 emissions of the CTEG process will inevitably hinder its widespread use and sustainable development. CO2 capture is regarded as the most promising strategy to mitigate CO2 emissions and spearhead efforts to alleviate climate change [6]. Currently, lots of CO2 capture technologies have been developed, such as Rectisol, MEA (mono-ethanol amine), CAP (chilled ammonia process) and DMC (dimethyl carbonate) technologies [7]. However, CTEG process involving CO2 capture will simultaneously lead to energetic and economic penalties. Thus, it is meaningful work to analyze the effects of different CO2 capture technologies on the performance of the whole CTEG process.
Previous works are focused on the new catalysts’ development, modeling and simulation, thermodynamic analysis, economic analysis, conceptual design, and optimization of the CTEG process. For example, [8] systematically investigated the influence of low-cost dextrin coating on the performance of Cu–SiO2 catalysts for the vapor-phase hydrogenation of dimethyl oxalate to ethylene glycol. Wei et al. [9] focused on the improved design of the reactors and separation strategies, which proposed a new four-stage fixed bed tube-type CO coupling reactor (CCR). Yang et al. [10,11] developed two coke oven gas-assisted coal to ethylene glycol processes to improve the technoeconomic performance and reduce the CO2 emissions of the conventional CTEG process. However, little work has studied the effects of different CO2 capture technologies on the performance of the CTEG process.
However, there is a lot of literature on another coal-gasification-based process, integrated gasification combined cycle (IGCC) process. For example, Rezvani et al. [12] analyzed the techno-economic characteristics of IGCC process with four different capture technologies. Giuffrida et al. [13] focused on the thermodynamic performance of two IGCC systems with post-combustion CO2 capture by chemical absorption to evaluate two different strategies of coal-derived gas clean-up. Shi et al. [14] developed a new integrated gasification combined cycle (IGCC) plant with CO2 capture to achieve deep reductions in emissions of CO2. Comparing the IGCC process with CO2 capture, only part of the syngas produced from coal gasification unit is fed into the water gas shift unit in the CTEG process, which is usually less than 50% of the total syngas. Therefore, a considerable part of the CO gas is kept in the input gas of the acid gas removal unit. Since CO is the raw material for the synthesis of ethylene glycol, in addition to the high CO2 removal ratio, the CTEG process with different CO2 capture technologies must also have a high CO recovery ratio. However, it does not need this in the IGCC process. On the other hand, the mole fraction of CO2 in the input gas of acid gas removal unit of CTEG process is lower than that of IGCC by 10–20%, which means the carbon capture in CTEG process may be more complicated than the IGCC process [15]. In summary, different from the IGCC process, the carbon capture in the CTEG process is characterized by higher CO and lower CO2.
As to a project investor or decision maker, the technoeconomic performance of different alternative technologies is one of the most concerned and important performances when they attempt to select the best technology solution. For example, Pettinau et al. [16] conducted a techno-economic comparison between different technologies for CO2-free power generation from coal. In our previous work [17], a thermodynamic and techno-economic analysis of the CTEG process with different gasifiers was conducted to make the appropriate and reasonable decision and choice of efficient, economical and cleaner coal gasifier technologies. However, not many literature has been reported to the optimal selection of CO2 capture technology for the CTEG process through technical and economic analysis. Therefore, the technoeconomic performance of CTEG process with different CO2 capture methods is conducted and compared to find the optimal CO2 capture way for this process.
To achieve mid to long-term CO2 reduction targets, cost effective CO2 capture from CTEG plants needs to be evaluated, keeping in view of China’s growing demand of ethylene glycol. This study is focused on systematically analyzing and comparing the CTEG process with different CO2 capture absorption technologies, i.e., Rectisol, MEA, CAP and DMC technologies. The main contributions of this work are: (1) the detailed model of the CTEG process with different CO2 capture technologies (i.e., Rectisol, MEA, CAP and DMC) is established; (2) the energy consumption of CO2 capture and the whole system is analyzed on the basis of the energy balance; (3) the total capital investment, total production cost and internal rate of return of the above CTEG processes are compared to demonstrate their economic advantages and competitiveness; (4) the comprehensive performance of these processes is assessed to seek the most promising CO2 capture technology for the CTEG process.
2. Process Description and Modeling
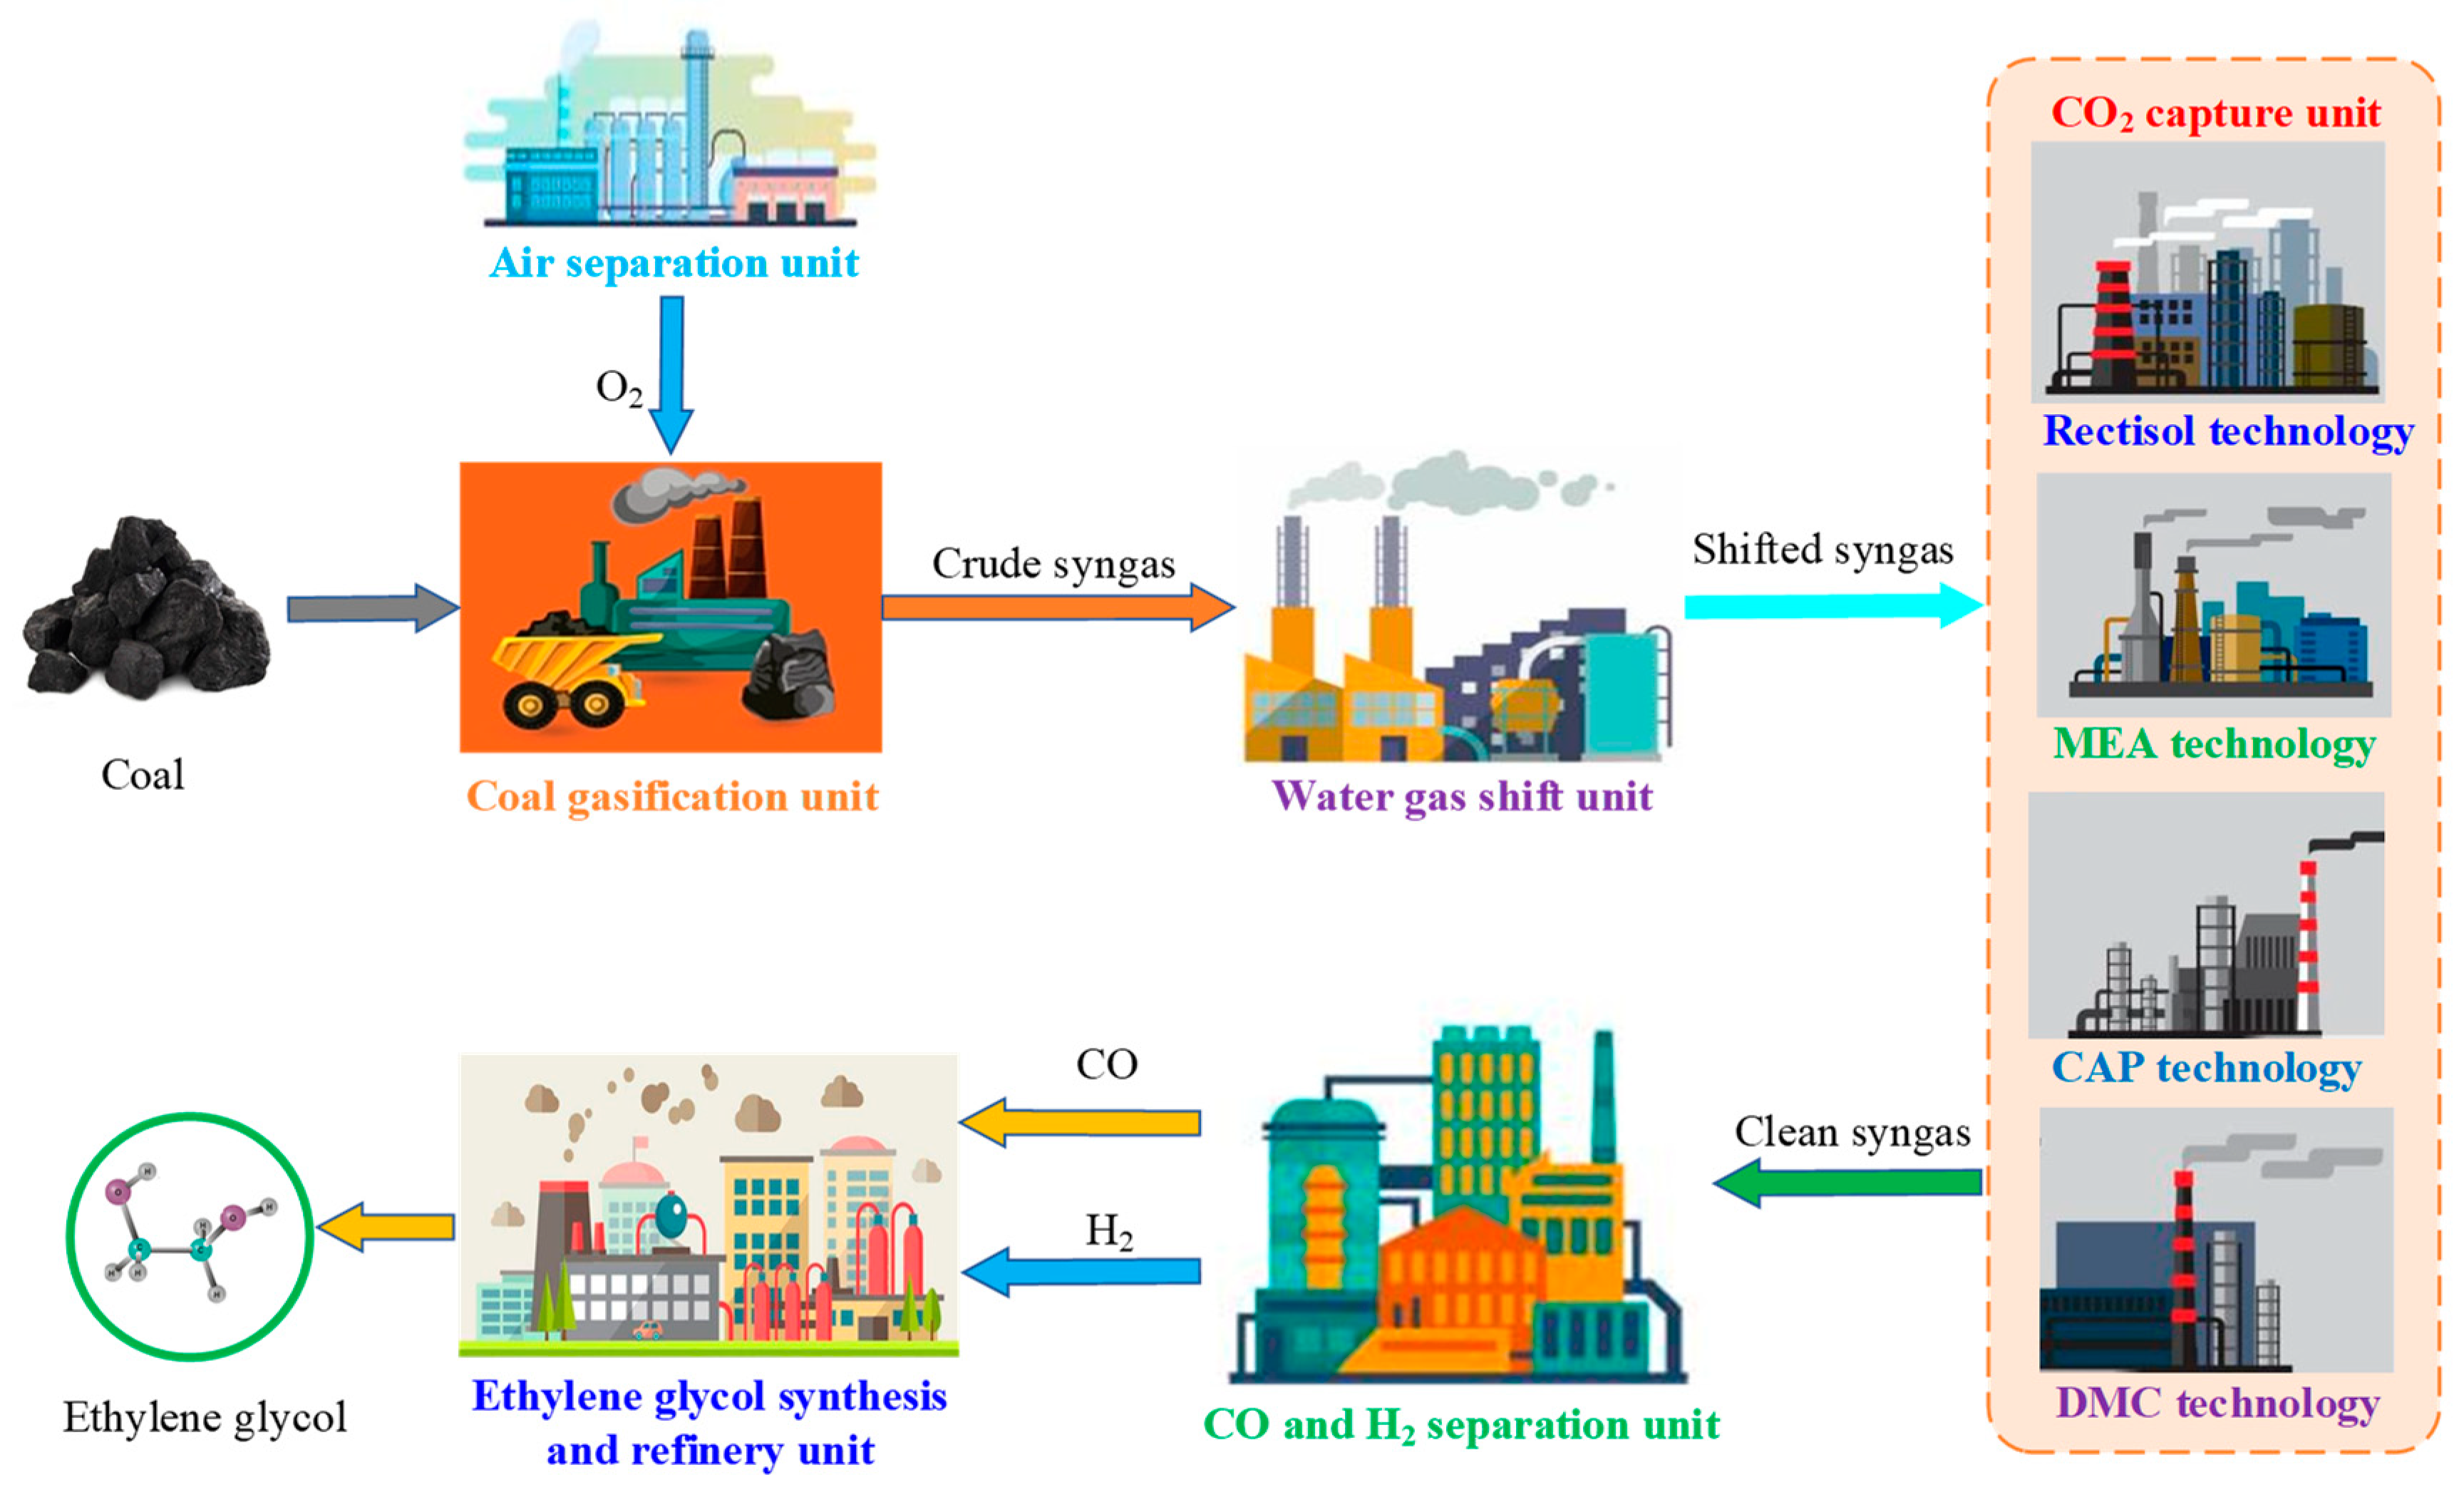
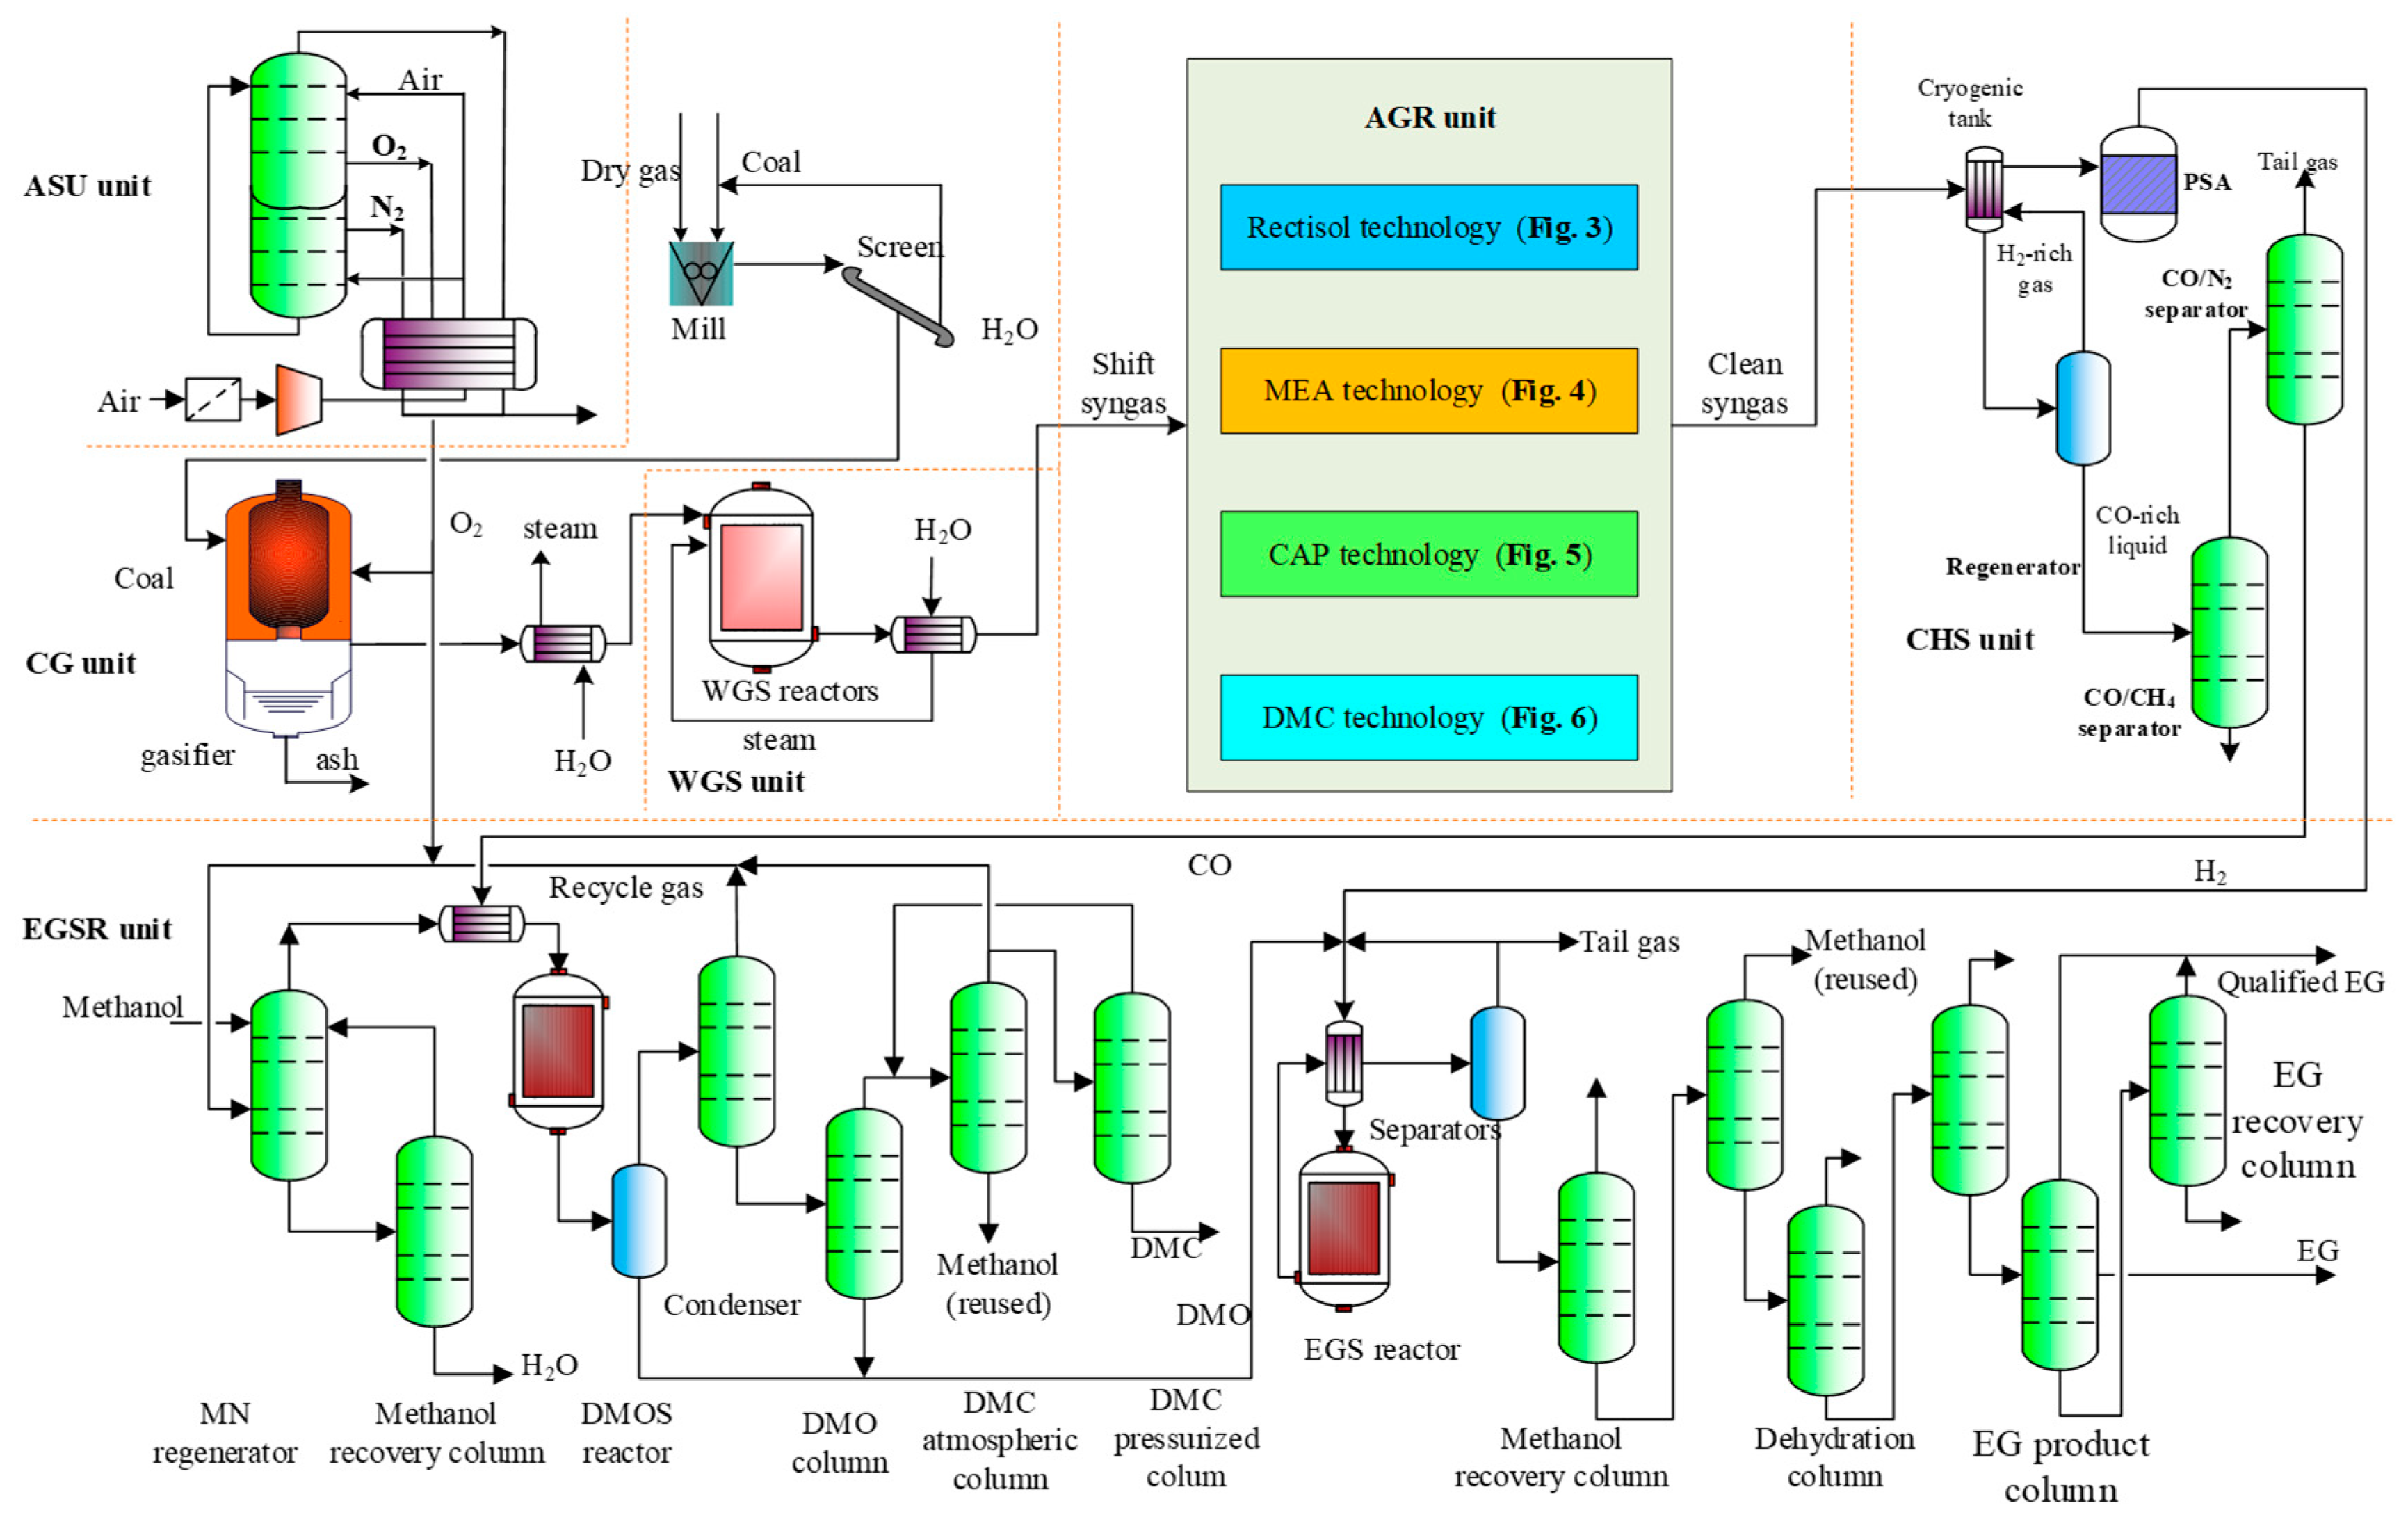
A conventional CTEG process consists of six units: air separation unit (ASU), coal gasification (CG), water gas shift, acid gas removal (AGR), CO and H2 separation (CHS), and ethylene glycol synthesis and refinery units, as shown in Figure 2. The models of these units are developed using the Aspen Plus simulator (Version 11.0), which is a large-scale general process simulation software for the design, simulation and optimization of chemical industry. The details of the modeling and simulation of these units are explained as follows.
2.1. Air Separation Unit
Due to the high oxygen consumption of coal-based chemical industries, the mature and widely used cryogenic air separation technology is selected in this work. The Peng–Rob method is selected as the physical property method of this unit. After cleaning, the air is compressed into an air separation column to separate O2. The four-stage air compressor and the inter-stage cooler models are used to simulate the intercooling compression equipment. As a result, the concentration of the output oxygen is about 95 mol%, which is used as an oxidant in the coal gasification unit.
2.2. Coal Gasification Unit
The coal gasification is a complex process involving a series of physical and chemical interactions as shown in Table S1 in the Supplementary Material [18]. In this work, Huolinhe lignite is selected as the feedstock of the coal gasification unit, and the dry pulverized coal gasification technology, Choren coal gasifier (CCG), is adopted. The Peng–Rob method is selected as the physical property method of CG unit [19]. After pretreatment, coal is fed into the gasifier to produce syngas. For modeling, a yield reactor, a continuous stirred tank reactor, and a Gibbs reactor are used to model the coal drying, pyrolysis, as well as gasification and combustion stages, respectively. The detailed simulation model of the gasifier is shown in Figure S1 in the Supplementary Material. After recovering the waste heat, the crude syngas is sent to the water gas shift unit to adjust the hydrogen to carbon ratio. More detailed information of the modeling and simulation of coal gasification unit can be found in our previous work [20].
2.3. Water Gas Shift Unit
The H2/CO ratio of the crude syngas produced by the coal gasification unit is far from the requirements of ethylene glycol synthesis reaction. Therefore, the H2/CO ratio has to be adjusted to be about 2.0 by the water gas shift reaction, as shown in Equation (1). Two equilibrium reactors are used to model this reaction for a high conversion of syngas [21]. In addition, a number of coolers and heat exchangers are used to generate saturated steam. The shifted syngas is finally cooled to 40 °C and is then fed into the acid gas removal unit [21]. The whole simulation flowsheet and key operational parameters of the WGS unit are shown in Figure S2 and Table S2 in the Supplementary Material.
2.4. Acid Gas Removal/CO2 Capture Unit
To prevent poisoning of dimethyl oxalate and ethylene glycol synthesis catalysts, the acid gases (such as CO2, H2S and COS) should be firstly removed or captured. In this work, three mature CO2 technologies, i.e., Rectisol (methanol as absorbent), MEA (monoethanol amine as absorbent) and CAP (chilled ammonia as absorbent) technologies, and a novel DMC technology (dimethyl carbonate as absorbent) are compared to seek out the most economically CO2 capture method for CTEG process. Membrane separation technology, one of new chemical separation technologies, is based on the difference of the permeation rate of each component in the membrane. However, as for large-scale CO2 capture systems, the membrane separation method still has a large gap in production cost and reliability. Thus, it is not discussed in this paper. In addition, there is a gas pretreatment subprocess and a H2S removal subprocess before CO2 capture subprocess, and these three subprocesses are the main components of the acid gas removal unit. As H2S removal and CO2 capture are simultaneously considered and inseparable in the AGR unit in the coal chemical industry, H2S removal and CO2 capture processes are considered as a whole to analyze their effects on the performance of CTEG process rather than considering the endogenous relationship between them. To facilitate the modeling and simulation of the CTEG process with different CO2 capture technologies, their Aspen Plus model and key parameters are summarized and presented in Table 1.
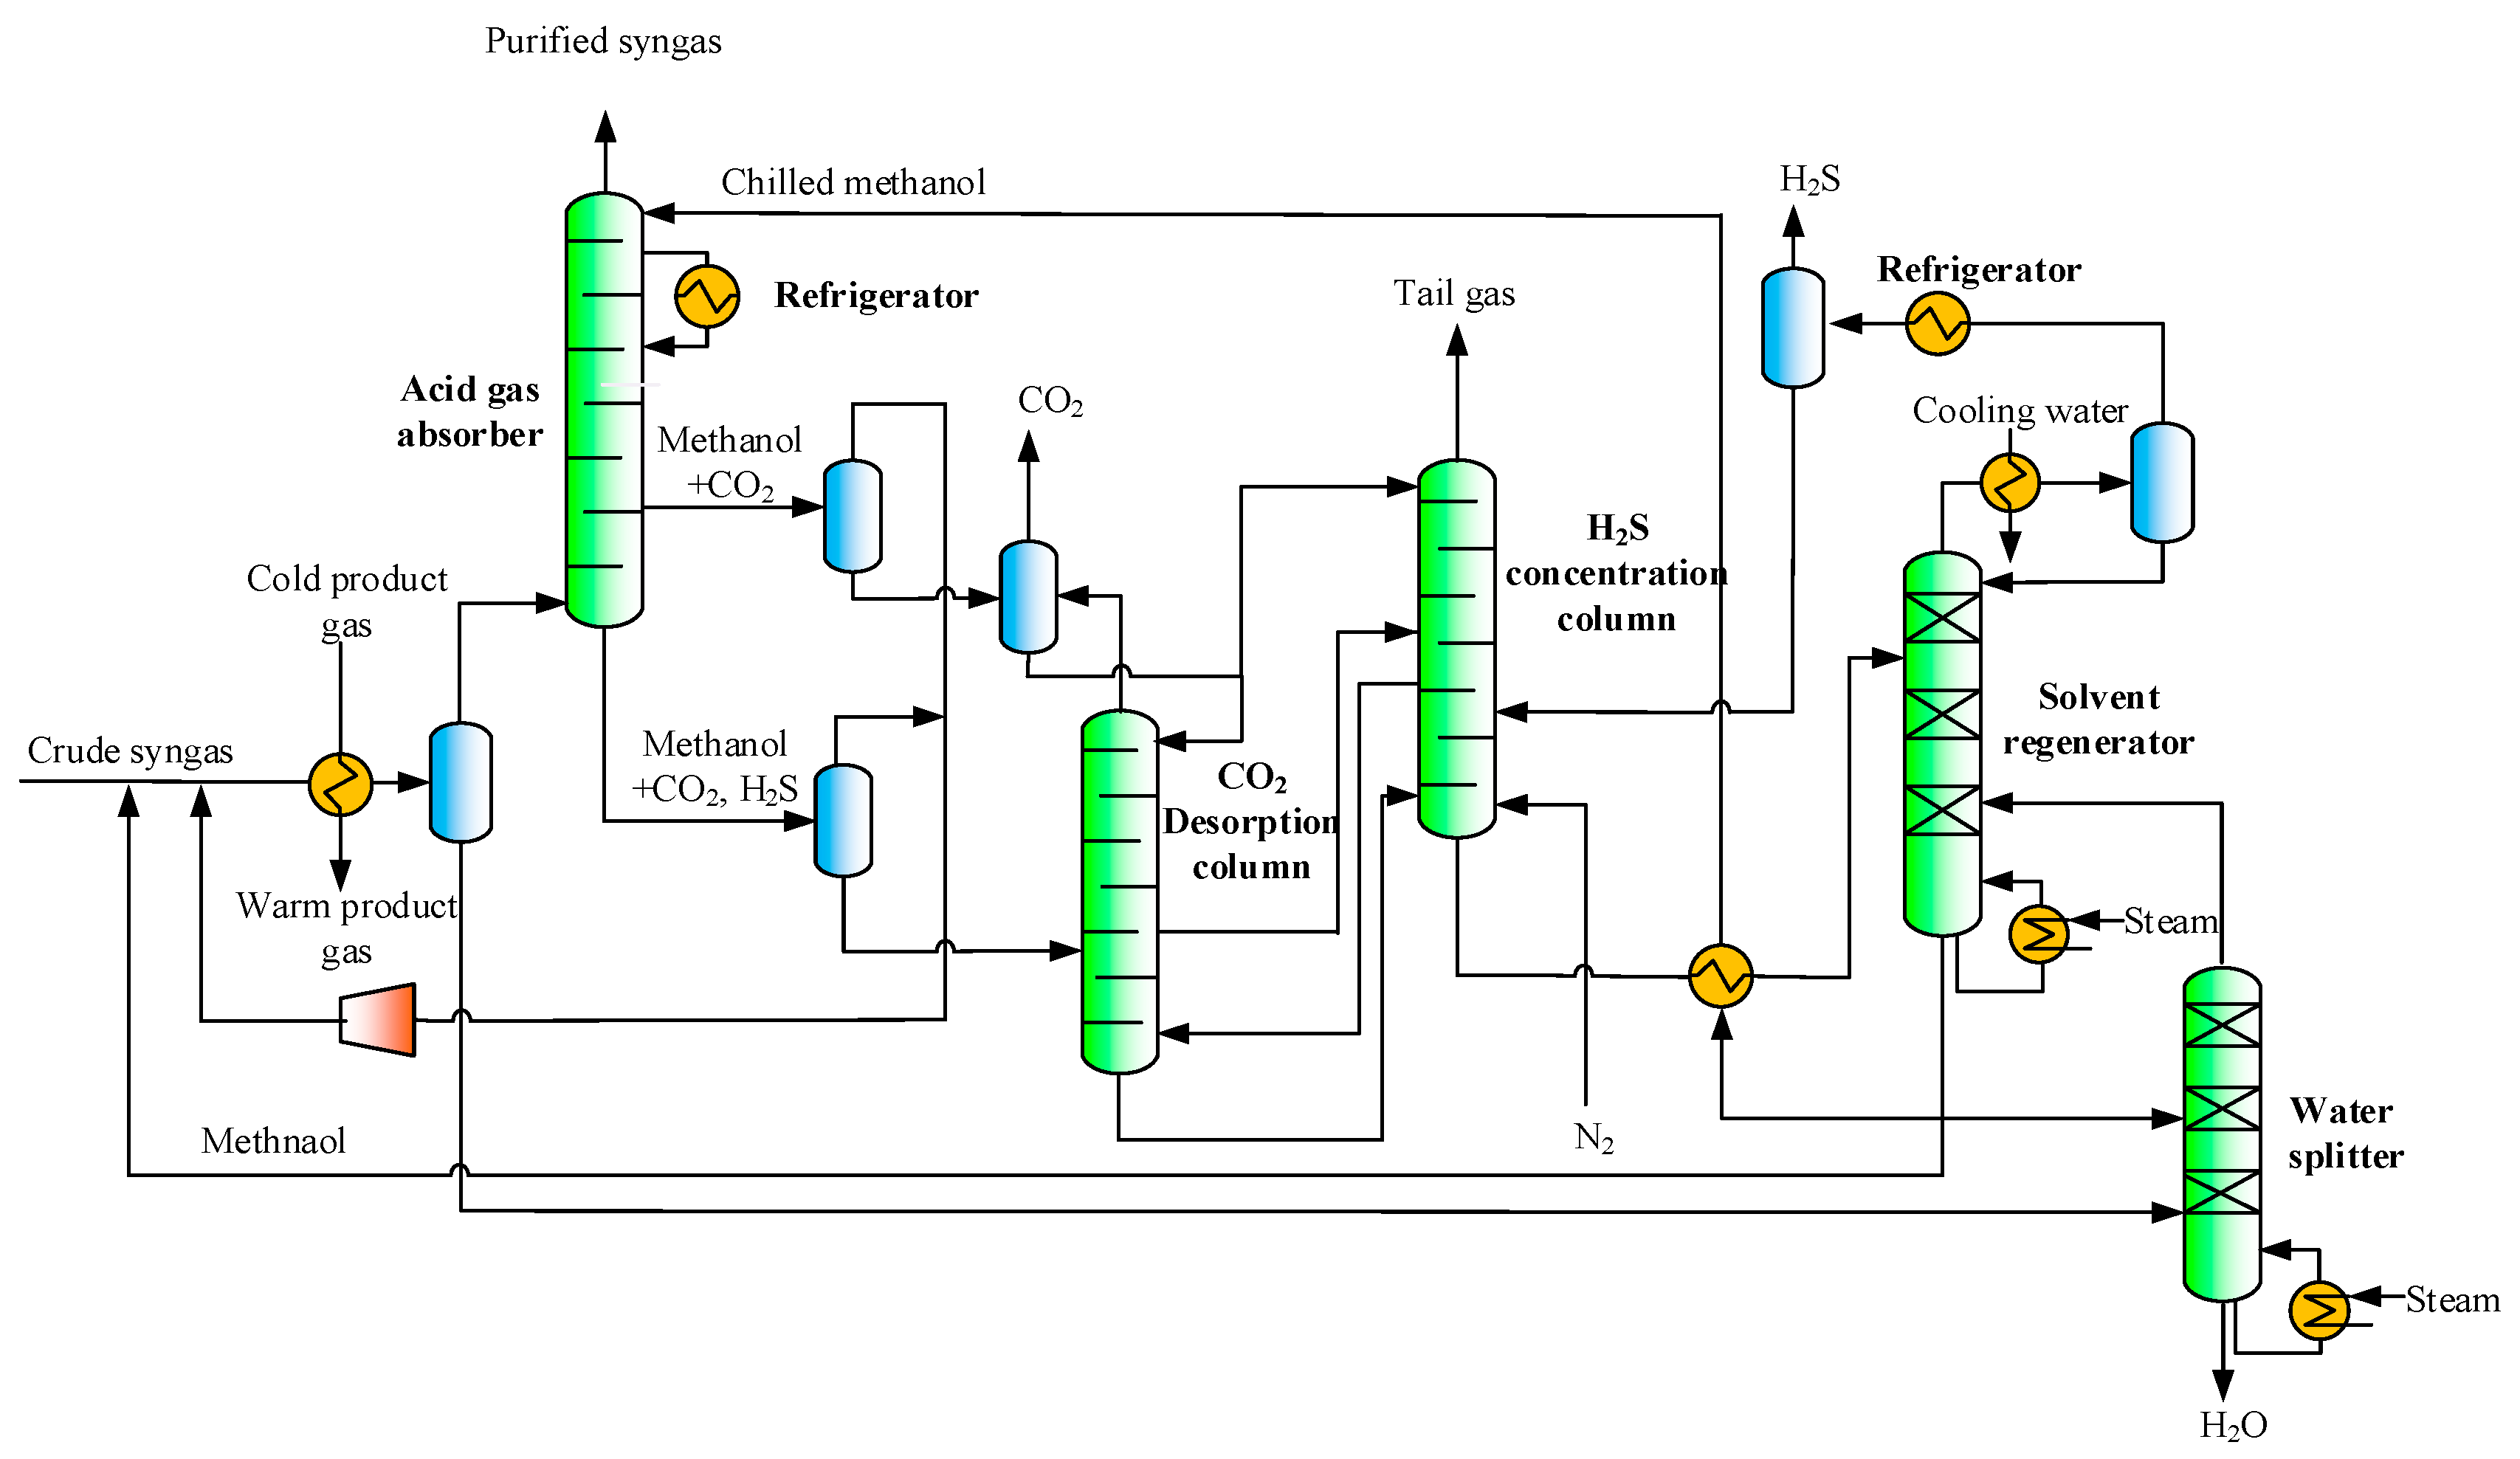
2.4.1. Rectisol Technology
The Rectisol acid gas removal technology uses physical absorbent, chilled methanol (chilled to −50 °C), to remove CO2 and H2S from syngas [23]. It mainly consists of acid gas absorption column, CO2 desorption column, H2S concentration column, solvent regenerator and flashes as shown in Figure 3. After being cooled by the low-temperature product gas, the syngas is pre-cooled to −20 °C and goes to flash to remove water. The output gas of the flash is fed to the bottom of the acid gas absorption column, where it is in countercurrent contact with low temperature methanol at −50 °C. As a result, the CO2 and H2S of syngas are sufficiently absorbed by the low-temperature methanol, and the purified syngas is obtained from the top of the absorption column [23].
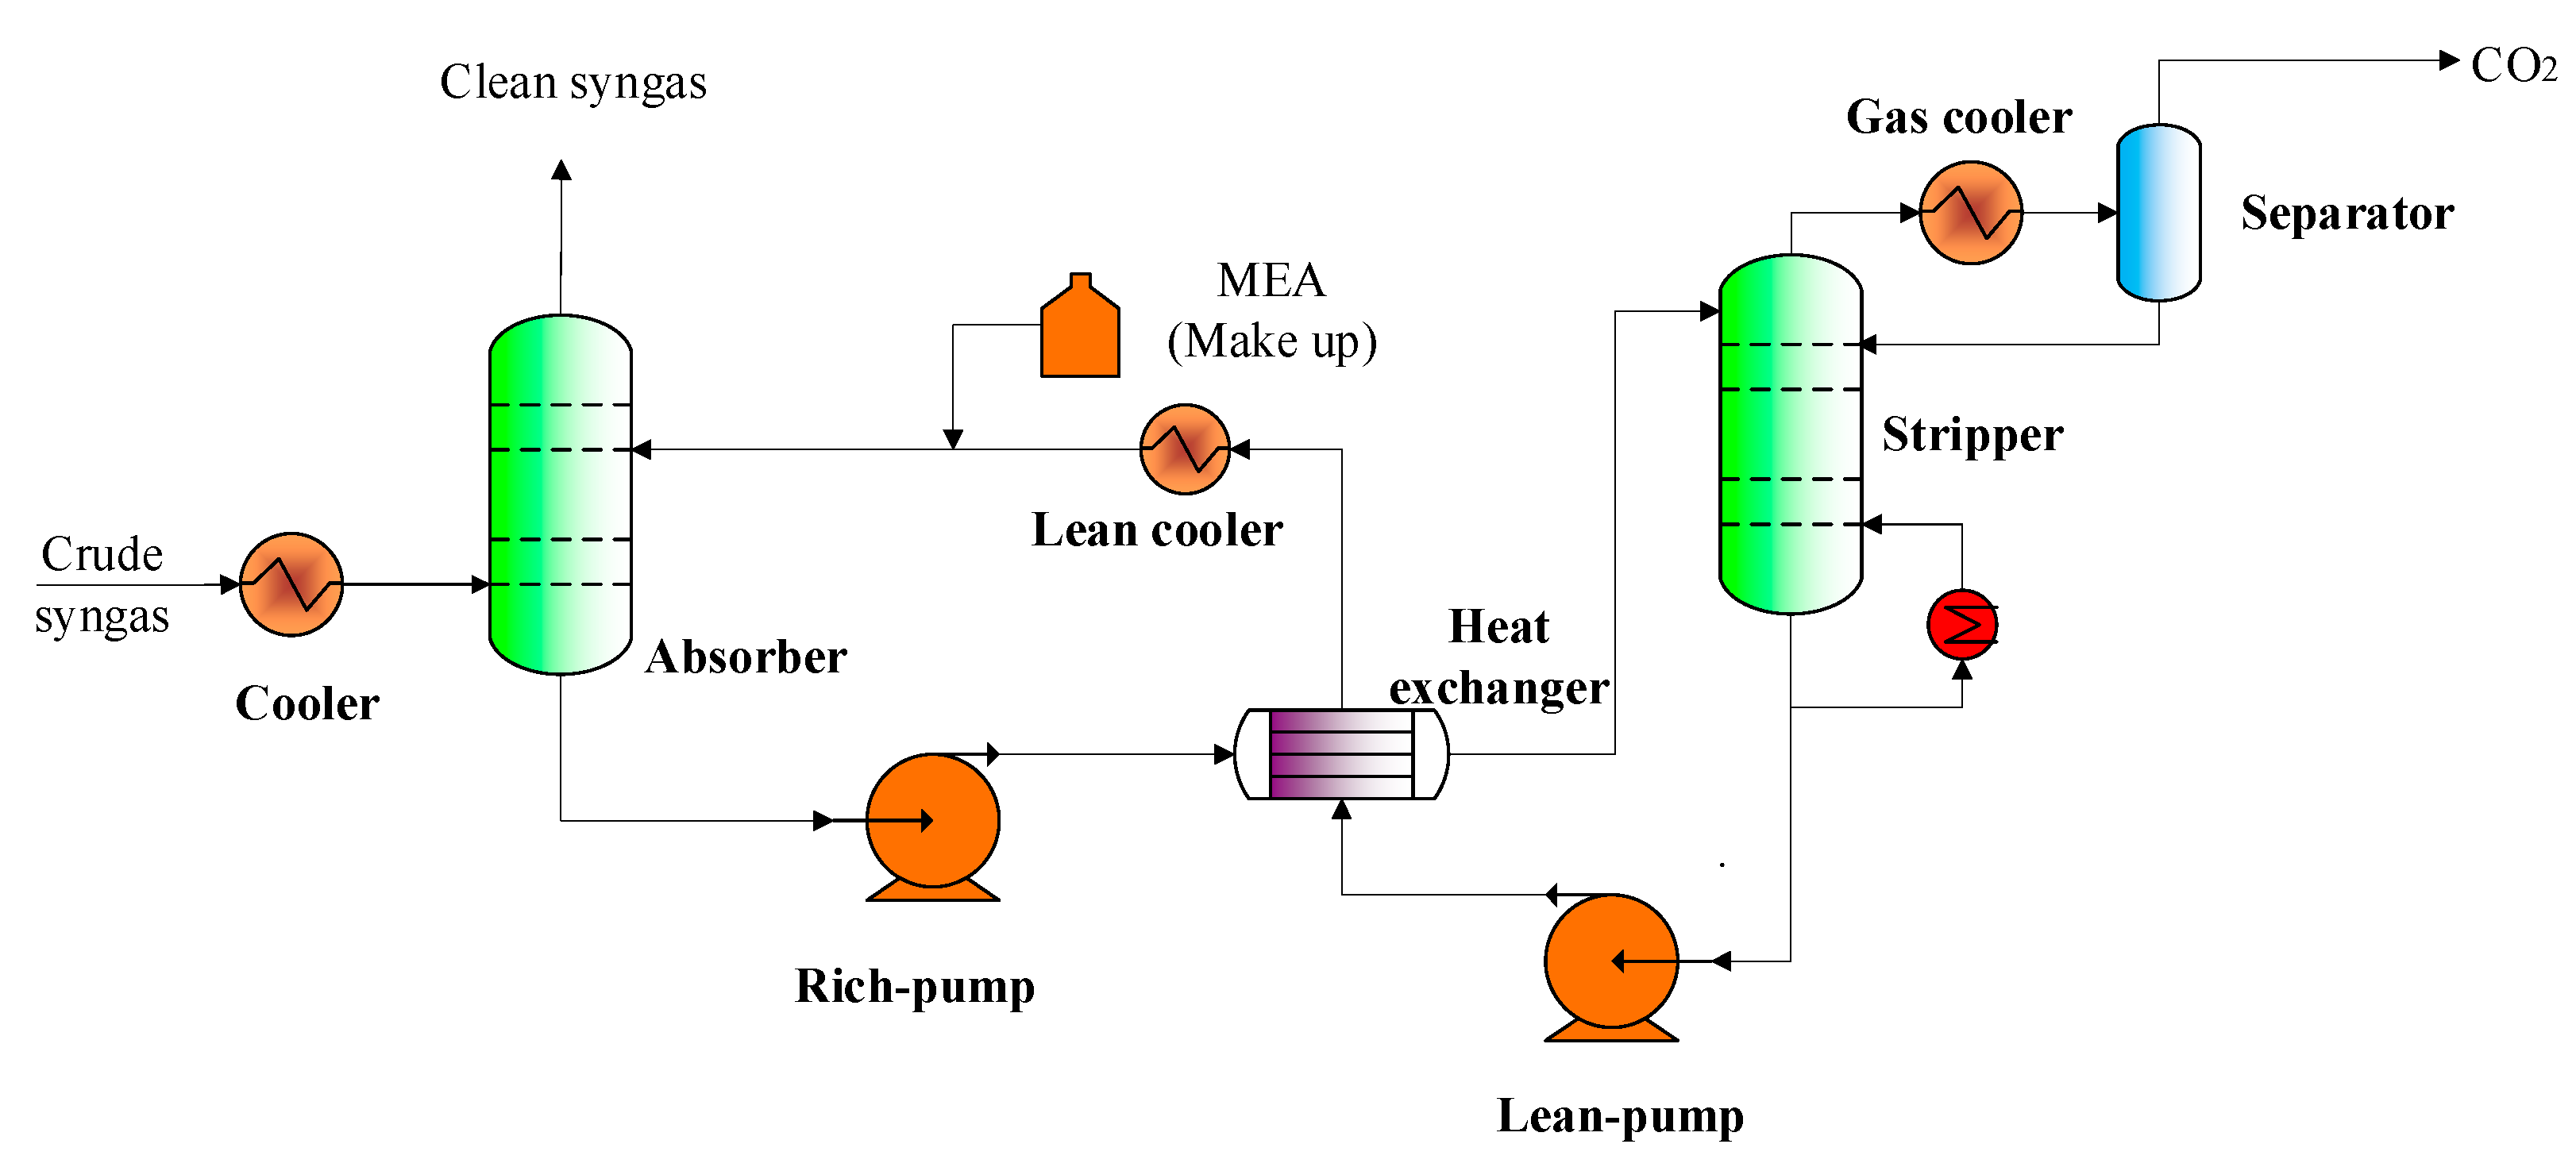
2.4.2. MEA Technology
The MEA technology, one of mature gas stream scrubbing methods, has been industrialized for almost 70 years [15]. Its simplified flowsheet is shown in Figure 4 [24]. The crude syngas is previously cooled and purified by reacting with the lean amine solution in the absorber as shown in Equations (2)–(8) [22]. The rich amine solution out from the absorber goes to the stripper after heated with the lean amine solution. The electrolyte non-random-two-liquid (NRTL) model with electrolyte inserts for the MEA physical property method is selected as the physical method due to it contains new parameters and Henry’s constant for CO2 in MEA [25]. The key parameters for the modeling and simulation of this technology are present in Table 1.
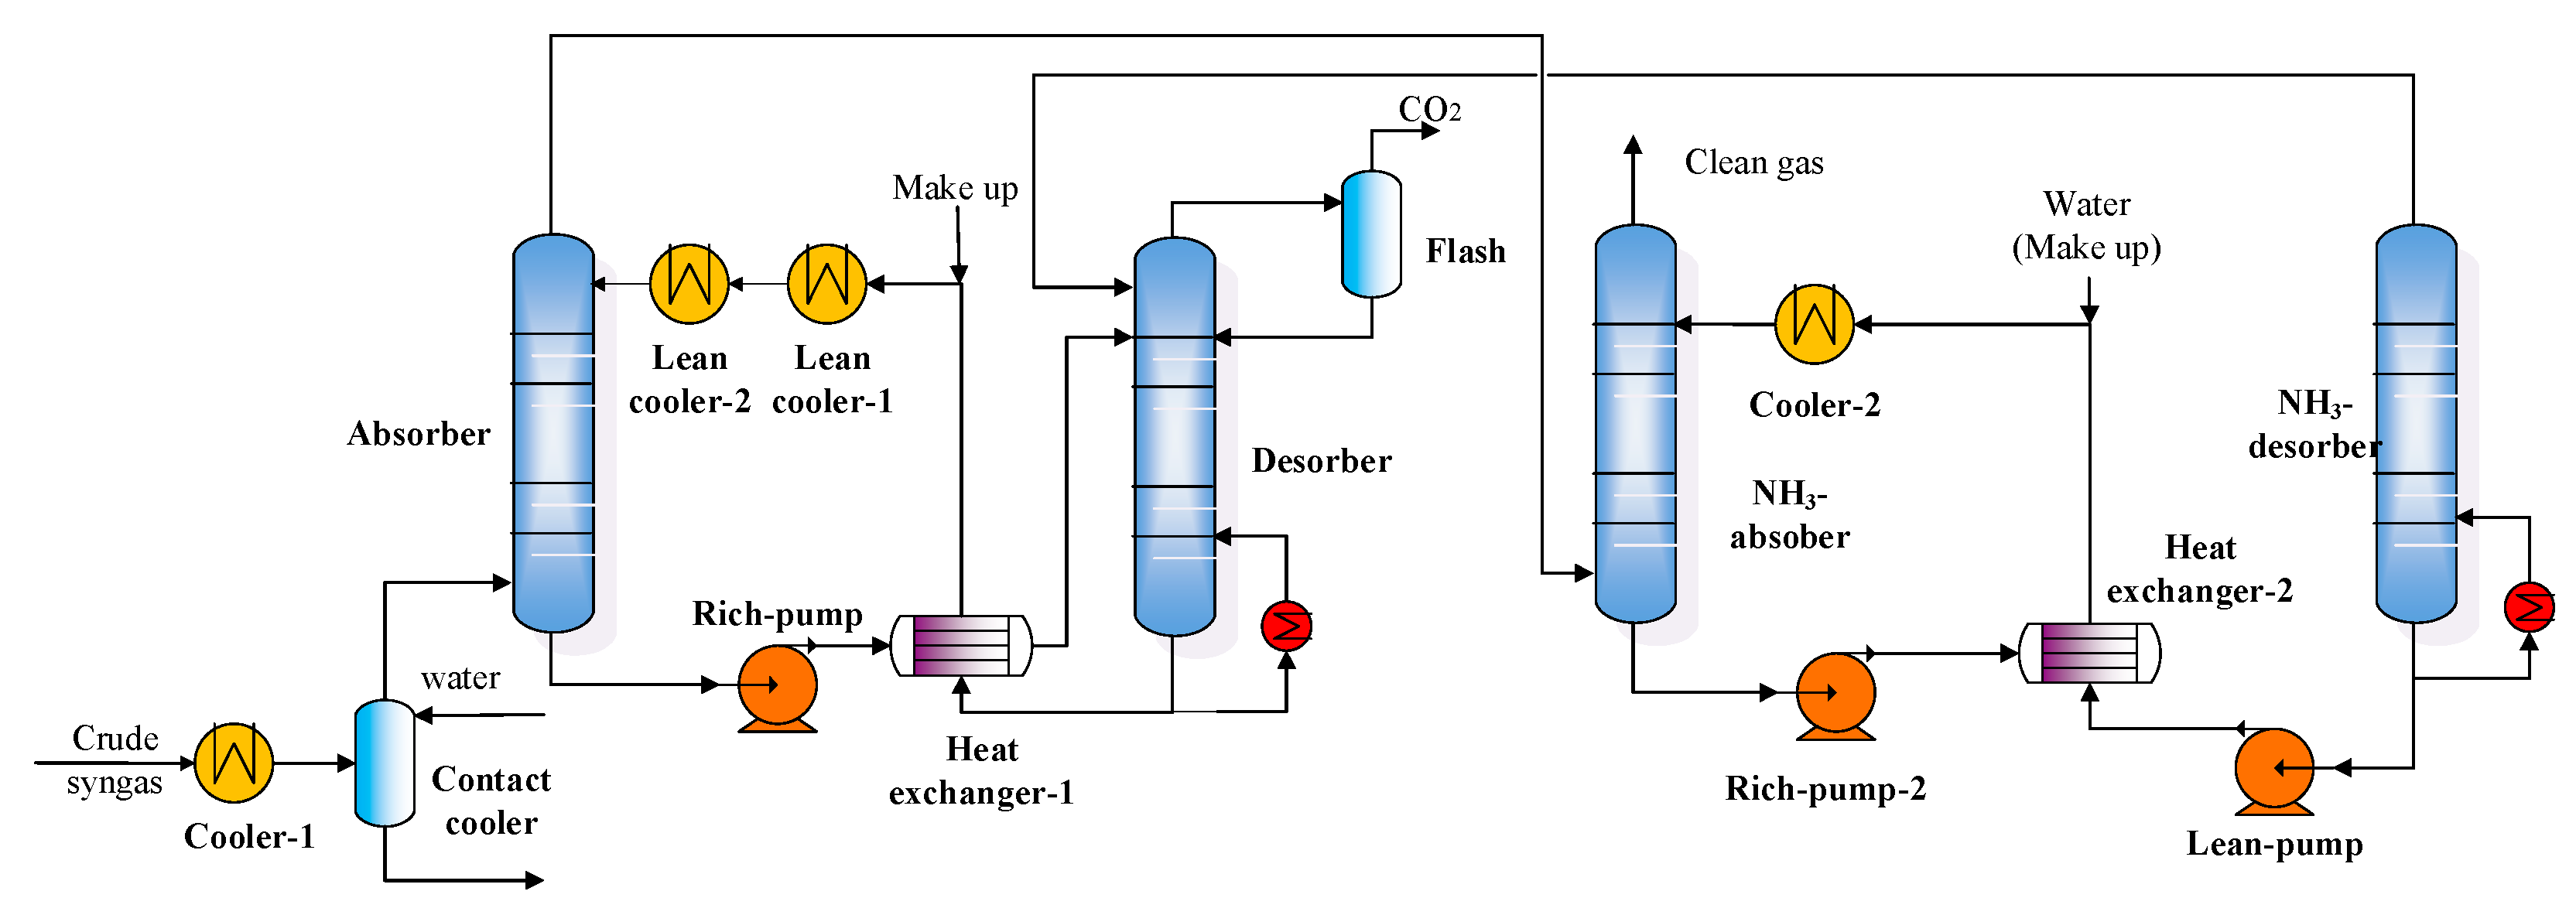
2.4.3. CAP Technology
The chilled ammonia process (CAP) is divided into carbon dioxide capture system and ammonia capture system as shown in Figure 5. The crude syngas is cooled to 10 °C and fed to the absorber. The lean ammonia solution is sent to the top of the absorber to remove CO2 in the syngas. The rich ammonia solution is sent to the solvent regeneration column after heat exchange with the lean solution. The lean ammonia solution from the bottom of the desorber is recycled to the absorber. Although the CAP process greatly reduces the escape ratio of ammonia in the absorber of the carbon dioxide capture system, the exhaust gas from the top of this column still contains a large amount of ammonia gas [26]. Thus, an additional ammonia capture system is required to further reduce ammonia in the exhaust gas. The syngas from the top of the absorber enters the ammonia capture system and is contacted with the low-concentration ammonia solution in the NH3-absorber. As a result, the concentration of ammonia in the syngas can be less than 10 ppm. The key parameters for the modeling and simulation of this technology are indicated in Table 1.
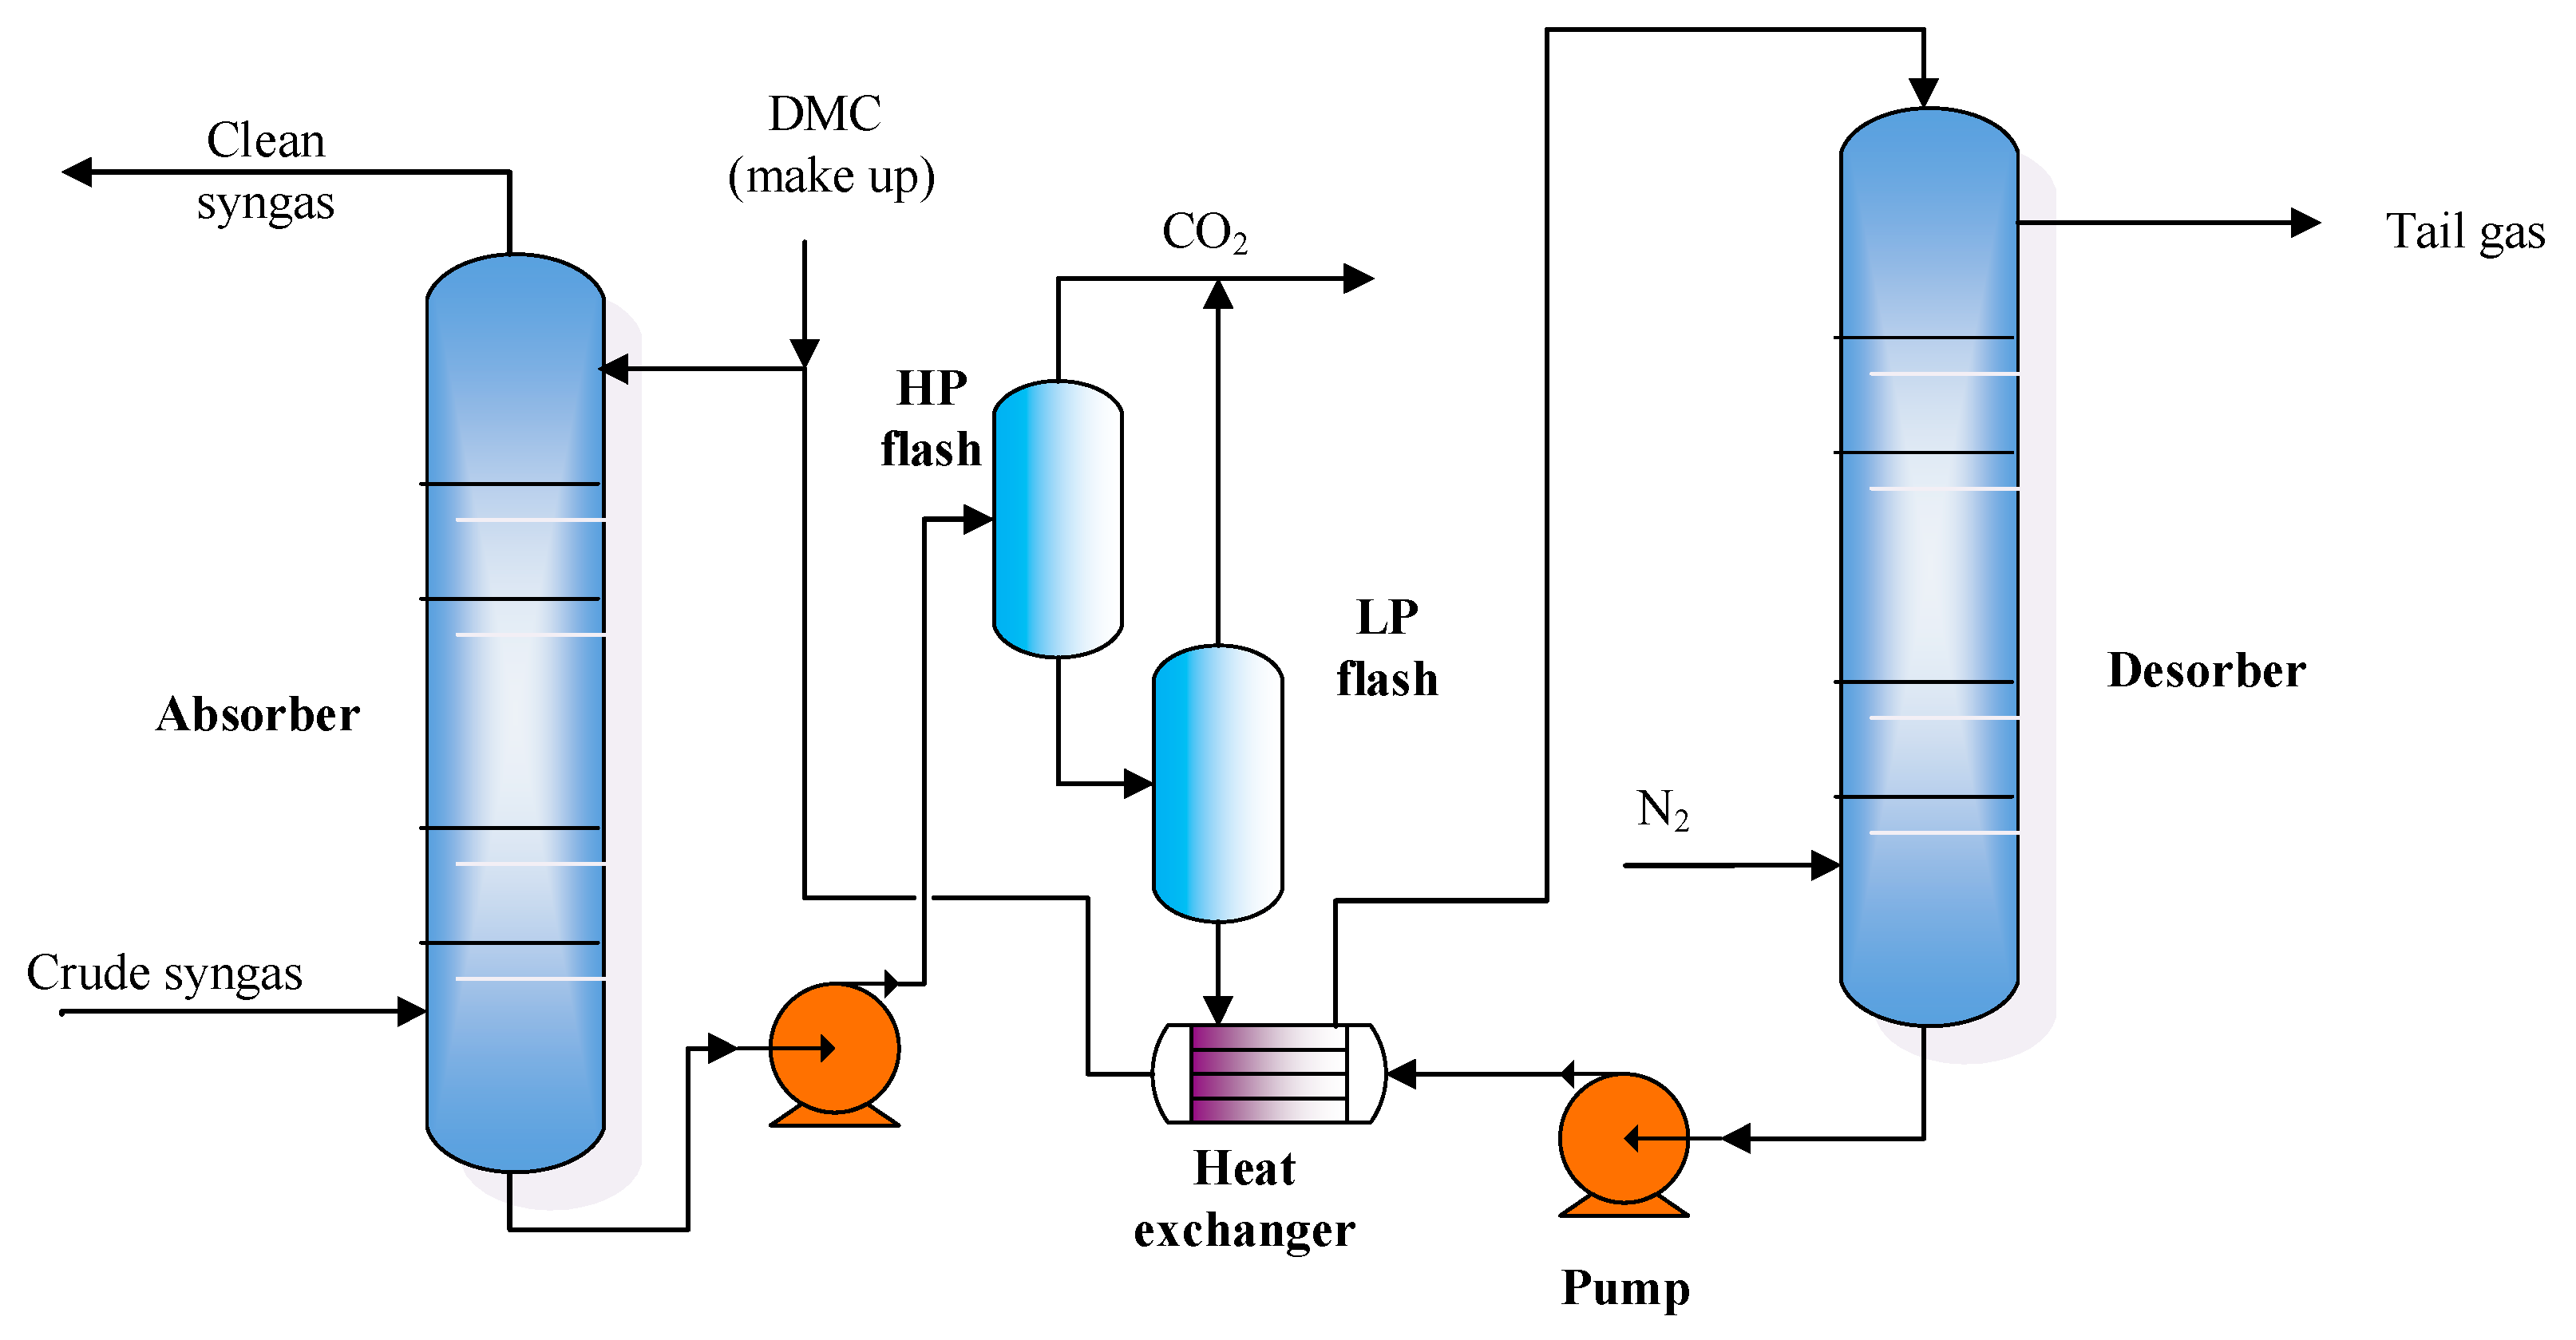
2.4.4. DMC Technology
Due to high solubility of CO2 in DMC and a low toxicity, it shows a better performance over traditional physical solvents in an appropriate temperature range and is regarded as a promising and effective absorbent for CO2 capture [15]. The simplified flowsheet of the DMC technology is present in Figure 6. The syngas counter-currently contacts with the lean DMC solution under the conditions of 3.0 MPa and 15 °C. The rich solution enters the high- and low-pressure flashes to regenerate lean solution. After mixing with makeup DMC, the lean solution is recycled to the absorber. The key parameters for the modeling and simulation of this technology are shown in Table 1.
2.5. CO and H2 Separation Unit
The purified syngas is cooled in the main heat exchanger and then sent to a flash. The gas stream of the flash is heated and fed into the PSA equipment to obtain high-purity hydrogen. The liquid stream of the flash is successively sent to the CO/CH4 and CO/N2 separation columns to produce high-purity CO. The tail gas of this unit can be used as additional fuel to provide heat of coal gasification or other units. The RK-SOVE method is selected as the physical property method of this unit.
2.6. Ethylene Glycol Synthesis and Refinery Unit
The high-purity CO from the CHS unit is reacted with methyl nitrite (MN) and converted to dimethyl oxide (DMO) as shown in Equation (9) [27]. The NO is reacted with oxygen and methanol to produce methyl nitrite as shown in Equation (10), which is recycled and used as the raw material of the DMO synthesis reaction.
After separation and purification processes, the DMO stream enters the ethylene glycol synthesis reactor, in which it is reacted with the hydrogen from the CHS unit to produce ethylene glycol as shown in Equations (11)–(13) [9]. The kinetic data of these reactions are shown in Table S3 in the Supplementary Material. Considering the main components are polar substances, this unit uses the NRTL-RK method as the thermodynamic method.
The output of the ethylene glycol synthesis reactor enters the high- and low-pressure flashes for preliminary separation. The liquid stream is sent to the ethylene glycol refinery system, which involves five columns: the methanol recovery column, dehydration column, dealcoholization column, EG product column and EG recovery column [20]. In the first column, the recovery methanol is recycled to synthesize MN. The dehydration and dealcoholization columns are used to remove water and low-boiling alcohols. Finally, the high-purity ethylene glycol product is obtained from the ethylene glycol product and recovery columns.
2.7. Flowsheet Simulation and Validation
A simplified simulation flowsheet of the CTEG process with different CO2 capture technologies is shown in Figure 7. To simulate the whole flowsheet of CTEG process, the key parameters for modeling and simulation of four different CTEG processes with Rectisol, MEA, CAP and DMC technologies are shown in Table 2. After simulation, the mass and energy balance of these processes are then obtained with the aid of simulator, Aspen Plus software. Table 3 shows the comparison results of the simulation and literature reported data of the key streams. It can be seen that the simulation results are in good agreement with the literature reported data, i.e., the established models of four CTEG processes can be used for the following system analysis. The basic performance of the whole CTEG process in terms of the simulation results is present in Table 4. The CTEG process consumes 118.98 t/h raw coal to produce 37.50 t/h ethylene glycol products and about 2.19 t/h CO2 are captured in the AGR unit. Thus, the technical and economic performance of these processes are analyzed and compared based on the simulation results.
3. Comparison of the Four Different CO2 Capture Technologies
In this study, the energy consumption, capital investment, CO2 capture cost, production cost, and internal rate of return are conducted to compare the technoeconomic performance of the CTEG process with Rectisol, MEA, CAP and DMC technologies.
3.1. Comparison of Energy Consumption and Energy Efficiency
In this section, the energy consumption of CO2 capture, the total energy consumption and energy efficiency of whole CTEG processes are performed to compare the technical performance of the CTEG process with different CO2 capture technologies. The calculation of the energy consumption of CO2 capture with Rectisol, MEA, CAP and DMC technologies is shown in Equation (14). Referring to the total input and output energy, the energy efficiency of the CTEG process with different CO2 capture technologies can be analyzed as shown in Equation (15).
where W means the total energy consumption of CO2 capture; Qreb is the heat duty of the regeneration process; Wcol, Wcom and Wpum are the work consumption of cooling equipment, compressors and pumps, respectively; η is the energy efficiency; Eoutput is the energy of output ethylene glycol; Einput is the total input energy including coal, electricity, steam, etc.
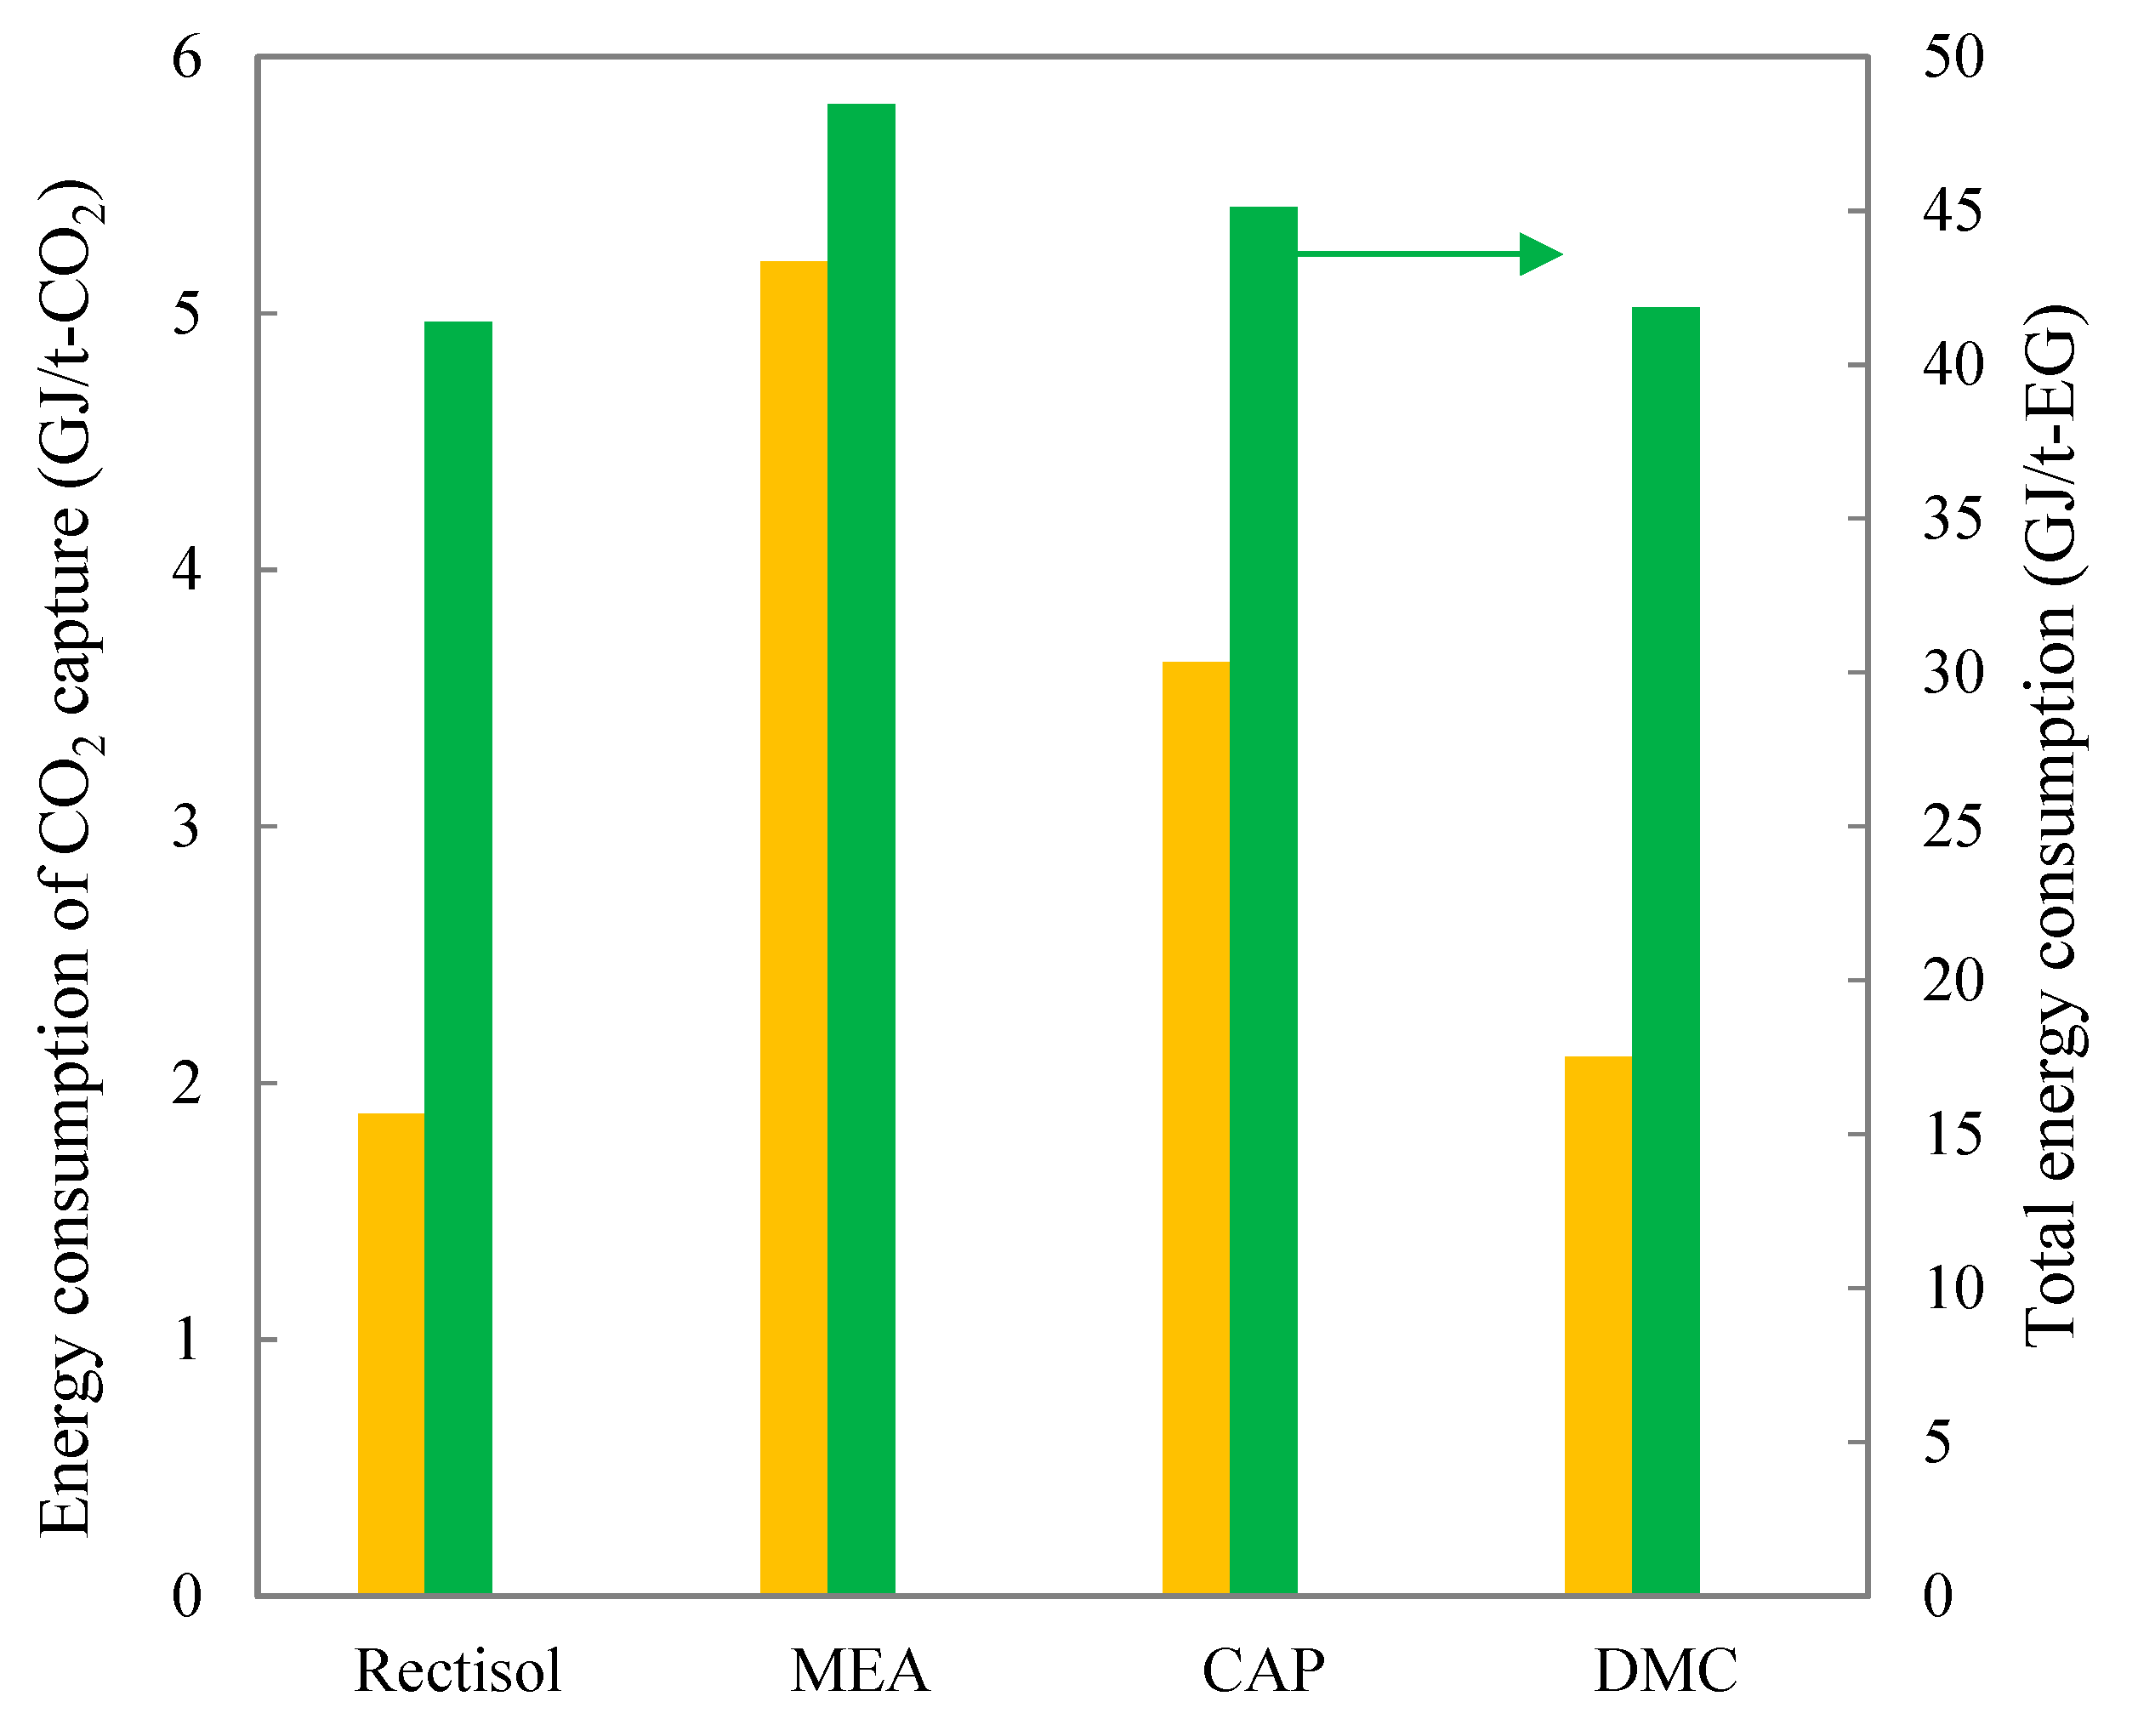
As Figure 8 shows, the energy consumption of CO2 capture of the CTEG process with MEA technology is the highest, 5.20 GJ/tCO2, and the CTEG process with Rectisol technology is the lowest, 1.88 GJ/tCO2, followed by the DMC process, 2.10 GJ/tCO2, and MEA process, 3.64 GJ/tCO2. The main reasons are that:
- In general, there is an ASU unit in a CTEG plant, which can simultaneously provide oxygen and cold nitrogen. The cold nitrogen is at very low temperature and has a relative high cooling ability. Therefore, the cold utility of the Rectisol and DMC processes can be greatly reduced by integrating with the cold nitrogen stream of the ASU unit, which will also reduce the amount of other coolants to cool the methanol. As a result, the energy consumption of CO2 capture of these two processes is lower than that of the MEA and CAP processes.
- The electricity consumption of the Rectisol process is significantly lower than that of the DMC process. Thus, although both the Rectisol and DMC are part of the physical absorption method and have a relative similar flowsheet, the CO2 capture and total energy consumptions of the Rectisol process are lower than those of the DMC process.
- As the MEA process is a chemical absorption method, it needs an amount of steam to heat the rich solution in the reboiler. In fact, the regeneration duty of the MEA process is about 4.08 GJ/tCO2, accounting for 78.46% of the total CO2 capture energy consumption. However, most of the CO2 of the Rectisol and DMC processes is discharged in the multistage flashes, resulting in low regeneration duty.
- In addition to the heat duty of CO2 regeneration column (1.26 GJ/tCO2), the CAP process requires additional steam to heat the ammonia regeneration column, which is about 1.42 GJ/tCO2. Thus, the energy consumption of the regeneration process of the CAP process is far less than that of the MEA process, resulting in a low CO2 capture energy consumption. Compared with the MEA and CAP processes, the Rectisol and DMC process requires less regeneration duty due to the high solubility of acid gas.
- As for the compression work, the MEA process consumes the highest electricity, 1.12 GJ/t CO2, because of the highest pressure of the CO2 stream from this process in comparison with other processes. It also leads to the high energy consumption of this process.
- As Figure 8 shows, the total energy consumption of the CTEG process with Rectisol, MEA, CAP and DMC technologies is 41.38 GJ/t, 48.44 GJ/t, 45.12 GJ/t, 41.85 GJ/t, respectively. Assuming that the ethylene glycol production of these four processes is the same up to 37.5 t/h, their total output energy is the same up to 19.10 GJ/T. Thus, the energy efficiency of the CTEG process with Rectisol, MEA, CAP and DMC technologies is 46.16%, 39.43%, 42.33% and 45.64%, respectively. Therefore, the CTEG process with Rectisol technology has the best thermodynamic performance.
Thus, integration of the cold nitrogen stream from the ASU unit to the AGR unit could greatly reduce the CO2 capture energy consumption, resulting in low energy consumption of the Rectisol and DMC processes. It could also affect their economic performance as discussed in the following section.
3.2. Comparison of Total Capital Investment
The conventional Chemical Engineering Plant Cost Index (CEPCI) method is used to estimate the total capital investment (TCI) of the CTEG process with different CO2 capture technologies. The total capital investment of a process mainly includes fixed capital investment and working capital [30]. The former is employed to purchase equipment, piping, electrical, buildings, land, etc. In general, the equipment investment (EI) greatly determines the fixed and total capital investments [31]. The cost of equipment is estimated via Equation (16). The main parameters containing this equation are listed in Table 5. The other costs of the total capital investment can be estimated on the basis of their ratios to the investment of equipment. Their corresponding ratio factor is shown in Table S3 in the Supplementary Material. Then, the total capital investment can be estimated as shown in Equation (17) [32].
where S means the processing capacity; RFi is the ratio factor of the ith capital investment; the subscript ref. means the benchmark case for equipment cost.
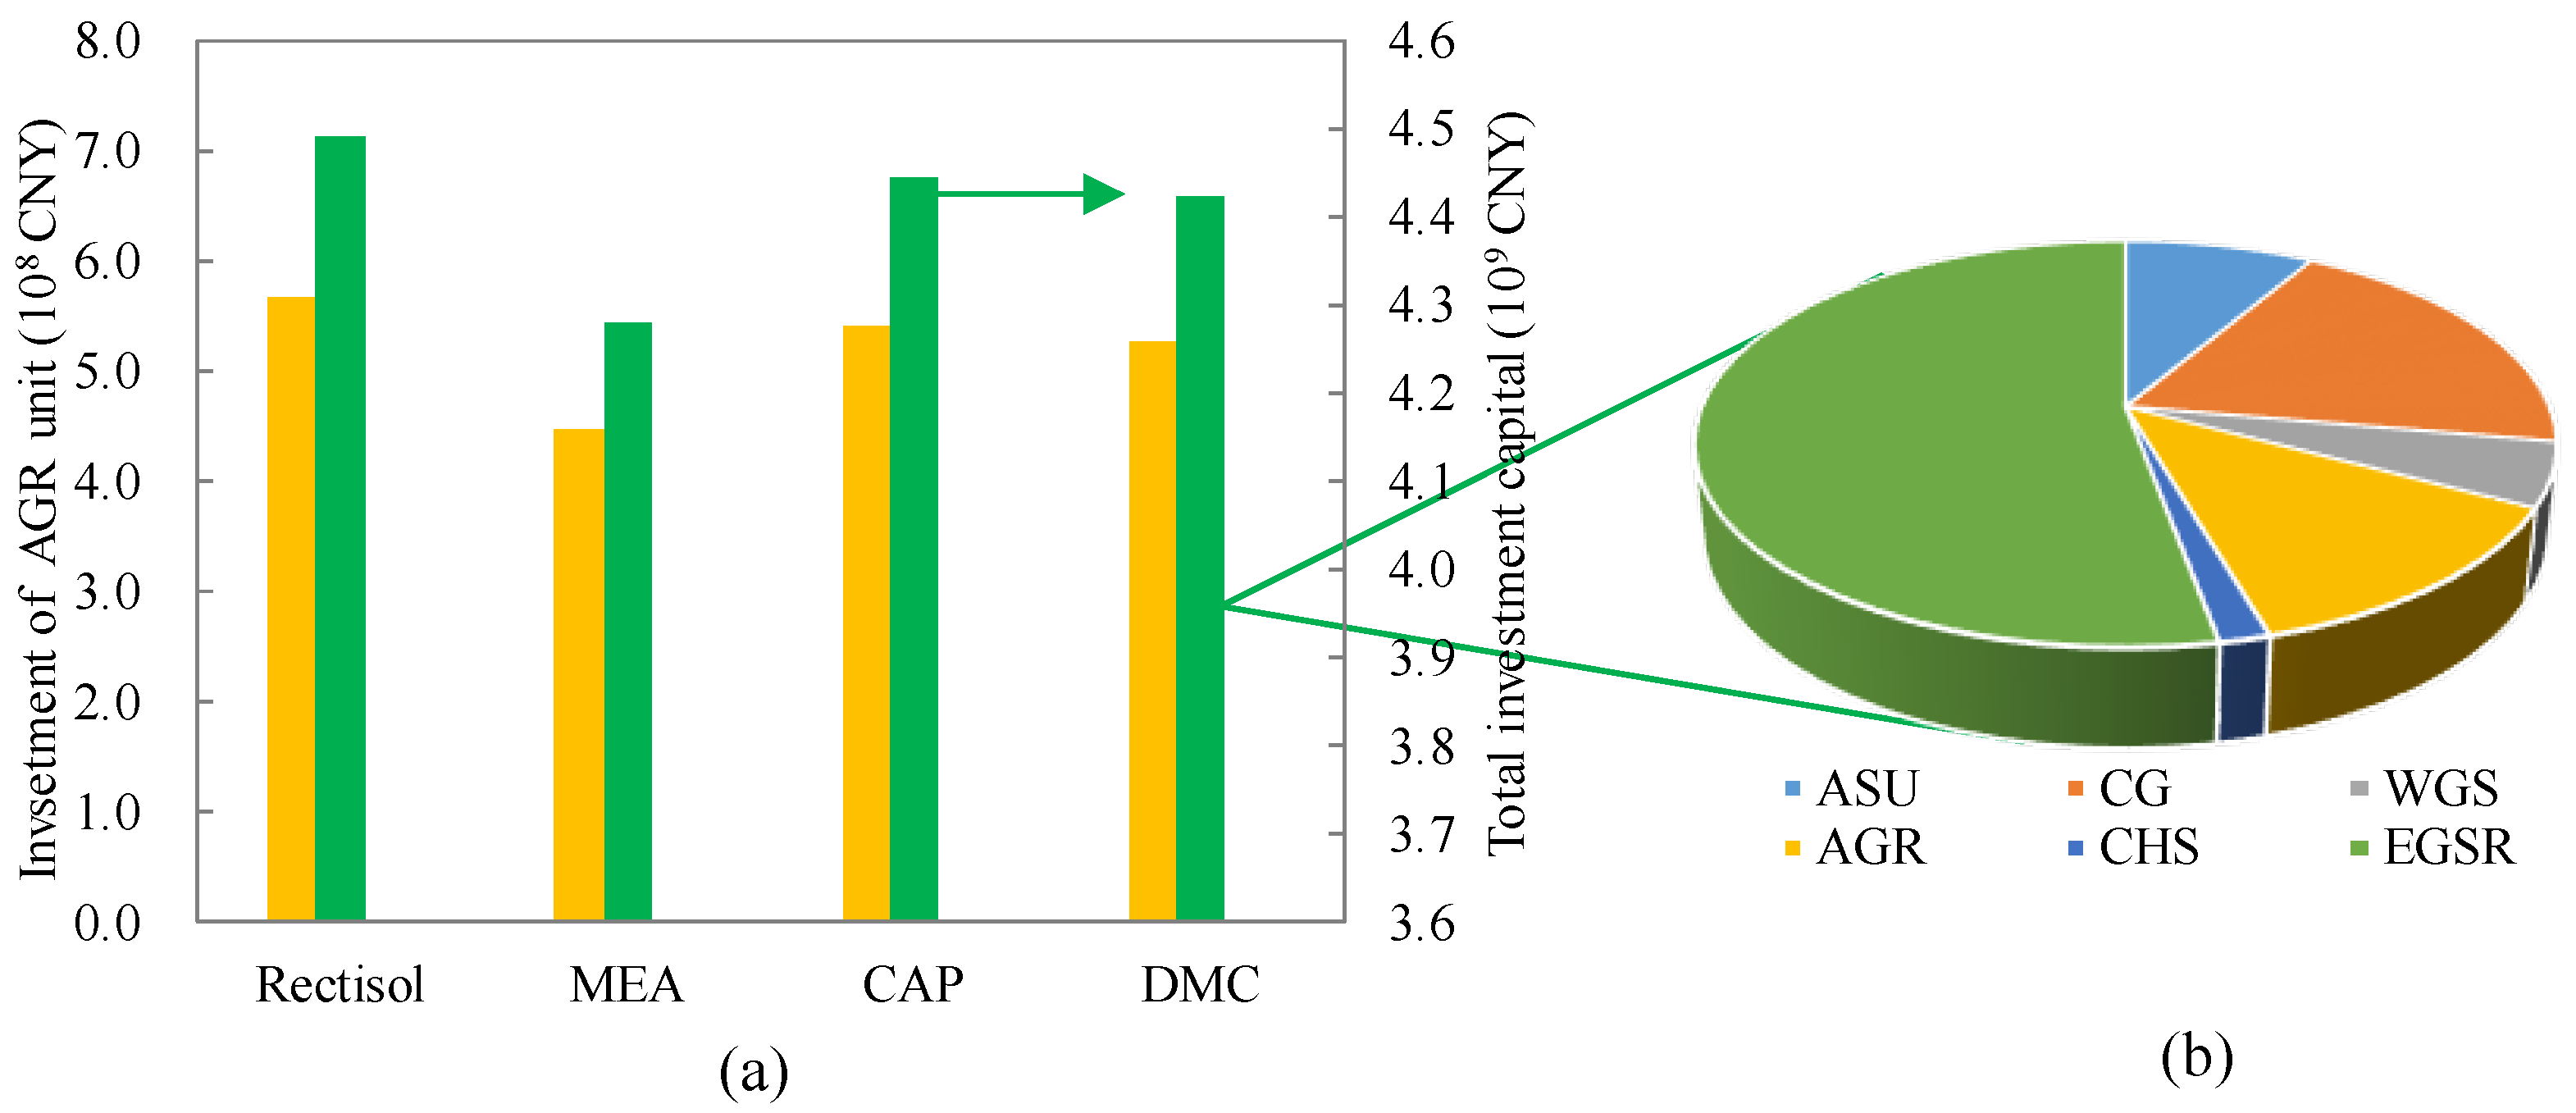
The total capital investment of the CTEG process with different CO2 capture technologies is indicated in Figure 9a,b. To purify the same amount of syngas, the CTEG process with Rectisol technology takes the highest capital investment, followed by the CAP, DMC and MEA technologies as shown in Figure 9a. The investment cost of the Rectisol, CAP and DMC processes is about 1.27, 1.21 and 1.18 times that of the MEA process, respectively. The high capital investment of the Rectisol process is mainly due to the more complex heat exchange network and materials integration system. The high investment cost of the CAP process is mainly because it requires an additional ammonia capture system to decrease the escape ratio of ammonia. As a result, the total capital investment of the CTEG with Rectisol technology is the highest, 4.49 × 10⁹ CNY, followed by the CAP technology, 4.45 × 10⁹ CNY, DMC technology, 4.42 × 10⁹ CNY, and MEA technology, 4.28 × 10⁹ CNY. The distributions of the total capital investment are present in Figure 9b. It shows that the proportion of the ethylene glycol synthesis and refinery unit is the largest, 52.90%, which includes the dimethyl oxide synthesis, ethylene glycol synthesis, and ethylene glycol refinery processes. In addition, the coal gasification and acid gas removal units also contribute remarkable proportions, accounting for 19.31% and 12.64%, respectively. Thus, more attention should be paid to reduce the capital investment of these three units.
3.3. Comparison of Capture and Production Costs
In this study, the CO2 capture cost and total production cost (TPC) are considered to further compare the economic performance of the CTEG process with different CO2 capture technologies. They are defined as follows [26]:
where is the total capital investment required for ith unit; means the salvage value of ith unit; CRF is the capital recovery factor; r and n are the discount rate (12%) and plant lifetime (20 years) [34]; shows the annual cost of the operational and maintenance of ith unit, which can be calculated as follows [35]:
where FOM and VOM represent the costs of fixed and variable operation and maintenance, respectively.
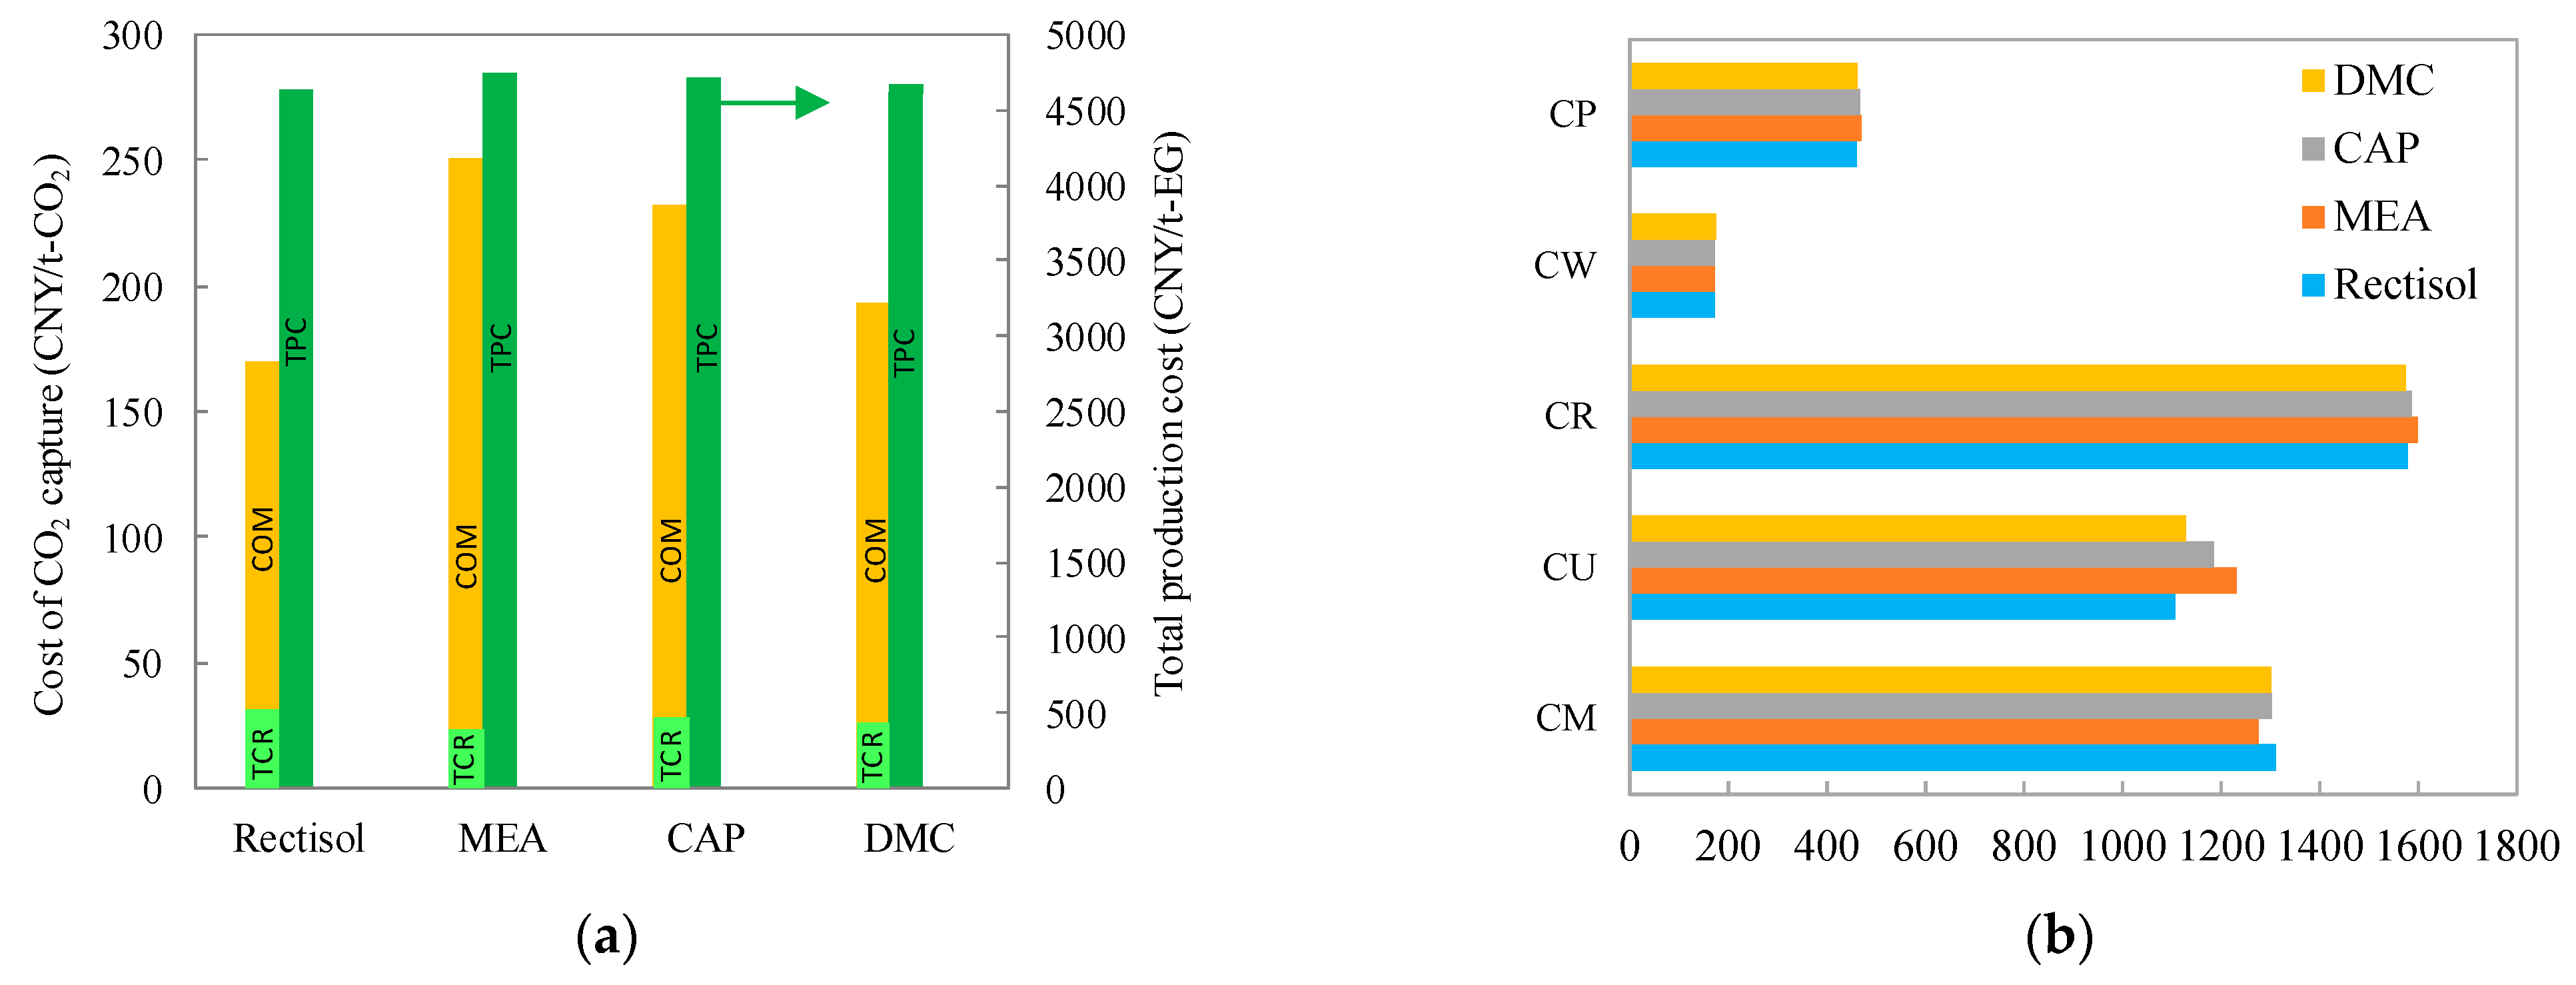
The CO2 capture cost and total production cost of the CTEG process with different CO2 capture technologies are calculated in terms of the simulation results and the market price of raw material and utilities as is shown in Table 6. As Figure 10a shows, the CO2 capture cost of the Rectisol process is lowest, CNY 169.5/tCO2, followed by the DMC process, CNY 193.2/tCO2, the CAP process, CNY 232.6 /tCO2, and the MEA process, CNY 250.5/tCO2. It is mainly because the utilities of the MEA and CAP processes are much higher than those of the Rectisol and DMC processes. Compared with the DMC process, the Rectisol process is more maturity, resulting in a low operation and maintenance cost. Thus, the total production cost of the CTEG process with Rectisol technology is the lowest CNY 4631/tEG, followed by the DMC technology, CNY 4644/tEG. The MEA and CAP technologies have a relatively high total production cost, CNY 4750/tEG, and CNY 4716/tEG, respectively. From the perspective of the compositions of total production cost, there is no obvious difference in the costs of wage (CW) and period expenses (CP) of the four process as Figure 10b shown. The MEA process has the lowest cost of maintenance (CM) due to its lowest capital investment. However, it can be seen that the cost of utilities (CU) and raw material (CR) of the Rectisol process is relatively lower than the other process due to its low energy consumption and high CO2 removal ratio. Therefore, the CTEG process with Rectisol technology has the best production cost advantage compared with the MEA, CAP and DMC technologies.
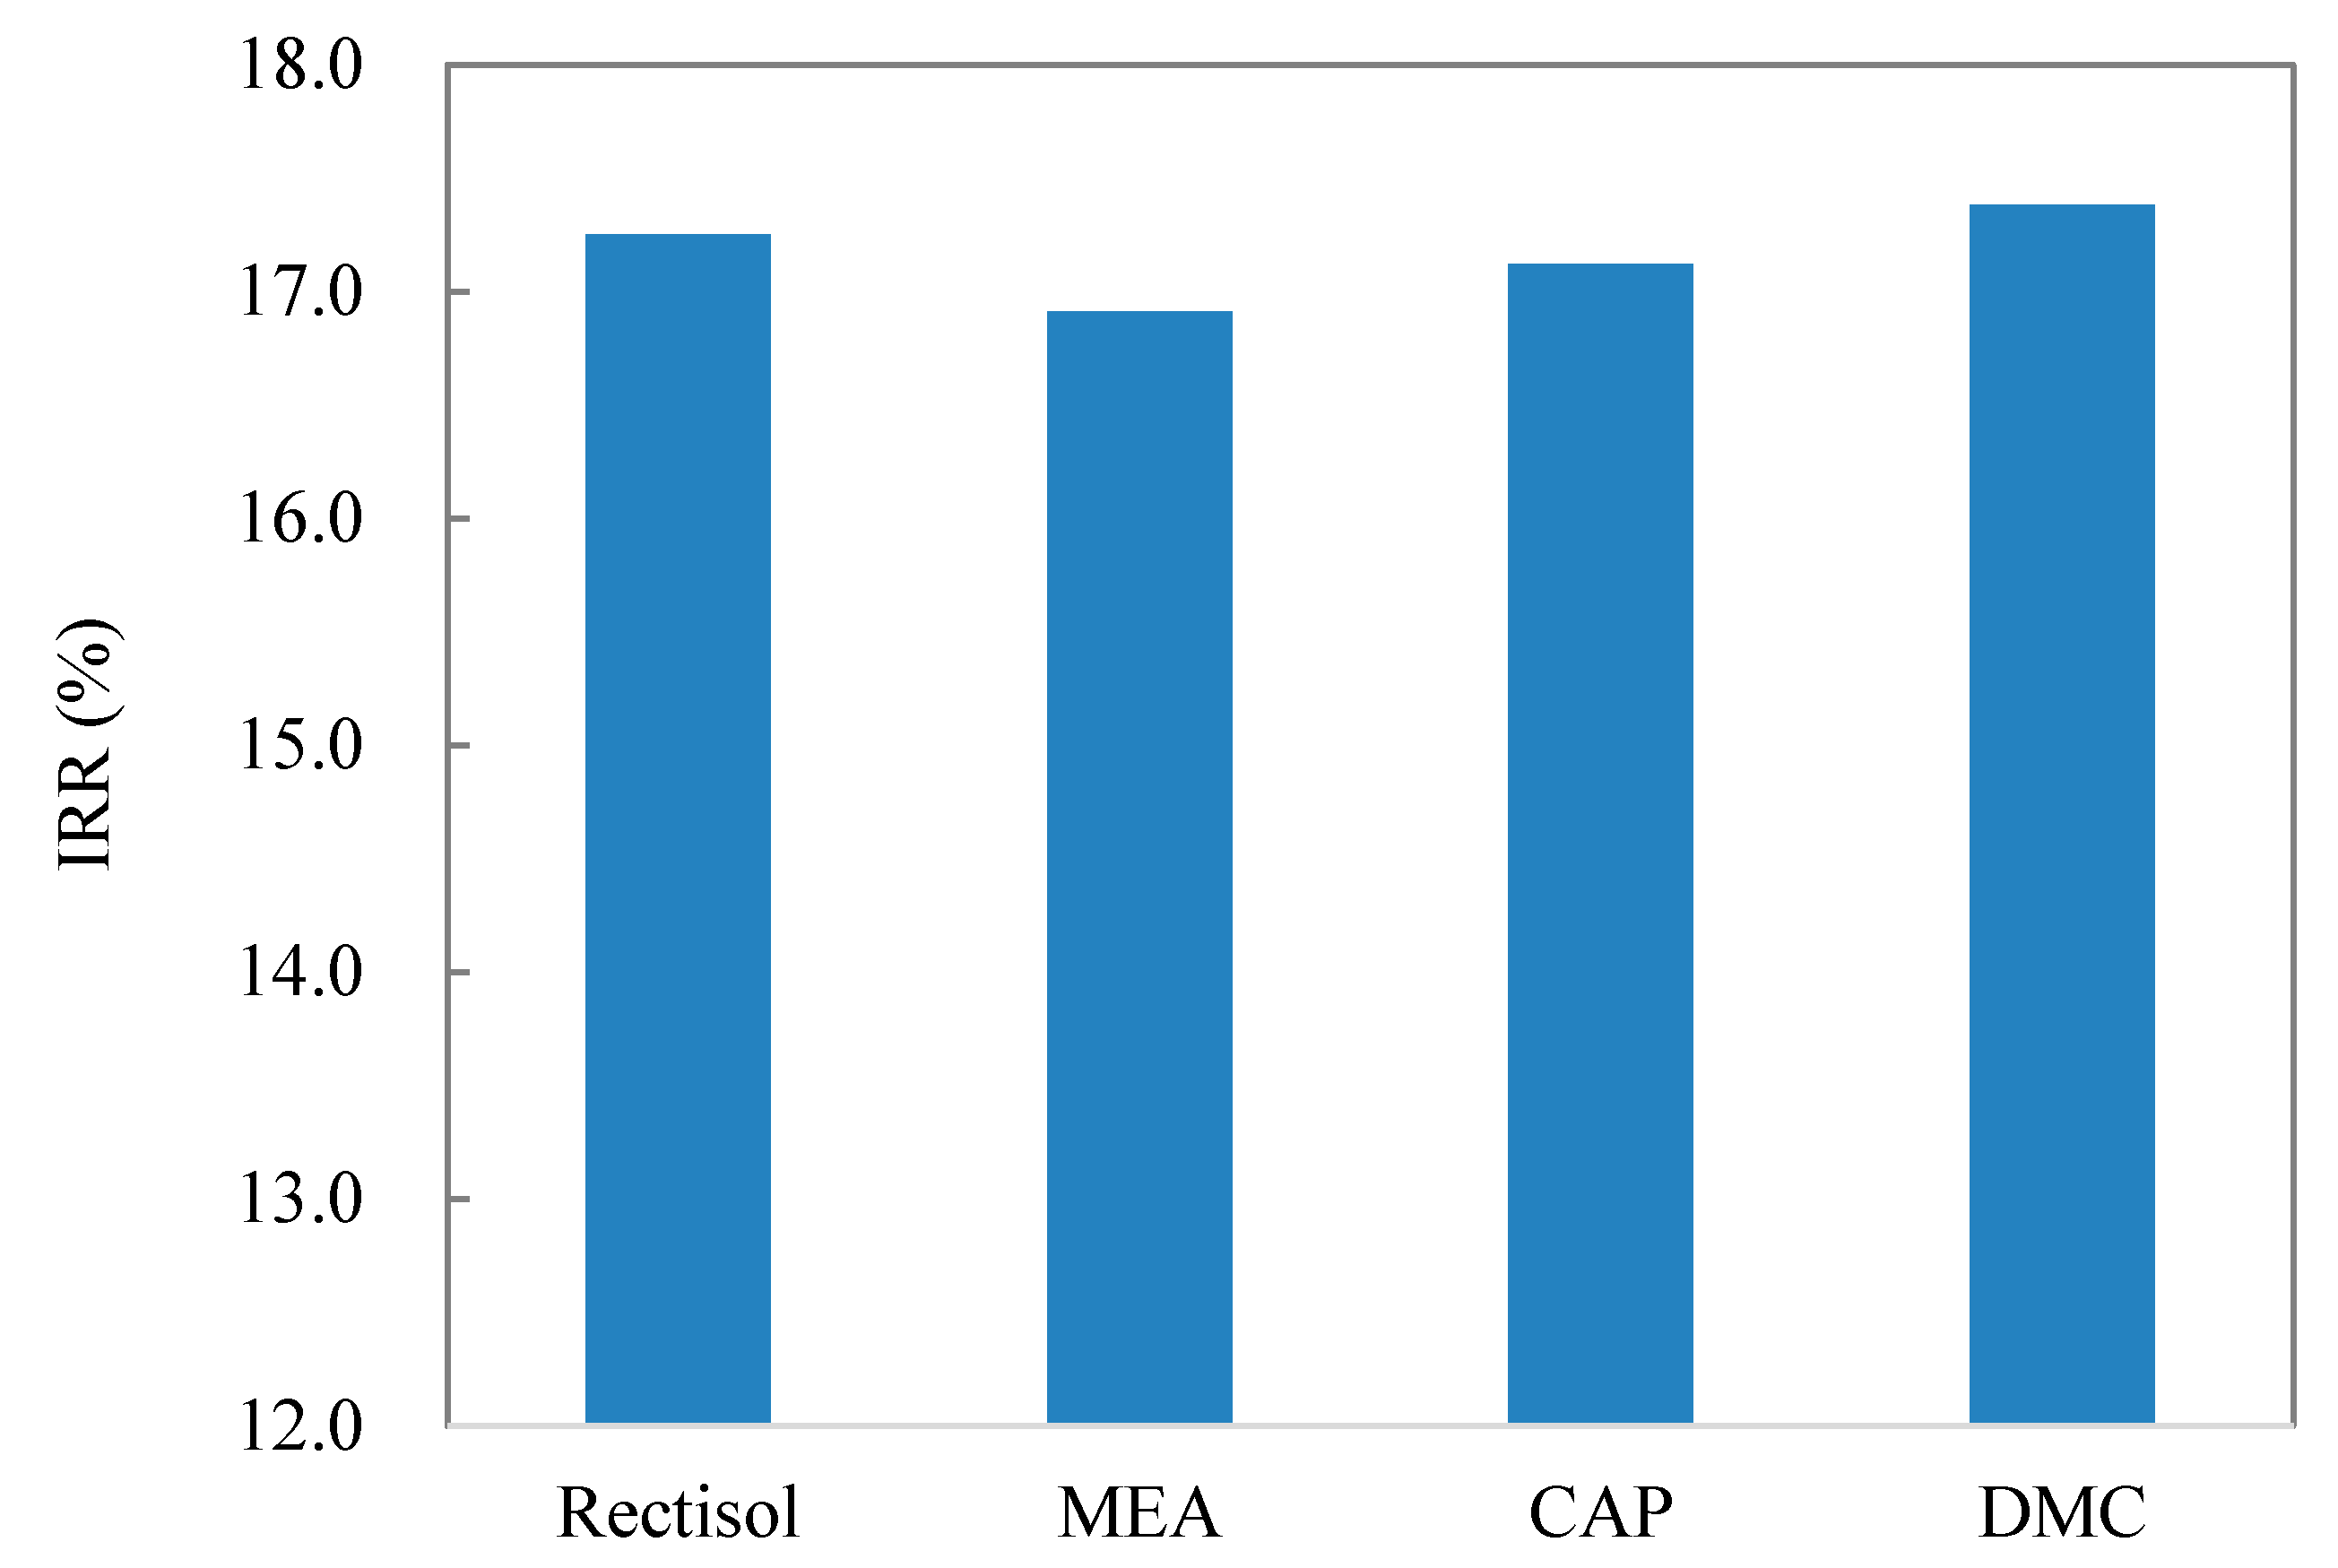
3.4. Comparison of Internal Rate of Return
Internal rate of return (IRR) is an important indicator to compare the competitiveness of alternative technologies. It can be expressed as follows [20]:
where NCFj means the net cash flow of jth year.
The total revenue of the CTEG process is calculated by the simulation results and the market price of product and byproduct as shown in Table 5. According to the results of Section 3.2 and Section 3.3, the internal rate of return of the CTEG process with different CO2 capture technologies is calculated and presented in Figure 11. The internal rate of return of the CTEG process with the MEA and CAP technologies are the lowest, 16.91% and 17.12%, respectively. This is mainly because their production costs are much higher than the Rectisol and DMC processes. The internal rate of return of the DMC process (17.38%) is similar with the Rectisol process (17.25%) because of its similar total capital investment and production cost. However, compared with the DMC technology, the Rectisol technology has been successfully operated for decades and has a larger market share.
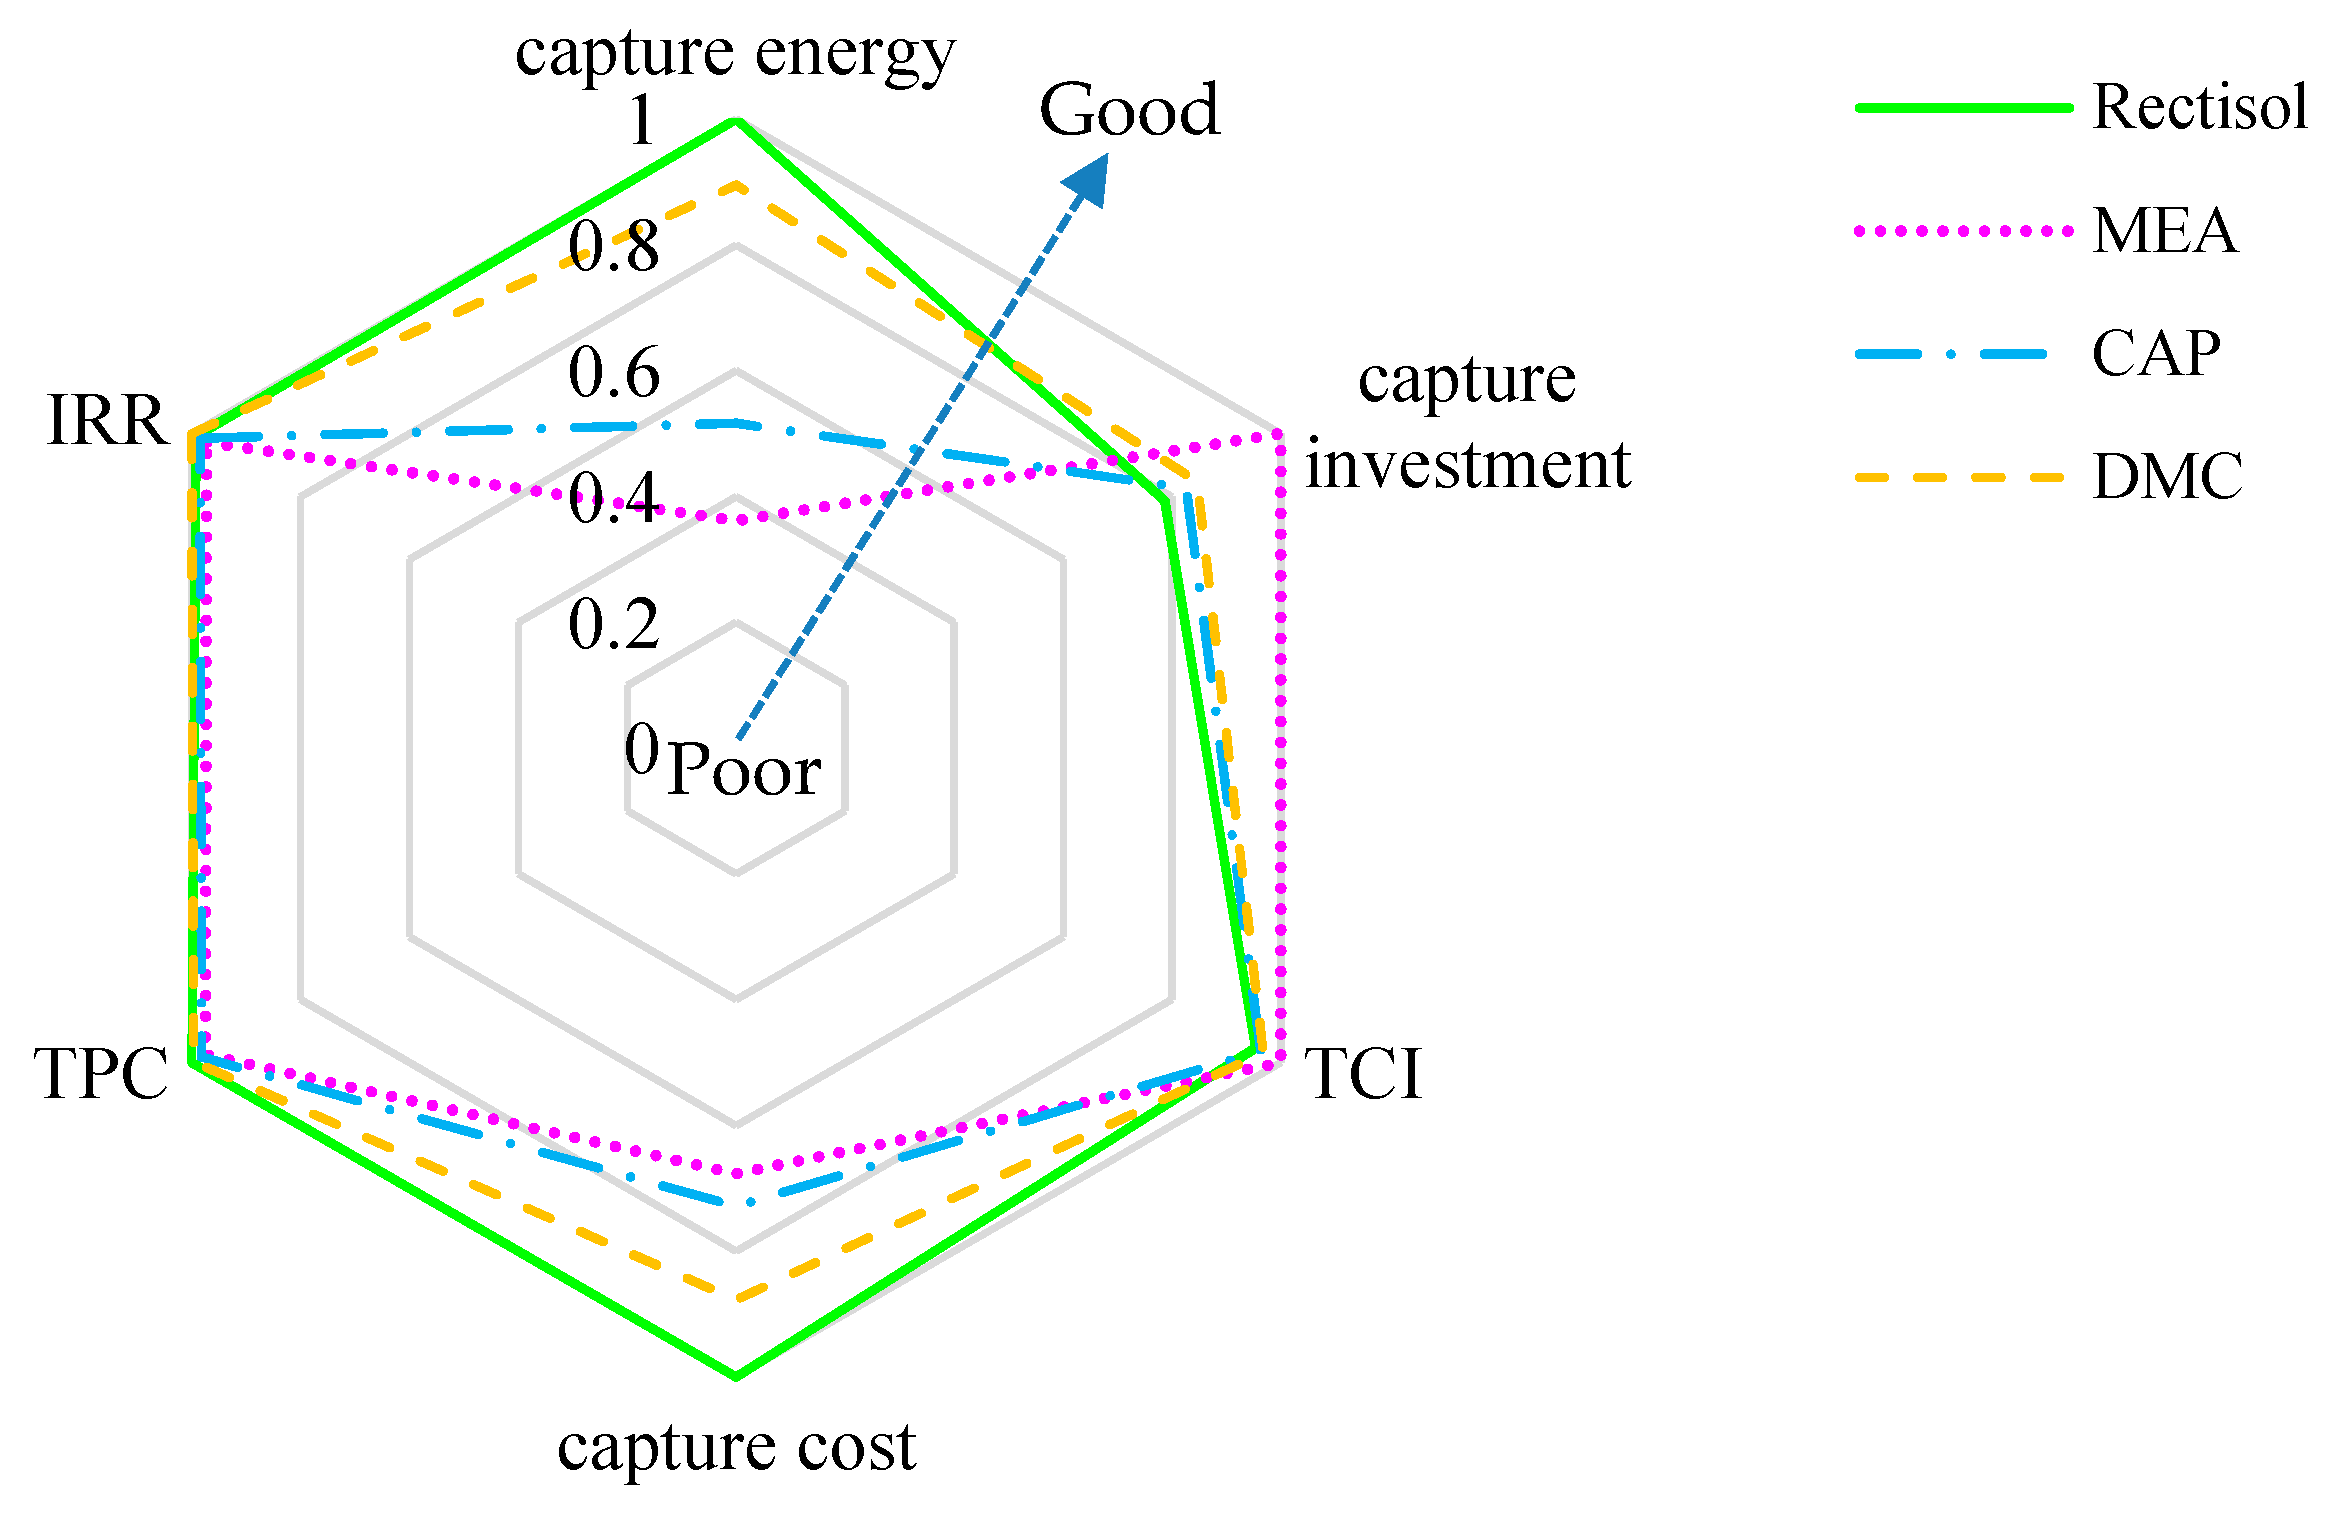
3.5. Comparison of the Overall Performance
To comprehensively compare the performance of the CTEG process with different CO2 capture technologies, the best value of an evaluation indicator among the comparative processes is assumed to be 1.0, and the relative value of this indicator of one process is its value divided by the best value for determining their relative disadvantage. Results show that the CTEG process with Rectisol technology has the best comprehensive performance compared with the MEA, CAP, and DMC processes, especially in capture energy consumption and cost as shown in Figure 12. The comprehensive performance of the MEA is the worst because of the high capture energy and cost. However, its total capital investment is greatly lower than three other technologies. In summary, the Rectisol technology is a good choice for the CTEG process to CO2 capture.
4. Conclusions
This study analyzed the technoeconomic performance of four CO2 capture alternatives for the coal to ethylene glycol (CTEG) process: Rectisol, MEA, CAP and DMC. The main results gained from this work can be drawn briefly as follows:
- The energy consumption of CO2 capture of the CTEG process with Rectisol technology is the lowest, 1.88 GJ/tCO2, and the CTEG process with MEA technology is the highest, 5.20 GJ/tCO2. That of the CTEG process with CAP and DMC technologies are 3.64 GJ/tCO2 and 2.10 GJ/tCO2.
- The investment cost of the Rectisol, CAP and DMC technologies is about 1.27, 1.21 and 1.18 times that of the MEA process, respectively. As a result, the total capital investment of the CTEG with Rectisol technology is the highest, 4.49 × 10⁹ CNY, followed by the CAP technology, 4.45 × 10⁹ CNY, DMC technology, 4.42 × 10⁹ CNY, and MEA technology, 4.28 × 10⁹ CNY.
- The CO2 capture cost of the Rectisol process is the lowest, CNY 169.5/tCO2, followed by the DMC process, CNY 193.2/tCO2, the CAP process CNY 232.6/tCO2, and the MEA process CNY 250.5/tCO2. Therefore, the total production cost of the CTEG process with the Rectisol process is the lowest, CNY 4631/tEG, and that of the MEA process is the highest, CNY 4750/tEG.
- The internal rate of return of the CTEG process with Rectisol technology is similar to the DMC technology, which is higher than that of the CTEG process with the MEA and CAP technologies.
Thus, compared with the MEA, CAP, and DMC technologies, the CTEG process with Rectisol technology has the best comprehensive performance, especially in capture energy consumption and cost. It can be selected as the most suitable CO2 capture technology for CTEG industry. The models and results obtained in this study can be used to guide the coal chemical industry for selecting the best carbon capture technology, such as coal to ethylene glycol/methanol/olefins/SNG industries.
Supplementary Materials
The following are available online at https://www.mdpi.com/2227-9717/9/2/207/s1, Table S1: Main reactions take place in gasifier, Table S2: Key parameters for the simulation of four CO2 capture technologies, Table S3: Ratio factor of the components in the TCI.
Author Contributions
Conceptualization, H.Z.; methodology, H.Z.; software, Y.Y.; validation, Y.M.; formal analysis, Y.M.; investigation, Y.S.; resources, Y.S.; data curation, Y.L.; writing original draft preparation, Y.M.; writing review and editing, Y.M.; visualization, B.W.; supervision, D.J.; project administration, H.L.; funding acquisition, D.W. All authors have read and agreed to the published version of the manuscript.
Funding
This research received no external funding.
Data Availability Statement
Data is contained within the article.
Conflicts of Interest
The authors declare no conflict of interest.
Nomenclature
| η | energy efficiency |
| salvage value of ith unit | |
| annual cost of the operational and maintenance of ith unit | |
| CRF | capital recovery factor |
| FOM | fixed cost |
| n | plant lifetime |
| N | number of stages |
| NCFj | net cash flow of jth year |
| P | pressure |
| ∆P | pressure drop |
| r | discount rate |
| RFi | ratio factor of ith capital investment |
| S | processing capacity |
| T | temperature |
| ∆T | temperature difference |
| total capital investment required for ith unit | |
| VOM | variable operation and maintenance cost |
| Wcol | work consumption of cooling equipment |
| Wcom | work consumption of compressor |
| Wpum | work consumption pump |
| ASU | air separation unit |
| AGR | acid gas removal |
| CG | coal gasification |
| CHS | CO and H2 separation |
| CTEG | coal to ethylene glycol |
| CCG | choren coal gasifier |
| CCR | CO coupling reactor |
| CAP | chilled ammonia process |
| CEPCI | Chemical Engineering Plant Cost Index |
| DM | dimethyl carbonate |
| EG | ethylene glycol |
| EGSR | ethylene glycol synthesis and refining |
| EI | equipment investment |
| H/C | hydrogen–carbon |
| IGCC | integrated gasification combined cycle |
| IRR | internal rate of return |
| MEA | mono-ethanol amine |
| NRTL | non-random-two-liquid |
| TCI | total capital investment |
| TPC | total production cost |
| WGS | water gas shift |
References
- Pang, J.; Zheng, M.; Sun, R.; Wang, A.; Wang, X.; Zhang, T. Synthesis of ethylene glycol and terephthalic acid from biomass for producing PET. Green Chem. 2016, 18, 342–359. [Google Scholar] [CrossRef]
- National Development and Reform Committee of China (NDRC). Long-Term Planning for Coal Chemical Industry Development. 2016. Available online: http://www.ndrc.gov.cn/ (accessed on 29 December 2016).
- Zhang, Y.; Yuan, Z.; Margni, M.; Bulle, C.; Hua, H.; Jiang, S.; Liu, X. Intensive carbon dioxide emission of coal chemical industry in China. Appl. Energy 2019, 236, 540–550. [Google Scholar] [CrossRef]
- Wang, D.; Li, S.; He, S.; Gao, L. Coal to substitute natural gas based on combined coal-steam gasification and one-step methanation. Appl. Energy 2019, 240, 851–859. [Google Scholar] [CrossRef]
- Plaza, M.G.; Rubiera, F. Evaluation of a novel multibed heat-integrated vacuum and temperature swing adsorption post-combustion CO2 capture process. Appl. Energy 2019, 250, 916–925. [Google Scholar] [CrossRef]
- Diego, M.E.; Bellas, J.-M.; Pourkashanian, M. Techno-economic analysis of a hybrid CO2 capture system for natural gas combined cycles with selective exhaust gas recirculation. Appl. Energy 2019, 215, 778–791. [Google Scholar] [CrossRef]
- Wu, X.; Wang, M.; Liao, P.; Shen, J.; Li, Y. Solvent-based post-combustion CO2 capture for power plants: A critical review and perspective on dynamic modelling, system identification, process control and flexible operation. Appl. Energy 2020, 257, 113941. [Google Scholar] [CrossRef]
- Ye, R.; Lin, L.; Liu, C.; Chen, C.; Yao, Y. One-pot synthesis of cyclodextrin-doped Cu-SiO2 catalysts for efficient hydrogenation of dimethyl oxalate to ethylene glycol. ChemCatChem 2017, 9, 4587–4597. [Google Scholar] [CrossRef]
- Wei, R.; Yan, C.; Yang, A.; Shen, W.; Li, J. Improved process design and optimization of 200 kt/a ethylene glycol production using coal-based syngas. Chem. Eng. Res. Des. 2018, 132, 551–563. [Google Scholar] [CrossRef]
- Yang, Q.; Zhang, C.; Zhang, D.; Zhou, H. Development of a coke oven gas assisted coal to ethylene glycol process for high techno-economic performance and low emission. Ind. Eng. Chem. Res. 2018, 57, 7600–7612. [Google Scholar] [CrossRef]
- Yang, Q.; Liu, X.; Zhu, S.; Huang, W.; Zhang, D. Efficient utilization of CO2 in a coal to ethylene glycol process integrated with dry/steam-mixed reforming: Conceptual design and techno-economic analysis. ACS Sustain. Chem. Eng. 2019, 7, 3496–3510. [Google Scholar] [CrossRef]
- Rezvani, S.; Huang, Y.; McIlveen-Wright, D.; Hewitt, N.J.; Mondol, J.D. Comparative assessment of coal fired IGCC systems with CO2 capture using physical absorption, membrane reactors and chemical looping. Fuel 2009, 88, 2463–2472. [Google Scholar] [CrossRef]
- Giuffrida, A.; Bonalumi, D.; Lozza, G. Amine-based post-combustion CO2 capture in air-blown IGCC systems with cold and hot gas clean-up. Appl. Energy 2013, 110, 44–54. [Google Scholar] [CrossRef]
- Shi, B.; Xu, W.; Wu, E.; Wu, W.; Kuo, P.-C. Novel design of integrated gasification combined cycle (IGCC) power plants with CO2 capture. J. Clean. Prod. 2018, 195, 176–186. [Google Scholar] [CrossRef]
- Zhou, W.; Zhu, B.; Chen, D.; Zhao, F.; Fei, W. Techno-economic assessment of China’s indirect coal liquefaction projects with different CO2 capture alternatives. Energy 2011, 36, 6559–6566. [Google Scholar] [CrossRef]
- Pettinau, A.; Ferrara, F.; Tola, V.; Cau, G. Techno-economic comparison between different technologies for CO2-free power generation from coal. Appl. Energy 2017, 193, 426–439. [Google Scholar] [CrossRef]
- Yang, Q.; Zhu, S.; Yu, P.; Yang, Q.; Zhang, D. Thermodynamic and techno-economic analysis of coal to ethylene glycol process (CtEG) with different coal gasifiers. Energy Convers. Manag. 2019, 191, 80–92. [Google Scholar] [CrossRef]
- Zhu, L.; Zhang, L.; Fan, J.; Jiang, P.; Li, L. MSW to synthetic natural gas: System modeling and thermodynamics assessment. Waste Manag. 2016, 48, 257–264. [Google Scholar] [CrossRef]
- Man, Y.; Yang, S.; Xiang, D.; Li, X.; Qian, Y. Environmental impact and techno-economic analysis of the coal gasification process with/without CO2 capture. J. Clean. Prod. 2014, 71, 59–66. [Google Scholar] [CrossRef]
- Yang, Q.; Zhang, D.; Zhou, H.; Zhang, C. Process simulation, analysis and optimization of a coal to ethylene glycol process. Energy 2018, 155, 521–534. [Google Scholar] [CrossRef]
- Qin, S.; Chang, S.; Yao, Q. Modeling, thermodynamic and techno-economic analysis of coal-to-liquids process with different entrained flow coal gasifiers. Appl. Energy 2018, 229, 413–432. [Google Scholar] [CrossRef]
- Mores, P.; Scenna, N.J.; Mussati, S.F. Post-combustion CO2 capture process: Equilibrium stage mathematical model of the chemical absorption of CO2 into monoethanolamine (MEA) aqueous solution. Chem. Eng. Res. Des. 2011, 89, 1587–1599. [Google Scholar] [CrossRef]
- Liu, X.; Yang, S.; Hu, Z.; Qian, Y. Simulation and assessment of an integrated acid gas removal process with higher CO2 capture rate. Comput. Chem. Eng. 2015, 83, 48–57. [Google Scholar] [CrossRef]
- Li, K.; Leigh, W.; Feron, P.; Yu, H.; Tade, M. Systematic study of aqueous monoethanolamine (MEA)-based CO2 capture process: Techno-economic assessment of the MEA process and its improvements. Appl. Energy 2016, 165, 648–659. [Google Scholar] [CrossRef]
- Lawal, A.; Wang, M.; Stephenson, P.; Yeung, H. Dynamic modelling of CO2 absorption for post combustion capture in coal-fired power plants. Fuel 2009, 88, 2455–2462. [Google Scholar] [CrossRef] [Green Version]
- Li, K.; Jiang, K.; Jones, T.; Feron, P.; Bennett, R.; Hollenkamp, A. CO2 regenerative battery for energy harvesting from ammonia-based post-combustion CO2 capture. Appl. Energy 2019, 247, 417–425. [Google Scholar] [CrossRef]
- Zhang, L.; Han, L.; Zhao, G.; Chai, R.; Zhang, Q.; Liu, Y.; Lu, Y. Structured Pd–Au/Cu-fiber catalyst for gas-phase hydrogenolysis of dimethyl oxalate to ethylene glycol. Chem. Commun. 2015, 51, 10547–10550. [Google Scholar] [CrossRef]
- He, C.; Feng, X. Process modeling and thermodynamic analysis of Lurgi fixed-bed coal gasifier in an SND plant. Appl. Energy 2013, 111, 742–757. [Google Scholar] [CrossRef]
- Yang, S.; Qian, Y.; Liu, Y.; Wang, Y.; Yang, S. Modeling, simulation, and techno-economic analysis of Lurgi gasification and BGL gasification for coal-to-SNG. Chem. Eng. Res. Des. 2017, 117, 355–368. [Google Scholar] [CrossRef]
- Vo, T.T.; Wall, D.M.; Ring, D.; Rajendran, K.; Murphy, J.D. Techno-economic analysis of biogas upgrading via amine scrubber, carbon capture and ex-situ methanation. Appl. Energy 2018, 212, 1191–1202. [Google Scholar] [CrossRef]
- Sproul, E.; Barlow, J.; Quinn, J. Time value of greenhouse gas emissions in life cycle assessment and tech-no-economic analysis. Environ. Sci. Technol. 2019, 53, 6073–6080. [Google Scholar] [CrossRef] [Green Version]
- Xu, C.; Li, X.; Xu, G.; Xin, T.; Yang, Y.; Liu, W.; Wang, M. Energy, exergy and economic analyses of a novel solar-lignite hybrid power generation process using lignite pre-drying. Energy Convers. Manag. 2018, 170, 19–33. [Google Scholar] [CrossRef]
- Li, G.; Liu, Z.; Liu, T.; Shan, J.; Fang, Y.; Wang, Z. Techno-economic analysis of a coal to hydrogen process based on ash agglomerating fluidized bed gasification. Energy Convers. Manag. 2018, 164, 552–559. [Google Scholar] [CrossRef]
- Han, Z.; Xiao, K.; Zhao, Y.; Bai, Y. Comparison between MEA and chilled ammonia based carbon capture process. J. North China Electr. Power Univ. 2016, 43, 87–93. [Google Scholar]
- Wang, X.; Li, L.; Palazoglu, A.; El-Farra, N.H.; Shah, N. Optimization and control of offshore wind systems with energy storage. Energy Convers. Manag. 2018, 173, 426–437. [Google Scholar] [CrossRef]
Figure 1.
Schematic diagram of the high CO2 emission reasons for coal to ethylene glycol (CTEG) process.
Figure 1.
Schematic diagram of the high CO2 emission reasons for coal to ethylene glycol (CTEG) process.

Figure 2.
Schematic diagram of the CTEG process with different CO2 capture technologies.

Figure 3.
Simplified simulation flowsheet of the Rectisol technology.

Figure 4.
Simplified simulation flowsheet of the MEA technology.

Figure 5.
Simplified simulation flowsheet of the CAP technology.

Figure 6.
Simplified simulation flowsheet of the DMC technology.

Figure 7.
Simplified simulation flowsheet of CTEG process with different CO2 capture technologies.

Figure 8.
Energy consumption of CTEG process with different CO2 capture technologies.

Figure 9.
Total capital investment of CTEG process with different CO2 capture technologies.

Figure 10.
(a) Total production cost, (b) production cost compositions of the CTEG process with different CO2 capture technologies.
Figure 10.
(a) Total production cost, (b) production cost compositions of the CTEG process with different CO2 capture technologies.

Figure 11.
Internal rate of return of CTEG process with different CO2 capture technologies.

Figure 12.
Comprehensive performance of CTEG process with different CO2 capture technologies.


Table 1.
Key parameters for the simulation of four CO2 capture technologies.
| Technology | Equipment | Model | Operational Parameters | Equipment | Model | Operational Parameters |
|---|---|---|---|---|---|---|
| Rectisol a | Lean cooler | Heater | Tout = −58 °C, ∆P = 0 | CO2 Flash1 | Flash | P = 1.38 MPa, Q = 0 |
| Acid gas Absorber | Radfrac | N = 20, P = 5.5 MPa | H2S con. column | Radfrac | N = 20, P = 0.2 MPa | |
| SO2 Flash | Flash | P = 0.69 MPa, Q = 0 | H2S | Radfrac | N = 10, P = 0.3 MPa | |
| MEA b | Cooler | Heater | Tout = 40 °C, ∆P = 0 | Desorber | Radfrac | N = 11, P = 0.19 MPa |
| Absorber | Radfrac | N = 11, P = 0.12 MPa | Lean cooler | Heater | Tout = 40 °C, ∆P = 0 | |
| Rich-pump | Pump | P = 0.21 MPa, η = 0.8 | Lean pump | Pump | P = 0.21 MPa, η = 0.8 | |
| CAP c | Heat exchanger | HeatX | Tcold = 95 °C, ∆P = 0 | Separator | Flash2 | Tout = 40 °C, ∆P = 0 |
| Contact cooler | Radfrac | N = 5, P = 0.12 MPa | Rich-pump-2 | Pump | P = 0.14 MPa, η = 0.8 | |
| Absorber | Radfrac | N = 20, P = 0.12 MPa | Heat exchanger-2 | HeatX | ∆Tcold = 5 °C, ∆P = 0 | |
| Rich-pump-1 | Pump | P = 1.0 MPa, η = 0.8 | Lean pump | Pump | P = 0.14 MPa, η = 0.8 | |
| Heat exchanger-1 | HeatX | ∆Tcold = 5 °C, ∆P = 0 | NH3-desorber | Radfrac | N = 5, P = 0.12 MPa | |
| Desorber | Radfrac | P = 2.0 MPa | Cooler-2 | Heater | Tout = 40 °C, ∆P = 0 | |
| Lean cooler-1 | Heater | Tout = 25 °C, ∆P = 0 | Lean cooler-2 | Heater | Tout = 10 °C, ∆P = 0 | |
| Flash | Flash2 | Tout = 40 °C, ∆P = 0 | Mixer | Mixer | Adiabatic mixing | |
| DMC c | Absorber | Radfrac | N = 10, P = 2.84 MPa, ∆P = 0.02 MPa | Heat exchanger | HeatX | Tlean = 30 °C, ∆P = 0 |
| Flash | Flash2 | Tout = 30 °C, ∆P = 0 | Lean MEA | - | 35 mol% |
Table 2.
Key parameters for modeling and simulation of four CTEG processes.
| Unit | Key Parameters | Value | Key Parameters | Value |
|---|---|---|---|---|
| ASU unit | O2 supplied mole purity | 99.8% | N2 supplied mole purity | 99.9% |
| CG unit | Gasification pressure | 4.0 MPa | Gasification temperature | 1500 °C |
| Oxygen to coal | 0.42 | Steam to coal | 0.25 | |
| WGS unit | Pressure | 3.65 MPa | Shift ratio | 49.25% |
| 1st shift reactor temperature | 350 °C | 2nd shift reactor temperature | 220 °C | |
| AGR unit | Shown in Table 1 | |||
| CHS unit | H2 recovery ratio | 95.17% | CO recovery ratio | 91.75% |
| EGSR unit | DMO reactor temperature | 130 °C | DMO reactor pressure | 0.5 MPa |
| Regeneration temperature | 40 °C | H2/DMO (mole ratio) | 42 | |
| EG reactor temperature | 235 °C | EG reactor pressure | 3.0 MPa | |
| Recovery column temperature | 90 °C | Pressure | 0.1 MPa | |
| Methanol recovery ratio | 99.5% | DMC removal ratio | 95.2% | |
Table 3.
Comparison of the simulation and reported results of key streams.
| CO | H2 | CO2 | H2O | N2+Ar | H2S | Others | ||
|---|---|---|---|---|---|---|---|---|
| Crude syngas a | Simulation results | 59.58 | 27.37 | 12.09 | - | 0.68 | 0.25 | 0.03 |
| Industrial data b | 61.30 | 27.10 | 10.47 | - | 0.87 | 0.24 | 0.02 | |
| Shifted syngas | Simulation results | 23.17 | 43.83 | 32.04 | 0.22 | 0.53 | 0.18 | 0.03 |
| Industrial data c | 22.18 | 40.85 | 35.59 | 0.24 | 0.94 | 0.18 | 0.02 | |
| Clean syngas | Simulation results | 34.59 | 63.39 | - | - | 2.02 | - | - |
| Industrial data d | 34.60 | 63.96 | - | - | 1.43 | - | 0.01 | |
| H2 product | Simulation results | 0.01 | 99.91 | - | - | 0.04 | - | - |
| Industrial data d | - | 99.95 | - | - | 0.05 | - | - | |
| CO product | Simulation results | 99.06 | - | - | - | 0.94 | - | - |
| Industrial data d | 98.00 | - | - | - | 2.00 | - | - |
Table 4.
Basic performance of the CTEG performance.
| Item | Value |
|---|---|
| Input coal | 118.98 t/h |
| Air consumption | 20,2600 Nm3/h |
| CO consumption | 1529 kmol/h |
| H2 consumption | 2846 kmol/h |
| Methanol consumption | 3.38 t/h |
| HNO3 consumption | 2.23 t/h |
| NaOH consumption | 0.54 t/h |
| CO2 captured (AGR unit) | 2.19 t/h |
| Captured CO2 purity | ≥95.0% |
| EG product | 37.50 t/h |
Table 5.
Reference equipment investment of each unit.
| Unit | Benchmark | sf | Sref | EIref (106 CNY) | CEPCIref | f |
|---|---|---|---|---|---|---|
| ASU a | Oxygen supply | 0.50 | 91.75 t/h | 105 | 584.6/2012 | 0.5 |
| CG a | Coal input | 0.67 | 114.21 t/h | 135.21 | 394.3/2001 | 1.0 |
| WGS b | Syngas input | 0.67 | 30,697 kmol/h | 11.56 | 525.4/2007 | 0.6 |
| Rectisol a | Syngas input | 0.67 | 200 kNm3/h | 52.3 | 584.6/2012 | 0.65 |
| MEA c | CO2 output | 0.67 | 66,509 t/d | 206.55 | 525.4/2007 | 0.65 |
| CAP d | CO2 output | 0.67 | 419.16 t/h | 117.15 | 584.6/2012 | 0.65 |
| DMC d | CO2 output | 0.67 | 66,509 t/d | 244.45 | 525.4/2007 | 0.8 |
| DMOS e | H2 input | 0.65 | 2845.50 kmol/h | 55.20 | 576.1/2014 | 0.6 |
| EGS e | DMO input | 0.65 | 74.21 t/h | 77.76 | 576.1/2014 | 0.6 |
| EGR e | EG output | 0.65 | 37.50 t/h | 84.32 | 576.1/2014 | 0.6 |
| HCS a | H2 output | 0.67 | 21.3 kg/s | 45.92 | 575.4/2008 | 1.0 |
| PSA f | H2 input | 0.70 | 944 Nm3/h | 0.83 | 576.1/2014 | 1.0 |
Table 6.
Average market price of main raw material, utilities, product and byproduct.
| Items | Price | Items | Price | |
|---|---|---|---|---|
| Raw material and | Raw coal | CNY 450/t | Fuel coal | CNY 200/t |
| utilities | Electricity | 0.65 kWh/t | Water | CNY 4.5/t |
| Steam | CNY 70/t | Ammonia | CNY 2200/t | |
| Methanol | CNY 2000/t | MEA | CNY 10, 600/t | |
| DMC | CNY 5500/t | NaOH | CNY 2000/t | |
| HNO3 | CNY 2500/t | Catalysts | CNY 300/t | |
| Product and | Ethylene glycol | CNY 7500/t | Light diol | CNY 1966/t |
| byproduct | Dimethyl carbonate | CNY 5500/t | Sulfur | CNY 1026/t |
| Mixed alcohol ester | CNY 7700/t | Heavy component | CNY 6154/t | |
| Sulfuric acid | CNY 250/t | Cinder | CNY 43/t |
Publisher’s Note: MDPI stays neutral with regard to jurisdictional claims in published maps and institutional affiliations. |
© 2021 by the authors. Licensee MDPI, Basel, Switzerland. This article is an open access article distributed under the terms and conditions of the Creative Commons Attribution (CC BY) license (http://creativecommons.org/licenses/by/4.0/).
Share and Cite
MDPI and ACS Style
Ma, Y.; Liao, Y.; Su, Y.; Wang, B.; Yang, Y.; Ji, D.; Li, H.; Zhou, H.; Wang, D. Comparative Investigation of Different CO2 Capture Technologies for Coal to Ethylene Glycol Process. Processes 2021, 9, 207. https://doi.org/10.3390/pr9020207
AMA Style
Ma Y, Liao Y, Su Y, Wang B, Yang Y, Ji D, Li H, Zhou H, Wang D. Comparative Investigation of Different CO2 Capture Technologies for Coal to Ethylene Glycol Process. Processes. 2021; 9(2):207. https://doi.org/10.3390/pr9020207
Chicago/Turabian StyleMa, Yanqing, Yitao Liao, Yi Su, Baojie Wang, Yong Yang, Dong Ji, Hongwei Li, Huairong Zhou, and Dongliang Wang. 2021. "Comparative Investigation of Different CO2 Capture Technologies for Coal to Ethylene Glycol Process" Processes 9, no. 2: 207. https://doi.org/10.3390/pr9020207
Note that from the first issue of 2016, this journal uses article numbers instead of page numbers. See further details here.