Article

Model-Based Analysis of Feedback Control Strategies in Aerobic Biotrickling Filters for Biogas Desulfurization

1
GENOCOV Research Group, Department of Chemical, Biological and Environmental Engineering, Escola d’Enginyeria, Universitat Autònoma de Barcelona, 08193 Bellaterra, Spain
2
Department of Green Chemistry and Technology, Ghent University, Coupure Links 653, 9000 Ghent, Belgium
*
Author to whom correspondence should be addressed.
Processes 2021, 9(2), 208; https://doi.org/10.3390/pr9020208
Submission received: 21 December 2020 / Revised: 15 January 2021 / Accepted: 20 January 2021 / Published: 22 January 2021

Abstract

:
Biotrickling filters are one of the most widely used biological technologies to perform biogas desulfurization. Their industrial application has been hampered due to the difficulty to achieve a robust and reliable operation of this bioreactor. Specifically, biotrickling filters process performance is affected mostly by fluctuations in the hydrogen sulfide (H2S) loading rate due to changes in the gas inlet concentration or in the volumetric gas flowrate. The process can be controlled by means of the regulation of the air flowrate (AFR) to control the oxygen (O2) gas outlet concentration ([O2]out) and the trickling liquid velocity (TLV) to control the H2S gas outlet concentration ([H2S]out). In this work, efforts were placed towards the understanding and development of control strategies in biological H2S removal in a biotrickling filter under aerobic conditions. Classical proportional and proportional-integral feedback controllers were applied in a model of an aerobic biotrickling filter for biogas desulfurization. Two different control loops were studied: (i) AFR Closed-Loop based on AFR regulation to control the [O2]out, and (ii) TLV Closed-Loop based on TLV regulation to control the [H2S]out. AFR regulation span was limited to values so that corresponds to biogas dilution factors that would give a biogas mixture with a minimum methane content in air, far from those values required to obtain an explosive mixture. A minimum TLV of 5.9 m h−1 was applied to provide the nutrients and moisture to the packed bed and a maximum TLV of 28.3 m h−1 was set to prevent biotrickling filter (BTF) flooding. Control loops were evaluated with a stepwise increase from 2000 ppmv until 6000 ppmv and with changes in the biogas flowrate using stepwise increments from 61.5 L h−1 (EBRT = 118 s) to 184.5 L h−1 (EBRT = 48.4 s). Controller parameters were determined based on time-integral criteria and simple criteria such as stability and oscillatory controller response. Before implementing the control strategies, two different mass transfer correlations were evaluated to study the effect of the manipulable variables. Open-loop behavior was also studied to determine the impact of control strategies on process performance variables such as removal efficiency, sulfate and sulfur selectivity, and oxygen consumption. AFR regulation efficiently controlled [O2]out; however, the impact on process performance parameters was not as great as when TLV was regulated to control [H2S]out. This model-based analysis provided valuable information about the controllability limits of each strategy and the impact that each strategy can have on the process performance.

1. Introduction

Biogas is a valuable renewable energy source produced during organic matter fermentation in anaerobic digestors in wastewater treatment plants (WWTPs). At the top of biogas utilization pathways are the use of biogas as vehicle fuel, the production of chemicals and the biogas upgrading and injection in the natural gas grids, while sole heat production and combined heat and power production (CHP) are situated lower in the value chain of biogas utilization [1,2]. Biogas utilization in WWTPs would allow supplying, partially or entirely, their electricity and heating needs, turning these facilities into “net zero” energy consumers. Selection of the best biogas utilization pathway depends strongly on the methane (CH4) composition, but also on the composition of other impurities such as hydrogen sulfide (H2S) (0.1–2%), which must be removed to lengthen the lifespan of cogeneration engines [3,4]. According to the Biogas Utilization Handbook [4], engines manufacturers recommend limiting H2S below 10 ppmv in the biogas stream, while other references recommend value up to 1000 ppmv [5]. The exact value will be dictated by the specific characteristics of the engine manufacturer and operating conditions of the engine.
H2S removal in biogas streams can be done by using physical-chemical technologies or by using biological technologies such as biotrickling filters [6]. According to Cox and Deshusses [7], biotrickling filters are biological scrubbers in which a polluted air stream is passed through a packed bed on which a mixed culture of pollutant-degrading organisms is naturally immobilized. Biotrickling filters have shown to be environmentally friendly and an economically and technically efficient strategy to perform biogas desulfurization [8]. Several works in the literature have shown that this technology performs satisfactorily at different H2S loading rate (H2S-LR) conditions, pH conditions, gas-liquid flow patterns, different packing materials, different oxygen (O2) mass transfer devices as well as different electron acceptors [3,9,10,11]. In desulfurizing biotrickling filters, the H2S contained in the biogas can be converted under aerobic or anoxic conditions into either elemental sulfur (S0, an inorganic solid) or sulfate ( SO 4 2 ) by S-oxidizing bacteria (SOB), depending on the S/O ratio. Equations (1) and (2) show the H2S oxidation reaction under aerobic conditions [12]:
HS + 0.5 · O 2 S 0 + OH
S 0 + 1.5 · O 2 + H 2 O SO 4 2 + 2 · H +
Experimental results show that according to Equations (1) and (2), if the S/O ratio is higher than 2, S0 is the main oxidation product, while if the S/O ratio is lower than 0.5 the reaction continues to SO 4 2 formation [13]. Due to the packed-bed nature of biotrickling filters, bed clogging caused by S0 accumulation in the biotrickling filter (BTF) bed is the main drawback related with the industrial application of aerobic desulfurization. This situation it is most likely to occur when biotrickling filters are operated under variable H2S-LR at limited dissolved oxygen (DO) concentrations [10,11].
Therefore, it is of great relevance to avoid oxygen limitations by optimizing the Gas-Liquid O2 mass transfer in desulfurizing biotrickling filters to maximize SO 4 2 formation and to avoid S0 formation in the bed but limiting the biogas dilution. This can be achieved by applying control strategies to have a robust and reliable desulfurization process regardless of any existing disturbances, and to prevent environmental and technical problems when unexpected H2S-LR variations occur. In full-scale desulfurizing biotrickling filters, the prevailing H2S-LR may vary due to varying inlet H2S concentrations and/or biogas flowrates. The increase in H2S concentration may happen when the organic sulfur content of the feedstock to an anaerobic digestor increases [14,15], while the biogas flowrate fed to the trickling filter may vary, in facilities with small gasholders for biogas storage or when large amounts of biogas are produced due to a peak in the feedstock to the anaerobic digestor [16]. The most common solution in industrial facilities to avoid excessive S0 accumulation due to the fluctuation of H2S-LR is to provide additional O2 by increasing the air flowrate [3]. Nevertheless, this strategy causes biogas dilution and leads to the subsequent loss of its volumetric energy content. For this reason, strategies based on the improvement of O2 transfer from the gas to the liquid phase are key to optimize the complete oxidation of H2S to sulfate, without diminishing biogas calorific power. Lopez et al. [11] found that the regulation of the trickling liquid velocity (TLV) improved sulfate selectivity [11]. TLV does not only increases the dissolved oxygen load but also improves the penetrability of the liquid through the BTF bed, reducing DO gradients along the bed, without diminishing the biogas calorific power.
Previous work in the literature have focused on the development and implementation of feedforward control and feedback control strategies for lab-scale H2S desulfurizing biotrickling filters under aerobic and anoxic conditions [17,18]. However, modeling work on control strategies are scarce in the literature. Coupling modeling and simulation has great importance, since the simulation of control strategies for desulfurizing biotrickling filters allows testing a great number of operating conditions and different types of control strategies in a very short time. This type of approach can be very helpful when there are a various number of possible combinations of control strategies derived from the combination of the different process disturbances, manipulated variables, type of control strategies and type of controllers applied. Recent works in literature have developed mathematical models for biotrickling filters for biogas desulfurization under aerobic conditions [18,19,20] and also under anoxic conditions [17,21]. Such models are of great importance towards the development of control strategies to optimize the performance of biotrickling filters for biogas desulfurization. Hence, this work evaluates different feedback control loops to optimize the performance of a biogas desulfurizing biotrickling filter under different H2S-LR conditions.
This work performs a theoretical analysis of feedback controllers and control strategies through the analysis of control limits, capabilities and added value of these strategies applied in an aerobic BTF for biogas desulfurization. Feedback control was selected over feedforward control since it is the most common strategy used in industrial processes owing to its simplicity. Additionally, feedforward control was experimentally tested in a previous work for the same application and unsatisfactory results supported this decision [18]. A feedback controller was incorporated into a mathematical model for a BTF for biogas desulfurization under aerobic conditions that was calibrated and validated under steady and dynamic conditions [22]. An analytical approach using time-integral criteria was used to determine the most suitable control parameters. Control strategies tested in this work derive from common actuations in industrial biotrickling filters as well as from experimental results from the influence of the main manipulated variables in aerobic desulfurizing biotrickling filters.

2. Materials and Methods

The model used in this work to simulate an aerobic biotrickling filter for biogas desulfurization is based on the work done by Lopez et al. [22]. Model development, model equations, model calibration and model validation procedure can be found elsewhere [22]. In short, the model used in this work incorporates expressions for the different mechanisms occurring in the packed bed such as mass transport by advective flow in the gas and liquid phases, mass transfer at the gas-liquid interface, mass transfer by diffusion at the liquid biofilm interface, internal diffusion in the biofilm and biological reaction in the biofilm. The model includes time-dependent differential equations describing the mass balances for the main species involved in the H2S oxidation process, such as hydrogen sulfide, sulfide, elemental sulfur, oxygen, sulfate and thiosulfate.

2.1. Liquid-Gas Transfer Correlations

Gas-liquid mass transfer is an important step to consider when describing the mechanisms of aerobic biogas desulfurizing in biotrickling filters. Experiments and modeling works have shown that the main process variables such as the removal efficiency (RE), S0 and SO 4 2 production are highly sensitive to the variation of O2 and H2S gas-liquid mass transfer coefficients K L , O 2 ,   K L , H 2 S in biotrickling filters for biogas desulfurization [22].
The BTF model used in this work [22] was calibrated and validated at constant TLV conditions, thus the gas-liquid mass transfer coefficient was defined as a constant value for O2 and H2S K L , O 2 ,   K L , H 2 S . Therefore, to have a better representation of the mass transfer phenomena between the gas and liquid phase, the effect of the variation of the main manipulated variables, such as the gas and liquid flowrate must be included in the estimation of K L , O 2 and K L , H 2 S . Lopez et al. [22] demonstrated that the contribution of the gas-side mass transfer resistance was negligible, and that only the liquid-side mass transfer resistance was significant. Thus, the effect of air flowrate over the K L , O 2 and K L , H 2 S values can be neglected, and focus can be placed only on the effect of TLV over mass transfer coefficients.
In this study, two empirical mass transfer correlations for packed columns, the Billet and Schultes and Onda et al. correlations [23,24] respectively, were compared to select the most suitable correlation for describing gas-liquid mass transfer in our system. Billet and Schultes and Onda’s correlations are described by Equations (3) and (4):
K L , i = C L ρ L , i · g µ L , i 1 / 6 D L , i d h 0.5 u L a p 1 / 3
where:
  • K L , i = Global mass transfer coefficient in liquid for component i, m h−1
  • C L = Packing material specific constant
  • ρ L = Liquid density, kg m−3
  • g = Gravitational constant, m s−2
  • µ L = Liquid viscosity, kg m−1 s−1
  • a p = packing material specific surface area, m−1
  • d h = hydraulic diameter of packing material defined by 4ε/ap, m
  • u L = superficial liquid velocity, m s−1
  • D L = Diffusion coefficient, m2 s−1
K L , i = 0.0051 L A w · µ L , i 2 / 3 μ L , i ρ L , i · D i 0.5 a · D p 0.4 ρ L , i μ L , i · g c 1 / 3
where:
  • K L , i = Mass transfer coefficient in liquid for component i, m h−1
  • L = Superficial mass velocity of liquid, kg m−2 h−1
  • ρ L = Liquid density, kg m−3
  • µ L = Liquid viscosity, kg m−1 h−1
  • gc = Gravitational constant, m h−2
  • A w = wetted area, m2
  • D = Diffusion coefficient, m2 h−1
  • a = packing material specific surface area, m−1
  • Dp = nominal size of packing, m
In Equations (3) and (4) TLV is named differently. In Equation (3) it is shown as u L , the superficial liquid velocity, while in Equation (4) as L, the superficial mass velocity of liquid, which can be related to TLV through the liquid density and the cross-sectional area of the bed (A). Operationally, TLV is regulated through the liquid recirculation flowrate in a BTF. Equation (3) is named after the work published by Billet and Schultes [24] to predict mass transfer in packed beds, although it does not appear in their original publication. Equation (3) is the result of algebraic manipulation published in [25] of the mass transfer equations of the Billet and Schultes.
The Billet and Schultes and Onda correlations were first compared by evaluating typical TLV values for BTFs ranging between (5–30 m h−1). The results obtained here were compared with the K L , H 2 S obtained during model calibration. Later, the effect of the mass transfer correlation on the BTF model performance was evaluated in terms of RE and S0 and SO 4 2 production. The effect of the mass transfer correlation was assessed by running a set of simulations applying the operational conditions described in Table 1. Conditions presented in Table 1 are the same as those presented for the constant TLV experiment in López et al. [11]. The effect of TLV over KL values and secondly for a fixed TLV value was tested, in order to assess the effect of each correlation on the BTF performance in terms of RE and S0 and SO 4 2 production.
Finally, the best correlation was added to the model. The main biotrickling filter model used in this work includes multiple expressions for the different mechanisms occurring in the packed bed and the incorporation of this correlation aimed to describe better the gas-liquid mass transfer phenomenon in our system. Further information about the BTF model used in this work can be found in [22].

2.2. Open-Loop Study

To characterize the response of the BTF when a disturbance occurs under Open-Loop conditions, operational conditions were varied from the reference conditions as shown in Table 2. Further information about the reference conditions can be found in López et al. [11]. Mainly, focus was placed on studying the effect of two of the most common disturbances occurring in the H2S-LR in full-scale desulfurizing BTFs (Table 2), (i) changes in the H2S-LR due to variations in H2S inlet concentration, namely Open-Loop concentration (OL-C), and (ii) changes in the H2S-LR due to variations in the biogas flowrate, namely Open-Loop Empty Bed Residence Time (OL-EBRT).
In the OL-C case, five H2S-LR values were tested separately from 2000 to 10,000 ppmv. The H2S-LR was modified by increasing the H2S gas flowrate while the carrier gas (N2) flowrate was decreased to keep the biogas flowrate constant. The O2/H2S inlet volumetric ratio was decreased linearly from 42.2 to 8.4% v/v due to an increase in the H2S flowrate under constant air flowrate conditions. The OL-EBRT case evaluated five different H2S-LR by varying the biogas flowrate from 61.5 L h−1 to 307.5 L h−1, resulting in an EBRT decrease from 118 s to 48.4 s, a decrease of 59% compared to the reference EBRT.
For both open-loop scenarios (OL-C and OL-EBRT), simulations were run sufficiently long to ensure steady state conditions. Sulfur and O2 mass balances were performed to complete the evaluation of the system under. Information related to model performance obtained during the Open-Loop simulations was useful to delimit and define the operational conditions for the Closed-Loop tests.

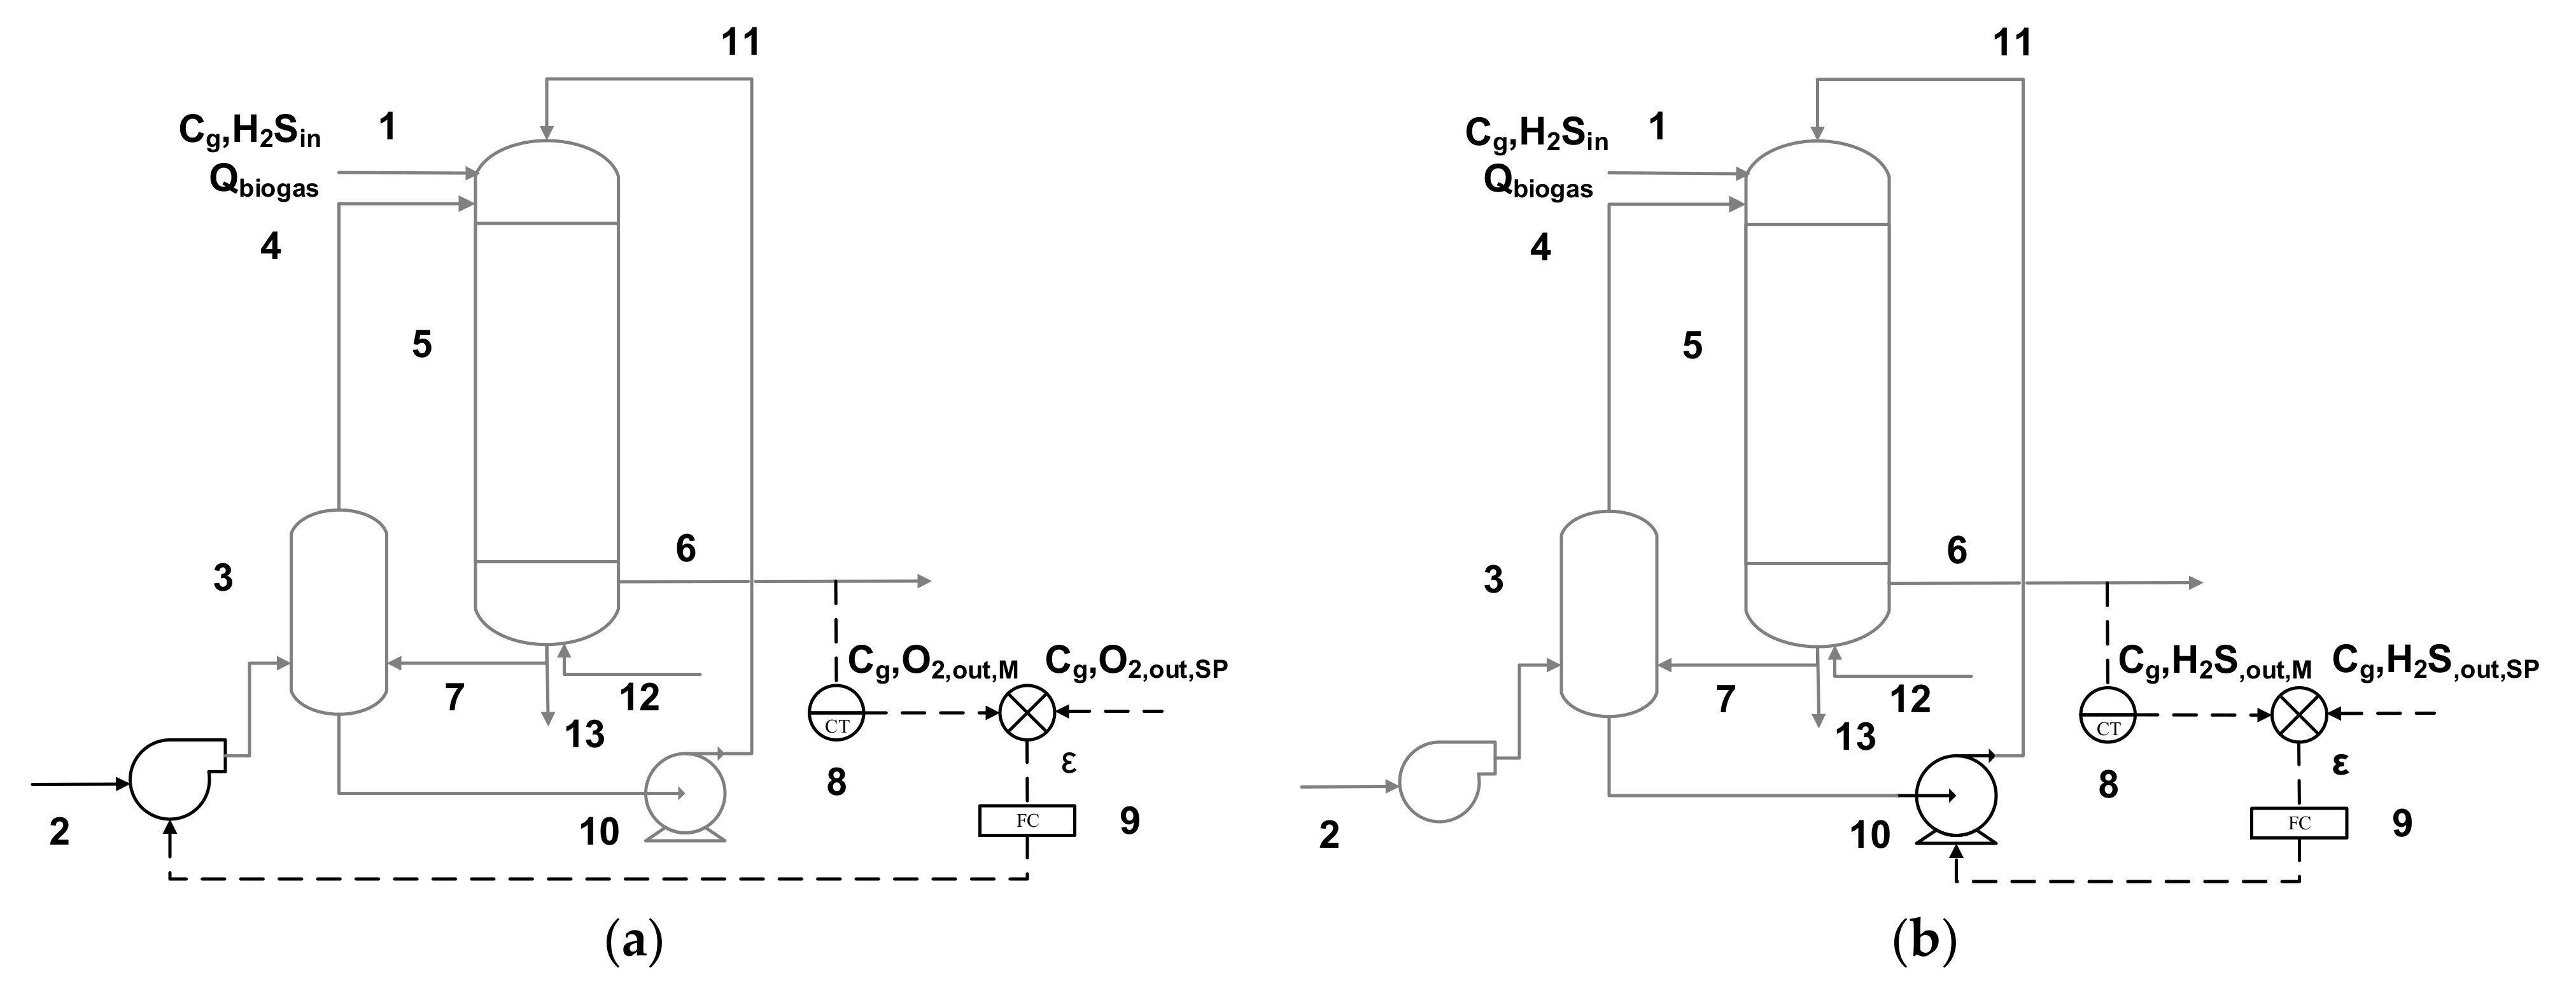
2.3. Closed-Loop Study

The design of the Closed-Loop framework analysis was based on the results obtained in the Open-Loop framework. The flowchart shown in Figure A1 (See Appendix A) illustrates the proposed methodology followed for the design of control strategies for an aerobic desulfurizing BTF.

2.3.1. Definition of Closed-Loop Scenarios

Two case studies were designed to evaluate feedback control strategies in an aerobic BTF for biogas desulfurization. The first strategy studied, namely air flow regulation Closed-Loop (AFR-CL), is the traditional control strategy applied in desulfurizing Biotrickling filters [3]. Figure 1a presents a detailed description of the AFR-CL strategy. This strategy controls the O2 outlet concentration ([O2]out) through air flowrate regulation when H2S-LR is varied due to H2S inlet concentration or biogas flowrate changes. In AFR-CL, the reference H2S-LR (56.3 g S-H2S m−3 h−1) increases up to a H2S-LR of 168.9 g S-H2S m−3 h−1. This strategy aims at regulating the oxygen concentration in the biotrickling filter to avoid S0 accumulation in the packed bed, and therefore the packed bed clogging [26]. If S0 accumulates in the packed bed the overall performance of the biotrickling filter will decrease due to a decrease in the sulfide consumption rate and subsequent reduction in the H2S removal.
The H2S inlet concentration was stepwise increased from 2000 ppmv to 6000 ppmv (Figure 2). As in the Open-Loop analysis, each concentration was evaluated long enough to reach steady-state conditions as well as to study the long-term effect of disturbances in the system. In AFR-CL, an O2 outlet concentration set point (SP) of 5.7% (v/v) was established to calculate the error. The SP value for the AFR-CL was selected according to the O2 outlet concentration achieved under reference conditions when a 100% H2S RE was achieved. The aim of this strategy is to provide the O2 required accordingly with the H2S-LR changes occurring in the BTF. With regards to the air flowrate span, the regulation range for this variable was limited between the reference air flowrate of 24.2 L h−1 and to a maximum value of 120.8 L h−1 that corresponds to biogas dilution factors of 28.2 and 66.3%, respectively. Considering the methane average composition is in the range of 50 to 70% (v/v) [4], a minimum methane content in air of 16.9% would be obtained when the above-mentioned dilution factor is applied. This value is higher than the percentage of methane required to obtain an explosive mixture. It is worthwhile mentioning that such air flowrates and their corresponding biogas dilutions are nonsense from a practical application perspective. However, the analysis from a theoretical perspective was considered as a worthwhile exercise to be done to quantify the effects of such strategy on a desulfurizing BTF.
The second strategy studied, namely TLV regulation Closed-Loop (TLV-CL), is an innovative strategy to control biogas desulfurization in biotrickling filters. Figure 1b presents a detailed description of the TLV-CL control strategy, which aims at controlling the H2S gas outlet concentration through the regulation of the liquid recirculation flowrate, even under disturbances of H2S-LR due to changes of H2S inlet concentration or biogas flowrate. In TLV-CL, the final control element is the recycling pump (element 10 in Figure 1a,b), which regulates the liquid recirculation flowrate, and it is related to TLV by dividing this flowrate by the cross-sectional area of the BTF. The H2S-LR (56.3 g S-H2S m−3 h−1) was increased up to 168.9 g S-H2S m−3 h−1 firstly due to H2S inlet concentration and secondly due to biogas flowrate changes.
The effect of changes in the H2S inlet concentration was studied with a stepwise increase from 2000 ppmv until 6000 ppmv as shown in Figure 2a. The effect of changes in the biogas flowrate was assessed performing stepwise increments from 61.5 L h−1 (EBRT = 118 s) to 184.5 L h−1 (EBRT = 48.4 s) as shown in Figure 2b. An H2S outlet concentration SP of 100 ppmv of H2S was established to calculate the error as described in Equation (5). This SP was selected in order to produce a high-quality biogas effluent to enhance the life-time of co-generation engines or the engines and machinery where biogas is finally burned [27]. Regarding TLV regulation limits, a minimum TLV of 5.9 m h−1 was applied when the H2S outlet concentration was below the SP to provide the nutrients and moisture to the packed bed. A maximum TLV of 28.3 m h−1 was set to prevent BTF flooding. H2S-LR conditions presented in this section for the two control strategies AFR-CL and TLV-CL were also tested under open-loop conditions in order to quantify process improvement when the control loop was implemented.
Table 3 shows the different control loops that can be designed when different controlled variables and disturbances are combined with different types of feedback controllers. Note that in Table 3 no derivative action was included, hence only proportional (P) and proportional integral (PI) feedback controller were evaluated. During preliminary tests, it was observed that due to the characteristics of the disturbances tested, the anticipative effect was null since the response of the process was a constant nonzero error, giving no action for the derivative term (dε/dt = 0, where ε is defined as the error between the measured value and the setpoint value).
Where Kc and τI in Table 3 refer to the controller gain and the integral time for a feedback controller.

2.3.2. Controller Tuning

In order to tune the parameters of the feedback controller, time-integral performance criteria were used to evaluate the complete Closed-Loop response [28]. Time-integral criteria are based on the entire response of the process, unlike the simple criteria that use only isolated characteristics of the dynamic response (e.g., decay ratio, settling time, overshoot) [29]. Integral of square error (ISE), integral of the absolute value of the error (IAE) and integral of the time-weighted absolute error (ITAE) were determined as described in Equations (5)–(7).
ISE   =   0 ε 2 · t · dt
IAE   =   0 ε · t · dt
ITAE   =   0 t · ε t · dt
Time-integral criteria were calculated for each Closed-Loop defined in Table 3. Although ISE, IAE and ITAE were determined for all the cases here studied, only results using IAE criteria are presented. Initially, alternative tuning methodologies were evaluated such as Cohen and Coon method using the process reaction curve method and Ziegler and Nichols open-loop response. These methodologies were discarded to be used as final tuning methodology to obtain the controller parameters. However, preliminary results obtained from these methods served to obtain the initial tuning parameters. Results obtained using ISE and ITAE resulted in similar parameter selection as IAE. Since the parameters that provide the lower time-integral criteria may lead to process instability, production of oscillations in the process response was also considered to assess the controller response to certain parameters. Process instability was used to define the parameters ranges as shown in Table 3. Parameters out of this range produced unstable or oscillatory response (data not shown). If the value of the controller parameters is analyzed, it can be observed that lower gains were needed to control the O2 outlet concentration if compared to the gains obtained when H2S was controlled through TLV regulation, denoting that the process was sensitive to air flowrate changes. Although the range of the controlled variables is not the same, and the magnitude of the controller gains cannot be fairly compared, this analysis denotes that the process was less sensitive to H2S outlet concentration regulation rather O2 outlet concentration. Such differences are due to the gas and liquid phase dynamics of the system since, to control the O2 outlet gas phase concentration, a gas phase variable was manipulated while, to control H2S outlet gas phase concentration, a liquid phase variable was manipulated.

2.3.3. Added Value of Feedback Control Strategies on Biogas Desulfurization in Aerobic Biotrickling Filters

The impact of control parameters over process performance was also analyzed. It helped to have an additional criterion to select the most suitable control strategy since besides evaluating if the control objective was achieved (e.g., reaching the SP value), it is also important to evaluate if such strategy also improved process performance. In this sense, it is important to evaluate if a proper H2S removal was achieved and if whether elemental sulfur or sulfate was the main product from H2S oxidation, in order to ensure process stability in the long run [26]. Sulfur species mass balances referring to the total amount of H2S at the inlet and the amount of O2 consumed during each simulation were calculated to evaluate the added value of the different control strategies. Mass balances using each control strategy were compared with mass balances under Open-Loop conditions. BTF performance at each H2S-LR tested was compared between Open-Loop conditions and Closed-Loop conditions using only the data for each LR step. Equations to determine sulfur mass balances and the amount of O2 consumed are presented in Appendix A.2.

3. Results

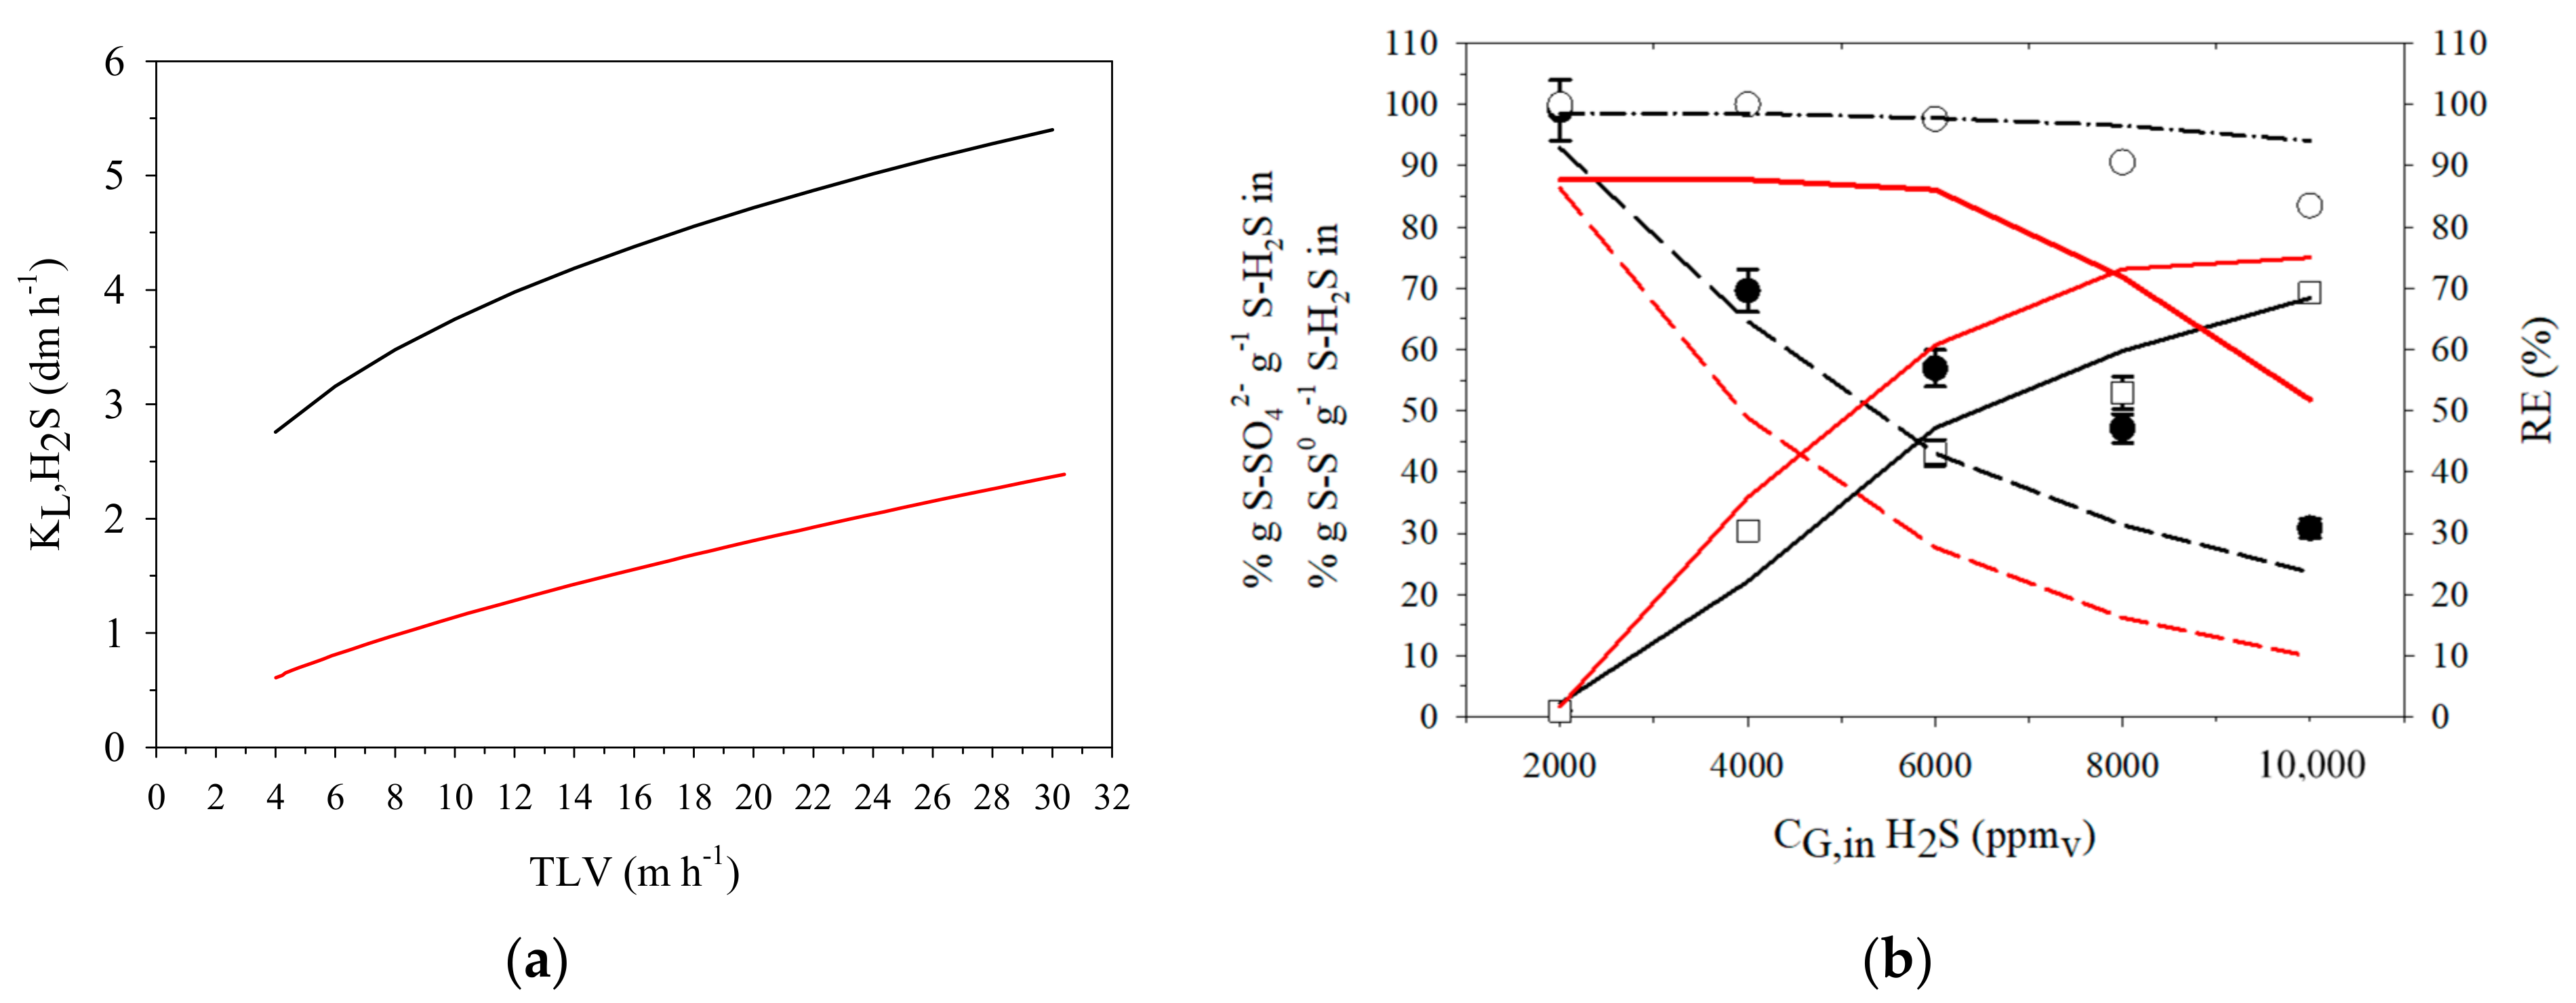
3.1. Selection of a Suitable Oxygen Mass Transfer Correlation

Effect of Mass Transfer Correlation on BTF Model Performance

Results from the comparison of the kL,H2S as a function of TLV of the two correlations are showed in Figure 3A, while Figure 3B shows the model predictions using both correlations studied, Billet and Schultes and Onda’s correlation, together with experimental data profiles of the BTF performance operated under Open Loop conditions (see Table 1).
Figure 3B shows that model predictions using the Billet and Schultes correlation for the prediction of KL,H2S fit the experimental data better than when using Onda correlation. The Billet and Schultes correlation was also preferred by Van der Heyden et al. [30], during the evaluation and comparison of the most frequently used correlations for randomly or structured packed columns. The goodness of the model was evaluated using the Nash and Sutcliffe efficiency (NSE) criteria [31]. NSE is defined as one minus the sum of the absolute squared differences between the predicted (ye) and observed data (ym), normalized by the variance of the observed data during the period under investigation according to Equation (8). Essentially, the closer the model efficiency is to 1, the more accurate the model is.
NSE = 1 i = 1 i = n y e y m 2 i = 1 n y e   y ¯ e 2
NSE values for both correlations are shown in Table 4, showing that higher efficiencies values are achieved with the Billet and Schultes correlation, confirming that this correlation fits better to the experimental data for all the variables considered. The negative NSE value for Onda’s correlation means that the average value of the experimental data was a better predictor than the model. According to these results, the Billet and Schultes correlation was chosen as the one to be used for simulating control strategies with the BTF model.

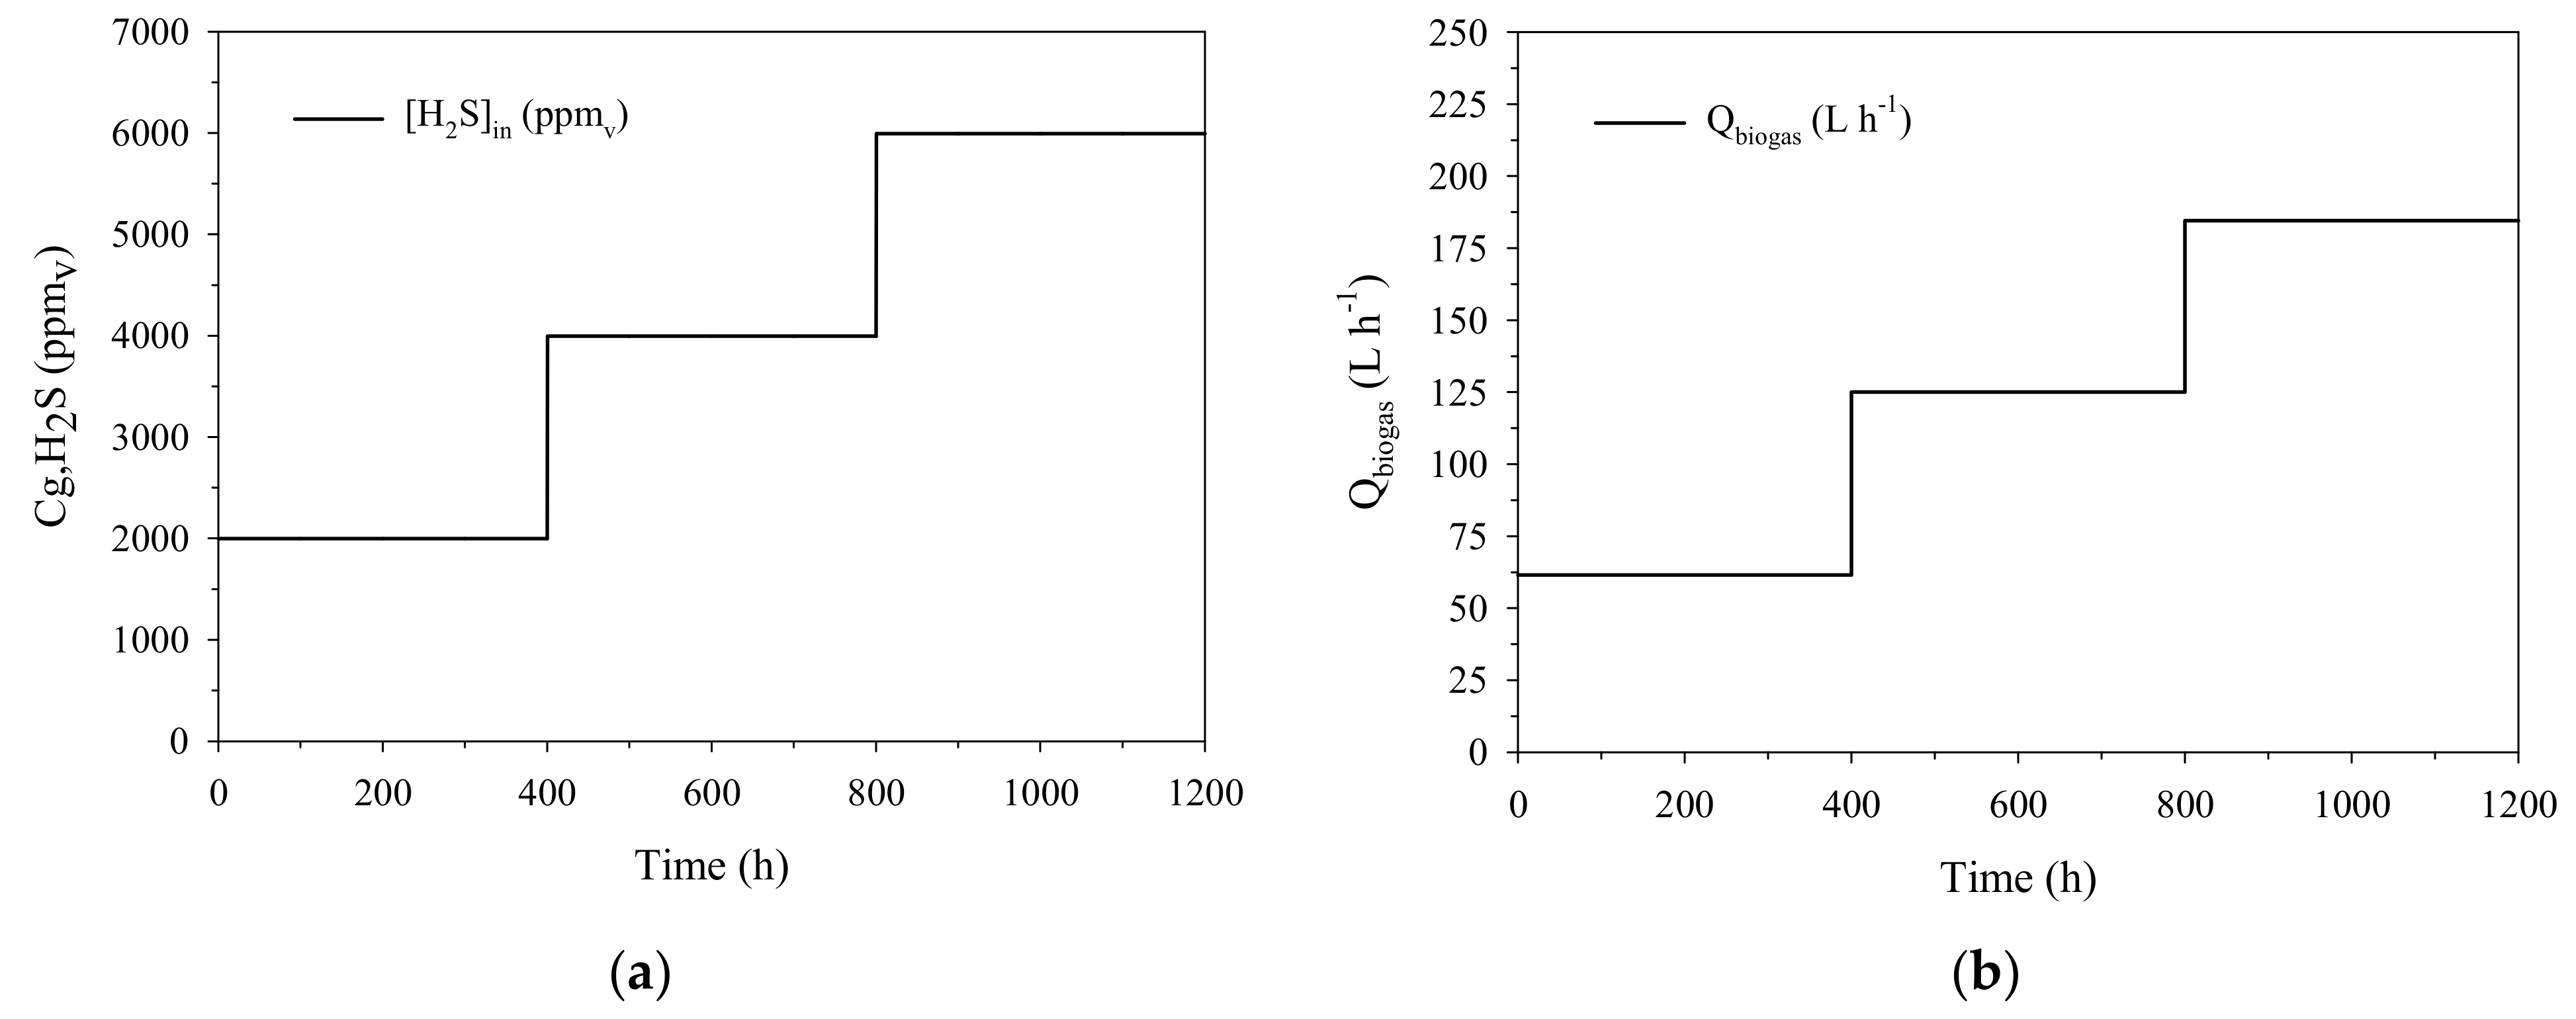
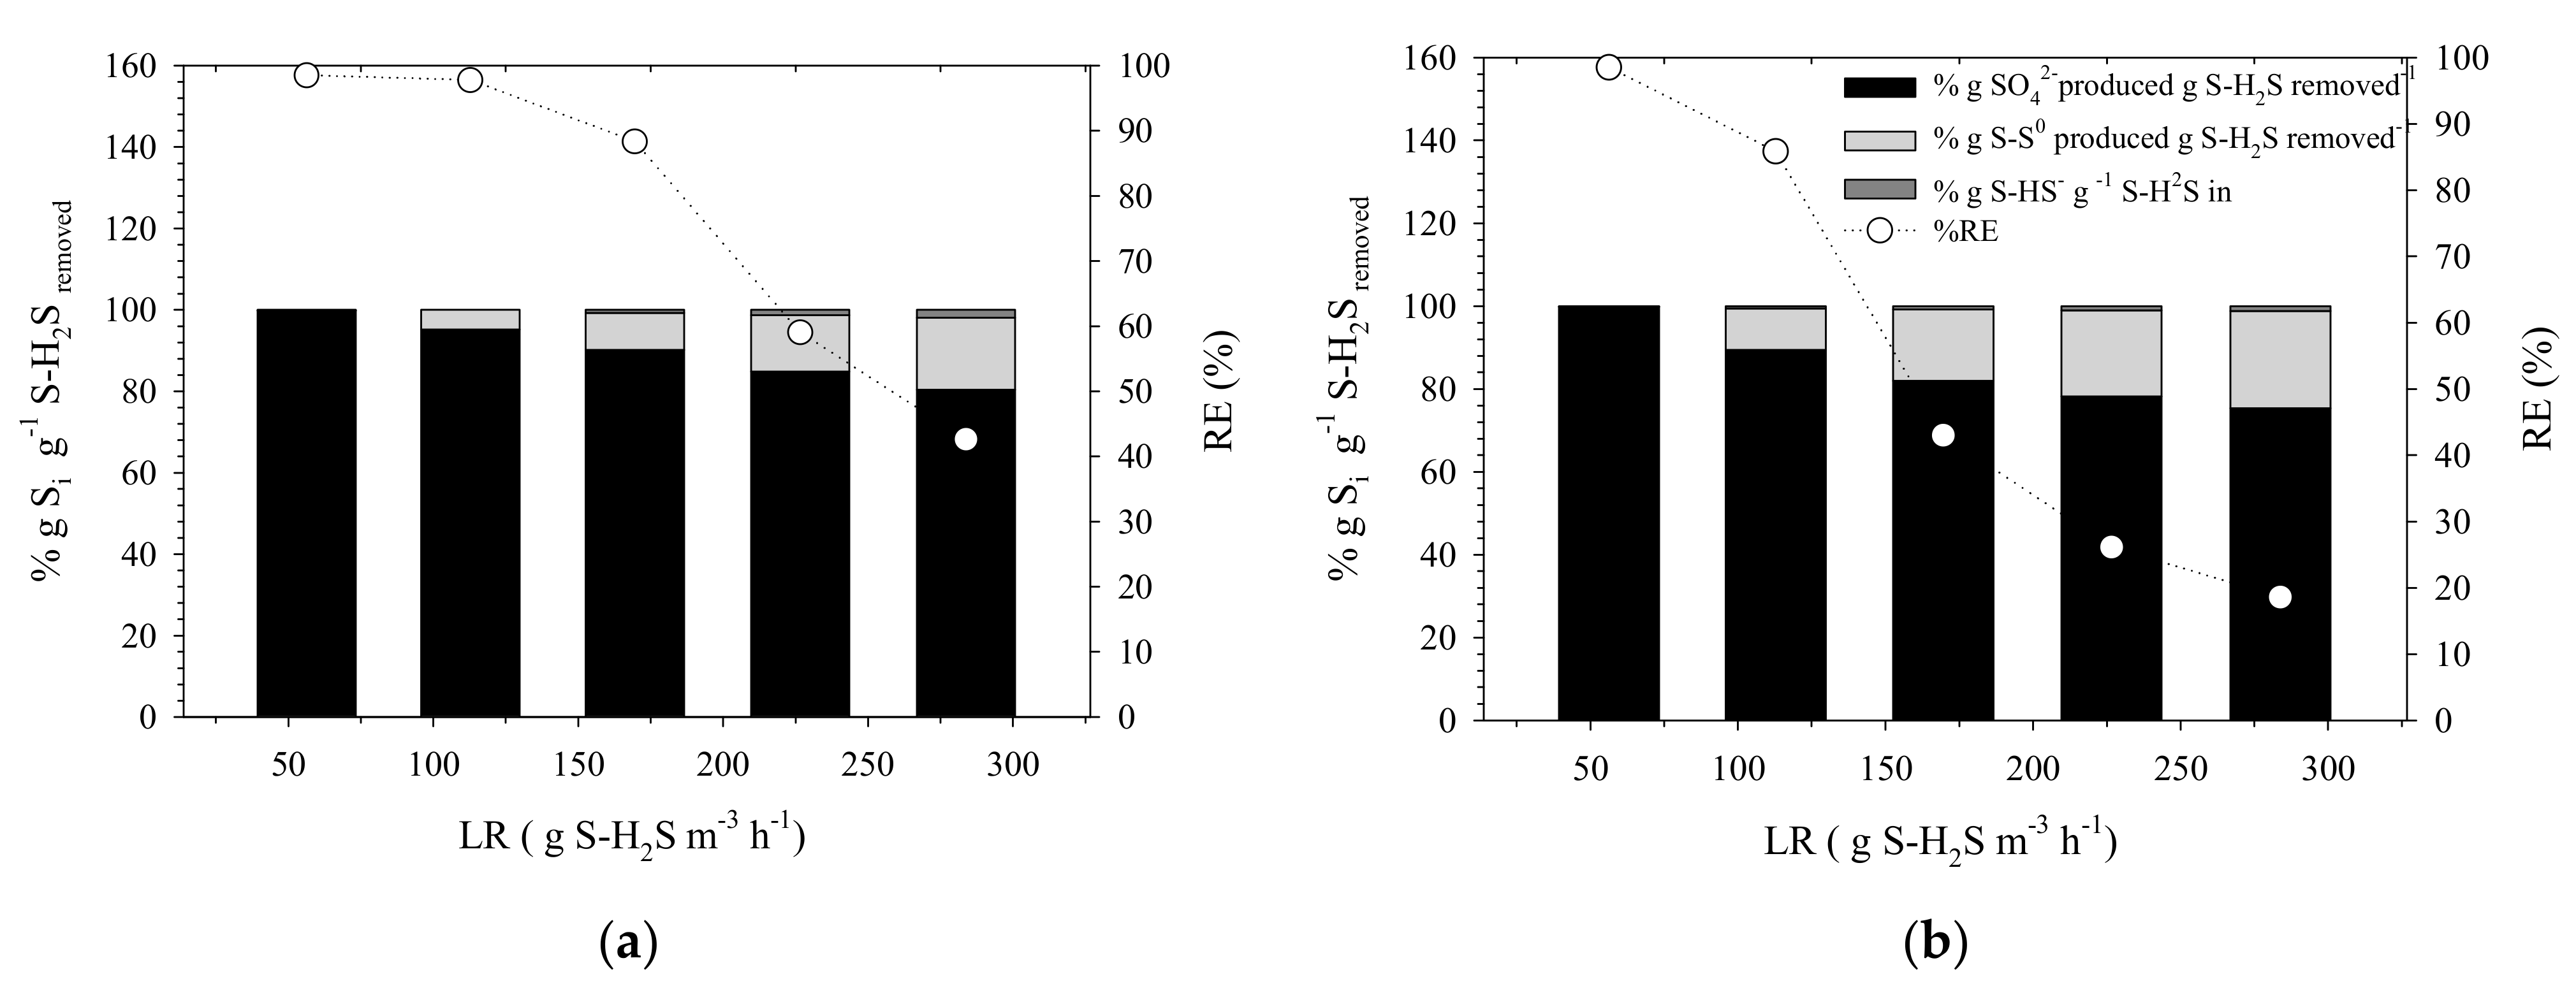
3.2. Analysis of Open-Loop Behavior: Effect of H2S LR Changes Due to H2S Inlet Concentration and Biogas Flowrate Changes on BTF Performance

Steady-state results of the BTF performance operated under Open-Loop conditions are presented in Figure 4a,b for H2S-LR disturbances due to stepwise changes in the H2S inlet concentration (Figure 4a) and biogas flowrate (Figure 4b). Results presented in Figure 4a indicate that H2S RE decreased from 98.5% to 42.6%, sulfate selectivity from 99.80% to 80.30%, while elemental sulfur produced increased from 0.10% to 17.80%. When H2S-LR is increased by means of increasing the H2S inlet concentration, the O2/H2S volumetric ratio decreases, favoring the accumulation of elemental sulfur, and affecting significantly the sulfide consumption rate [32]. Thus, the BTF is operating under biological limiting conditions. If the condition causing this problem persists, sulfur tends to accumulate in the liquid phase decreasing the H2S concentrations gradient between the gas and liquid phase and affecting the RE of H2S as it is observed in the data in Figure 4a. Such results are consistent with experimental results obtained when lab-scale, pilot scale and real scale biotrickling filters have been operated under open loop conditions [6,9,11].
On the other hand, when the H2S-LR was increased due to the increase of the biogas flowrate (Figure 4b), the loss in the system performance was even more dramatic. H2S RE decreased from 98.52 to 18.67%, while sulfate selectivity decreased from 99.8 to 75.5% and elemental sulfur accumulation increased from 0.1 to 23.5% for the lowest and highest H2S inlet concentration tested (10,000 ppmv). Such reduction is directly related to a reduction in the contact time between the gaseous compounds (O2 and H2S) and the liquid phase, which concomitantly affects the mass transfer capacity of the system and, therefore, the overall performance of the BTF [6,9]. This is reflected in the steep slopes of the H2S RE profile in Figure 4b. Results of the BTF operated under Open-Loop conditions show that when a disturbance affects the BTF, such as an H2S concentration increase or an increase in the biogas flowrate, the main process performance variables are also significantly affected; therefore, process control needs are clearly evidenced.

3.3. Controller Tuning

In feedback control, the controlled variables are compared to the setpoint to calculate the error upon which the controller applies an action into the system through the manipulated variable to minimize the error value. It is helpful, before running the system with the feedback controller coupled, to optimize the controller parameters. This step is called controller tuning and it can be done using mathematical equations or algorithms [17]. According to the flowchart of the methodology followed to design the control strategies (Figure A1), the step after the definition of the closed-loop scenarios is the controller parameter tuning. For each closed-loop scenario, AFR-CL and TLV-CL, and for each type of disturbance of the system, a different set of controller parameters were analyzed.

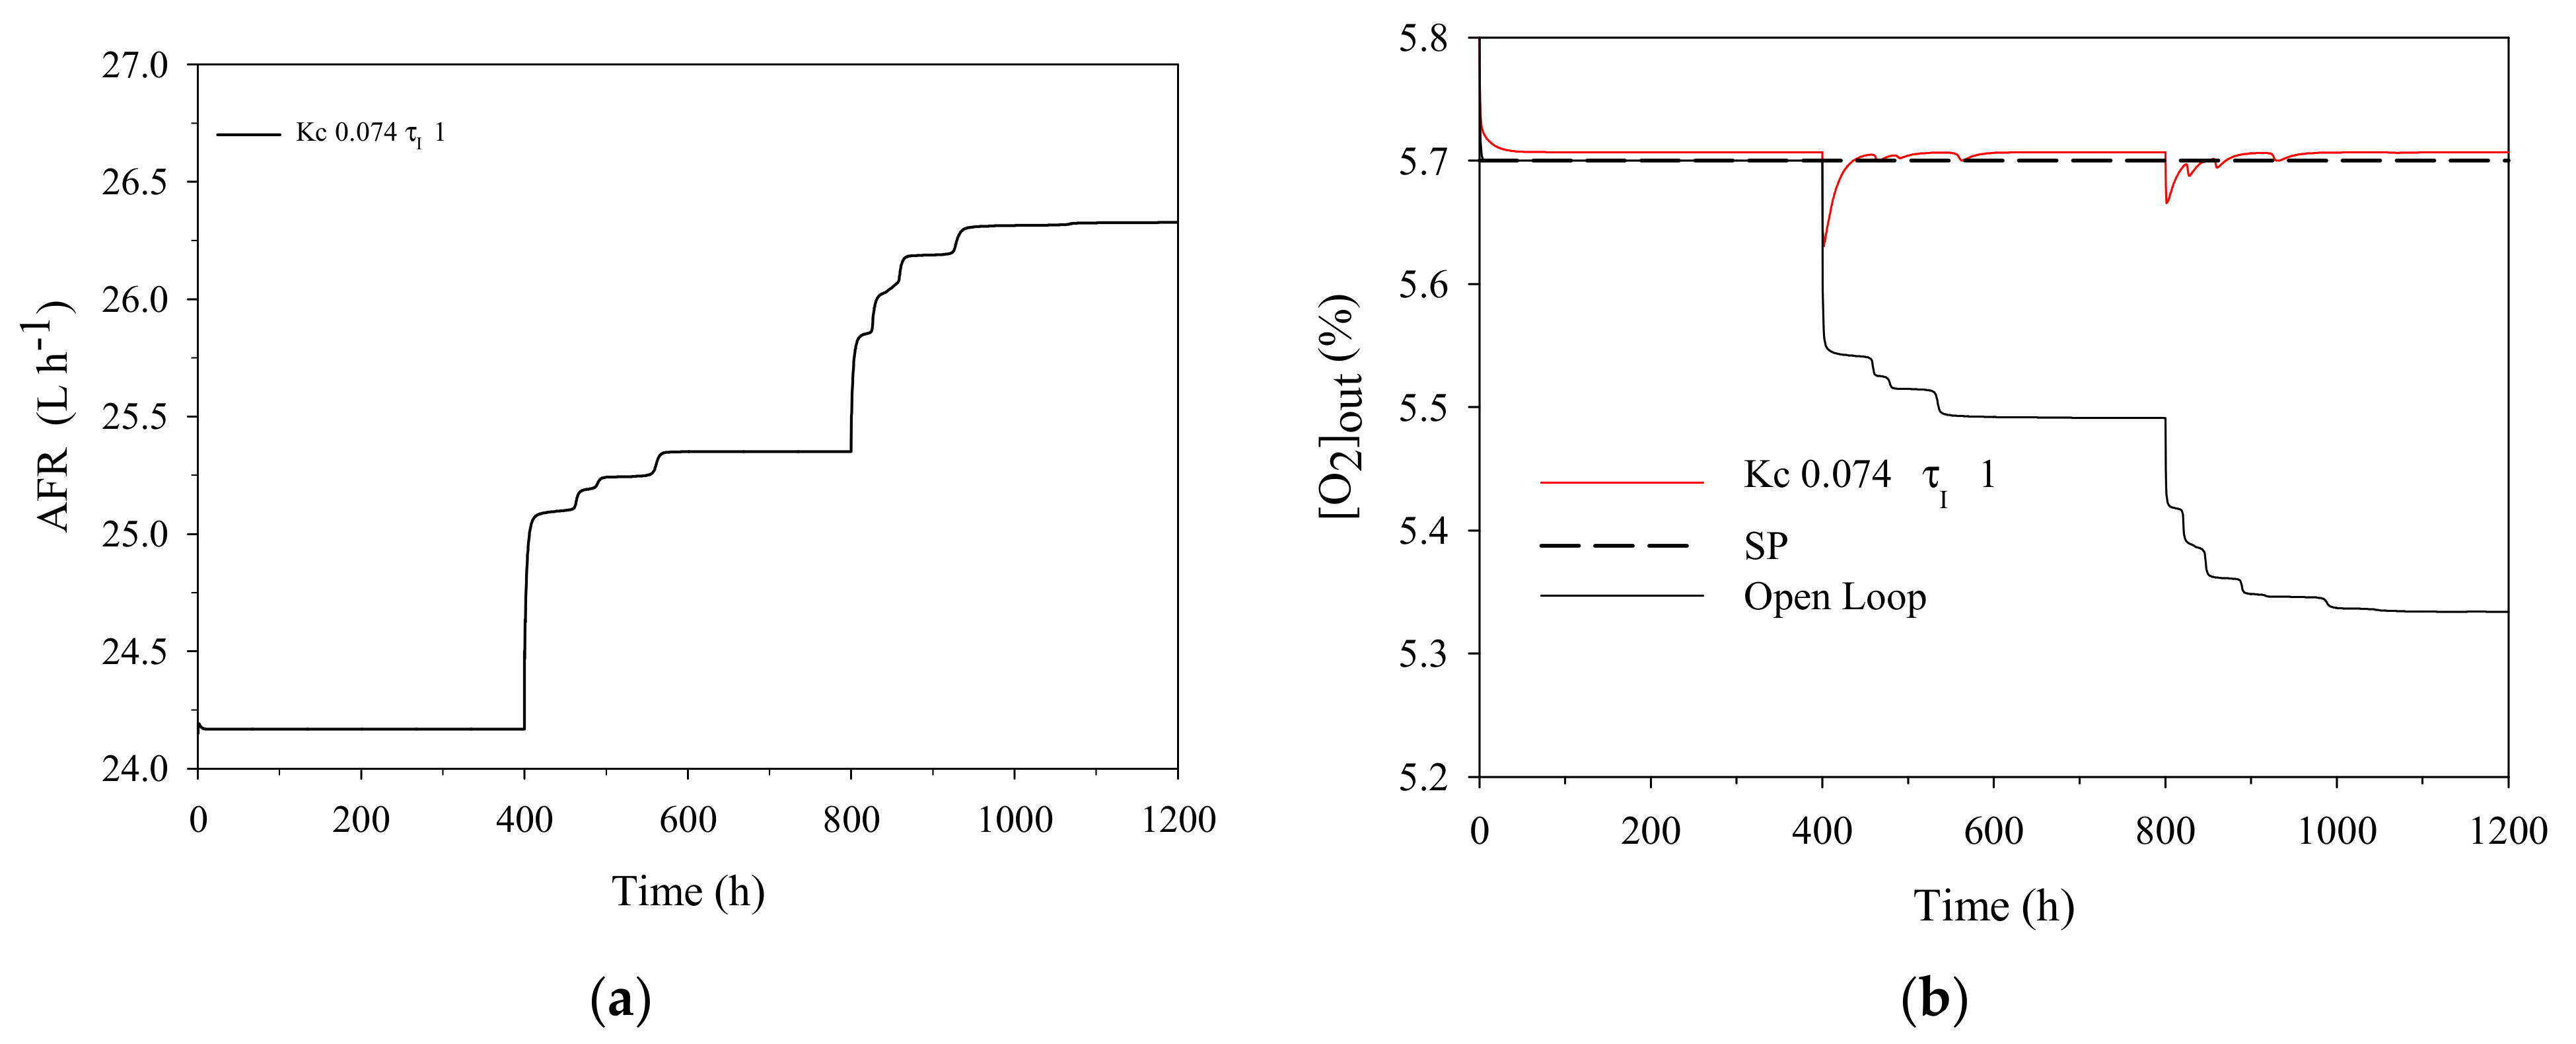
3.3.1. Air Flowrate Closed-Loop Scenario

Table 5 shows the results for the IAE criteria obtained by applying controller parameters defined in Table 3, for a proportional (P) and proportional-integral (PI) feedback controller coupled to the BTF model to control H2S inlet concentration disturbances through the regulation of air flowrate (AFR-CL).
For a P controller, Kc values higher than 0.12 (shaded values in gray) provided an oscillatory response of the final control element (air flowrate in the case of the AFR-CL). Kc of 0.1 (in bold) was selected as a suitable value for the P controller due to the lower ISE value and the lack of oscillatory response. This was the best tuning for the scenario with air flowrate regulation (AFR-CL) during variable H2S-LR conditions with increased H2S concentration. On the other hand, for the evaluation of IAE criteria for the PI controller, three different time integral values (1, 2.5 and 5) were evaluated as shown in Table 5. In order to reduce the degrees of freedom during the controller tuning, once the suitable Kc value was determined for the P controller, a 26.5% of reduction for the Kc value for the PI controller was applied, as is done for Cohen and Coon reaction curve methodology [28]. In addition, Kc values generating an unstable response of the system for a P controller were not included in the study of the PI controller. According to Table 5, the most suitable combination of parameters was Kc = 0.074 and τI = 1. In Figure 5a, the PI controller actuation applied to control the O2 concentration ([O2]out) through AFR-CL with the selected parameters (Kc = 0.074 and τI = 1) is presented. While Figure 5b shows the offset between the [O2]out and the SP.
Although the [O2]out signal is not exactly at the setpoint value, the difference between the simulated value and the SP was minimal. The average [O2]out was 5.707 while the SP value was 5.70, which gives a relative error of 0.12%. Hence, it was considered that there was no offset between the signal and the SP.
The AFR-CL response of the controller to the H2S concentration increase is to increase the air flowrate as reflected in Figure 5a to maintain the [O2]out in the SP value as shown in Figure 5b. Figure 5b also shows the [O2]out of the process when operated under Open-Loop conditions. The increase in air flowrate resulted in an increase of the dilution by 2.3%. Figure 6 shows the H2S outlet concentration when [O2]out was the controlled variable in the AFR-CL control strategy.
The impact of AFR-CL on H2S outlet concentration is minimal and it is mainly related to biogas dilution. However, if the controller performance is analyzed, the PI controller resulted useful to control the [O2]out. To have a complete analysis of the impact of the control strategy over the process, in Section 3.4 it will be assessed and discussed the added value of control strategies over the system performance in terms of sulfate selectivity, oxygen consumption and reduction of elemental sulfur production.

3.3.2. Trickling liquid velocity Closed-Loop Scenario

  • Disturbance: H2S inlet concentration
Table 6 presents the results for IAE criteria for the P and PI controllers for the TLV-CL scenario when the H2S inlet concentration is the disturbance. For the P controller, it can be observed how a Kc higher than 300 barely reduced the error criteria. Moreover, the higher the gain the more unstable response was obtained (data not shown). For example, a gain of 1000 produced an unstable response of the actuator (shaded values in gray). Therefore, following the IAE criteria and the simple performance criteria, a Kc in the range of 200 and 300 was selected as a suitable range for the P controller in the present case.
On the other hand, the evaluation of a PI controller for the TLV-CL shows little differences between the different cases studied. Overall, the smaller error was obtained with the highest Kc and the lowest τI. However, considering only the IAE criteria would be erroneous since, as mentioned before parameters that provide the smaller error can lead to an unstable/oscillatory response of the controller, as in the case of the values shaded in gray in Table 6. Hence, considering both criteria, IAE error and unstable/oscillatory response, the parameters selected were Kc = 147 and τI = 1. Figure 7 presents simulation results for this tuning for the PI controller in the scenario of H2S outlet concentration control facing H2S inlet concentration changes through TLV regulation (TLV-CL).
Figure 7a shows that during the first two steps of H2S concentration, no change in the controller output (TLV regulation) was performed, since the [H2S]out was still below the SP. Only during the last concentration step did the controller increase the TLV to reduce the offset between the controlled variable and the SP. It must be noted in Figure 7a that the controller output (TLV) did not reached its maximum as it would be expected. For a digital PI controller, the manipulated variable is expected to continuously increase until reaching its maximum value or until decreasing the controlled variable. In this case that did not occurred, as observed in Figure 7a for the controller output (TLV) and in Figure 7b for the controlled variable ([H2S]out). As it can be observed in Figure 7a, at the beginning of the third H2S inlet concentration increase (t = 800 h), corresponding to an inlet concentration of 6000 ppmv H2S, the first controller response is to increase the TLV as much as possible according to what is expected for a digital PI controller. However, the controller was not capable of decreasing the error through that actuation after some hours and some overshoot and oscillatory response was produced. During that time the proportional action turned into a null action, since the increase of the error was constant (the increase in the error is not significant). Although the TLV was progressively increased during the last period, the I action by itself was not capable of decreasing the [H2S]out. As shown in Table 6, the tuning still provided an IAE error for the PI controller, as it also can be seen in Figure 7b by an offset of 20 ppmv. In addition, Open-Loop [H2S]out is presented in Figure 7b to show that the impact of the application of control strategies specifically for the last concentration step is very significant, as will be discussed further in Section 3.
Finally, if the AFR-CL control strategy is compared with the TLV-CL strategy, the latter is based on a more complex process, since, in order to control the [H2S]out, first a gas-liquid mass transfer step is needed to reduce the [H2S]out, while for the AFR-CL control strategy, the manipulated variable directly affects the controlled variable [O2]out.
  • Disturbance: gas flowrate
In the case of considering the biogas flowrate as the disturbance for the TLV-CL scenario, results for the IAE criteria are presented in Table 7. As in the TLV-CL case, a different set of parameters might be chosen for both P and PI controllers if only time-integral criteria would be considered and simple criteria such as the stability of the controller response would not be included. In this sense, a Kc value for the P controller in the range of 100 to 300 would produce a suitable result for both criteria, while a Kc higher than 300 would result in unstable/oscillatory response of the actuator.
For the PI controller, a Kc in the range of 100 to 200 in combination with τI between 1 and 10 would provide a satisfactory performance of the controller. Figure 8 presents the simulation results for the combination of the selected parameters for the PI controller (Kc = 110 and τI = 1) for the H2S outlet concentration control facing biogas flowrate changes (TLV-CL).
In contrast to the previous scenario when the H2S inlet concentration is the disturbance, when biogas flowrate is modified, the Open-Loop response shows that the [H2S]out is already higher just after the first step change. In consequence, the controller increased the TLV to reduce the [H2S]out, indicating that the process is much more sensitive to the effect of reducing the EBRT (biogas flowrate increase) that to changes in the H2S concentration. Interestingly, at the highest H2S LR tested (169 g S-H2S m−3 h−1), the [H2S]out concentration was reduced from 1100 ppmv (Open-Loop response) down to 557 ppmv, which represents a 49.37% of reduction. However, such concentration was still far from the SP (100 ppmv) indicating that changes in the H2S-LR due to a biogas flowrate increase at the highest H2S-LR tested were not controllable by means of a TLV-CL control strategy. In addition, another reason why the SP was not achieved during the last H2S LR tested was because the maximum TLV was constrained to 28.3 m h−1. However, for the second H2S LR tested (112.6 g S-H2S m−3 h−1), was reduced to 120 ppmv which is only 20 ppmv above the SP, indicating that under those H2S LR condition and EBRT the process could be controlled.
It is important noticing that once the last H2S-LR was applied, the manipulated variable (TLV) was maxed out to try to reduce the error. Since the maximum TLV was constrained to 28.3 m h−1, the DO provided to the biotrickling filter was maintained constant although not sufficient to the system. That is reflected in the staircase response of the controlled variable after hour 800 in Figure 8b. The staircase shape is caused by a sum of causes, being the most important ones the progressive S0 accumulation in the bioreactor, the sulfide accumulation in the liquid phase and the loss of mass transfer capacity under high biogas flowrates (low EBRTs). Under these conditions, S was accumulated in the packed bed since the biotrickling filter was operated under O2 limiting conditions, since the oxygen supplied by the TLV was not enough to carry out H2S complete oxidation to sulfate. During the last biogas flowrate step, 16.10 g of S0 were produced, compared to only 7.90 g of S0 produced during the first two steps. The effect of S0 accumulation as well as the effect of sulfide accumulation over H2S consumption by SOB are both included in the kinetic equations of the model used in this work [22].The conditions applied to the biotrickling filter showed that the controller was not able to control the process. The uncontrollability of the process during the last H2S-LR was due to a limitation on the gas-liquid mass transfer under the low EBRT values. Therefore, to improve the controllability of the process under such conditions, the gas-liquid mass transfer must be improved, by using intensive gas-liquid mass transport devices such as Jet Venturi [3] to produce an intensive contact between the gas and liquid phase. In this sense, the model-based study of control strategies denotes its usefulness, since results as those shown in Figure 8 warn to the designer that under such H2S-LR conditions a redesign of the BTF would be needed to achieve higher H2S RE conditions.

3.4. Selecting the Most Suitable Feedback Controller and Control Strategy

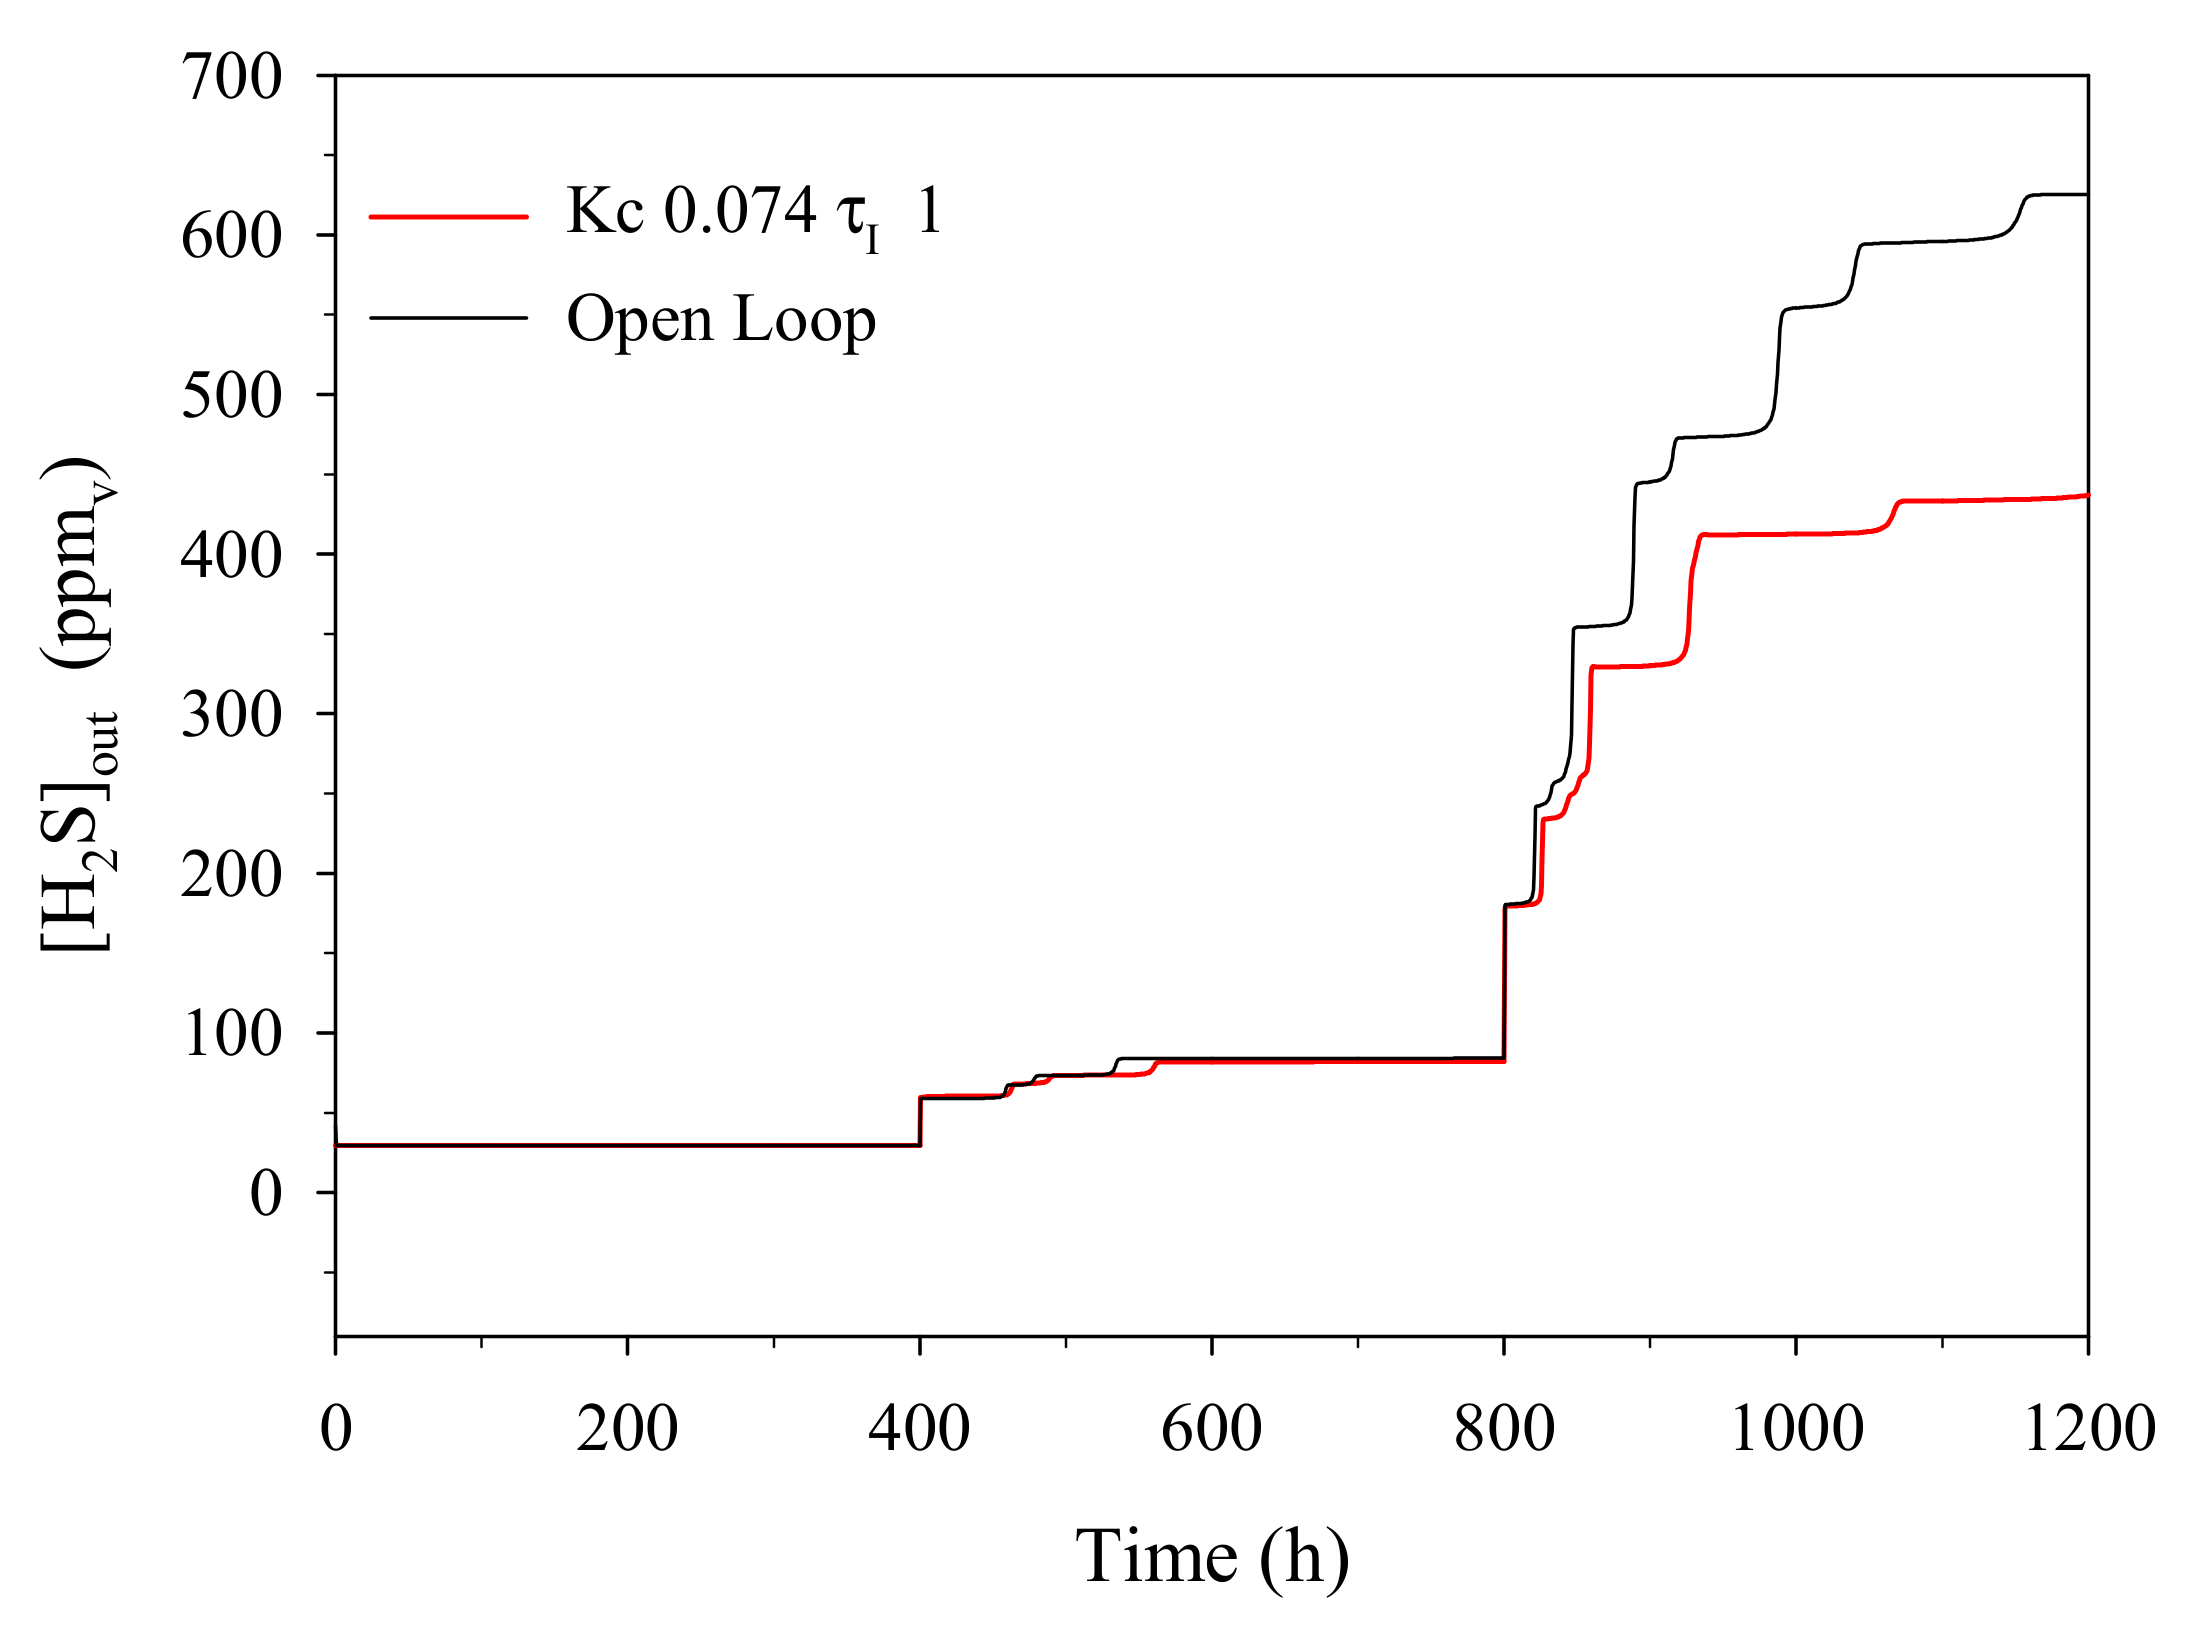
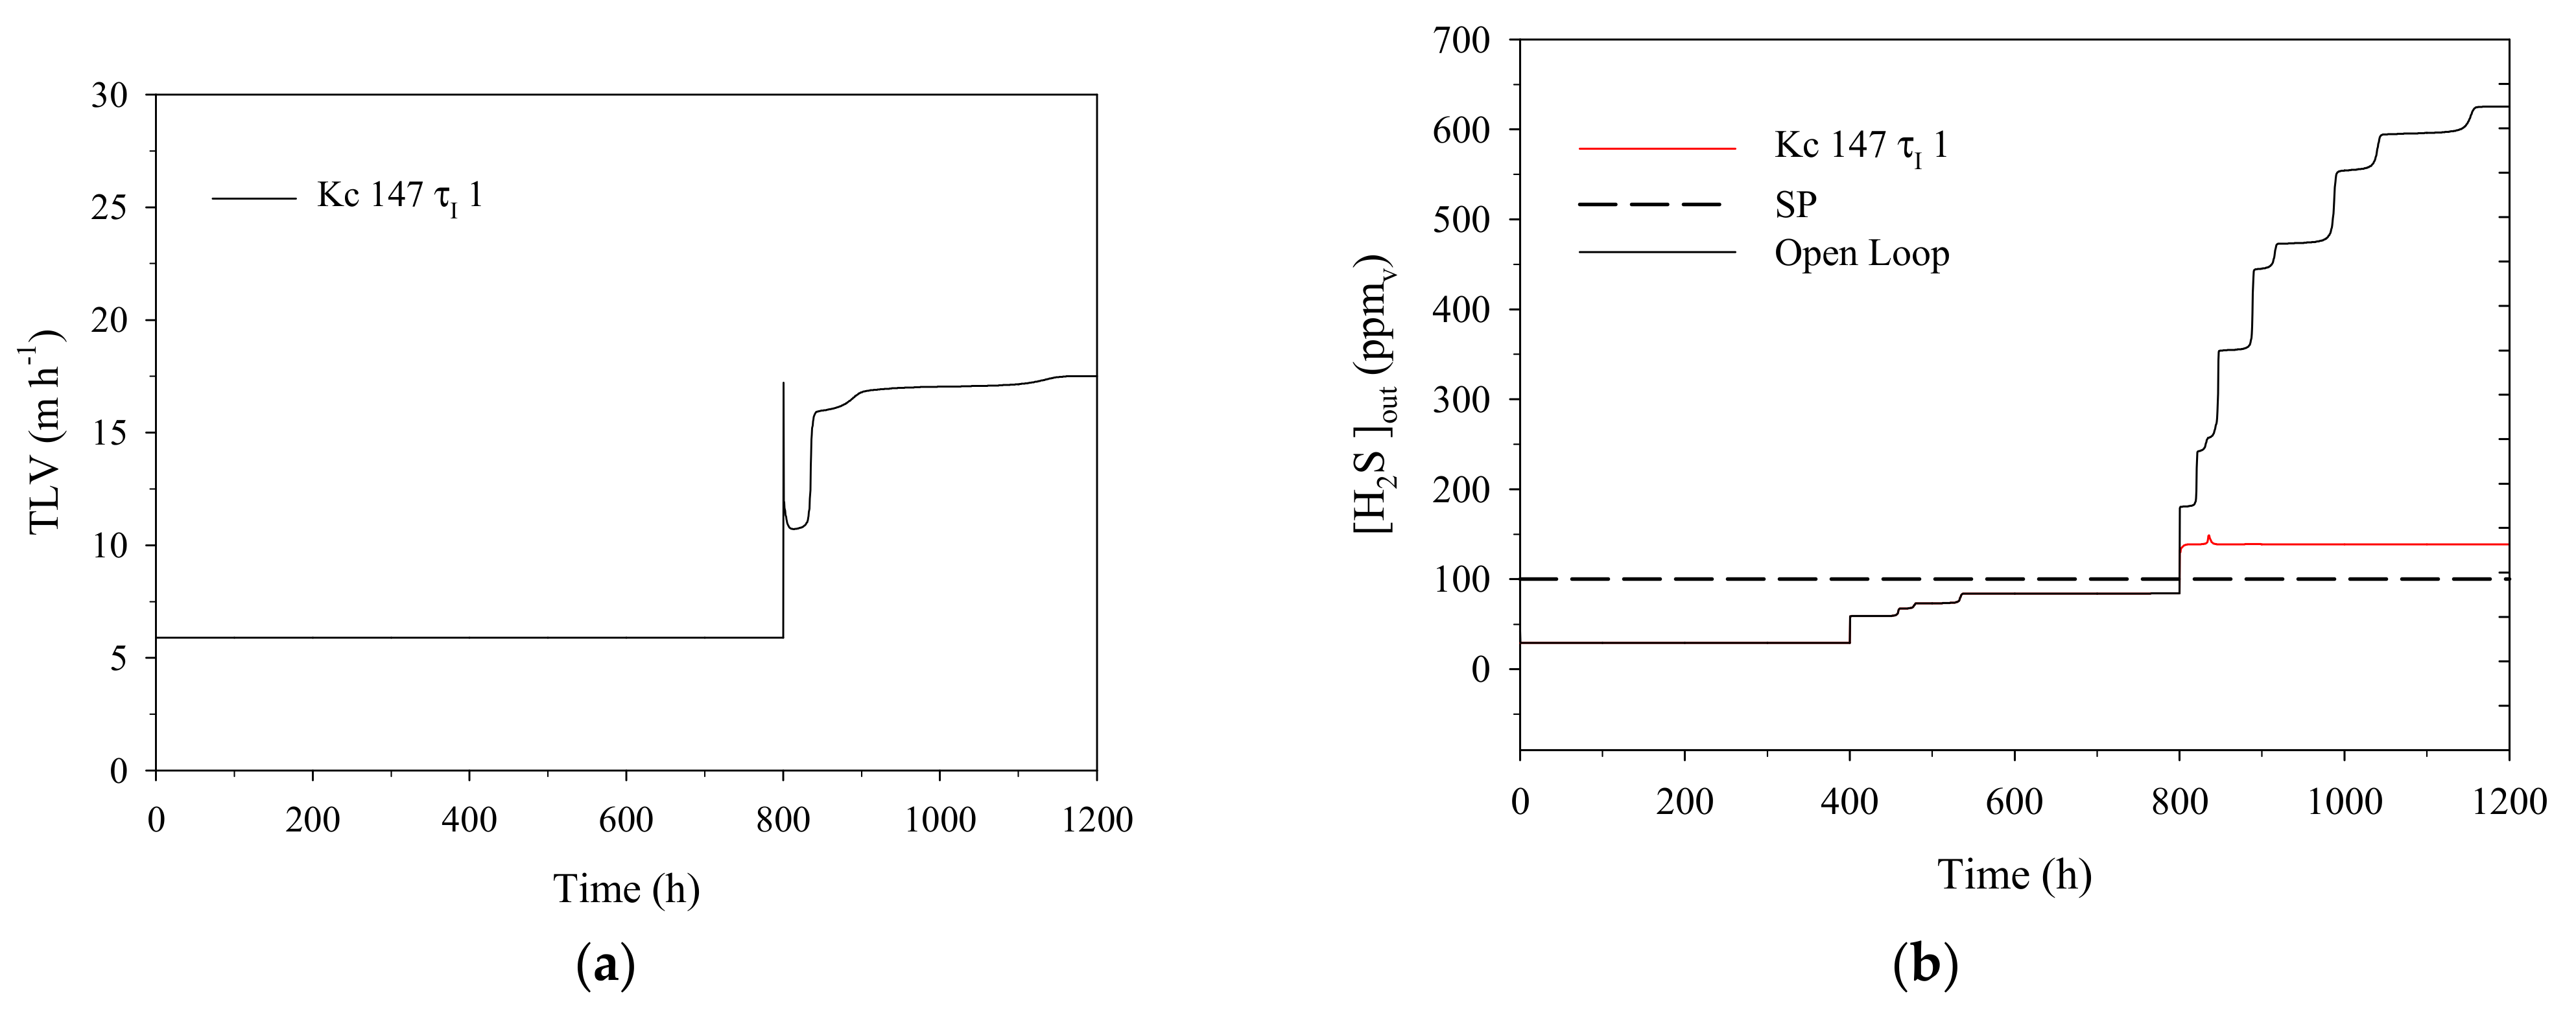
3.4.1. Selecting the Most Suitable Feedback Controller and Control Strategy to Face Disturbances in Inlet H2S Concentration

Table 8 presents the improvement in the main process variables for the AFR-CL and the TLV-CL strategies facing H2S inlet concentration changes using P and PI controllers tuned as discussed in Section 3.3. Interestingly, Table 8 shows that the [O2]out control through AFR regulation reduced the [H2S]out and also the elemental sulfur production, which is linked to an increase in the oxygen consumption and consequently to an increase in the sulfate production at the end of the simulation. However, the reduction and improvement percentages for AFR-CL compared to those ones obtained with TLV-CL are much lower. AFR-CL was shown to be less effective than TLV-CL since controlling the [O2]out does not ensure a better gas-liquid mass transfer, which is one of the main limiting steps of the desulfurization process. Through TLV regulation, oxygen consumption was also substantially increased as shown in Table 8 without any further biogas dilution effect if compared to the AFR-CL control strategy. According to Lopez et al. [11], TLV regulation improves the penetrability of the liquid through the packed bed reducing possible DO gradients and, therefore, the formation of elemental sulfur.
Regarding the comparison between P and PI controllers, a PI control law performed better in AFR-CL control strategy because the PI controller was able to remove completely the offset by means of a greater AFR actuation, consequently resulting in better performance of the system. However, the P controller provided larger improvements than the PI controller for the TLV-CL control strategy. This difference was due to the different tuning results between both controllers. Independently of the type of feedback controller evaluated, the TLV-CL control strategy offered interesting results to improve the performance of aerobic biogas desulfurization in biotrickling filters. TLV-CL strategy indicated that TLV regulation can help to achieve a reliable operation of the system, without any further biogas dilution.

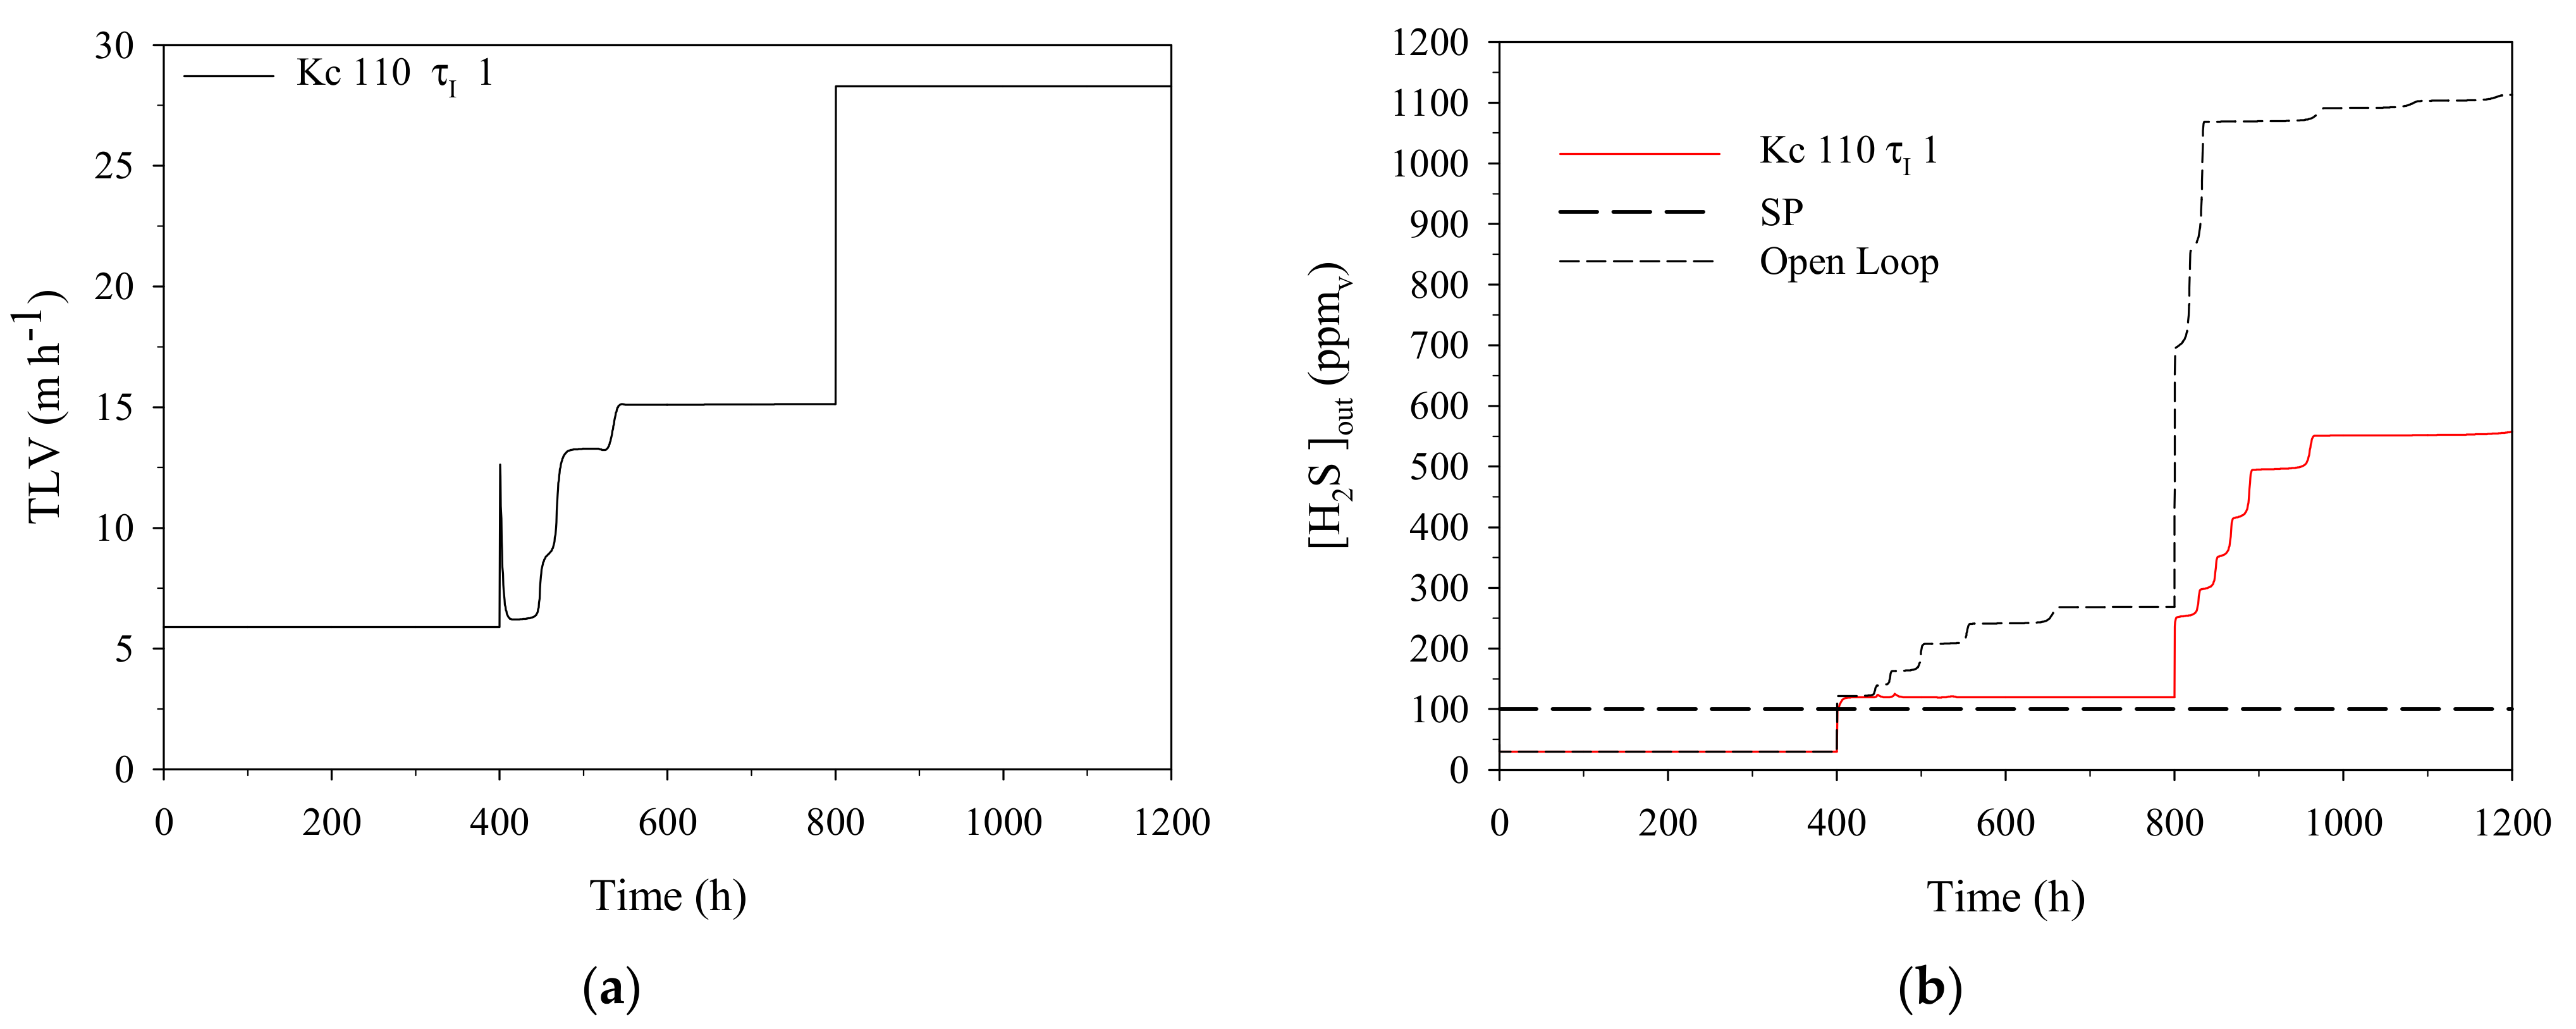
3.4.2. Selecting the Most Suitable Feedback Controller Using a TLV-CL Control Strategy to Face Variable Biogas Flowrate

Table 9 shows the improvement of the process variables using P and PI controllers in a TLV-CL control strategy facing biogas flowrate changes.
As discussed in Section 3.3, the process was out of the controllable limits using TLV as the manipulated variable when the highest flowrate was tested. Therefore, such results were excluded from this analysis. Table 9 shows that despite of operating the system under lower EBRT conditions, RE and oxygen consumption increased due to an enhancement of mass transfer along the packed bed due to TLV regulation. According to empirical correlations described in Section 3.1, a TLV increase also increases the global mass transfer coefficient (KLa) for H2S and oxygen, which is here validated by the improvement in RE and oxygen consumption when TLV was increased. The main differences between the two types of controller tested were related to the TLV applied in each case. For the P and PI controller, a maximum TLV of 21.9 m h−1 and 15.9 m h−1 was used, respectively. Thus, greater improvements are achieved with the P controller. It must be highlighted that differences in the performance of the controllers are strongly correlated to the type and duration of the disturbance tested in this study. Nonetheless, irrespective of the type of controller studied, process performance was positively improved through TLV regulation in order to face biogas flowrate changes. However, controlling biogas flowrate changes in BTFs at EBRT values below 69 s can hardly be done using classical controllers as it was done in this work.

4. Conclusions

The effect of different control strategies applied in an aerobic biotrickling filter for biogas desulfurization under different loading rate conditions was studied. The Billet and Schultes correlation fitted better experimental RE and sulfur species selectivity data than the Onda correlation and was therefore implemented in the model to achieve a better description of the manipulable variables (liquid and gas flowrate) during control strategies simulation. Evaluation of aerobic biogas desulfurization in biotrickling filters under Open-Loop conditions determined the strong need to mitigate disturbances such as H2S inlet increase or biogas flowrate changes When evaluating the controllability of the different process disturbances, changes on H2S inlet concentration have a higher controllability limit than biogas flowrate changes. The latter was found to be hardly controllable with classical controllers at EBRTs below 69 s.
Regarding the type of control loop studied, the Air flowrate closed loop control strategy was inefficient in terms of process improvement when added-value variables were considered because increasing the aeration flowrate does not ensure a proper gas-liquid mass transfer. The Air flowrate closed loop control strategy involves a certain biogas dilution, which reduces the calorific power of the biogas produced. Therefore, Air flowrate closed loop control strategy is not recommended in biotrickling filters for biogas desulfurization. On the other hand, the trickling liquid velocity closed loop control strategy resulted as a proper strategy to regulate H2S outlet concentration at H2S LR below 169 g S-H2S m−3h−1 when changes in the inlet H2S concentration occur. Although this strategy was only able to control H2S LR changes below 113 g S-H2S m−3h−1 when the biogas flowrate was the disturbance.
Overall, the TLV regulation also was a feasible strategy to improve complementary BTF performance parameters such as RE, sulfate selectivity, and O2 consumption under variable H2S LR conditions, independent of the type of feedback controller (P or PI). TLV showed better results than Air flowrate regulation strategy since no biogas dilution is involved and because the percentage of process improvement compared to the Open-Loop case is much higher.

Author Contributions

Conceptualization, L.R.L., J.A.B., E.V. and D.G.; methodology, L.R.L., J.A.B. and D.G.; software, L.R.L., J.A.B., E.V. and D.G.; validation, L.R.L., J.A.B., E.V. and D.G.; formal analysis, L.R.L., M.M., C.V.d.H., J.A.B., E.V. and D.G.; investigation, L.R.L., J.A.B., E.V. and D.G.; resources, L.R.L. and D.G.; data curation, L.R.L., M.M., J.A.B., E.V. and D.G.; writing—original draft preparation, L.R.L., M.M., C.V.d.H., J.A.B., E.V. and D.G.; writing—review and editing, L.R.L., M.M., C.V.d.H., J.A.B., E.V. and D.G.; visualization, L.R.L. and D.G.; supervision, E.V. and D.G.; project administration, D.G.; funding acquisition, L.R.L. and D.G. All authors have read and agreed to the published version of the manuscript.

Funding

(1) The Spanish government provided financial support through the Ministerio de Economía projects CTM2012-37927-C03/FEDER and project RTI2018-099362-B-C21. (2) Collaboration with Ghent University was thanks to funding acquired through the Cost Action program and their Short-Term Scientific Missions. Specifically, under the Cost Action ES1202 reference code COST-STSM-ECOST-STSM-ES1202-280915-067745.

Institutional Review Board Statement

Not applicable.

Informed Consent Statement

Not applicable.

Data Availability Statement

Data is contained within the article.

Acknowledgments

To the Department of Chemical, Biological and Environmental Engineering at UAB (Universitat Autònoma de Barcelona). Also special thanks to Javier Guerrero for his continuous support in control strategies and process automation along this work.

Conflicts of Interest

The authors declare no conflict of interest.

Appendix A

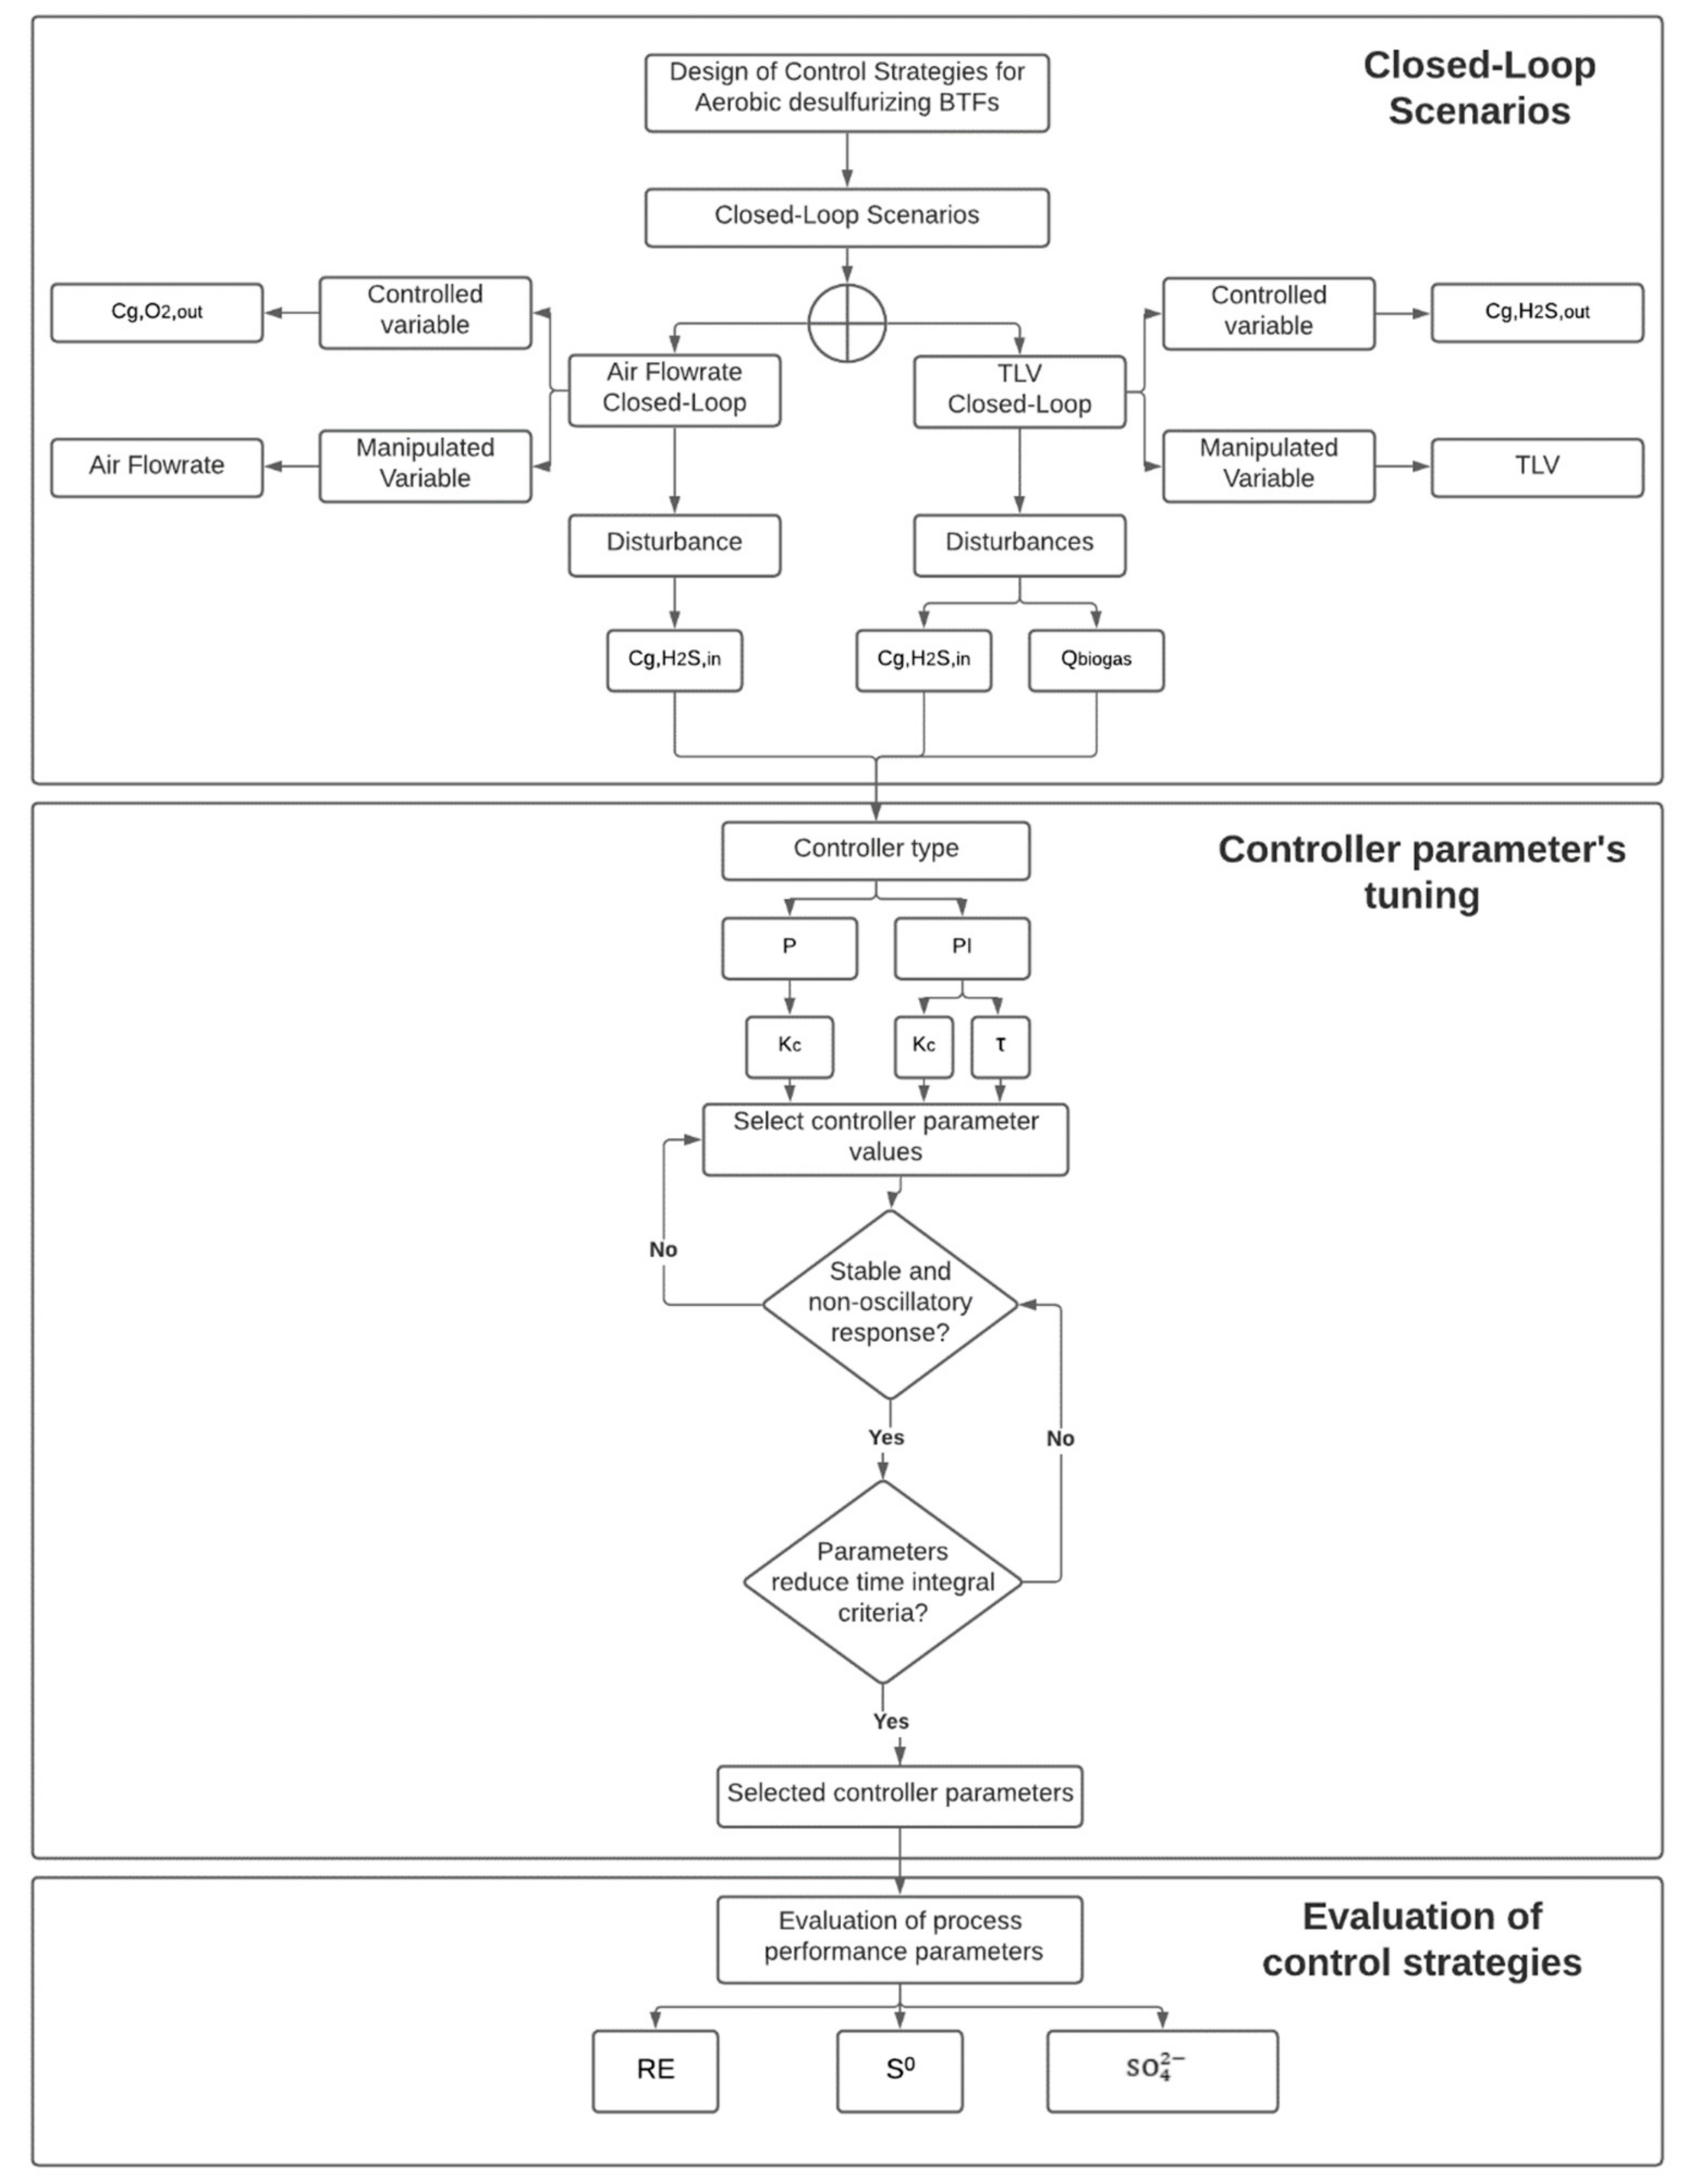
Appendix A.1. Flowchart of the Methodology Followed for Feedback Control Strategies Evaluation

Figure A1. Flowchart of the methodology followed for feedback control strategies evaluation.
Processes 09 00208 g0a1

Appendix A.2. Equations for Sulfur Mass Balances and the Amount of O2 Consumed

Sulfur mass balances and the amount of O2 consumed were determined according to Equation (A1)–(A5):
%   SO 4 , produced 2 = g   SO 4 , produced 2 g   S - H 2 S in · 100
%   S produced 0 = g   S produced 0 g   S - H 2 S in · 100
%   H 2 S outlet = g   S - H 2 S outlet g   S - H 2 S in · 100
%   g   O 2 , consumed = g   O 2 , inlet g   O 2 , outlet · 100
Once the percentage of each sulfur species and the O2 consumed was determined, it was compared with the values obtained during the Open-Loop case as described in Equation (5A) to determine the percentage of change.
%   Change = %   Open   Loop     %   Closed   Loop %   Open   Loop

Appendix A.3. Constants Needed for the Calculation of Mass Transfer Correlations

Table A1. Constants needed for the Billet and Schultes mass transfer correlation.
ParameterDescriptionValueUnits
C L Packing material specific constant0.905-
ρ L Liquid density1000kg m−3
gGravitational constant9.81m s−2
µ L Liquid viscosity 8.9 · 10 4 kg m−1 s−1
a p packing material specific surface area354m−1
d h Hydraulic diameter of packing material defined by 4ε/ap 9.6 · 10 3 m
Table A2. Constants needed for the Onda mass transfer correlation.
ParameterDescriptionValueUnits
ρ L Liquid density1000kg m−3
µ L Liquid viscosity 8.9 · 10 4 kg m−1 s−1
gcGravitational constant9.81m s−2
A w wetted area0.993m2
D,O2Diffusion coefficient of O2 2.5 · 10 9 m2 h−1
D,H2SDiffusion coefficient of H2S 1.6 · 10 9 m2 h−1
apacking material specific surface area354m−1
Dpnominal size of packing0.016m

References

  1. Pöschl, M.; Ward, S.; Owende, P. Evaluation of energy efficiency of various biogas production and utilization pathways. Appl. Energy 2010, 87, 3305–3321. [Google Scholar] [CrossRef]
  2. Persson, M.; Wellinger, A.; Braun, R.; Holm-nielsen, J.B.; Seadi, T.A.L.; Baxter, D.; Jormanainnen, M. Biogas Upgrading to Vehicle Fuel Standards and Grid Injection; IEA Bioenergy: Aadorf, Switzerland, 2006. [Google Scholar]
  3. Rodriguez, G.; Dorado, A.D.; Fortuny, M.; Gabriel, D.; Gamisans, X. Biotrickling filters for biogas sweetening: Oxygen transfer improvement for a reliable operation. Process Saf. Environ. Prot. 2014, 92, 261–268. [Google Scholar] [CrossRef] [Green Version]
  4. Walsh, J.L.; Ross, C.C.; Smith, M.S.; Harper, S.R. Utilization of biogas. Biomass 1989, 20, 277–290. [Google Scholar] [CrossRef]
  5. Choudhury, A.; Shelford, T.; Felton, G.; Gooch, C.; Lansing, S. Evaluations of hydrogen sulfide scrubbing systems for anaerobic digesters on two U.S. dairy farms. Energies 2019, 12, 4605. [Google Scholar] [CrossRef] [Green Version]
  6. Fortuny, M.; Gamisans, X.; Deshusses, M.A.; Lafuente, J.; Casas, C.; Gabriel, D. Operational aspects of the desulfurization process of energy gases mimics in biotrickling filters. Water Res. 2011, 45, 5665–5674. [Google Scholar] [CrossRef] [PubMed]
  7. Cox, H.H.J.; Deshusses, M.A. Biological waste air treatment in biotrickling filters. Curr. Opin. Biotechnol. 1998, 9, 256–262. [Google Scholar] [CrossRef]
  8. Tomàs, M.; Fortuny, M.; Lao, C.; Gabriel, D.; Lafuente, J.; Gamisans, X. Technical and economical study of a full-scale biotrickling filter for H2S removal from biogas. Water Pract. Technol. 2009, 4. [Google Scholar] [CrossRef]
  9. Montebello, A.M.; Fernández, M.; Almenglo, F.; Ramírez, M.; Cantero, D.; Baeza, M.; Gabriel, D. Simultaneous methylmercaptan and hydrogen sulfide removal in the desulfurization of biogas in aerobic and anoxic biotrickling filters. Chem. Eng. J. 2012, 200–202, 237–246. [Google Scholar] [CrossRef]
  10. Montebello, A.M.; Mora, M.; López, L.R.; Bezerra, T.; Gamisans, X.; Lafuente, J.; Baeza, M.; Gabriel, D. Aerobic desulfurization of biogas by acidic biotrickling filtration in a randomly packed reactor. J. Hazard. Mater. 2014, 280, 200–208. [Google Scholar] [CrossRef]
  11. López, L.R.; Bezerra, T.; Mora, M.; Lafuente, J.; Gabriel, D. Influence of trickling liquid velocity and flow pattern in the improvement of oxygen transport in aerobic biotrickling filters for biogas desulfurization. J. Chem. Technol. Biotechnol. 2016, 91, 1031–1039. [Google Scholar] [CrossRef]
  12. Munz, G.; Gori, R.; Mori, G.; Lubello, C. Monitoring biological sulphide oxidation processes using combined respirometric and titrimetric techniques. Chemosphere 2009, 76, 644–650. [Google Scholar] [CrossRef] [PubMed]
  13. Krayzelova, L.; Bartacek, J.; Díaz, I.; Jeison, D.; Volcke, E.I.P.; Jenicek, P. Microaeration for hydrogen sulfide removal during anaerobic treatment: A review. Rev. Environ. Sci. Biotechnol. 2015, 14, 703–725. [Google Scholar] [CrossRef]
  14. Syed, M.; Soreanu, G.; Falletta, P.; Béland, M. Removal of hydrogen sulfide from gas streams using biological processes—A review. Can. Biosyst. Eng. 2006, 48, 2.1–2.14. [Google Scholar]
  15. Krayzelova, L.; Bartacek, J.; Kolesarova, N.; Jenicek, P. Bioresource technology microaeration for hydrogen sulfide removal in UASB reactor. Bioresour. Technol. 2014, 172, 297–302. [Google Scholar] [CrossRef] [PubMed]
  16. Nguyen, D.; Gadhamshetty, V.; Nitayavardhana, S.; Khanal, S.K. Automatic process control in anaerobic digestion technology: A critical review. Bioresour. Technol. 2015, 193, 513–522. [Google Scholar] [CrossRef]
  17. Brito, J.; Almenglo, F.; Ramírez, M.; Cantero, D. Feedback and feedforward control of a biotrickling filter for H2S desulfurization with nitrite as electron acceptor. Appl. Sci. 2019, 9, 2669. [Google Scholar] [CrossRef] [Green Version]
  18. López, L.R.; Brito, J.; Mora, M.; Almenglo, F.; Baeza, J.A.; Ramírez, M.; Lafuente, J.; Cantero, D.; Gabriel, D. Feedforward control application in aerobic and anoxic biotrickling filters for H2S removal from biogas. J. Chem. Technol. Biotechnol. 2018, 93, 2307–2315. [Google Scholar] [CrossRef]
  19. Guimerà, X.; Mora, M.; López, L.R.; Gabriel, G.; Dorado, A.D.; Lafuente, J.; Gamisans, X.; Gabriel, D. Coupling dissolved oxygen microsensors measurements and heterogeneous respirometry for monitoring and modeling microbial activity within sulfide-Oxidizing biofilms. Chem. Eng. J. 2020, 400, 125846. [Google Scholar] [CrossRef]
  20. Bonilla-Blancas, W.; Mora, M.; Revah, S.; Baeza, J.A.; Lafuente, J.; Gamisans, X.; Gabriel, D.; González-Sánchez, A. Application of a novel respirometric methodology to characterize mass transfer and activity of H2S-oxidizing biofilms in biotrickling filter beds. Biochem. Eng. J. 2015, 99, 24–34. [Google Scholar] [CrossRef] [Green Version]
  21. Almenglo, F.; Ramírez, M.; Gómez, M.; Cantero, D.; David, A. Modeling and control strategies for anoxic biotrickling filtration in biogas purification. J. Chem. Technol. Biotechnol. 2015, 91, 1782–1793. [Google Scholar] [CrossRef]
  22. López, L.R.; Dorado, A.D.; Mora, M.; Gamisans, X.; Lafuente, J.; Gabriel, D. Modeling an aerobic biotrickling filter for biogas desulfurization through a multi-step oxidation mechanism. Chem. Eng. J. 2016, 294, 447–457. [Google Scholar] [CrossRef] [Green Version]
  23. Onda, K.; Takeuchi, H.; Okumoto, Y. Mass transfer coefficients between gas and liquid phases in packed columns. J. Chem. Eng. Japan 1968, 1, 173–180. [Google Scholar] [CrossRef] [Green Version]
  24. Billet, R.; Schultes, M. Predicting mass transfer in packed columns. Chem. Eng. Technol. 1993, 16, 1–9. [Google Scholar] [CrossRef]
  25. Wang, G.Q.; Yuan, X.G.; Yu, K.T. Review of mass-transfer correlations for packed columns. Ind. Eng. Chem. Res. 2005, 44, 8715–8729. [Google Scholar] [CrossRef]
  26. Andreasen, R.R.; Nicolai, R.E.; Poulsen, T.G. Pressure drop in biofilters as related to dust and biomass accumulation. J. Chem. Technol. Biotechnol. 2012, 87, 806–816. [Google Scholar] [CrossRef]
  27. Al Seadi, T.; Rutz, D.; Prassl, H.; Kottner, M.; Finsterwalder, T.; Volk, R.J.S. Biogas Handbook; University of Southern Denmark Esbjerg: Esbjerg, Denmark, 2008; ISBN 9788799296200. [Google Scholar]
  28. Stephanopoulus, G. Chemical Process Control: An Introduction to Theory and Practice; Prentice Hall: Englewood Cliffs, NJ, USA, 1984. [Google Scholar]
  29. Åström, K.J.; Hägglund, T. PID Controllers: Theory, Design, and Tuning; ISA—The Instrumentation, Systems and Automation Society: Durham, NC, USA, 1995; Volume 2. [Google Scholar]
  30. Van der Heyden, C.; Vanthillo, B.; Pieters, J.G.; Demeyer, P.; Volcke, E.I.P. Mechanistic modeling of pollutant removal, temperature, and evaporation in chemical air scrubbers. Chem. Eng. Technol. 2016, 39, 1785–1796. [Google Scholar] [CrossRef] [Green Version]
  31. Nash, J.E.; Sutcliffe, J.V. River flow forecasting through conceptual models part I—A discussion of principles. J. Hydrol. 1970, 10, 282–290. [Google Scholar] [CrossRef]
  32. Mora, M.; López, L.R.; Lafuente, J.; Pérez, J.; Kleerebezem, R.; Van Loosdrecht, M.; Gamisans, X.; Gabriel, D. Respirometric characterization of aerobic sulfide, thiosulfate and elemental sulfur oxidation by S-oxidizing biomass. Water Res. 2016, 89, 282–292. [Google Scholar] [CrossRef]
Figure 1. Schematic of control strategy (a) for controlling Cg,O2,out through gas flowrate regulation (b) for controlling Cg,H2S,out through liquid recirculation flowrate in a co-current BTF set up: (1) biogas inlet, (2) Air flow inlet to the aeration column, (3) aeration column, (4) Air flow inlet to the BTF, (5) main reactor, (6) biogas outlet, (7) liquid recycled, (8) H2S and O2 transmitters, (9) feedback controller, (10) recycling pump, (11) recycling liquid line to the BTF (12) mineral medium and bicarbonate supply, (13) liquid purge.
Processes 09 00208 g001
Figure 2. Inlet profile to simulate (a) H2S inlet concentration changes and (b) biogas flow rate change.
Processes 09 00208 g002
Figure 3. (a) Mass transfer coefficient as a function of the TLV using the Billet and Schultes correlation (dark solid line), Onda correlation (red solid line) and (b) Open-Loop performance as a function of the incoming H2S gas concentration. Experimental (o) and simulated (solid line) H2S removal efficiency. Experimental (●) and simulated (dashed line) sulfate selectivity: experimental (□) and simulated sulfur selectivity. An additional comparison was made between the Billet & Schultes correlation (black) and Onda’s correlation (red). Further information about how experimental data from Figure 3B was obtained can be found in [11].
Processes 09 00208 g003
Figure 4. Sulfur species selectivity as function of H2S loading rate (LR) step-wise changes of (a) H2S inlet concentration and (b) biogas flowrate under Open-Loop conditions.
Processes 09 00208 g004
Figure 5. AFR-CL strategy results. (a) Air flowrate (manipulated variable) for O2 control facing inlet H2S concentration changes using a PI controller showing stable behavior and (b) O2 concentration (controlled variable) for O2 control facing inlet H2S concentration changes using a PI controller showing stable behavior.
Processes 09 00208 g005
Figure 6. AFR-CL strategy results. H2S outlet concentration evolution (process variable) during O2 control facing inlet H2S concentration changes using a PI controller showing stable behavior.
Processes 09 00208 g006
Figure 7. TLV-CL results obtained for the scenario with H2S control facing inlet H2S concentration changes using a PI controller. (a) Trickling liquid velocity (manipulated variable) and (b) H2S outlet concentration (controlled variable) compared to the Open-Loop scenario.
Processes 09 00208 g007
Figure 8. TLV-CL results obtained for the scenario with H2S control facing biogas flowrate changes using a PI controller. (a) Trickling liquid velocity manipulated variable and H2S outlet concentration (controlled variable) (b).
Processes 09 00208 g008
Table 1. Operational conditions for K L , H 2 S evaluation.
[H2S][H2S] LRO2/H2STLV
(ppmv)(g S-H2S m−3 h−1)(% v/v)(m h−1)
200056.342.24.4
4000112.921.0
6000169.614.0
8000226.610.5
10,000283.88.4
Table 2. Reference conditions for Open-Loop tests.
Variable (Units)Reference Case ConditionsOpen-Loop
(Variable Inlet H2S Concentration)
Open-Loop
(Variable EBRT)
[H2S] (ppmv)20002000 to 10,0002000
H2S LR (g S-H2S m−3 h−1)56.356.3 to 281.5556.3 to 281.55
Qbiogas (L h−1)61.561.561.5 to 307.5
Qair (L h−1)24.1524.1524.15
O2/H2S (% v/v)42.242.2 to 8.442.2 to 14.10
TLV (m h−1)5.95.95.9
EBRT(s)118118118 to 48.4
Table 3. Summary of Closed-Loop scenarios and control strategies studied.
Closed-Loop ScenarioControlled VariableManipulated VariableDisturbancesController TypeParameterRange
Air flowrate regulation C g , O 2 , out Q air C g , H 2 S , in PKc0.05–0.2
PIKc0.05–0.2
τI1–5
TLV regulation C g , H 2 S , out TLV C g , H 2 S , in
&
Q biogas
PKc1–1000
PIKc1–1000
τI0.1–10
Table 4. Nash-Sutcliffe model efficiency (NSE) for the Onda and Billet and Schultes Correlations.
CorrelationNSE RE NSE g SO 4 2 g S-H2Sin−1NSE g S 0 g S-H2Sin−1
Onda’s−7.650.260.70
Billet and Schultes0.260.850.95
Table 5. Integral of the absolute value of the error (IAE) criteria results for the air flow regulation closed-loop (AFR-CL). In AFR-CL, an O2 outlet concentration SP of 5.7% (v/v) was established to calculate the error. Values in bold represent the selected parameters while values shaded in gray provided an oscillatory response of the final control element.
Closed-Loop ScenarioDisturbance Kc0.050.0740.10.120.150.2
τI
AFR-CL C g , H 2 S , in -60.20-43.91419071748
13.270.245.95---
2.51.890.640.49---
50.931.311747---
Table 6. IAE criteria result for the trickling liquid velocity (TLV)-CL when H2S inlet concentration is the disturbance of the system. Values in bold represent the selected parameters and values shaded in gray provided an oscillatory response of the final control element.
Closed-Loop ScenarioDisturbance Kc173.75110.63147.5200300368.755001000
τI
TLV regulation C g , H 2 S , in -7.268-3.333-2.21291.808-1.9271.8018
0.1-2.1012.1012.0982.0832.0882.0782.083-
1-2.1062.1032.1022.1102.0922.1202.088-
10-2.1212.122.1182.1392.1372.1342.133-
Table 7. IAE criteria result for the TLV-CL when biogas flowrate is the disturbance of the system. Biogas flowrate was step-wise changed corresponding to an Empty Bed Residence Time (EBRT) decrease from 118 s to 48.4 s. Values in bold represent the selected parameters and values shaded in gray provided an oscillatory response of the final control element.
Closed-Loop ScenarioDisturbance Kc173.75110.63147.52003003695001000
τI
TLV regulationQbiogas-17.798.316-7.117.7017.0547.7357.732-
0.1-7.7367.7247.7147.7037.7057.703--
1-7.7577.7437.3407.7247.7187.724--
10-8.1347.7548.1128.1018.0958.101--
Table 8. Improvement on the main process performance variables for AFR-CL and TLV-CL facing H2S inlet concentration changes using P and PI controllers.
Cg,in H2S
(ppmv)
Control Type and ParametersManipulated
Variable
ChangeChangeChangeChange
S- SO 4 2 producedS-S0producedg H2S Outletg O2 Consumed
(%)(%)(%)(%)
4000P
Kc = 0.1
AFR0.44.51.60.3
60001.73.814.12.1
4000PI
Kc = 0.074
τI = 1
AFR0.56.22.50.4
60003.18.523.73.0
6000P
Kc = 300
TLV17.591.075.69.0
6000PI
Kc = 147
τI = 1
TLV14.970.771.98.7
Table 9. Improvement on the main process performance variables for TLV control strategy facing biogas flowrate changes using a using a P and PI feedback controllers.
FbiogasControl Type andManipulated
Variable
ImprovementReductionReductionImprovement
S- SO 4 2 producedS-S0producedg H2S Outletg O2 Consumed
(L h−1)Parameters (%)(%)(%)(%)
123P
Kc = 300
TLV22.4085.6053.007.30
123PI
Kc = 110
τI = 1
TLV15.2351.5243.226.67
Publisher’s Note: MDPI stays neutral with regard to jurisdictional claims in published maps and institutional affiliations.

