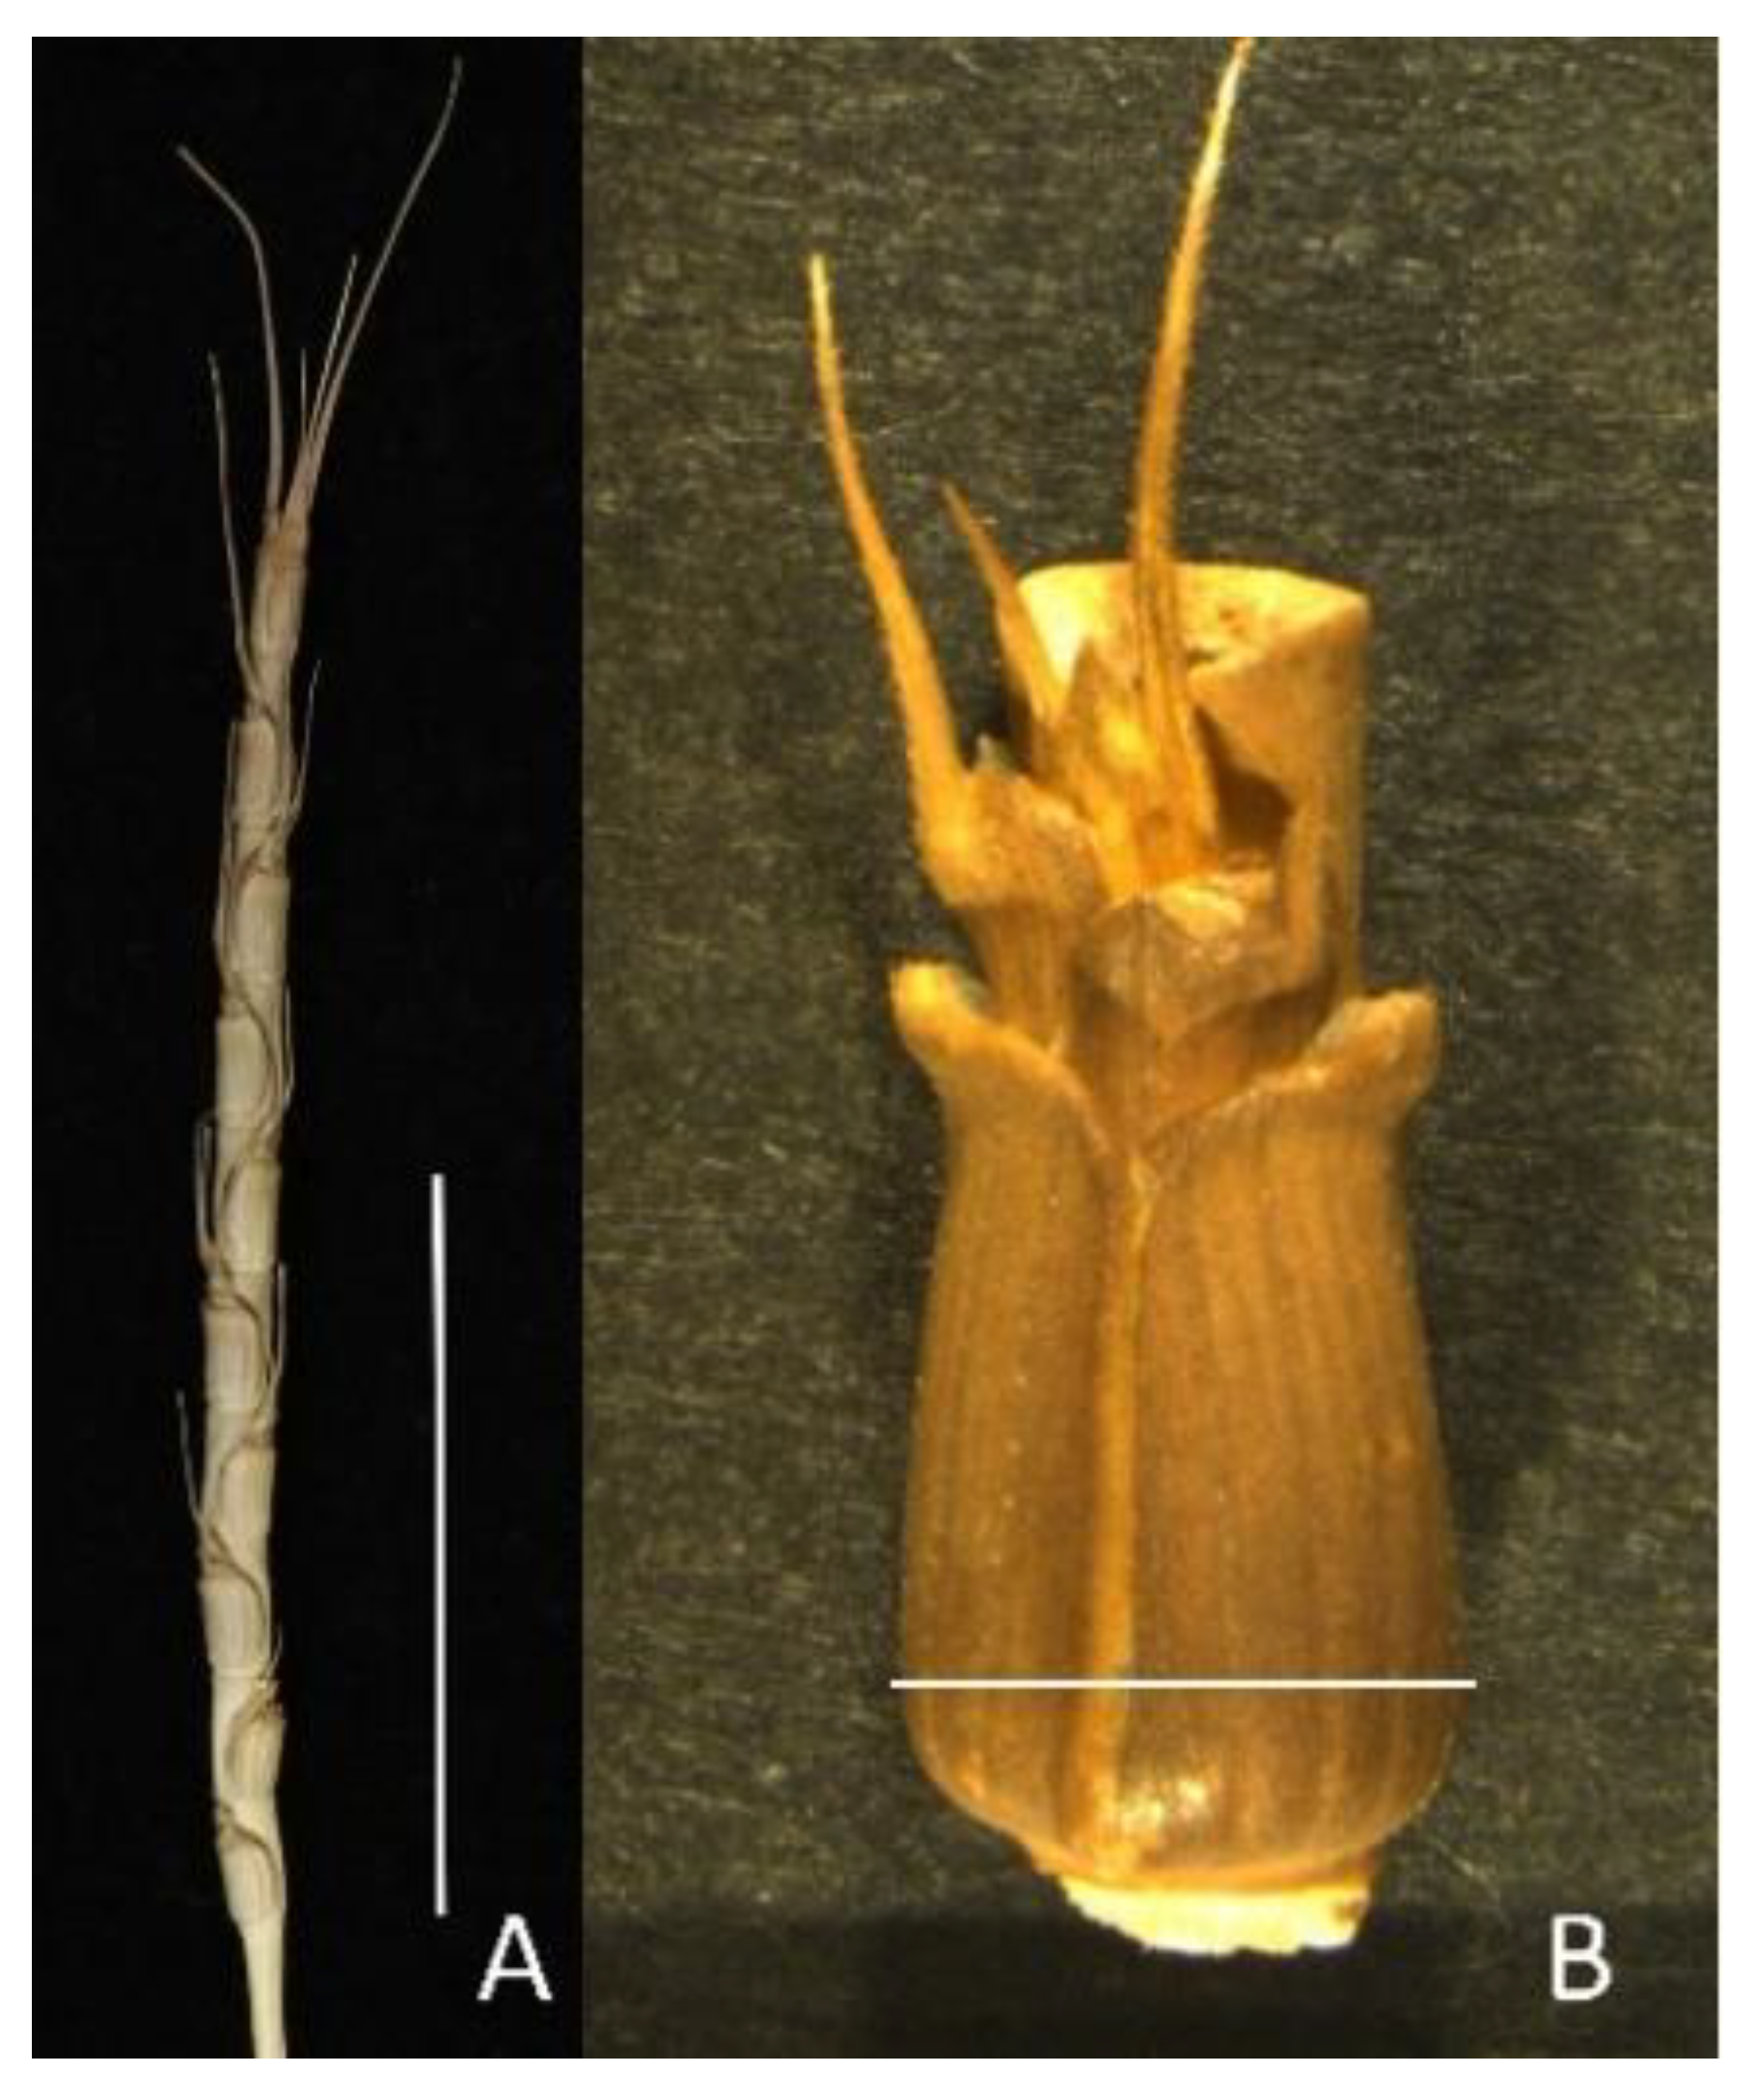
Figure 1.
Methodology of spike measurements in Ae. tauschii. (A) Spike length was measured from the base of the lowest spikelet to the top of the highest spikelet. (B) Spike width was measured from the widest part of the spikelet.
Figure 1.
Methodology of spike measurements in Ae. tauschii. (A) Spike length was measured from the base of the lowest spikelet to the top of the highest spikelet. (B) Spike width was measured from the widest part of the spikelet.
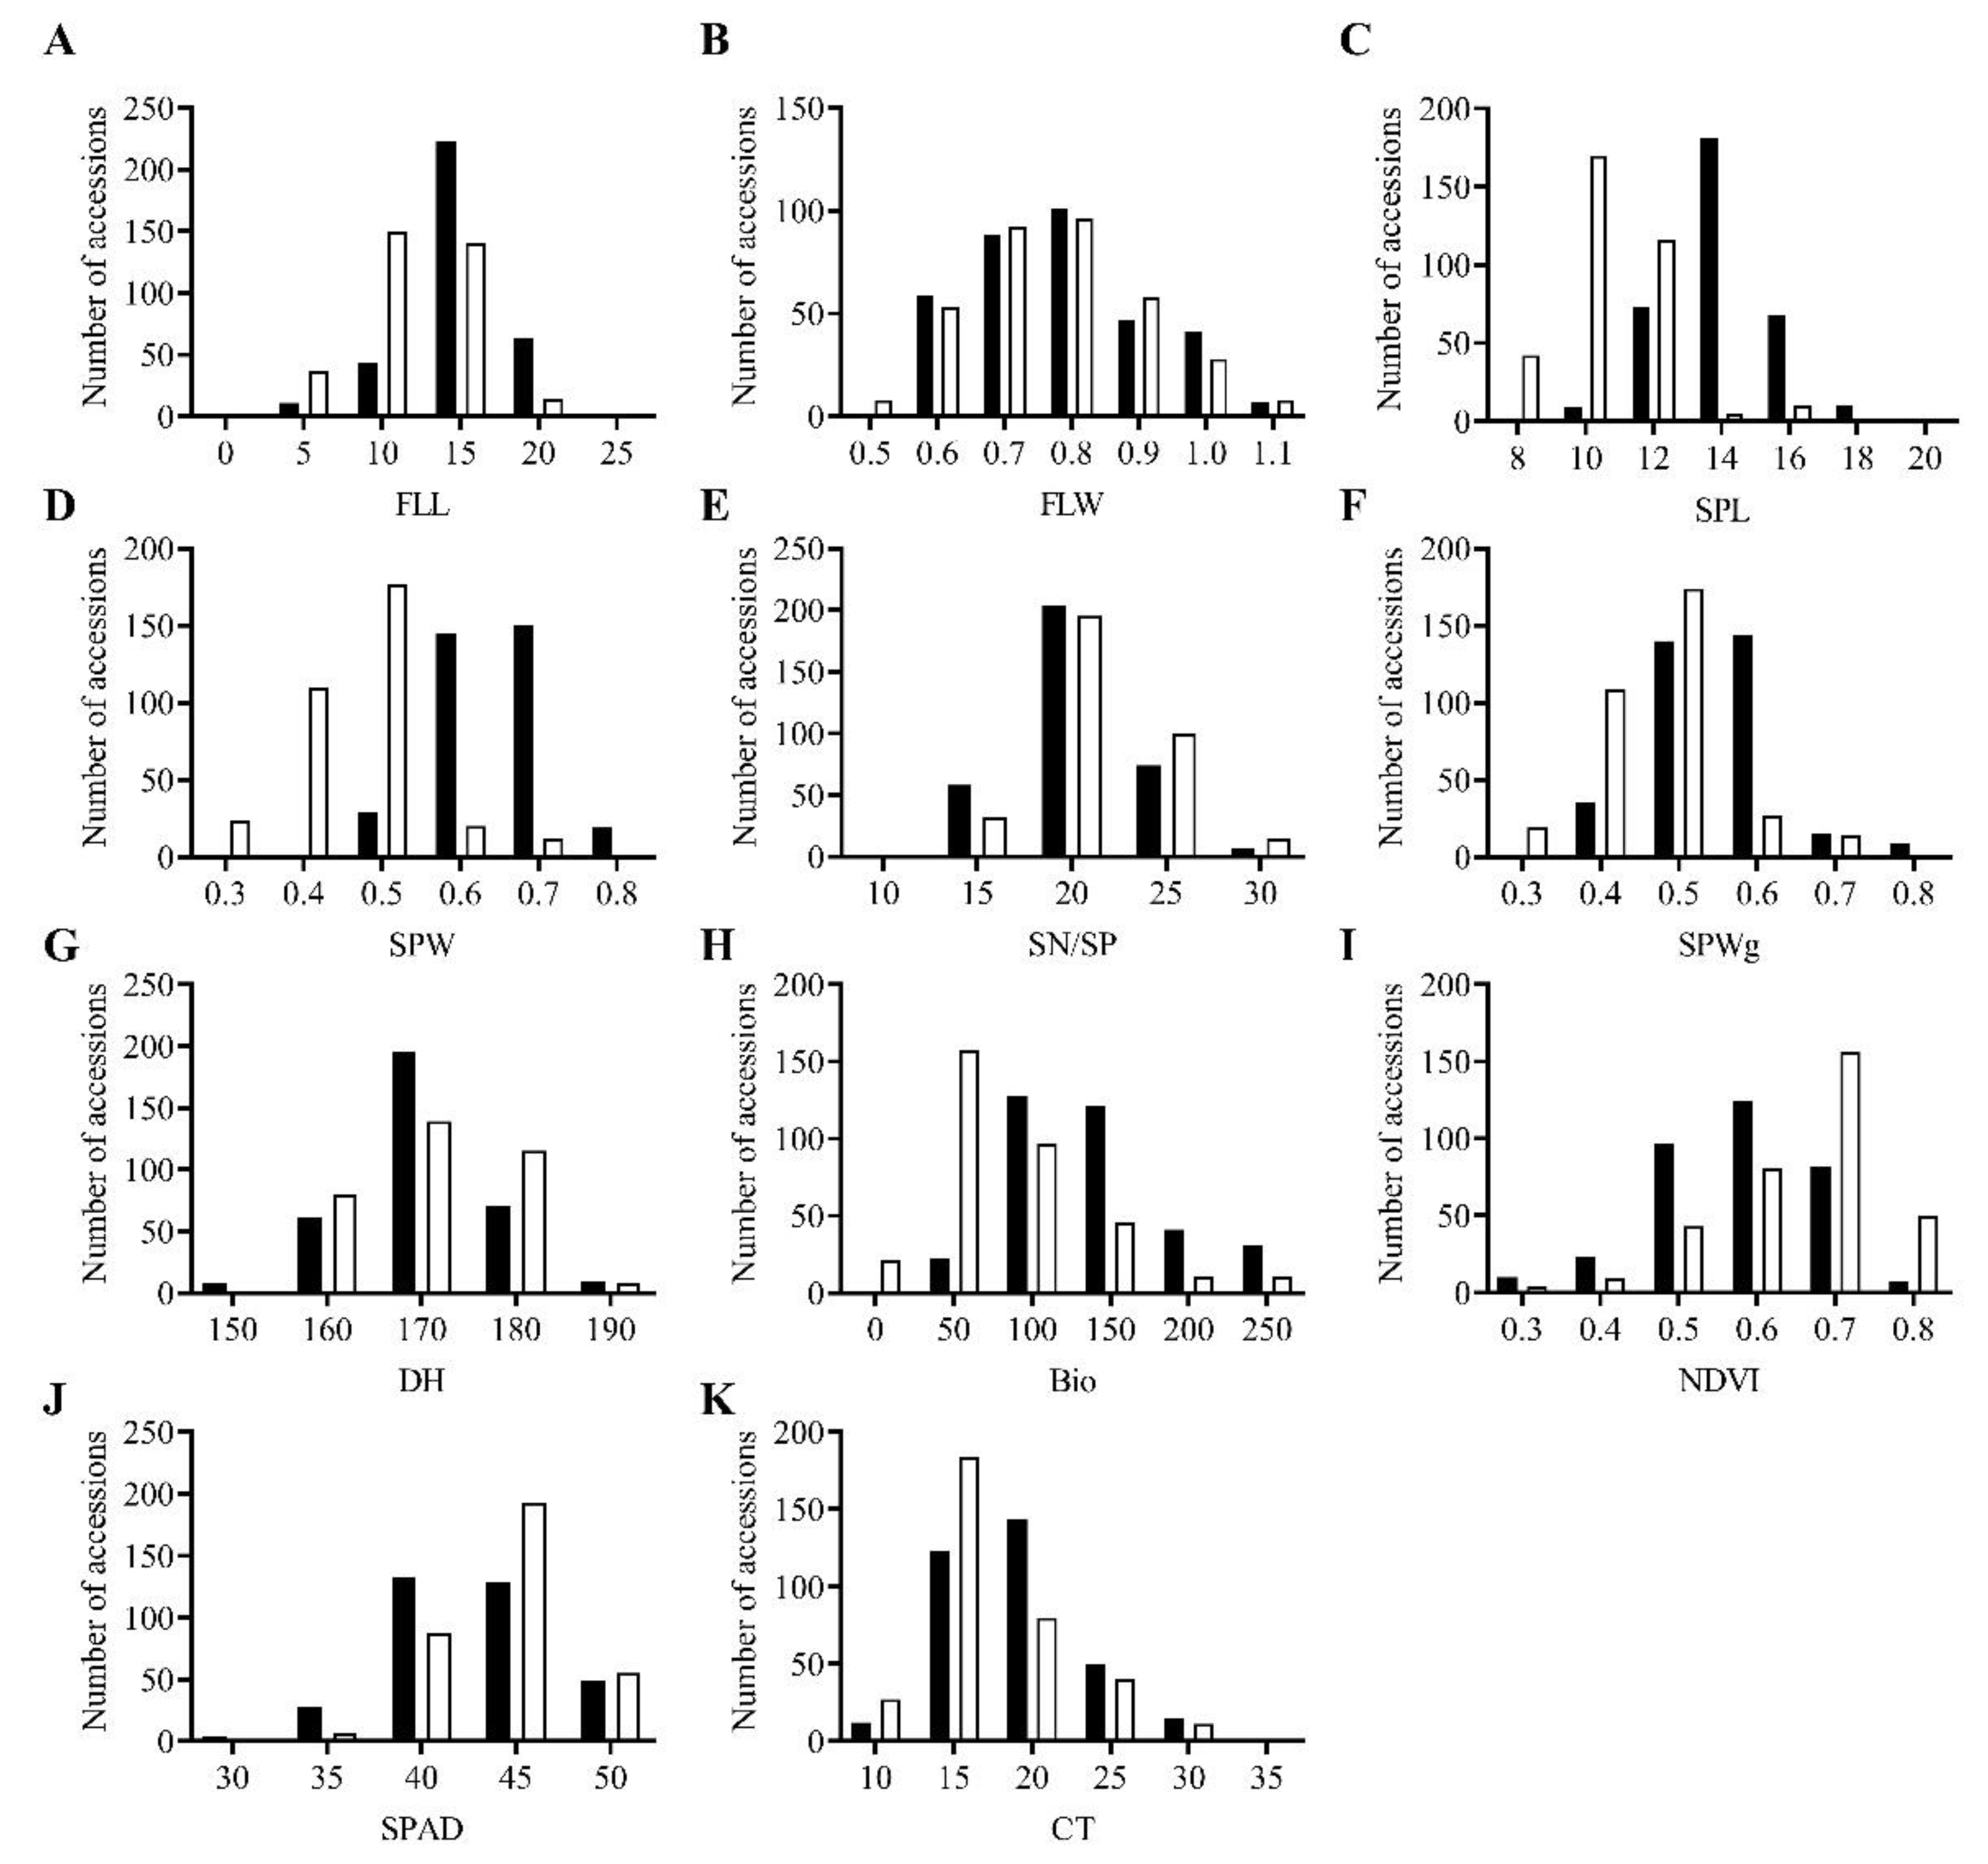
Figure 2.
Morpho-physiological variation in Aegilops tauschii accessions in ■ season 1 and □ season 2. (A) FLL, flag leaf length; (B) FLW, flag leaf width; (C) SPL, spike length; (D) SPW, spike width; (E) SN/SP, seed number per spike; (F) SPWg, spike weight; (G) DH, days to heading; (H) Bio, biomass weight; (I) NDVI, normalized difference vegetative index; (J) SPAD, chlorophyll content; (K) CT, canopy temperature.
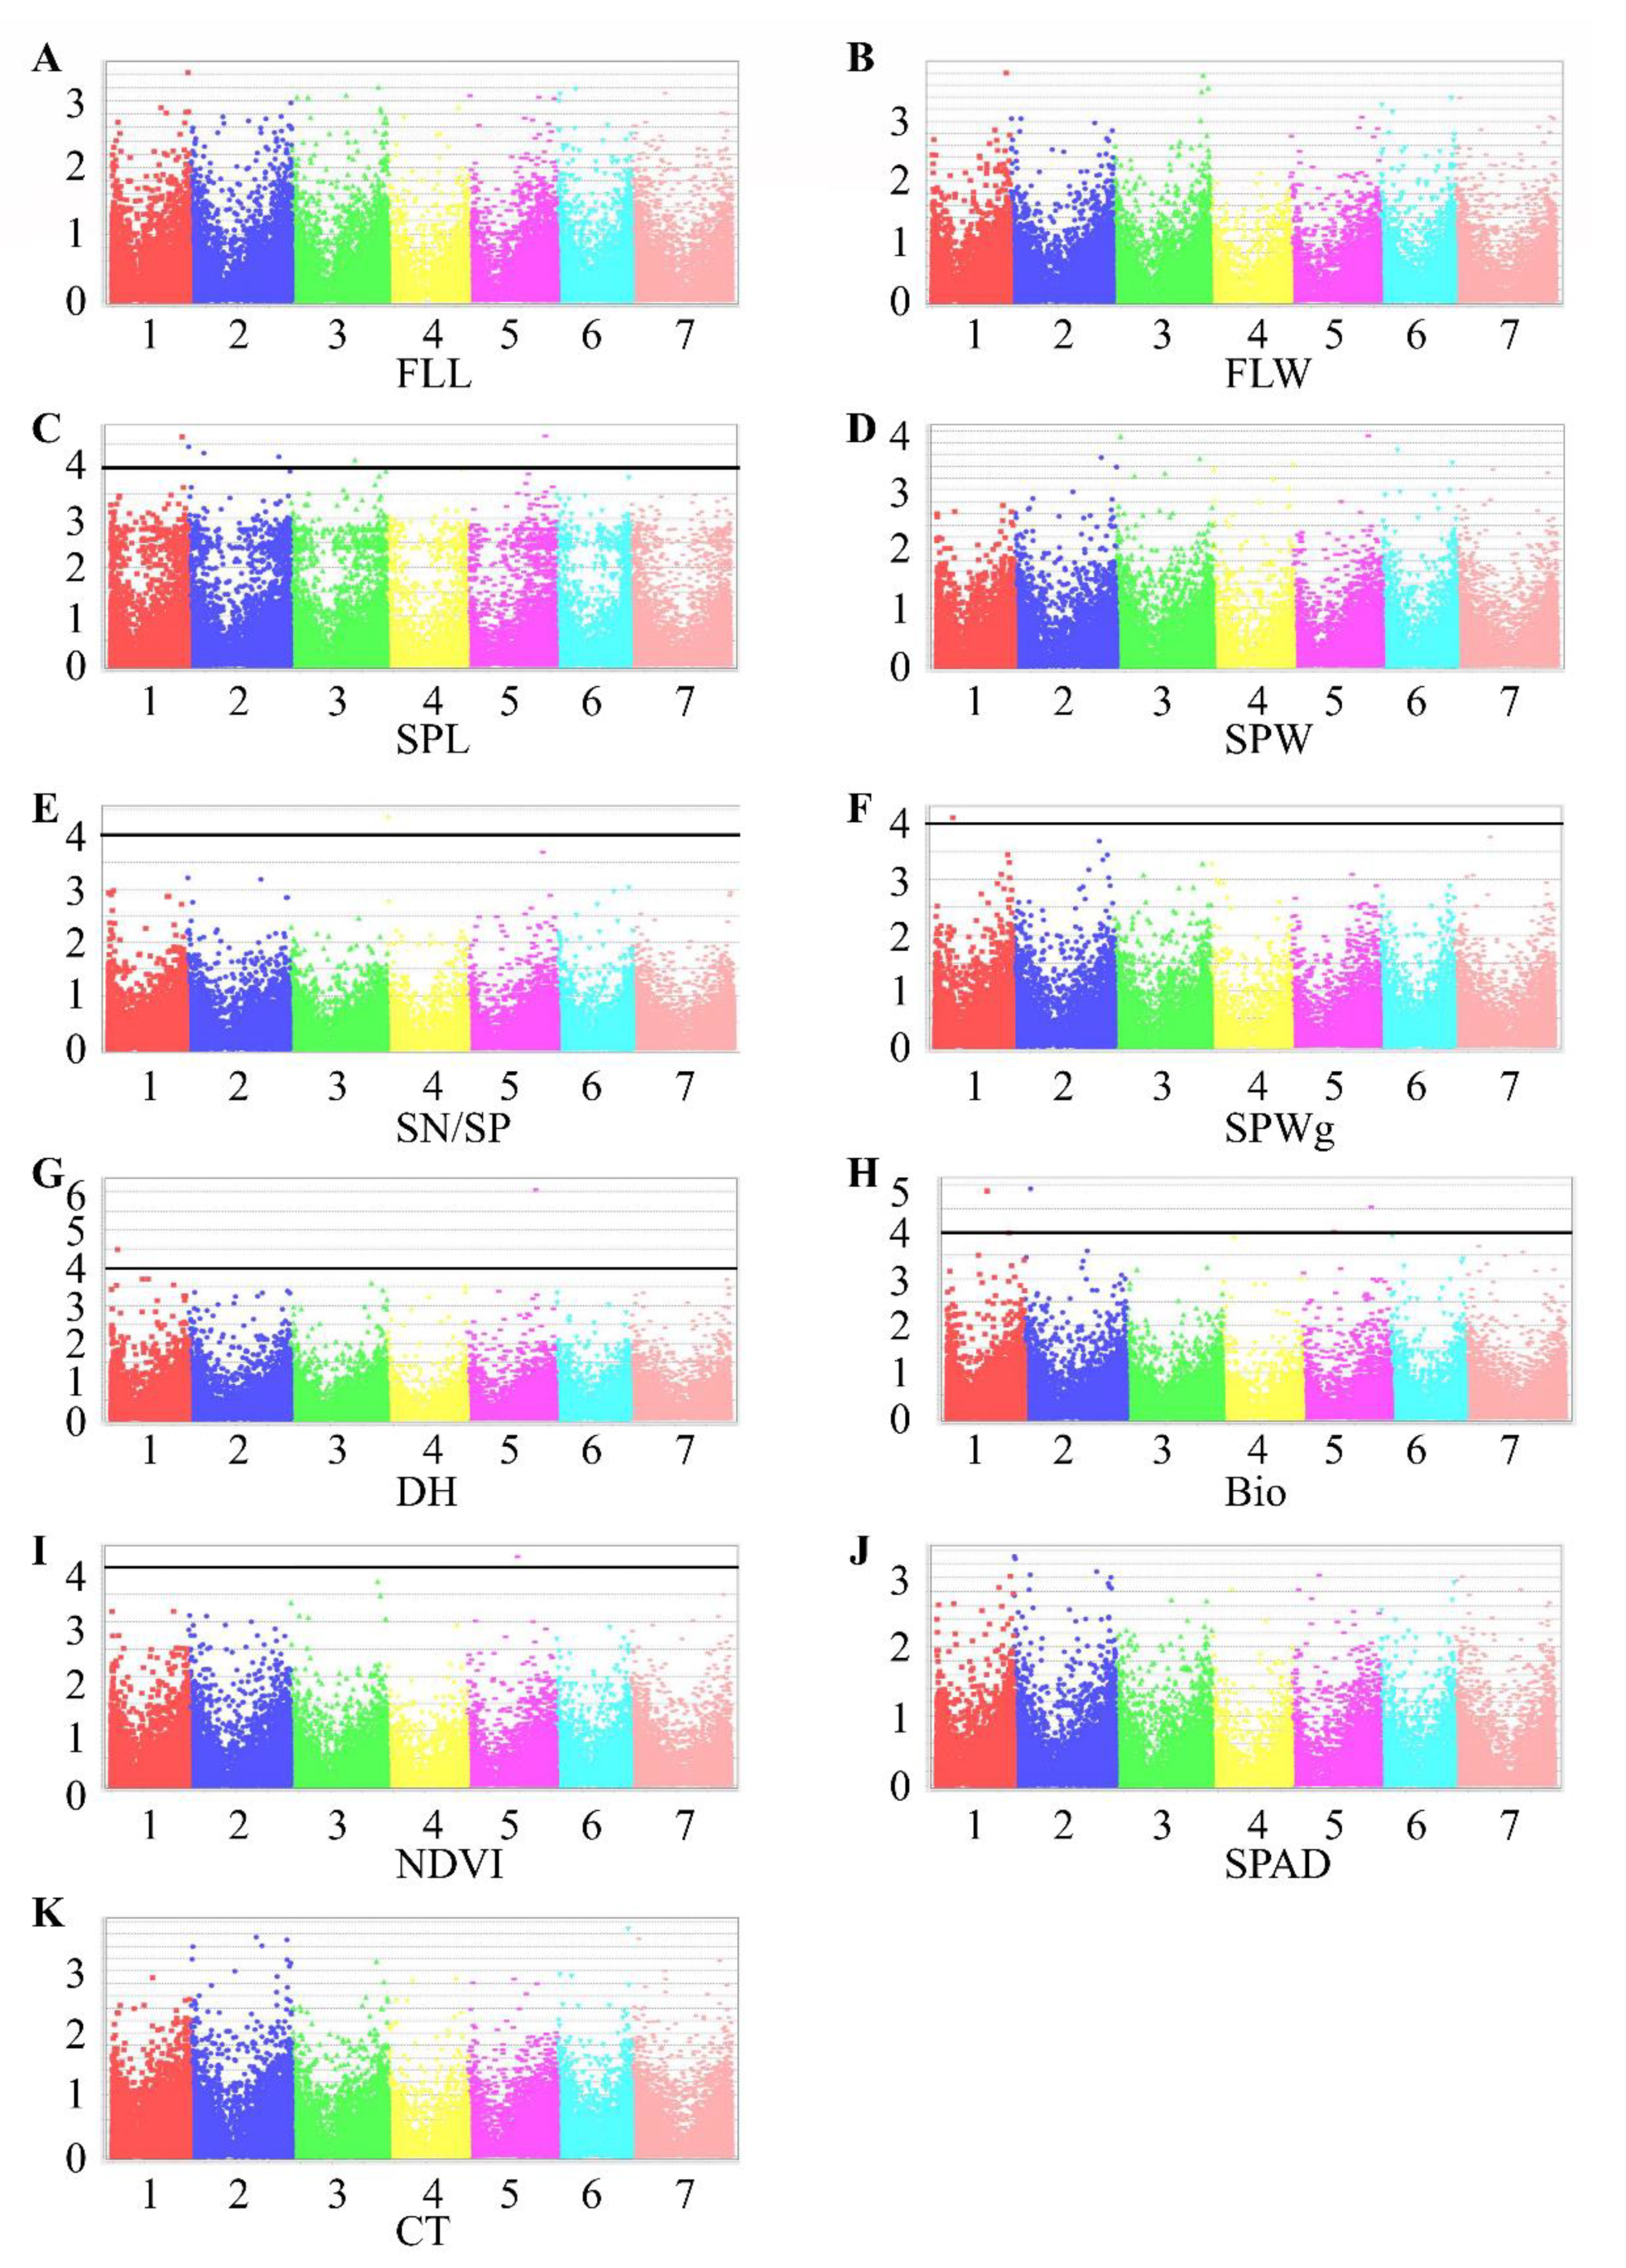
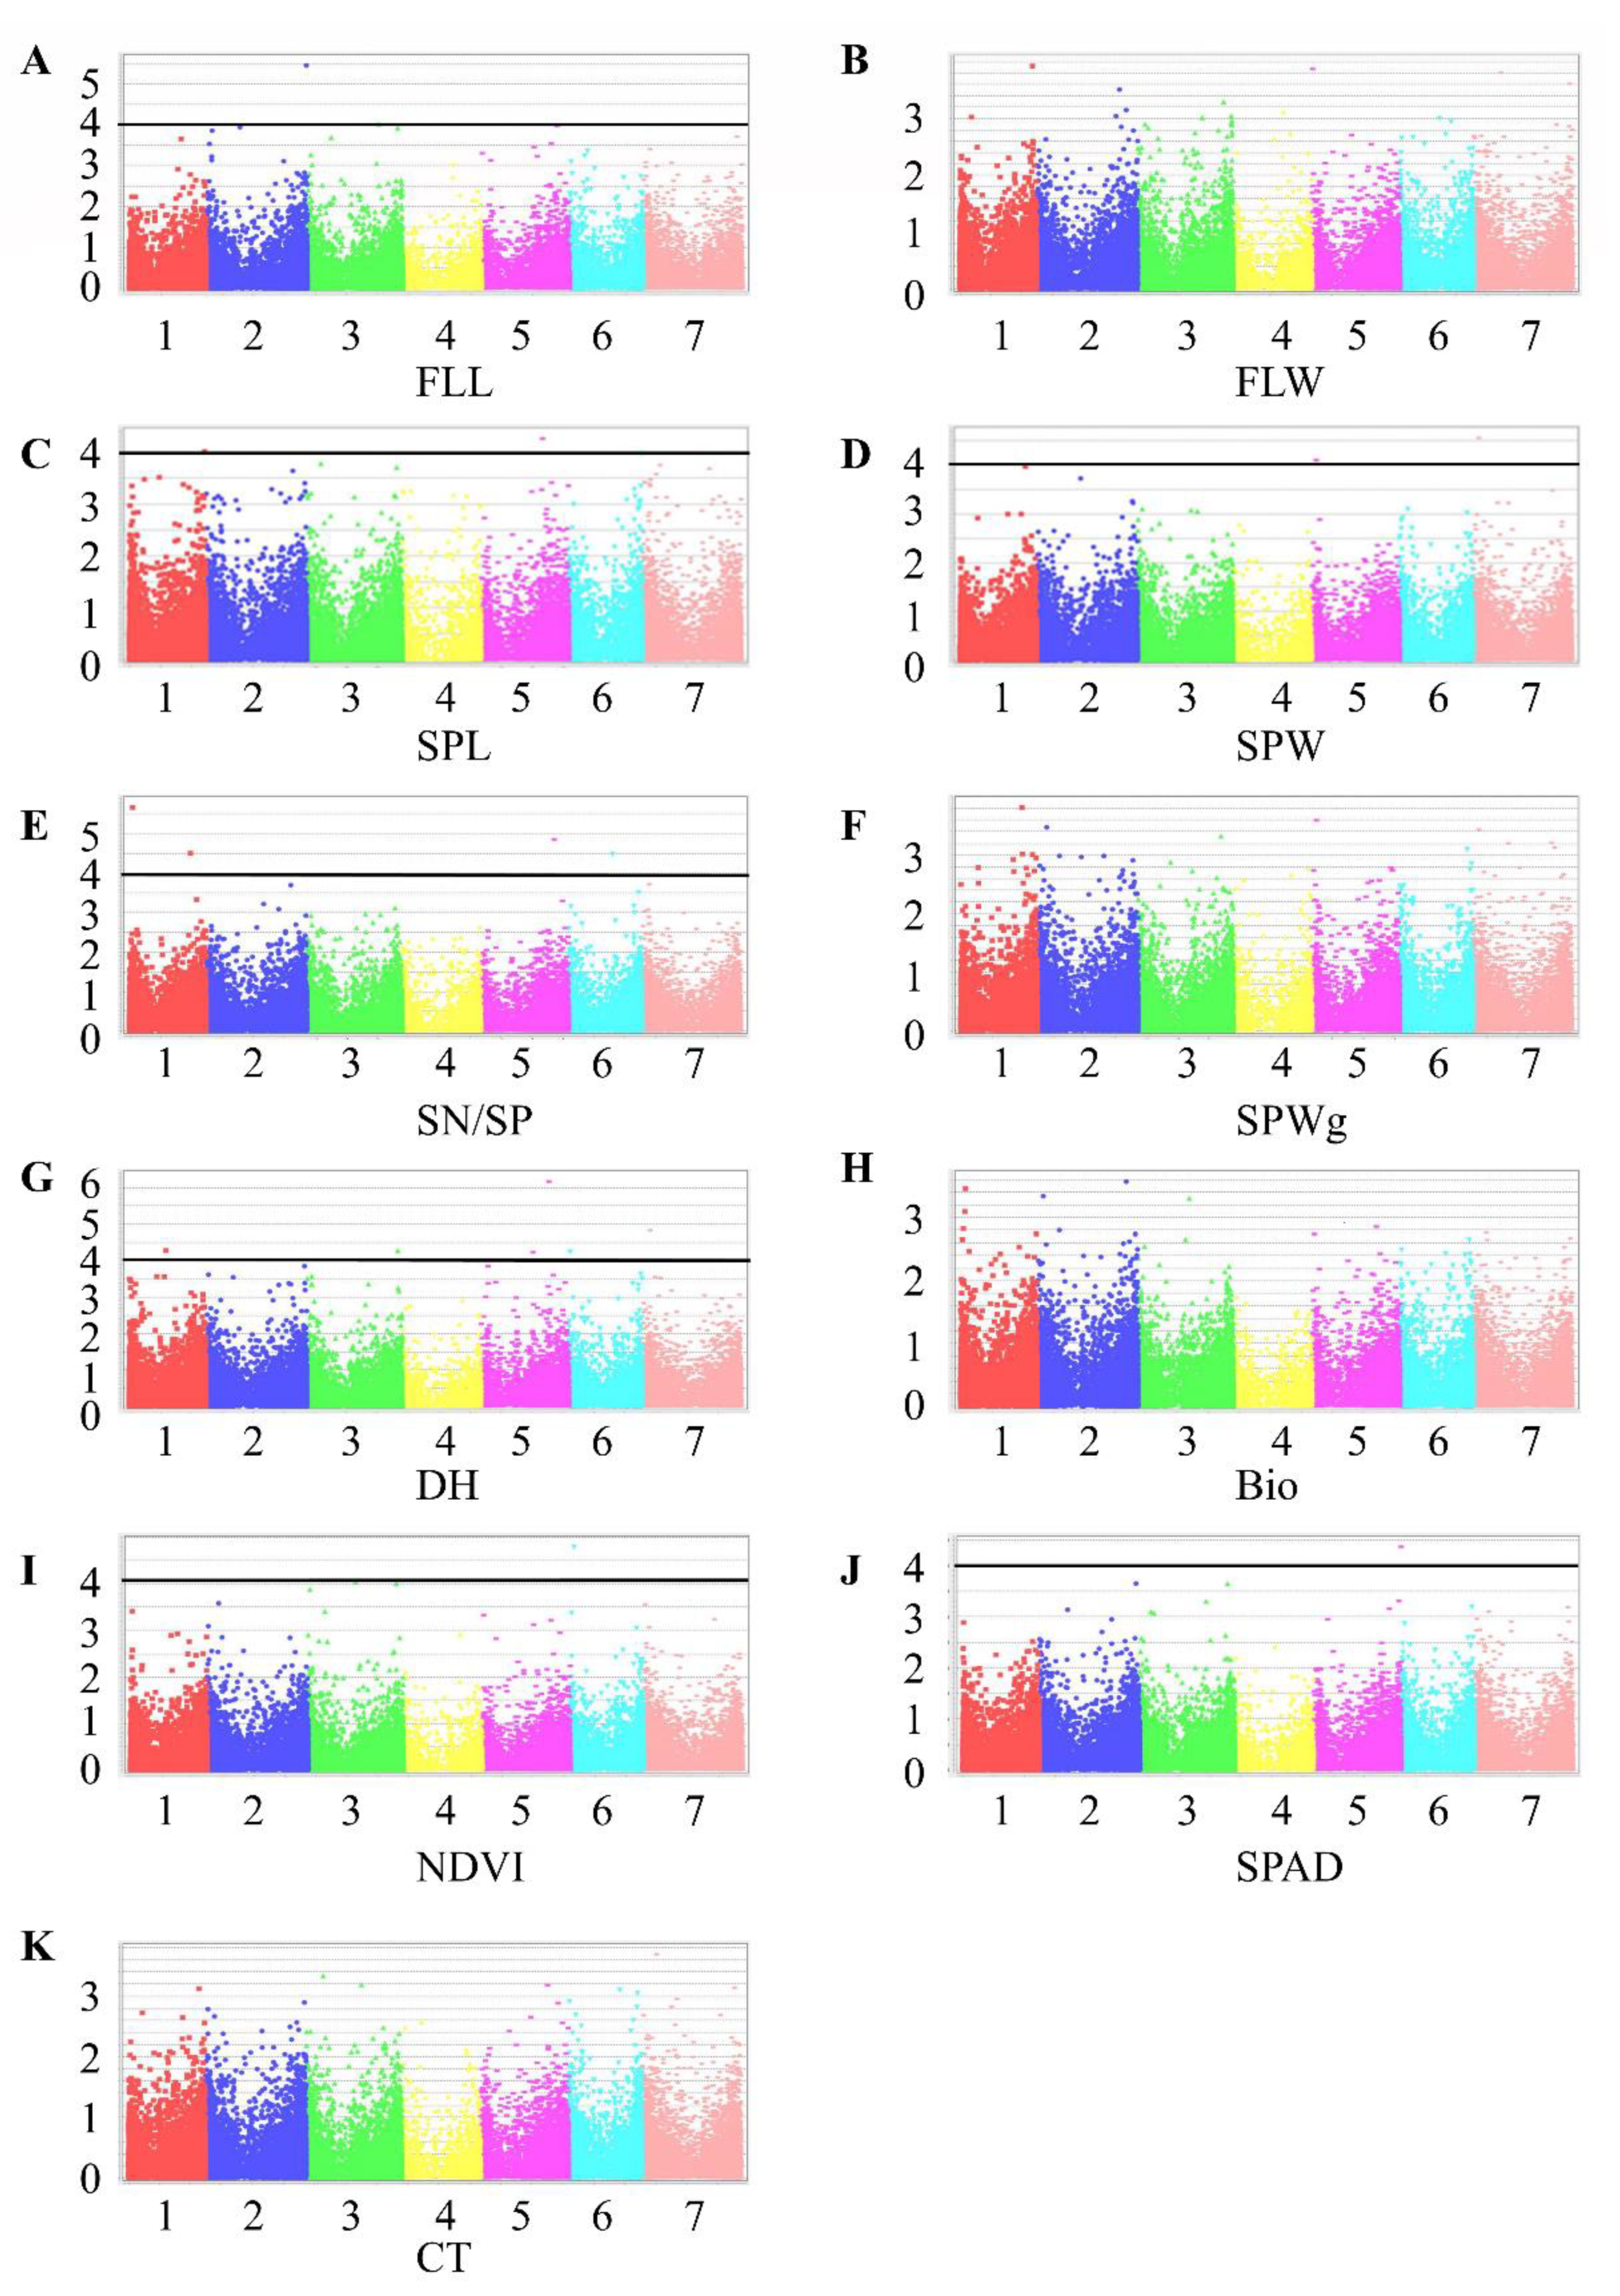
Figure 3.
Manhattan plots representing seven chromosomes carrying significant markers detected by Mixed Linear Model using BLUP values in TauL1. (A) FLL, flag leaf length; (B) FLW, flag leaf width; (C) SPL, spike length; (D) SPW, spike width; (E) SN/SP, seed number per spike; (F) SPWg, spike weight; (G) DH, days to heading; (H) Bio, biomass weight; (I) NDVI, normalized difference vegetative index; (J) SPAD, chlorophyll content; (K) CT, canopy temperature. Genomic coordinates are displayed along the X-axis, with the negative logarithm of the association p-value for each single nucleotide polymorphism (SNP) displayed on the Y-axis, meaning that each dot on the Manhattan plot signifies a SNP. Black rules indicate the significance threshold.
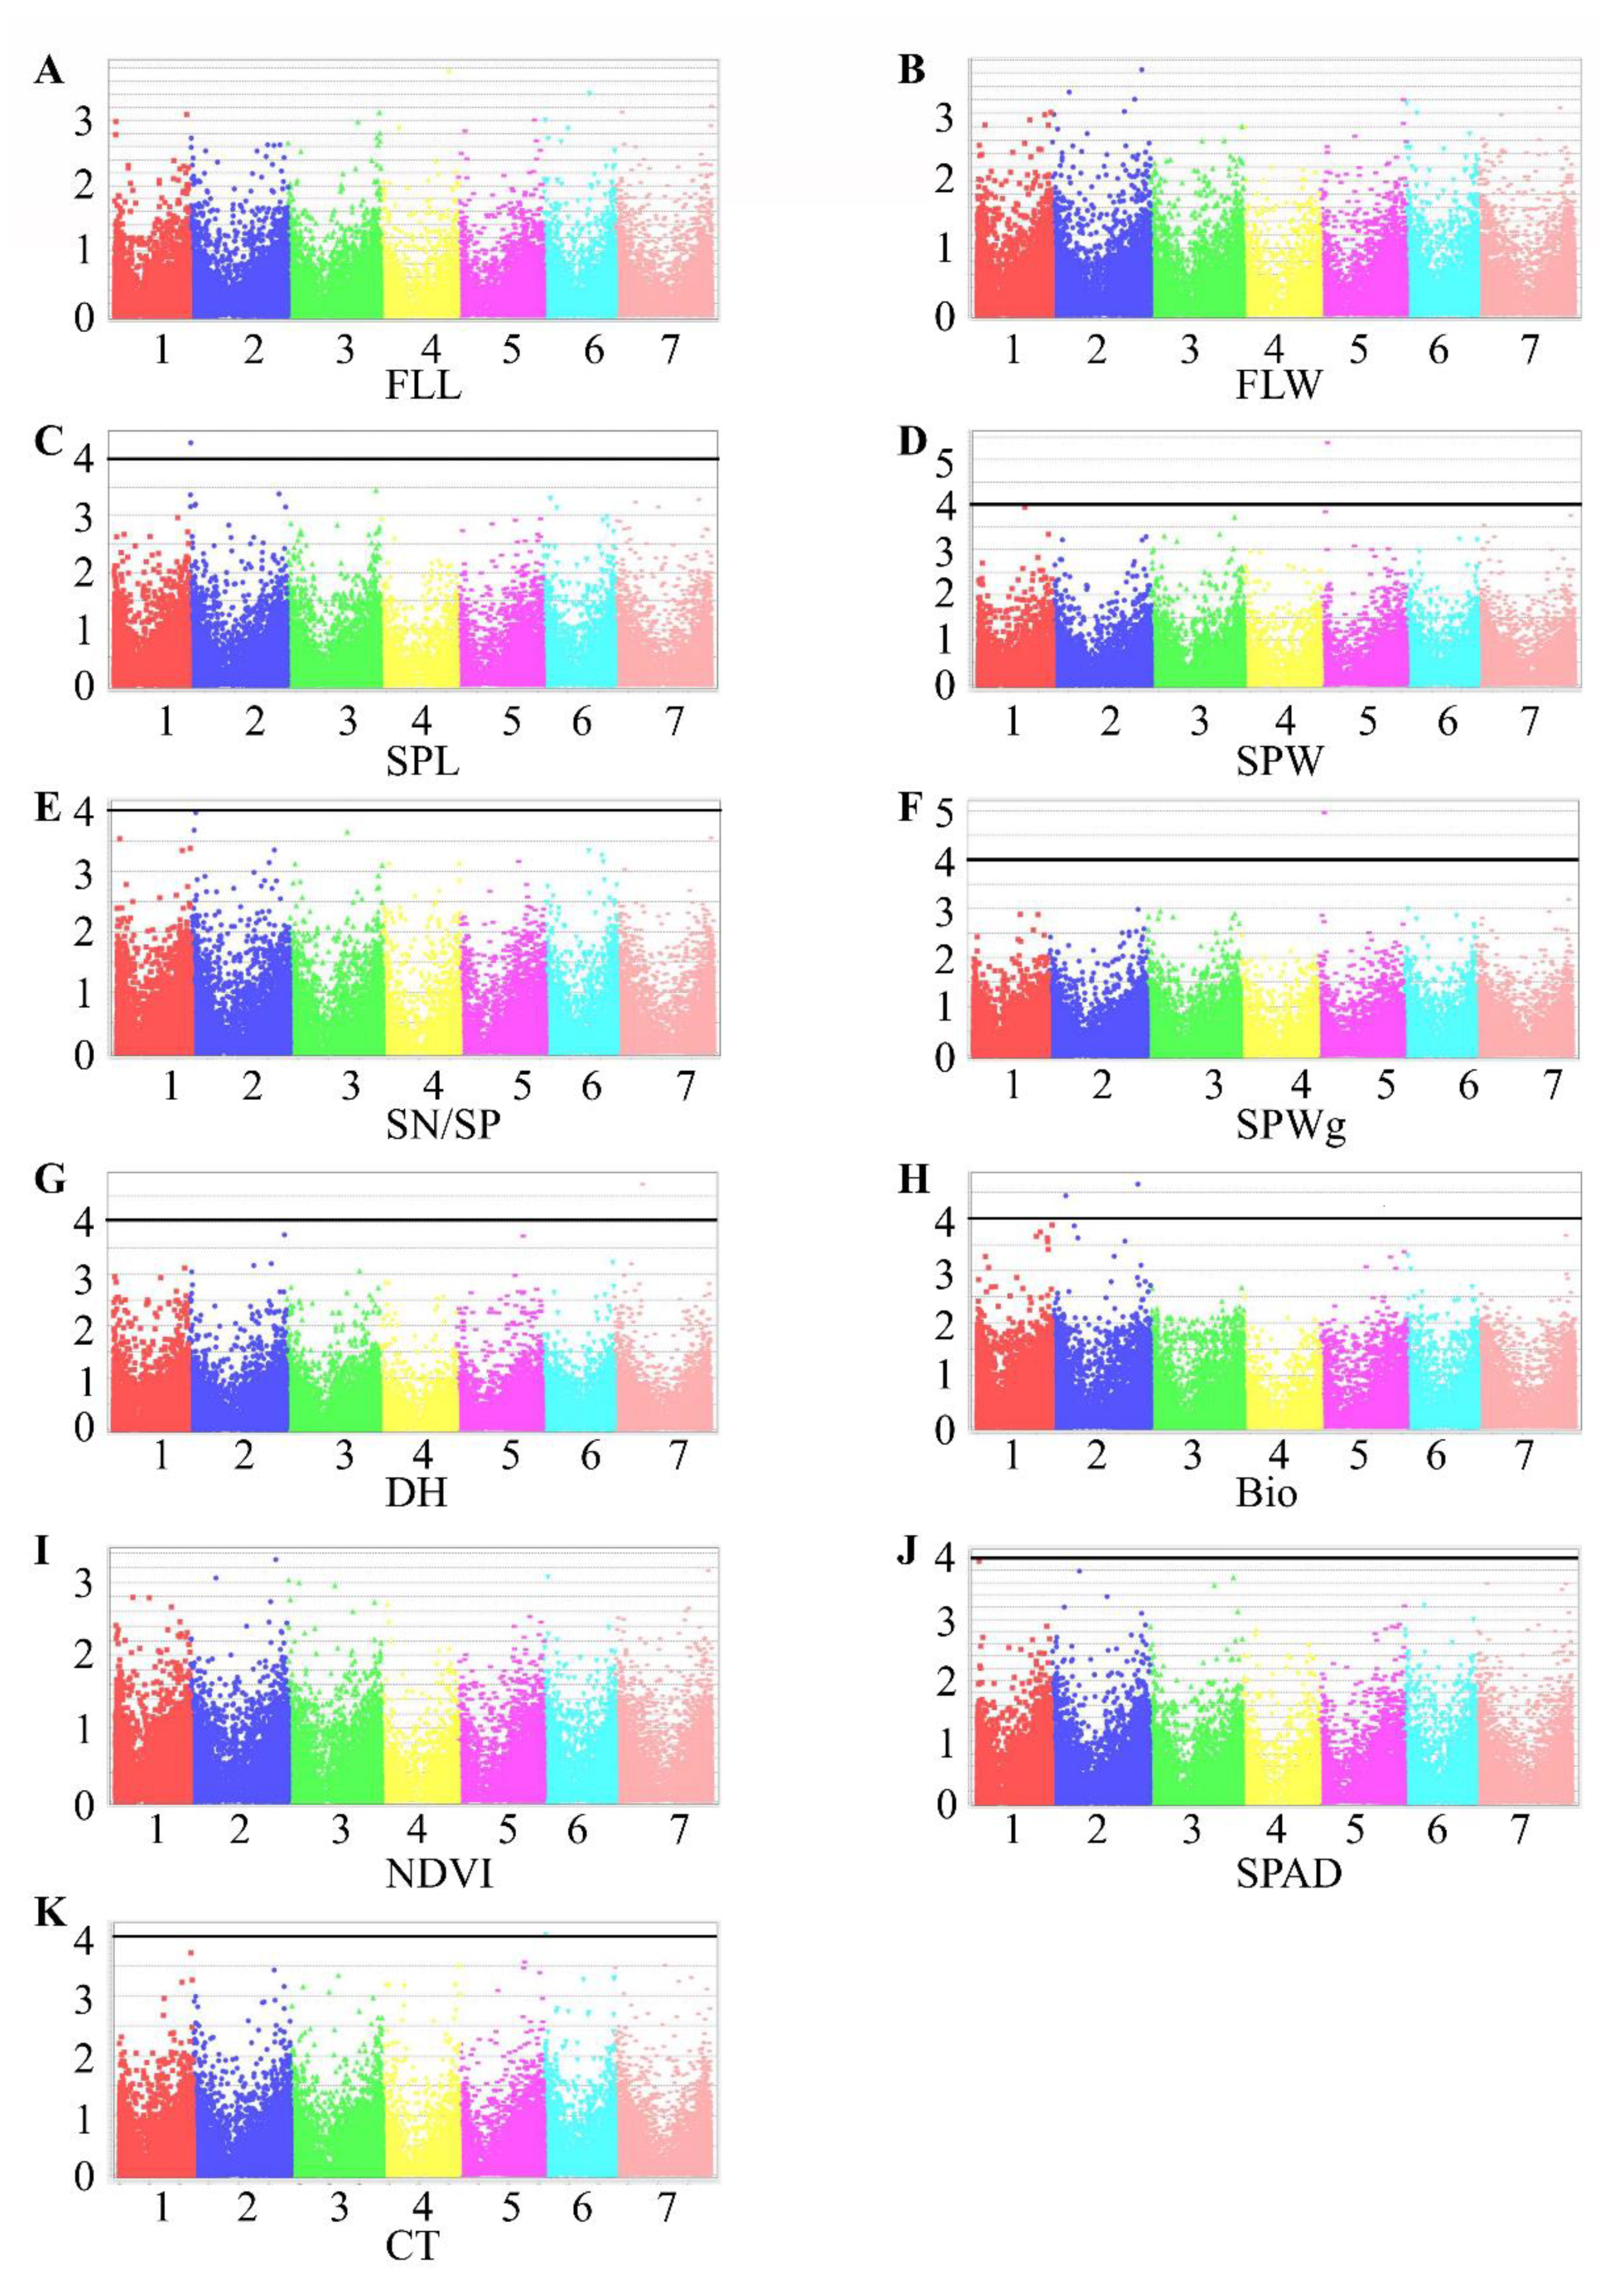
Figure 4.
Manhattan plots representing seven chromosomes carrying significant markers detected by Mixed Linear Model using BLUP values in TauL2. (A) FLL, flag leaf length; (B) FLW, flag leaf width; (C) SPL, spike length; (D) SPW, spike width; (E) SN/SP, seed number per spike; (F) SPWg, spike weight; (G) DH, days to heading; (H) Bio, biomass weight; (I) NDVI, normalized difference vegetative index; (J) SPAD, chlorophyll content; (K) CT, canopy temperature. Genomic coordinates are displayed along the X-axis, with the negative logarithm of the association p-value for each single nucleotide polymorphism (SNP) displayed on the Y-axis, meaning that each dot on the Manhattan plot signifies a SNP. Black rules indicate the significance threshold.
Figure 5.
Manhattan plots representing seven chromosomes carrying the significant markers detected by Mixed Linear Model using BLUP values in all accessions. (A) FLL, flag leaf length; (B) FLW, flag leaf width; (C) SPL, spike length; (D) SPW, spike width; (E) SN/SP, seed number per spike; (F) SPWg, spike weight; (G) DH, days to heading; (H) Bio, biomass weight; (I) NDVI, normalized difference vegetative index; (J) SPAD, chlorophyll content; (K) CT, canopy temperature. Genomic coordinates are displayed along the X-axis, with the negative logarithm of the association p-value for each single nucleotide polymorphism (SNP) displayed on the Y-axis, meaning that each dot on the Manhattan plot signifies a SNP. Black rules indicate the significance threshold.
Table 1.
Analysis of variance (ANOVA) of 11 morpho-physiological traits measured in 343 Aegilops tauschii accessions grown under field conditions during seasons 2016–17 (S1) and 2017–18 (S2).
Table 1.
Analysis of variance (ANOVA) of 11 morpho-physiological traits measured in 343 Aegilops tauschii accessions grown under field conditions during seasons 2016–17 (S1) and 2017–18 (S2).
| Trait | Season | Accession Range | Mean | p-Value (G) | p-Value (S) | p-Value (G × S) | SED ± (G) | H2 | CV (%) |
|---|
| FLL (cm) | S1 | 5.11–22.72 | 14.98 | 0.001 | | | 3.3292 | 0.96 | 21.2 |
| S2 | 2.78–21.66 | 11.89 | 0.1394 | | | 3.539 | 27.6 |
| BLUP | 4.29–21.42 | 13.44 | <0.001 | <0.001 | 1 | 1.2933 | | |
| FLW (cm) | S1 | 0.41–1.14 | 0.80 | <0.001 | | | 0.1248 | 0.97 | 17.0 |
| S2 | 0.43–1.12 | 0.79 | <0.001 | | | 0.1259 | 16.3 |
| BLUP | 0.39–1.17 | 0.80 | <0.001 | 0.9996 | 0.9975 | 0.0482 | | |
| SPL (cm) | S1 | 9.89–18.70 | 13.94 | <0.001 | | | 1.021 | 0.98 | 10.3 |
| S2 | 6.92–17.03 | 10.66 | <0.001 | | | 1.0216 | 15.4 |
| BLUP | 8.63 -17.76 | 12.30 | <0.001 | <0.001 | 0.9998 | 0.4564 | | |
| SPW (cm) | S1 | 0.46–0.76 | 0.62 | <0.001 | | | 0.0436 | 0.96 | 10.8 |
| S2 | 0.30–0.74 | 0.48 | <0.001 | | | 0.0386 | 16.5 |
| BLUP | 0.38–0.75 | 0.55 | <0.001 | <0.001 | 0.8922 | 0.028 | | |
| SN/SP | S1 | 11.83–32.89 | 20.42 | 0.0156 | | | 3.128 | 0.89 | 18.3 |
| S2 | 11.29–31.29 | 21.50 | <0.001 | | | 2.3419 | 17.2 |
| BLUP | 13.15–31.83 | 20.95 | <0.001 | <0.001 | 0.7002 | 2.0166 | | |
| SPWg | S1 | 0.30–0.77 | 0.56 | 0.1799 | | | 0.1075 | 0.90 | 15.2 |
| S2 | 0.29–0.74 | 0.47 | 0.0225 | | | 0.0849 | 17.5 |
| BLUP | 0.27–0.76 | 0.52 | <0.001 | <0.001 | 0.9998 | 0.0496 | | |
| DH | S1 | 134–194 | 170.99 | <0.001 | | | 1.4354 | 0.86 | 4.6 |
| S2 | 132–196 | 171.76 | <0.001 | | | 2.6035 | 4.4 |
| BLUP | 147–195 | 171.39 | <0.001 | 0.1052 | <0.001 | 3.89 | | |
| Bio | S1 | 50.30–260.90 | 140.34 | <0.001 | | | 4.862 | 0.78 | 35.5 |
| S2 | 50.30–260.40 | 86.35 | <0.001 | | | 2.1117 | 57.9 |
| BLUP | 42.53–260.59 | 113.51 | <0.001 | <0.001 | <0.001 | 31.766 | | |
| NDVI | S1 | 0.30–0.79 | 0.58 | <0.001 | | | 0.0503 | 0.13 | 17.7 |
| S2 | 0.28–0.82 | 0.66 | <0.001 | | | 0.0087 | 16.8 |
| BLUP | 0.41- 0.78 | 0.62 | 0.1323 | <0.001 | <0.001 | 0.0979 | | |
| SPAD | S1 | 29.10–52.40 | 42.82 | <0.001 | | | 2.3947 | 0.28 | 10.0 |
| S2 | 33.40–52.36 | 44.33 | <0.001 | | | 0.4336 | 7.9 |
| BLUP | 33.10–51.19 | 43.58 | 0.0047 | <0.001 | <0.001 | 3.5841 | | |
| CT (°C) | S1 | 10.62–34.48 | 18.96 | <0.001 | | | 1.2967 | 0.55 | 21.9 |
| S2 | 9.40- 36.90 | 17.52 | <0.001 | | | 0.7403 | 26.5 |
| BLUP | 11.14–31.73 | 18.25 | <0.001 | <0.001 | <0.001 | 3.4195 | | |
Table 2.
Morpho-physiological correlation analysis in TauL1 performed using best linear unbiased predictions (BLUPs) of two consecutive seasons (2016–17 and 2017–18).
Table 2.
Morpho-physiological correlation analysis in TauL1 performed using best linear unbiased predictions (BLUPs) of two consecutive seasons (2016–17 and 2017–18).
| Trait | FLL | FLW | SPL | SPW | SN/SP | SPWg | DH | Bio | NDVI | SPAD | CT |
|---|
| FLL | | 0.530 ** | 0.264 ** | 0.086 | 0.178* | 0.174 * | −0.170 * | 0.026 | 0.151 * | −0.085 | −0.035 |
| | | 0.000 | 0.000 | 0.250 | 0.016 | 0.019 | 0.022 | 0.730 | 0.042 | 0.253 | 0.641 |
| FLW | | | 0.196 ** | 0.241 ** | 0.067 | 0.292 ** | −0.315 ** | −0.088 | 0.092 | −0.029 | −0.043 |
| | | | 0.008 | 0.001 | 0.367 | 0.000 | 0.000 | 0.237 | 0.219 | 0.694 | 0.565 |
| SPL | | | | 0.049 | 0.497 ** | −0.014 | 0.183 * | 0.134 | 0.271 ** | −0.060 | −0.209 ** |
| | | | | 0.510 | 0.000 | 0.851 | 0.014 | 0.071 | 0.000 | 0.417 | 0.005 |
| SPW | | | | | −0.264 ** | 0.781 ** | −0.094 | 0.035 | 0.084 | 0.162 * | −0.057 |
| | | | | | 0.000 | 0.000 | 0.208 | 0.637 | 0.260 | 0.029 | 0.442 |
| SN/SP | | | | | | −0.224 ** | 0.239 ** | 0.065 | 0.170 * | −0.093 | −0.152 * |
| | | | | | | 0.002 | 0.001 | 0.381 | 0.022 | 0.210 | 0.040 |
| SPWg | | | | | | | −0.177 * | −0.007 | 0.093 | 0.213 ** | 0.011 |
| | | | | | | | 0.017 | 0.930 | 0.210 | 0.004 | 0.882 |
| DH | | | | | | | | 0.631 ** | 0.240** | 0.068 | −0.286 ** |
| | | | | | | | | 0.000 | 0.001 | 0.364 | 0.000 |
| Bio | | | | | | | | | 0.460 ** | 0.085 | −0.427 ** |
| | | | | | | | | | 0.000 | 0.256 | 0.000 |
| NDVI | | | | | | | | | | −0.050 | −0.439 ** |
| | | | | | | | | | | 0.501 | 0.000 |
| SPAD | | | | | | | | | | | −0.022 |
| | | | | | | | | | | | 0.772 |
Table 3.
Morpho-physiological correlation analysis in TauL2 performed using best linear unbiased predictions (BLUPs) of two consecutive seasons (2016–17 and 2017–18).
Table 3.
Morpho-physiological correlation analysis in TauL2 performed using best linear unbiased predictions (BLUPs) of two consecutive seasons (2016–17 and 2017–18).
| Trait | FLL | FLW | SPL | SPW | SN/SP | SPWg | DH | Bio | NDVI | SPAD | CT |
|---|
| FLL | | 0.433 ** | 0.254 ** | 0.085 | 0.162 * | 0.124 | 0.005 | 0.181 * | 0.256 ** | −0.091 | −0.084 |
| | 0.000 | 0.001 | 0.292 | 0.044 | 0.124 | 0.950 | 0.024 | 0.001 | 0.257 | 0.295 |
| FLW | | | 0.062 | 0.308 ** | −0.071 | 0.245 ** | −0.334 ** | −0.097 | 0.053 | 0.128 | −0.108 |
| | | 0.442 | 0.000 | 0.381 | 0.002 | 0.000 | 0.226 | 0.507 | 0.110 | 0.181 |
| SPL | | | | −0.051 | 0.564 ** | −0.108 | 0.137 | 0.151 | 0.180 * | 0.052 | −0.197 * |
| | | | 0.525 | 0.000 | 0.181 | 0.088 | 0.060 | 0.025 | 0.515 | 0.014 |
| SPW | | | | | −0.285 ** | 0.907 ** | −0.161 * | 0.101 | 0.228 ** | 0.019 | −0.096 |
| | | | | 0.000 | 0.000 | 0.044 | 0.208 | 0.004 | 0.818 | 0.231 |
| SN/SP | | | | | | −0.260 ** | 0.189 * | 0.063 | 0.004 | 0.005 | −0.167 * |
| | | | | | 0.001 | 0.018 | 0.434 | 0.963 | 0.946 | 0.037 |
| SPWg | | | | | | | −0.106 | 0.083 | 0.222 ** | 0.001 | −0.063 |
| | | | | | | 0.186 | 0.303 | 0.005 | 0.990 | 0.432 |
| DH | | | | | | | | 0.574 ** | 0.213 ** | 0.046 | −0.003 |
| | | | | | | | 0.000 | 0.008 | 0.566 | 0.970 |
| Bio | | | | | | | | | 0.457 ** | −0.003 | −0.163 * |
| | | | | | | | | 0.000 | 0.968 | 0.042 |
| NDVI | | | | | | | | | | −0.003 | −0.324 ** |
| | | | | | | | | | 0.974 | 0.000 |
| SPAD | | | | | | | | | | | −0.116 |
| | | | | | | | | | | 0.148 |
Table 4.
Morpho-physiological correlation analysis in Aegilops tauschii performed using best linear unbiased predictions (BLUPs) of two consecutive seasons (2016–17 and 2017–18).
Table 4.
Morpho-physiological correlation analysis in Aegilops tauschii performed using best linear unbiased predictions (BLUPs) of two consecutive seasons (2016–17 and 2017–18).
| Trait | FLL | FLW | SPL | SPW | SN/SP | SPWg | DH | Bio | NDVI | SPAD | CT |
|---|
| FLL | | 0.483 ** | 0.268 ** | 0.088 | 0.176 ** | 0.155 ** | −0.101 | 0.093 | 0.192 ** | −0.092 | −0.047 |
| | 0.000 | 0.000 | 0.105 | 0.001 | 0.004 | 0.061 | 0.085 | 0.000 | 0.088 | 0.390 |
| FLW | | | 0.126 * | 0.269 ** | −0.001 | 0.265 ** | −0.331 ** | −0.088 | 0.083 | 0.047 | −0.074 |
| | | 0.020 | 0.000 | 0.986 | 0.000 | 0.000 | 0.102 | 0.125 | 0.383 | 0.172 |
| SPL | | | | 0.005 | 0.536 ** | −0.050 | 0147 ** | 0.140 ** | 0.219 ** | −0.022 | −0.183 ** |
| | | | 0.933 | 0.000 | 0.352 | 0.006 | 0.009 | 0.000 | 0.683 | 0.001 |
| SPW | | | | | −0.269 ** | 0.843 ** | −0.129 * | 0.066 | 0.148 ** | 0.092 | −0.073 |
| | | | | 0.000 | 0.000 | 0.017 | 0.223 | 0.006 | 0.088 | 0.179 |
| SN/SP | | | | | | −0.236 ** | 0.206 ** | 0.065 | 0.090 | −0.055 | −0.149 ** |
| | | | | | 0.000 | 0.000 | 0.232 | 0.097 | 0.313 | 0.006 |
| SPWg | | | | | | | −0.144 ** | 0.037 | 0.152 ** | 0.107 * | −0.022 |
| | | | | | | 0.007 | 0.489 | 0.005 | 0.048 | 0.680 |
| DH | | | | | | | | 0.594 ** | 0.215 ** | 0.054 | −0.156 ** |
| | | | | | | | 0.000 | 0.000 | 0.321 | 0.004 |
| Bio | | | | | | | | | 0.457 ** | 0.042 | −0.304 ** |
| | | | | | | | | 0.000 | 0.435 | 0.000 |
| NDVI | | | | | | | | | | −0.025 | −0.388 ** |
| | | | | | | | | | 0.651 | 0.000 |
| SPAD | | | | | | | | | | | −0.068 |
| | | | | | | | | | | 0.209 |
Table 5.
Marker–trait associations in TauL1 and TauL2 revealed by DArTseq markers.
Table 5.
Marker–trait associations in TauL1 and TauL2 revealed by DArTseq markers.
| Lineage | Trait | Marker | Chromo-Some | Marker (R2) | SNPs | Desirable Effect Alleles | Contribution of 1st Allele | Contribution of 2nd Allele |
|---|
| TauL1 | SPL | 32763608|F|0-15 | 1D | 0.15 | A/G | G | −5E+00 | −5E+00 |
| SPL | 32743501|F|0-5 | 2D | 0.13 | A/G | A | −5E+00 | −5E+00 |
| SPL | 32765113|F|0-56 | 2D | 0.13 | C/G | G | −4E+00 | −4E+00 |
| SPL | 32784018|F|0-39 | 2D | 0.12 | C/T | C | −8E+00 | −5E+00 |
| SPL | 32745140|F|0-54 | 3D | 0.12 | A/G | G | −4E+00 | −6E+00 |
| SPL | 32740085|F|0-47 | 5D | 0.12 | A/G | A | −8E+00 | −5E+00 |
| SN/SP | 32774197|F|0-39 | 4D | 0.14 | A/T | A | 3E+00 | −9E+00 |
| SPWg | 32731844 | 1D | 0.10 | A/C | A | 7E−02 | 0E+00 |
| DH | 32722593 | 1D | 0.13 | A/C | A | 1E+01 | 0E+00 |
| DH | 32782428|F|0-17 | 5D | 0.15 | C/T | C | −2E+01 | 0E+00 |
| Bio | 32750474 | 1D | 0.12 | A/C | A | −6E+01 | 0E+00 |
| Bio | 32755747 | 2D | 0.12 | A/C | A | −5E+01 | 0E+00 |
| Bio | 32782428|F|0-17 | 5D | 0.11 | C/T | C | −1E+02 | 0E+00 |
| Bio | 32732820 | 5D | 0.11 | A/C | A | 5E+01 | 0E+00 |
| NDVI | 32787209|F|0-56 | 5D | 0.12 | A/G | A | 1E−01 | 4E−02 |
| TauL2 | SPL | 32777153 | 2D | 0.14 | A/C | A | 5E+00 | 0E+00 |
| SPW | 32740588 | 5D | 0.17 | A/C | A | 1E−01 | 0E+00 |
| SN/SP | 32746301|F|0-43 | 2D | 0.14 | C/G | G | −6E+00 | −1E+01 |
| SPWg | 32740588 | 5D | 0.16 | A/C | A | 1E−01 | 0E+00 |
| DH | 32764424 | 7D | 0.14 | A/C | A | −1E+01 | 0E+00 |
| Bio | 4291519 | 2D | 0.13 | A/C | A | −5E+01 | 0E+00 |
| SPAD | 32785603 | 1D | 0.13 | A/C | A | 4E+00 | 0E+00 |
| CT | 32786555 | 6D | 0.12 | A/C | A | 3E+00 | 0E+00 |
Table 6.
Marker–trait associations in all accessions combined revealed by DArTseq markers.
Table 6.
Marker–trait associations in all accessions combined revealed by DArTseq markers.
| Lineage | Trait | Marker | Chromo-Some | Marker (R2) | SNPs | Desirable Effect Alleles | Contribution of 1st Allele | Contribution of 2nd Allele |
|---|
| All accessions combined | FLL | 32723781 | 2D | 0.08 | A/C | A | −1E−01 | 0E+00 |
| FLL | 32761831|F|0-30 | 3D | 0.06 | C/T | C | −5E−01 | 3E−02 |
| FLL | 32765433|F|0-21 | 5D | 0.06 | C/T | C | −5E−01 | 8E−03 |
| SPL | 4323996|F|0-42 | 5D | 0.06 | C/T | T | −3E−02 | −6E−02 |
| SPL | 32770344|F|0-19 | 1D | 0.06 | C/T | C | −2E−01 | −1E−01 |
| SPL | 4321487|F|0-67 | 6D | 0.06 | A/C | A | −1E−01 | −1E−01 |
| SPW | 32777197 | 7D | 0.06 | A/C | A | 6E−02 | 0E+00 |
| SPW | 32749969 | 1D | 0.05 | A/C | A | 5E−02 | 0E+00 |
| SPW | 32768546 | 5D | 0.05 | A/C | A | 3E−02 | 0E+00 |
| SN/SP | 32776149 | 1D | 0.07 | A/C | A | −7E−02 | 0E+00 |
| SN/SP | 32787577|F|0-20 | 5D | 0.07 | C/T | T | −9E−03 | −8E−02 |
| SN/SP | 32719260 | 6D | 0.06 | A/C | A | 4E−02 | 0E+00 |
| SN/SP | 32782749 | 1D | 0.06 | A/C | A | 4E−02 | 0E+00 |
| DH | 32782428|F|0-17 | 5D | 0.09 | C/T | C | −2E−02 | 2E−02 |
| DH | 32786608|F|0-9 | 7D | 0.07 | C/G | C | 7E−02 | 6E−02 |
| DH | 32778284 | 5D | 0.05 | A/C | A | 3E−02 | 0E+00 |
| DH | 32728973 | 3D | 0.05 | A/C | A | −5E−02 | 0E+00 |
| DH | 32760744|F|0-62 | 6D | 0.05 | C/T | C | 7E−02 | 7E−02 |
| DH | 32756563 | 1D | 0.05 | A/C | A | 4E−02 | 0E+00 |
| NDVI | 32756802 | 6D | 0.06 | A/C | A | 6E−02 | 0E+00 |
| NDVI | 32780727 | 3D | 0.05 | A/C | A | 5E−02 | 0E+00 |
| NDVI | 32732406 | 3D | 0.05 | A/C | A | 7E−02 | 0E+00 |
| SPAD | 32778541 | 5D | 0.06 | A/C | A | 2E−02 | 0E+00 |
Table 7.
Comparison of MTAs in bread wheat reported previously and those identified in this study in Aegilops tauschii.
Table 7.
Comparison of MTAs in bread wheat reported previously and those identified in this study in Aegilops tauschii.
| Reference | Species | Trait | Chromosome |
|---|
| 1D | 2D | 3D | 4D | 5D | 6D | 7D |
|---|
| Li et al. (2019) | T. aestivum | DH | | | | | | | |
| Ward et al. (2019) | T. aestivum | DH | | x | | | | | x |
| Jami et al. (2019) | T. aestivum | DH | x | | | | x | | x |
| Current study | TauL1 | DH | x | | | | x | | |
| Current study | TauL2 | DH | | | | | | | x |
| Current study | All | DH | x | | x | | x | x | x |
| Li et al. (2019) | T. aestivum | FLL | | | | | | | x |
| Current study | TauL1 | FLL | | | | | | | |
| Current study | TauL2 | FLL | | | | | | | |
| Current study | All | FLL | | x | x | | x | | |
| Li et al. (2019) | T. aestivum | FLW | | | | | | | |
| Current study | TauL1 | FLW | | | | | | | |
| Current study | TauL2 | FLW | | | | | | | |
| Current study | All | FLW | | | | | | | |
| Ward et al. (2019) | T. aestivum | SN/SP | | | | x | | | |
| Current study | TauL1 | SN/SP | | | | x | | | |
| Current study | TauL2 | SN/SP | | x | | | | | |
| Current study | All | SN/SP | x | | | | x | x | |
| Li et al. (2019) | T. aestivum | SPL | | | | | | | x |
| Current study | TauL1 | SPL | x | x | x | | x | | |
| Current study | TauL2 | SPL | | x | | | | | |
| Current study | All | SPL | x | | | | x | x | |
Table 8.
Morpho-physiological traits measured, their abbreviations, and definitions.
Table 8.
Morpho-physiological traits measured, their abbreviations, and definitions.
| Trait | Abbreviation | Measurement/Definition |
|---|
| Flag leaf length | FLL (cm) | Measured from three tillers of each accession. |
| Flag leaf width | FLW (cm) | Measured from three tillers of each accession. |
| Spike length | SPL (cm) | Measured at the middle spike after maturity stage in five spikes. |
| Spike width | SPW (cm) | Measured at the middle of five spikes after maturity stage in five spikes. |
| Seed number/Spike | SN/SP | Counted from five spikes at harvesting. |
| Seed weight/Spike | SPWg (g) | Measured using five spikes one from each tiller using a sensitive scale. |
| Days to heading | DH | Recorded when the whole spike above the flag leaf position fully emerged on the earliest tiller in each plant of each accession. |
| Biomass weight | Bio (g) | Measured after harvesting and drying in a glasshouse from five plants were counted. |
| Normalized Difference Vegetation Index | NDVI | A vegetative index that compares reflectance in the red and near infrared regions. Measured during flowering using a handheld optical sensor unit (Green Seeker), 2012 NTech Industries, Inc., Ukiah, CA, USA. |
| Canopy temperature | CT (°C) | Measured during flowering using an inferred thermometer AD-5611A. |
| Chlorophyll content | SPAD | Measured at the flowering stage from the middle of the flag leaf of three tillers using A Minolta brand chlorophyll meter (Model SPAD-502; Spectrum Technologies Inc. Plainfield, IL). |

 ,
, 


