Article

Photosynthesis and Related Physiological Parameters Differences Affected the Isoprene Emission Rate among 10 Typical Tree Species in Subtropical Metropolises

1
School of Agriculture and Biology, Shanghai Jiao Tong University, Shanghai 200240, China
2
Shanghai Urban Forest Ecosystem Research Station, National Forestry and Grassland Administration, Shanghai 200240, China
3
Yangtze River Delta Ecology & Environmental Change and Control Research Station, Ministry of Education, Shanghai 200240, China
4
Department of Biomedical Data Science, Stanford University School of Medicine, Stanford, CA 94305, USA
5
Key Laboratory for Urban Agriculture, Ministry of Agriculture and Rural Affairs, Shanghai 200240, China
*
Author to whom correspondence should be addressed.
Int. J. Environ. Res. Public Health 2021, 18(3), 954; https://doi.org/10.3390/ijerph18030954
Submission received: 12 December 2020 / Revised: 16 January 2021 / Accepted: 19 January 2021 / Published: 22 January 2021
(This article belongs to the Special Issue Sustainable Cities: Environmental Regeneration for Healthier Lives)

Abstract

:
Volatile organic compound (VOCs) emission is an important cause of photochemical smog and particulate pollution in urban areas, and urban vegetation has been presented as an important source. Different tree species have different emission levels, so adjusting greening species collocation is an effective way to control biogenic VOC pollution. However, there is a lack of measurements of tree species emission in subtropical metropolises, and the factors influencing the species-specific differences need to be further clarified. This study applied an in situ method to investigate the isoprene emission rates of 10 typical tree species in subtropical metropolises. Photosynthesis and related parameters including photosynthetic rate, intercellular CO2 concentration, stomatal conductance, and transpiration rate, which can influence the emission rate of a single species, were also measured. Results showed Salix babylonica always exhibited a high emission level, whereas Elaeocarpus decipiens and Ligustrum lucidum maintained a low level throughout the year. Differences in photosynthetic rate and stomatal CO2 conductance are the key parameters related to isoprene emission among different plants. Through the establishment of emission inventory and determination of key photosynthetic parameters, the results provide a reference for the selection of urban greening species, as well as seasonal pollution control, and help to alleviate VOC pollution caused by urban forests.

Graphical Abstract

1. Introduction

Urban forests are a vital part of the urban ecosystem. Research on the relationship between urban forests and atmospheric pollutants has become a popular topic in urban ecology [1,2,3]. Biogenic volatile organic compounds (BVOCs) are a special class of plant metabolites [4]. Most plants produce BVOCs and it is estimated that there are more than 30,000 species [5].
BVOCs are the main source of volatile organic compounds (VOCs) globally [6]. It is estimated that the average annual emission of VOCs is 1273 TgC, and 1150 TgC is derived from BVOCs, which is higher than 110 TgC of VOCs from anthropogenic sources [7]. In recent years, many researchers have started assessing the total emissions of BVOCs in different regions. Chang et al. [8] estimated that the annual emission of BVOCs was 3.37 × 10⁶ gC·km−2 in the greater Hangzhou area. Pacheco et al. [9] estimated total isoprene emissions in Italy to be 6531.30 Gg in 2014. Although BVOCs have important functions in protecting plants from abiotic stresses [10], emissions of these BVOCs, especially in urban areas, can lead to secondary aerosols which contribute to particulate matter (PM2.5) and ground-level ozone pollution that threaten human health [11]. Therefore, we need to select suitable tree species and adjust the collocation of urban greening, which is a crucial solution to control BVOC pollution.
Isoprene is an important active substance among BVOCs, accounting for 44% of BVOCs [6]. Researchers have found that isoprene emissions from one single plant species are related to photosynthetic related factors [12,13]. Brilli et al. [14] found that isoprene emission is related to photosynthesis, stomatal conductance, and mesophyll conductance. Huve et al. [15] found that plant-derived methanol is closely related to changes in plant stomatal conductance. This may be affected by the isoprene synthases (IspS) and the supply of dimethylallyl diphosphate (DMADP) [16] and adenosine triphosphate (ATP) [17]. Thus, we speculate that the ability to emit isoprene is affected by photosynthesis, as evidenced by its relationship with the photosynthetic rate, stomatal conductance, and transpiration rate.
Previous studies mainly emphasized one single species and its influential factors, and oak was normally selected as the study plant [18]. However, there are great differences in isoprene emission rate among different species. For example, studies have found that Populus, Quercus, and Ficus are high emitters, while Acer, Ulmus, and Juniperus are considered as low-emission tree species [19,20,21,22]. On the one hand, the emission rate of common tree species in the subtropical monsoon area is rarely measured, so there is less reference for the selection of urban greening tree species. On the other hand, it is not clear whether photosynthesis is still the primary factor related to the interspecific difference.
In this paper, 10 common trees in subtropical metropolises were selected, and their isoprene emission rate in four seasons were measured to establish an emission inventory. The photosynthetic related parameters including photosynthetic rate, stomatal conductance, intercellular CO2 concentration and transpiration rate were also measured. Correlation analysis and principal component analysis (PCA) were used to determine the relationship and to test if these parameters can be used to predict isoprene emissions. According to emission inventory and main influencing factors, this paper can be helpful to the selection of urban greening tree species and targeted isoprene prevention, and can help the control of urban biogenic volatile organic compounds pollution.

2. Materials and Methods

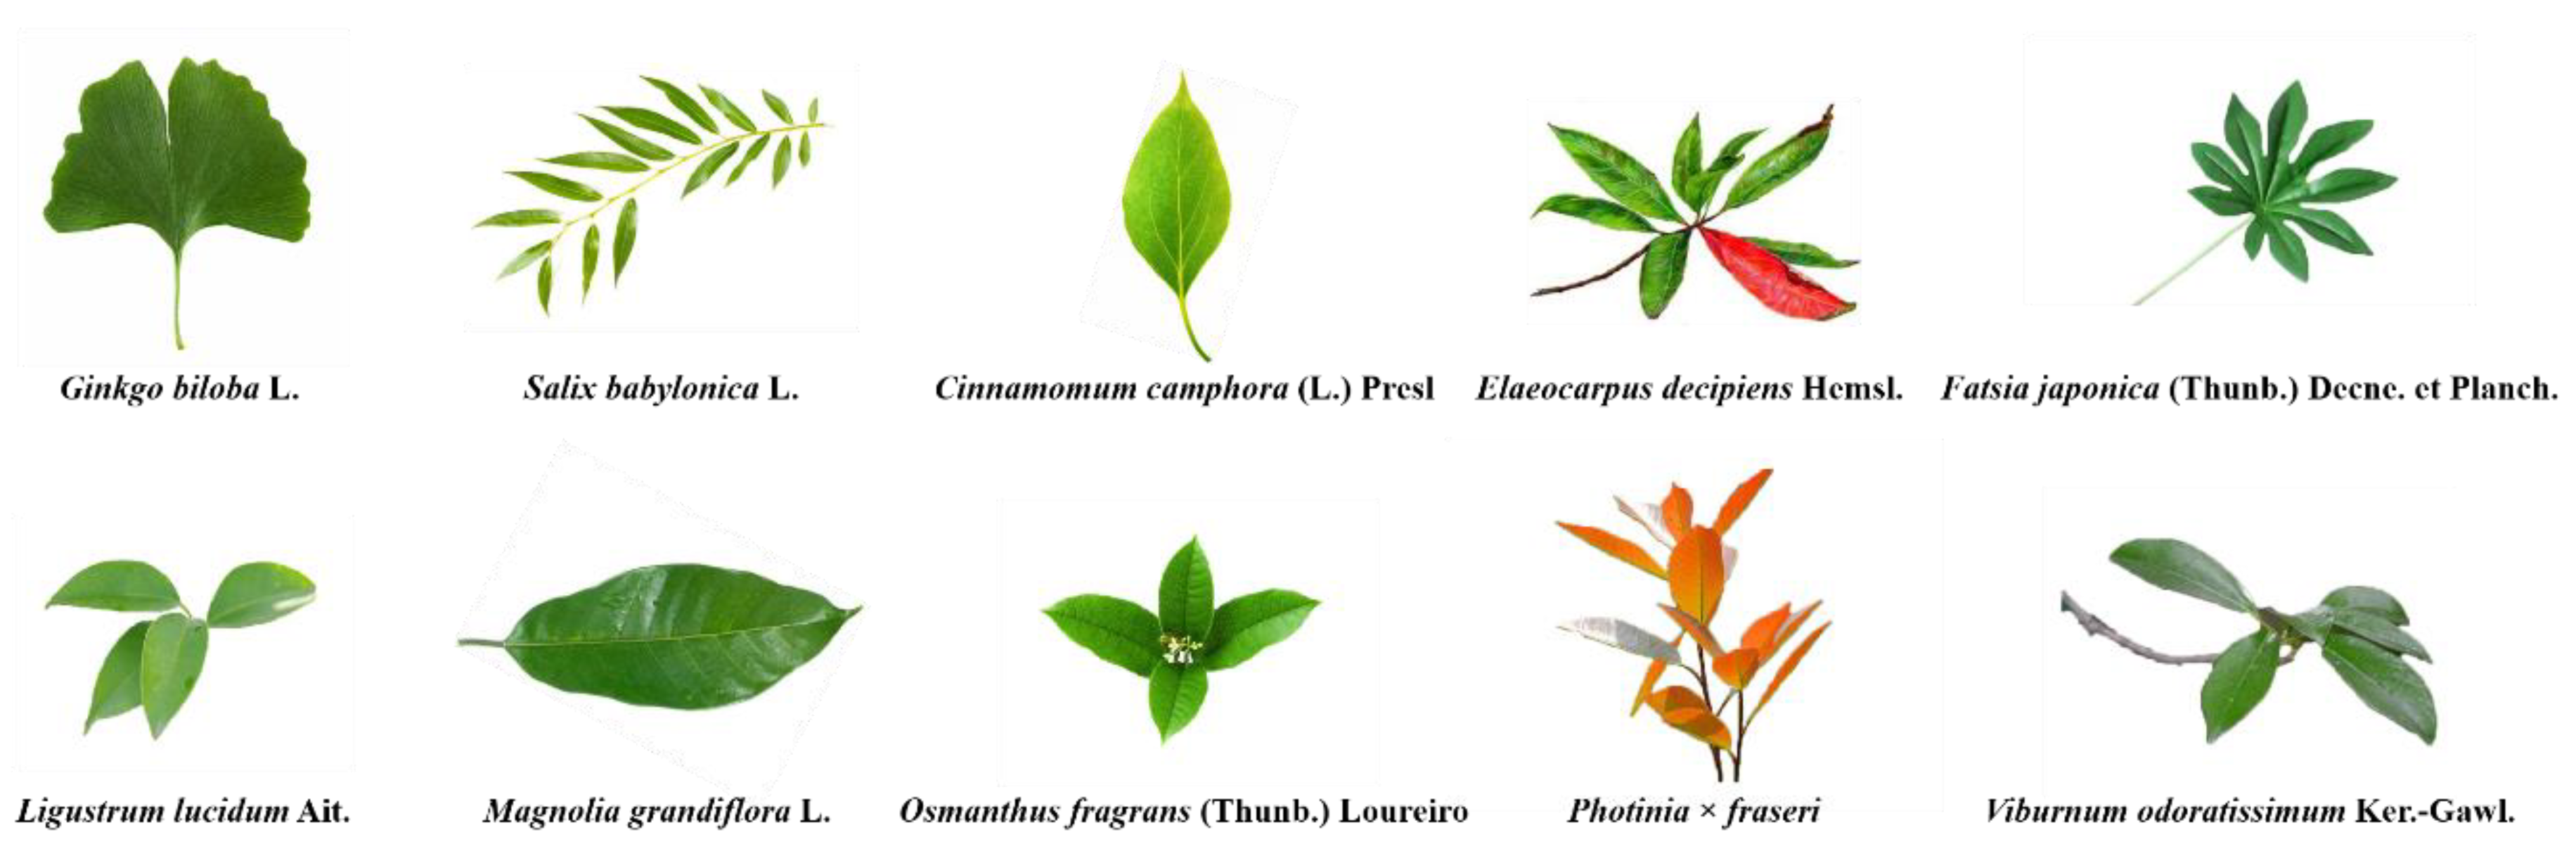
2.1. Sampling Sites and Tree Species

The sampling site was the botanical garden in Shanghai Jiao Tong University, which is located in the estuary of the Yangtze River (121°30′ E, 31°17′ N). Shanghai has a typical subtropical monsoon climate with distinct seasons and moderate precipitation throughout the year (approximately 1098 mm) [23]. The flood season is from May through September. The soil pH is 8.0–9.0, and the content of organic matter is at an intermediate level [24]. Evergreen broad-leaf tree species are typical plants in the subtropics. Thus, we selected 10 broad-leaf tree species (shown in Figure 1) as samples which are cultivated and grow well in the garden.

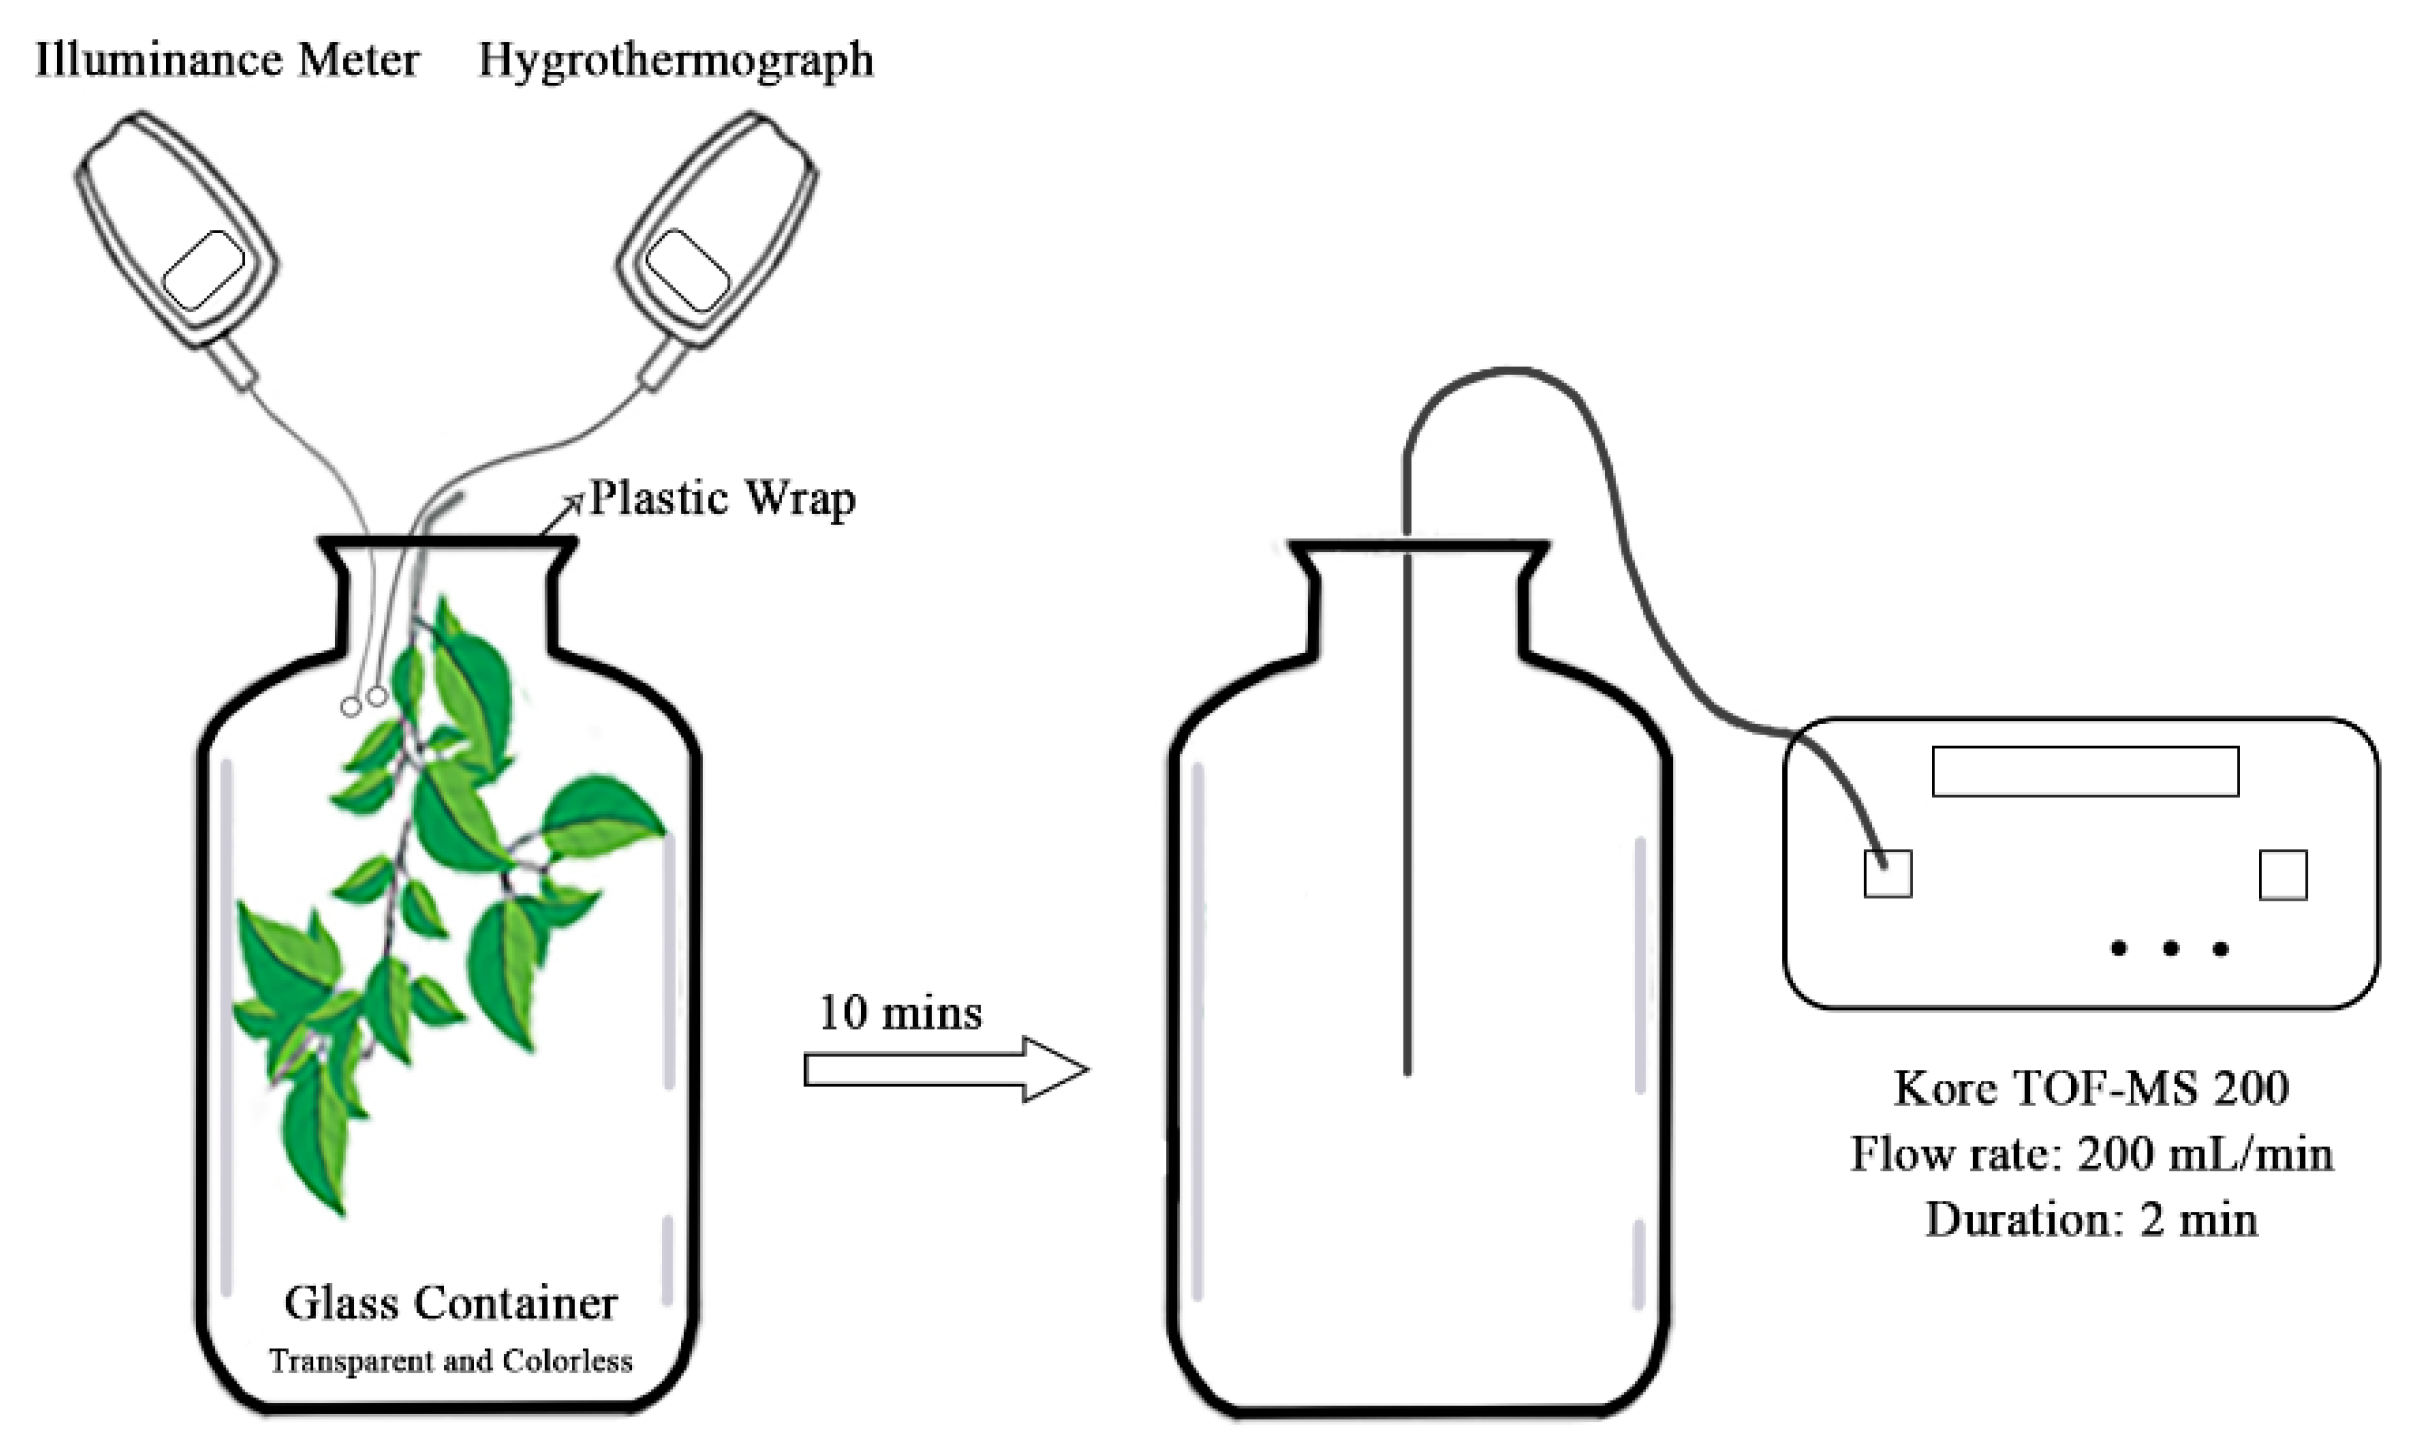
2.2. Measurement of Isoprene Emission Rate

In this experiment, we used the method described in Xiong et al. [25]; the enclosure sampling method was used to collect the gas emitted by trees, and then the time of flight mass spectrometry (TOF-MS) was used to measure and analyze BVOCs. The experiment was conducted four times, once each in June 2017, October 2017, January 2018, and April 2018 to represent summer, autumn, winter, and spring, respectively. Three adjacent trees of each tree species were selected and the results were averaged.
Sampling was conducted using a static enclosure system (Figure 2), which differs from the traditional system [21,26]. Teflon bags and absorbing tubes from the traditional approach were replaced with glass containers with 15 L volume. First, the gas was pumped in the container next to the sampling tree species to make the air in the container consistent with environment. Then the twigs were wrapped from three adjacent trees separately with three containers simultaneously and the gas was collected for 10 min. The specific requirements of twigs were as follows: the twigs were located outside the crown and 2/3 of the height of the tree with mature leaves and the length extending into the container was about 20 cm. At the same time, the illuminance meter (MQ-200, Apogee Instruments, Logan, UT, USA) and hygrothermograph (DT8002, Kejian, Guangdong, China) were used to measure the photosynthetically active radiation (PAR) and temperature around the experimental trees for several times and blank samples of the atmospheric environment around the tree species were also collected. After 10 min, the container was sealed and physiological parameters were measured with the leaves on these twigs (see Section 2.4 for details). Finally, the leaves were taken back to measure their biomass.
Then we chose time-of-flight mass spectrometry (TOF-MS) to measure BVOCs, which has been applied worldwide for gas analysis. Christof et al. [27] used this technology to determine acetaldehyde and the VOCs emissions of different wood cores were measured by Taiti et al. [28]. Since many studies have chosen to use gas chromatography and mass spectroscopy (GC-MS) for isoprene measurement in the past [21,29,30], before the formal experiment, we measured the emission rates of five species by both GC-MS and TOF-MS. The results are shown in Supplementary Materials Table S1. According to the independent samples t test, the smallest p value of the five trees is 0.148, which indicates that there is no significant difference (p > 0.05) between the results given by the two methods. Moreover, TOF-MS is more time-saving and can be observed in situ. Thus, we used the TOF-MS Analyzer (TOF-MS-200, Kore, Ely, UK) to measure emission rate. The samples were pumped into a membrane sampling system. Subsequently they entered the high-vacuum photoionization ion source through a special synthetic membrane, and the molecules to be tested were charged. The sample then entered the mass analysis chamber with a higher vacuum to analyze the volume concentration of the gas.
The amount of isoprene released from plants within 10 min can be obtained by subtracting the mass spectra of the blank base sample from the spectra of the analysis sample with TOF-MS-200 Analyzer software.
The isoprene emission rate calculation formula is as follows (Equation (1)):
v = 15 · c · m 1 · t 1
where v is the emission rate of isoprene under environmental conditions (μg·g−1·h−1); c is the concentration of isoprene collected in the container; m is the dry weight of leaves (dried at 80 °C for 24 h after sampling and measurement of physiological parameters); 15 is the volume of the container (L), and t is the collection time 1/6 h.

2.3. Standardization of the Isoprene Emission Rate

Illumination and temperature have a remarkable influence on isoprene emission. Because of the variation of environmental conditions during sampling, all emission rates were standardized to 303 K and 1000 μmol·m−2·s−1 (Equations (2)–(4)) [31].
I =   I S × C L × C T
where I is the emission rate at temperature T and PAR flux L, and Is is the emission rate under standard conditions (temperature = 303 K; PAR = 1000 μmol·m−2·s−1). CL is the light correction factor, and CT is the leaf temperature correction factor:
C L = α C L 1 L ( 1   +   α 2 L 2 ) 1 2
where α and CL1 are empirical constants (α = 0.0027; CL1 = 1.066).
C T = e x p [ C T 1 ( T T S ) R T S T ] 1 + e x p [ C T 2 ( T T M ) / R T S T ]
where R is the ideal gas constant (8.314 J·K−1·mol−1), T is the leaf temperature, CT1 and CT2 are empirical constants (CT1 = 95,000 J·mol−1; CT2 = 230,000 J·mol−1), TM = 314 K, and TS is the standard temperature (303 K).
This formula is the most widely used one in isoprene emission rate standardization.

2.4. Measurement of Plant Photosynthesis and Related Physiological Parameters

Leaf photosynthesis and related physiological parameters (photosynthetic rate, stomatal conductance, transpiration rate, and intercellular CO2 concentration) of the 10 plant species in spring and summer were estimated using a LI-6400XT (LI-COR, Lincoln, NE, USA) portable photosynthetic instrument.
After sampling for isoprene emission, 10 leaves were selected from each twig for parameters determination in situ. The experiment was carried out at the best time of photosynthesis from 9 a.m. to 11 a.m. The abovementioned parameters were measured under natural condition (humidity of 30–50% and temperature of 22–27 °C in spring, 40–70% and 25–30 °C in summer). During the measurement of each leaf, data were recorded several times after the indication was stable, and the average value was taken as a repetition. The accurate temperature, relative humidity and PAR were simultaneously measured and recorded by the hygrothermograph and the illuminance meter.

2.5. Data Processing

Two-way ANOVA and Duncan’s multiple comparison were used to compare the isoprene emission rates between the tree species and to test the interaction between species and season. Pearson’s correlation was used to analyze the relationship between emission rate and photosynthesis and related parameters. PCA was conducted to obtain the dominant factors that can affect emission rate. Data processing mentioned above was conducted using SPSS (version 25, IBM, Chicago, IL, USA), Excel (version 16.32, Microsoft, Redmond, WA, USA) and PerformanceAnalytics, ggplot2, vegan, reshape2, tidyverse packages in RStudio (version 1.2.1335, RStudio, Boston, MA, USA).

3. Results

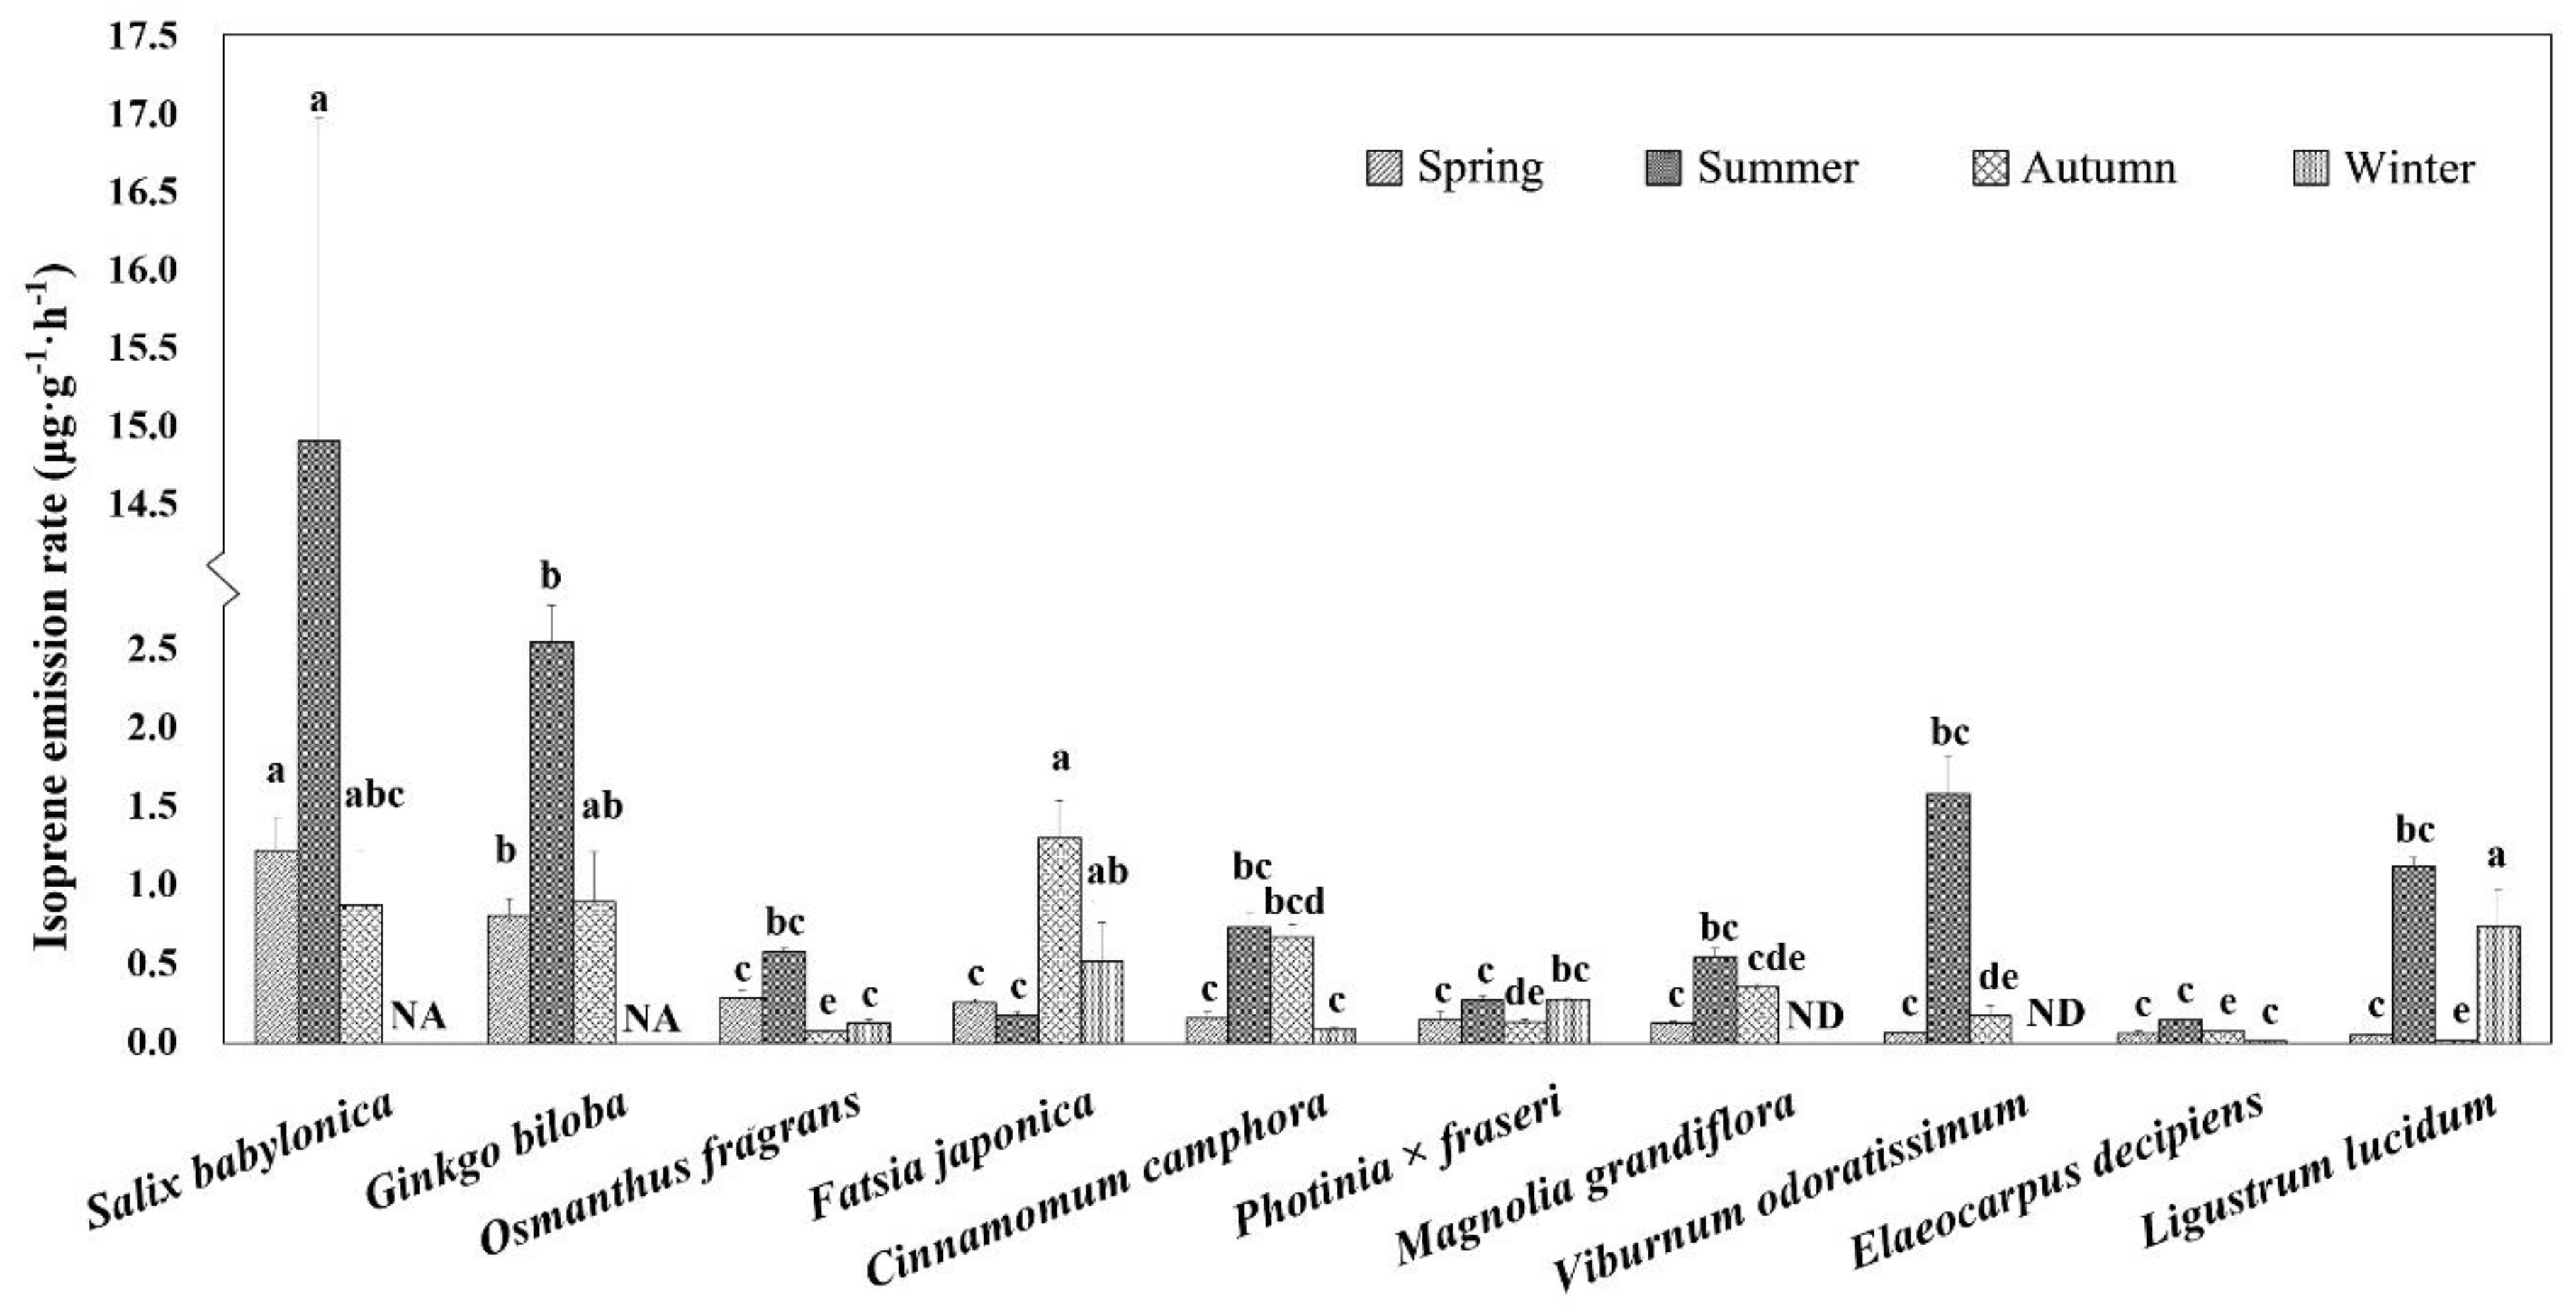
3.1. Isoprene Emission Rate of Different Trees in Four Seasons

The isoprene emission rates of 10 tree species in different seasons are as shown in Figure 3. According to the results of two-way ANOVA (see Supplementary Materials Table S2), the significant differences in isoprene emission rates existed not only between tree species but also seasons. Meanwhile, there were interaction between them, which may be due to different phenological characteristics among tree species.
In spring, the plant with the highest isoprene emission rate in Shanghai was Salix babylonica (1.22 μg g−1 h−1) The others were all less than 1 μg·g−1·h−1. Viburnum odoratissimum and Elaeocarpus decipiens emitted less than 0.1 μg·g−1·h−1. The lowest emission rate among all species was that of Ligustrum lucidum (0.05 μg·g−1·h−1). In summer, the emission rate of S. babylonica remained highest (14.94 μg·g−1·h−1) among all species. The emission rates of most species were less than 1 μg·g−1·h−1. In autumn, the emission rate of Fatsia japonica was the highest among the sample trees (1.3 μg·g−1·h−1). E. decipiens and L. lucidum remained at low levels, whereas S. babylonica emissions remained high. In winter, the species with the highest emission rate was L. lucidum (0.74 μg·g−1·h−1). Generally, the emission rates for all tree species were at a low level; the rates were less than 1 μg·g−1·h−1. S. babylonica and Ginkgo biloba are deciduous species, therefore, they were excluded from the comparison. The isoprene emissions of M. grandiflora and V. odoratissimum were undetected.
According to a comparison of the four seasons, the emission rate in summer was considerably higher than that in the other three seasons. The annual emission rate of S. babylonica (5.68 μg·g−1·h−1) was at a high level, whereas those of both E. decipiens (0.08 μg·g−1·h−1) and Photinia × fraseri (0.21 μg·g−1·h−1) were at a low level.

3.2. Photosynthesis and Related Physiological Parameters of Different Plants in Growing Seasons

The photosynthesis and related physiological parameters of 10 tree species are shown in Table 1.
During the growing seasons (spring to summer), the photosynthetic rate presented an uptrend; S. babylonica had the highest photosynthetic rate among the species in spring, whereas L. lucidum had the lowest. Osmanthus fragrans had the highest photosynthetic rate in summer, but the photosynthetic rate of S. babylonica also increased; the photosynthetic rate of F. japonica remained low.
The intercellular CO2 concentration of most tree species decreased from spring to summer. In spring Cinnamomum camphora and Ginkgo biloba exhibited the highest and lowest concentration, respectively. The species with the lowest concentration in summer was C. camphora, the species with the highest concentration was F. japonica.
The stomatal conductance of most plants increased remarkably from spring to summer. In spring, S. babylonica had the highest stomatal conductance and O. fragrans had the lowest. In summer V. odoratissimum and P. fraseri had the highest and lowest stomatal conductance. This may be due to the change of the opening or closing state of the stomatal pores affected by the temperature.
The transpiration rate showed a general uptrend from spring to summer. In spring, the highest transpiration rate was that of S. babylonica, whereas the lowest one was that of P. fraseri. In summer, the highest transpiration rate was that of F. japonica, and the lowest one was that of E. decipiens. The transpiration rate is also influenced by temperature. Therefore, it increased from spring to summer.
Measurements of photosynthetic related physiological characteristics showed great differences among plant species. They also differed from spring to summer. How these characteristics affect the emission of isoprene needs further discussion.

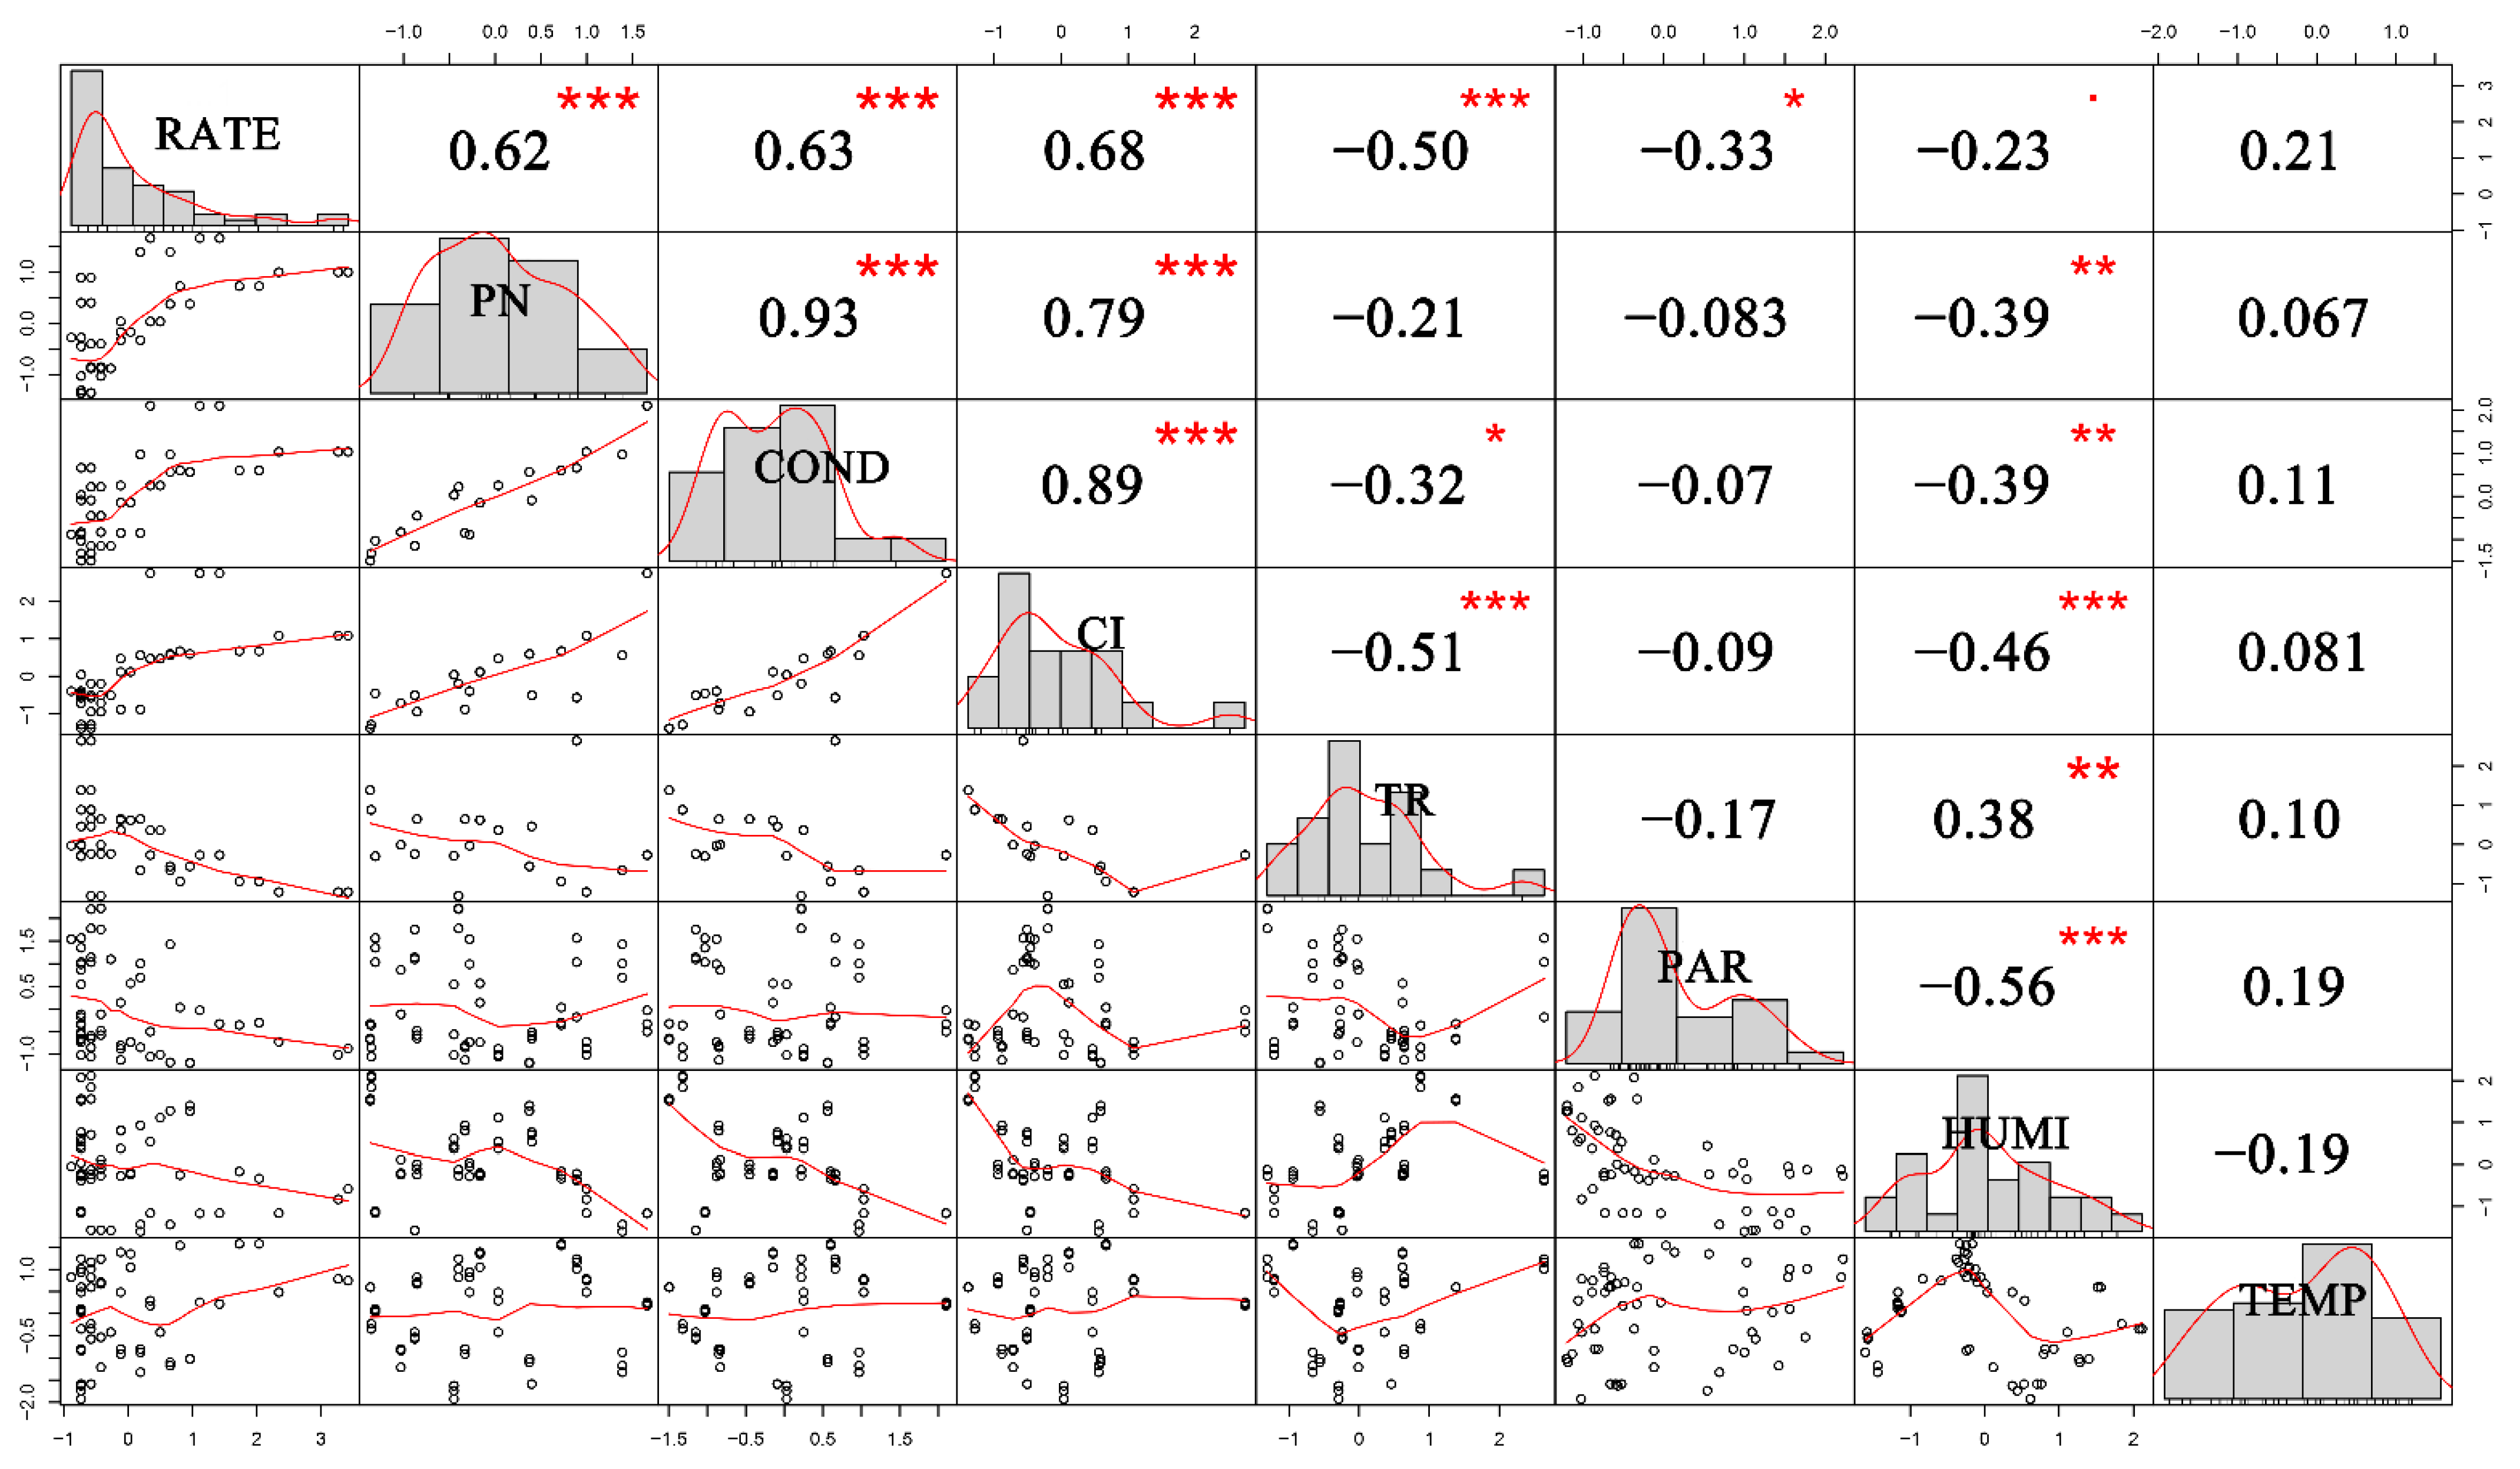
3.3. Correlations between Plant Parameters and Isoprene Emission Rate

In order to determine the correlation between factors and their impacts to the isoprene emission rate, Z-score normalization was employed to normalize the data of 10 tree species from spring and summer and a covariance matrix was deduced to directly reflect the relationships between variables as shown in Figure 4.
According to Figure 4, the isoprene emission rate (RATE) was strongly related to net photosynthesis rate (PN), stomatal conductance (COND), intercellular CO2 concentration (CI), transpiration rate (TR), and humidity (HUMI). Though net photosynthesis rate, stomatal conductance and intercellular CO2 concentration had a positive correlation with isoprene emission rate, transpiration rate and humidity were negatively related. In addition, net photosynthesis rate, stomatal conductance, intercellular CO2 concentration, and relative humidity were closely correlated with each other. However, photosynthetically active radiation (PAR) and temperature (TEMP) seemed to be unrelated to any other parameters, except that PAR was slightly negatively related to isoprene emission rate. Some of the factors were highly related, and dimensionality reduction should be applied here.

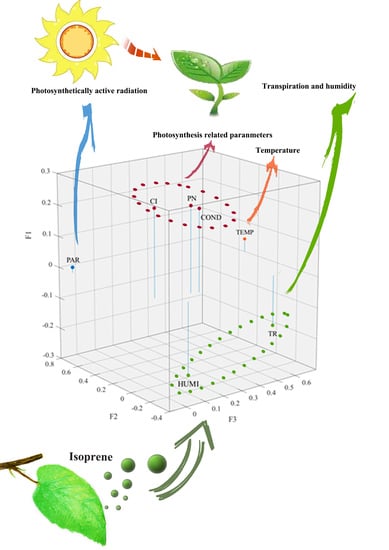
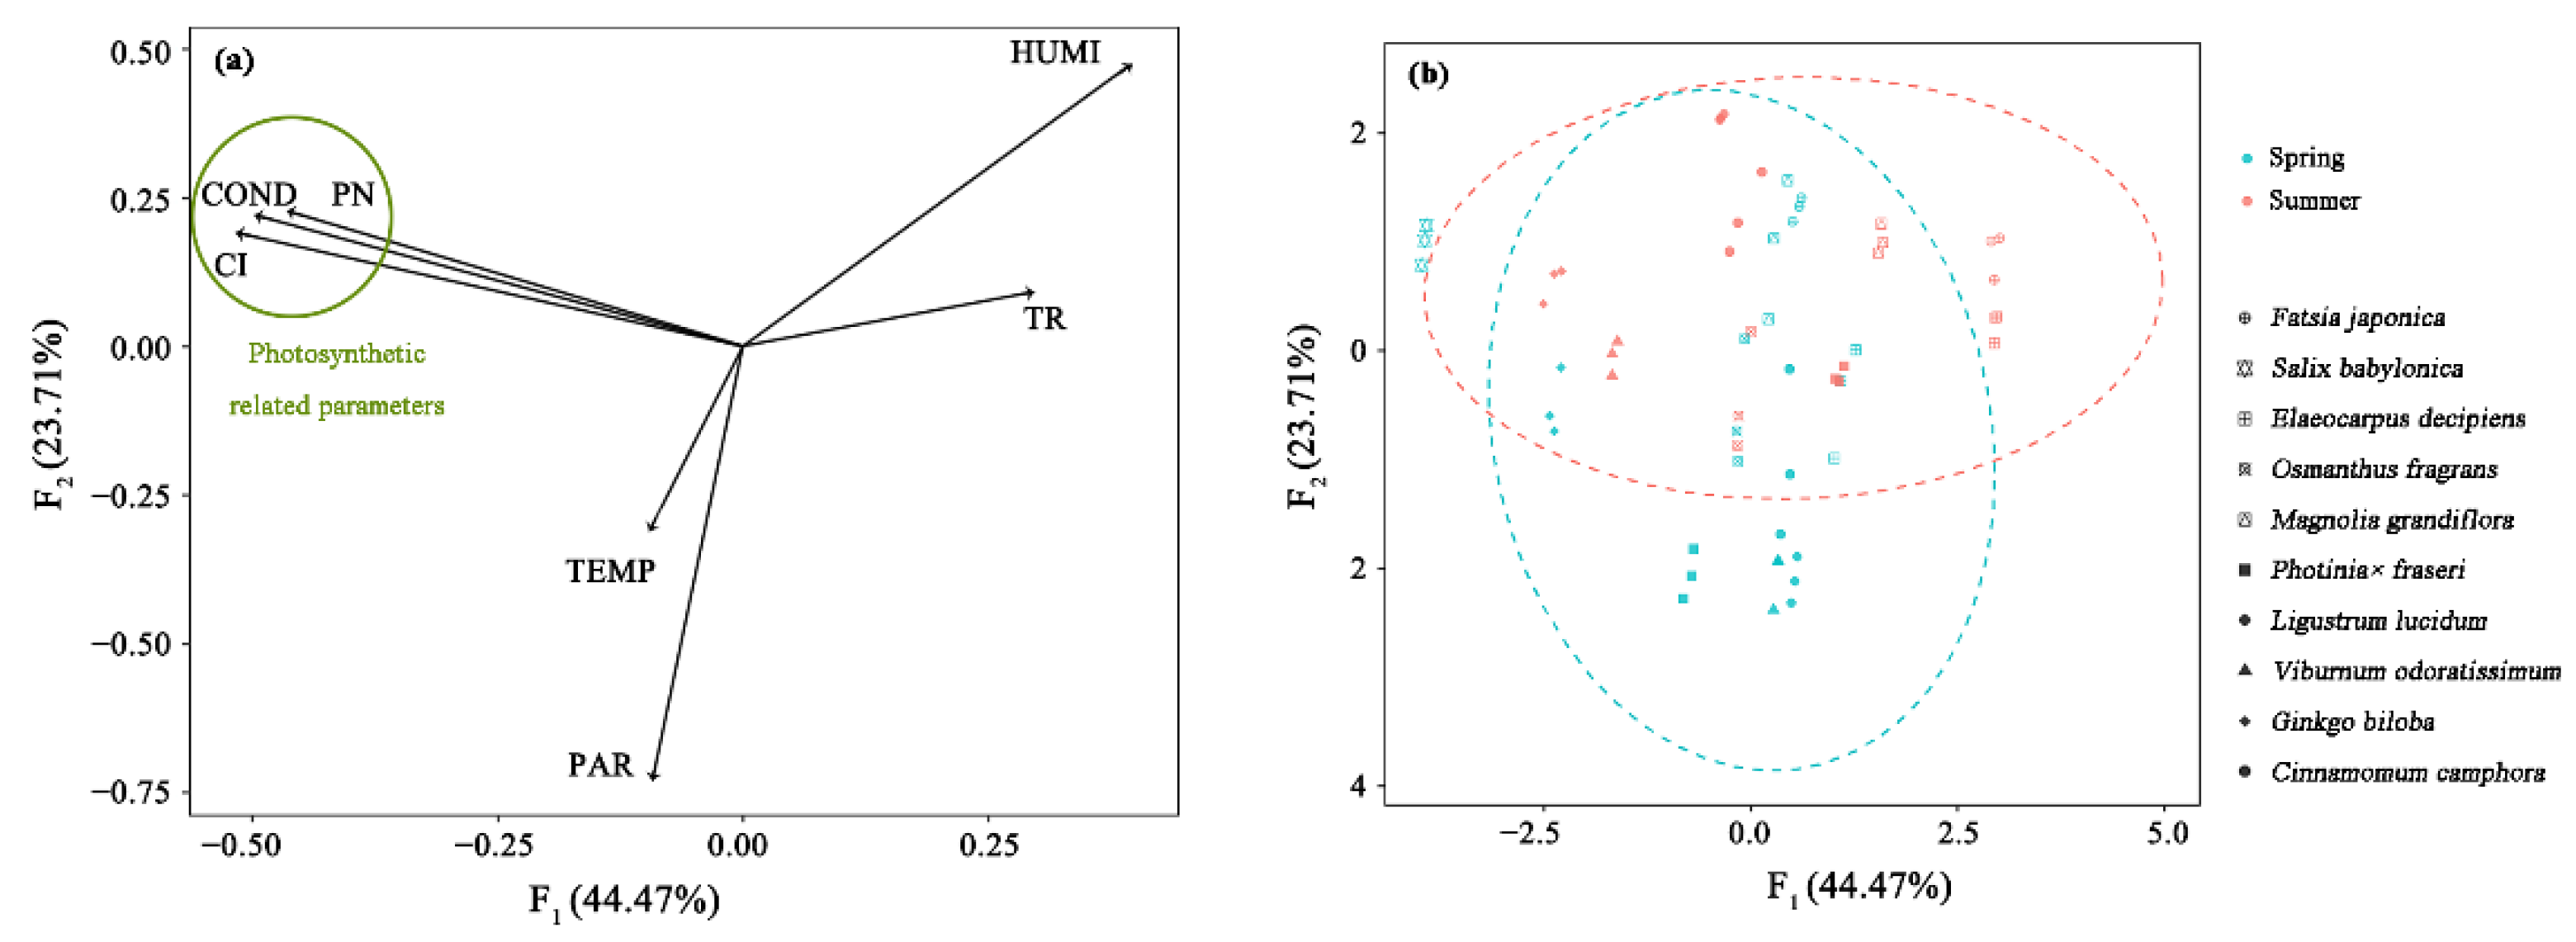
3.4. Key Factors of Isoprene Emission Rate Based on PCA

To comprehensively understand the main parameters influencing isoprene emission rate of 10 species, PCA was conducted to classify each factor and deduce the principal components. The results are as shown in Figure 5.
The analysis resulted in seven principal components (PCs), from which 68.18% of the total variance of the model was achieved with the first two PCs. The first component (F1) is the main indicator of the total variance of the data, which is responsible for 49.2% of the changes in all analyzed parameters. With regard to the relationship between the PCs and the parameters, F1 is negatively correlated to net photosynthesis rate, intercellular CO2 concentration, stomatal conductance, while positively correlated to humidity and transpiration rate (Figure 5a). The second factor (F2) is less important since it explains only 23.71% of the parameters. And it is mostly influenced by PAR, although it shows some relationship with humidity and temperature.

4. Discussion

4.1. Close Relationship between Photosynthesis Related Parameters and Isoprene Emission

As analyzed above, the first factor in PCA, “F1”, especially the net photosynthetic rate, is the most important contributor to the variance of isoprene emission rate. Although the mechanism of physiological process has not been studied in this paper, it is still proved that the differences of photosynthetic rate and isoprene emission are also interspecifically related. Moreover, some literatures have pointed out that photosynthetic activity is a significant variable affecting isoprene emission of individual plants [32,33,34,35,36,37]. Sanadze et al. [32] used isotope technology to prove that the substrate and energy of isoprene came entirely from photosynthesis. Monson et al. [33] also explained in detail how methylerythritol 4-phosphate (MEP) pathway in chloroplast constructed the relationship between photosynthesis and isoprene synthesis. The MEP pathway provides carbon substrates and then produces precursors for isoprene synthesis. Phosphoenolpyruvate (PEP) and glyceraldehyde 3-phosphate (G3P), which are produced through glycolysis or the C4 pathway, are transported to the chloroplasts, which leads to the formation of methyl erythritol after PEP and G3P undergo a complex process. Dimethylallyl pyrophosphate (DMAPP) is then formed and isomerized into isopentenyl pyrophosphate (IPP) [34], which are the activated forms of isoprene in plants. The MEP pathway also provides energy for the synthesis and release of isoprene. Photosynthesis can directly affect the release of ATP. Plants do not emit isoprene when leaves don’t photosynthesize [35]. 3-phosphoglyceric acid and 1,3-bisphosphoglyceric acid are possible candidates for the link between photosynthetic carbon metabolism and the regulation of isoprene emission, which is ATP dependent. All the points above suggest that the different photosynthetic abilities of different plants can affect their different isoprene emission capacities.
Furthermore, photosynthesis rate is under the influence of stomatal conductance as well as intercellular CO2 concentration. As the main substrate for photosynthesis, CO2 is acquired by stomata from the atmosphere. Stomatal conductance was found affecting the regulation of metabolites from photosynthesis [38]. Enhanced level of photosynthesis is related to the increase of stomatal conductance [39]. On the other hand, a low level of intercellular CO2 concentration provides conditions where photochemical energy colimits photosynthesis rate [40]. Also, high stomatal conductance is responsible for higher intercellular CO2 concentration, which has a positive impact on the electron flow of the carbon reduction pathway [41].

4.2. Other Factors Influencing Isoprene Emission

In addition to photosynthetic parameters, isoprene emission rate is also related to other factors. Humidity and transpiration rate were the last two factors to F1, although their effects were not so significant. Both humidity and transpiration rate show negative correlation with isoprene emission rate. The mechanism behind this was seldom discussed [42]. However, it is confirmed that relative humidity may change the pathways to form secondary organic aerosols from isoprene [43]. PAR and temperature are potential influential factors to photosynthesis activity and could further affect isoprene emission rate, which was long confirmed by previous studies [33,44]. However, the influence turns out to be small because, in order to obtain a standardized isoprene emission rate that is meaningful for cross-species comparison, most of the data were collected during “ideal” conditions where temperature and PAR were believed to be near the optimum.

4.3. Species Selection and Priority Control

Nowadays, much attention has been paid to the ecological service functions of plants, such as dust retention and noise reduction. However, in urban planning and construction, potential ecosystem disservices, such as promoting O3 generation through the emission of BVOC, must be considered. Some studies have found that deciduous trees account for a large proportion of urban greening [45], in which Quercus, Salix, Populus, and Platanus species generally have large isoprene emissions. Tree species with high emission have a higher share in Asia [46]. For example, in Shanghai, 47% of street trees are Platanus acerifolia [47]. In contrast, suburban and rural forests are usually dominated by evergreen trees [48], which mainly release monoterpenoids and have a slight impact on O3 formation. Therefore, in order to alleviate the adverse effects caused by plants, in urban greening planning, species with low isoprene emission, such as E. decipiens and L. lucidum according to the results in our study, should be given more attention, while tree species with high emission rates, such as S. babylonica, should be avoided as much as possible.
Meanwhile, we should also note that isoprene emissions are generally high in summer. This is basically consistent with the results of previous studies. Cai et al. [49] and Guo et al. [50] also indicated that VOC concentration increased in summer. Jardine et al. [30] found that the maximum emission rate of isoprene occurred at the highest light intensity. Therefore, people should pay attention to the prevention and control of BVOC in summer.
In addition to the emission inventory, more importantly, this study points out the possible common rules of high emission tree species. Although this study involves only a few species, the relationship between photosynthesis and isoprene emission was established by measuring the influencing factors among species, from which general patterns in BVOC emissions can be identified. For example, deciduous trees used to be considered as high isoprene emitters while evergreen trees as low emitters [51]. According to our results, tree species with high photosynthetic rate and low transpiration rate are more likely to be high isoprene emitters. Additionally, due to the great variability of vegetation emissions among individuals, and most researchers use their own instruments and unique sampling systems to measure, the results may not be directly comparable [21,52,53]. Therefore, in the future, it is more feasible to determine the emission level of BVOC through simple and uniform measurable photosynthetic parameters for tree species selection.

5. Conclusions

Generally, the isoprene emission rate of plants is the highest in summer and the lowest in winter. The main reason is the differences of the external environment and plants growing conditions among four seasons. The isoprene emission rate of S. babylonica always remains at a high level during the growing season, whereas that of E. decipiens and L. lucidum are at a low level throughout the year.
The differences in isoprene emission among different plant species was closely correlated with photosynthesis difference. The net photosynthetic related factors, including net photosynthesis rate, intercellular CO2 concentration, and stomatal conductivity, are the most significant factors summarized by the first principal component of a principal component analysis.
According to our study, considering the contribution of isoprene to O3 accumulation and PM production, especially in densely populated urban areas, the cultivation of low emission tree species such as E. decipiens and L. lucidum should be strengthened. Summer is the season of serious pollution, so more attention should be paid to the BVOCs control in this period. Although the tree species measured in this study were few, the possible commonness of high emission species is pointed out. Photosynthetic parameters can also be used as the basis of urban greening species selection to effectively alleviate urban air pollution.

Supplementary Materials

The following are available online at https://www.mdpi.com/1660-4601/18/3/954/s1, Table S1: Difference analysis of the two detection methods, Table S2: Results of Two-Way ANOVA of species and seasonal differences on emission rate.

Author Contributions

Conceptualization S.Y.; Formal analysis F.X.; Investigation J.L., F.X., Y.L. and N.S.; Methodology J.L., F.X. and S.Y.; Project administration S.Y. and C.L.; Resources N.S.; Writing—original draft F.X.; Writing—review & editing J.L., S.Y., Y.L. and C.L. All authors have read and agreed to the published version of the manuscript.

Funding

This work was supported by the National Natural Science Foundation of China (31971719).

Institutional Review Board Statement

Not applicable.

Informed Consent Statement

Not applicable.

Data Availability Statement

The data presented in this study are available in Supplementary Materials.

Conflicts of Interest

The authors declare no conflict of interest.

References

  1. Escobedo, F.J.; Adams, D.C.; Timilsina, N. Urban forest structure effects on property value. Ecosyst. Serv. 2015, 12, 209–217. [Google Scholar] [CrossRef]
  2. Willis, K.J.; Petrokofsky, G. The natural capital of city trees. Sciecce 2017, 356, 6336. [Google Scholar] [CrossRef]
  3. Sharkey, T.D.; Monson, R.K. Isoprene research—60 years later, the biology is still enigmatic. Plant Cell Environ. 2017, 40, 1671–1678. [Google Scholar] [CrossRef]
  4. Iijima, Y. Recent Advances in the Application of Metabolomics to Studies of Biogenic Volatile Organic Compounds (BVOC) Produced by Plant. Metabolites 2014, 4, 699–721. [Google Scholar] [CrossRef] [Green Version]
  5. Peñuelas, J.; Llusià, J. Plant VOC emissions: Making use of the unavoidable. Trends Ecol. Evol. 2004, 19, 402–404. [Google Scholar] [CrossRef]
  6. Guenther, A.B.; Hewitt, C.N.; Erickson, D.; Fall, R.; Geron, C.; Graedel, T.; Harley, P.; Klinger, L.; Lerdau, M.; Mckay, W.A. A global model of natural volatile organic compound emissions. J. Geophys. Res. Atmos. 1995, 100, 8873–8892. [Google Scholar] [CrossRef]
  7. Simpson, D.; Winiwarter, W.; Börjesson, G.; Cinderby, S.; Ferreiro, A.; Guenther, A.; Hewitt, C.N.; Janson, R.; Khalil, M.A.K.; Owen, S. Inventorying emissions from nature in Europe. J. Geophys. Res. Atmos. 1999, 104, 8113–8152. [Google Scholar] [CrossRef] [Green Version]
  8. Chang, J.; Ren, Y.; Shi, Y.; Zhu, Y.; Ge, Y.; Hong, S.; Jiao, L.; Lin, F.; Peng, C.; Mochizuki, T.; et al. An inventory of biogenic volatile organic compounds for a subtropical urban–rural complex. Atmos. Environ. 2012, 56, 115–123. [Google Scholar] [CrossRef]
  9. Pacheco, C.K.; Fares, S.; Ciccioli, P. A highly spatially resolved GIS-based model to assess the isoprenoid emissions from key Italian ecosystems. Atmos. Environ. 2014, 96, 50–60. [Google Scholar] [CrossRef]
  10. Loreto, F.; Dicke, M.; Schnitzler, J.-P.; Turlings, T. Plant volatiles and the environment. Plant Cell Environ. 2014, 37, 1905–1908. [Google Scholar] [CrossRef]
  11. Ren, Y.; Qu, Z.; Du, Y.; Xu, R.; Ma, D.; Yang, G.; Shi, Y.; Fan, X.; Akira, T.; Guo, P.; et al. Air quality and health effects of biogenic volatile organic compounds emissions from urban green spaces and the mitigation strategies. Environ. Pollut. 2017, 230, 849–861. [Google Scholar] [CrossRef]
  12. Li, J. Emission of Two Tree Species of Platycladus orientalis and Pinus tabulaeformis in Urban Environment. Ph.D. Thesis, China Academy of Forestry Sciences, Beijing, China, 2009. (In Chinese). [Google Scholar]
  13. Llusia, J.; Roahtyn, S.; Yakir, D.; Rotenberg, E.; Seco, R.; Guenther, A.; Peñuelas, J. Photosynthesis, stomatal conductance and terpene emission response to water availability in dry and mesic Mediterranean forests. Trees 2016, 30, 749–759. [Google Scholar] [CrossRef] [Green Version]
  14. Brilli, F.; Tsonev, T.; Mahmood, T.; Velikova, V.; Loreto, F.; Centritto, M. Ultradian variation of isoprene emission, photosynthesis, mesophyll conductance, and optimum temperature sensitivity for isoprene emission in water-stressed Eucalyptus citriodora saplings. J. Exp. Bot. 2013, 64, 519–528. [Google Scholar] [CrossRef] [Green Version]
  15. Huve, K.; Christ, M.; Kleist, E.; Uerlings, R.; Niinemets, U.; Walter, A.; Wildt, J. Simultaneous growth and emission measurements demonstrate an interactive control of methanol release by leaf expansion and stomata. J. Exp. Bot. 2007, 58, 1783–1793. [Google Scholar] [CrossRef] [Green Version]
  16. Sharkey, T.D.; Wiberley, A.E.; Donohue, A.R. Isoprene Emission from Plants: Why and How. Ann. Bot. 2008, 101, 5–18. [Google Scholar] [CrossRef] [Green Version]
  17. Loreto, F.; Sharkey, T.D. A gas-exchange study of photosynthesis and isoprene emission in Quercus rubra L. Planta 1990, 182, 523–531. [Google Scholar] [CrossRef]
  18. Loreto, F.; Bagnoli, F.; Fineschi, S. One species, many terpenes: Matching chemical and biological diversity. Trends Plant Sci. 2009, 14, 416–420. [Google Scholar] [CrossRef]
  19. Singh, A.P.; Varshney, C.K.; Singh, U.K. Seasonal Variations in Isoprene Emission from Tropical Deciduous Tree Species. Environ. Monit. Assess. 2007, 131, 231–235. [Google Scholar] [CrossRef]
  20. Karl, M.; Guenther, A.; Köble, R.; Leip, A.; Seufert, G. A new European plant-specific emission inventory of biogenic volatile organic compounds for use in atmospheric transport models. Biogeosciences 2009, 6, 1059–1087. [Google Scholar] [CrossRef]
  21. Aydin, Y.M.; Yaman, B.; Koca, H.; Dasdemir, O.; Kara, M.; Altiok, H.; Dumanoglu, Y.; Bayram, A.; Tolunay, D.; Odabasi, M.; et al. Biogenic volatile organic compound (BVOC) emissions from forested areas in Turkey: Determination of specific emission rates for thirty-one tree species. Sci. Total Environ. 2014, 490, 239–253. [Google Scholar] [CrossRef]
  22. Fitzky, A.C.; Sandén, H.; Kar, T.; Fares, S.; Calfapietra, C.; Grote, R.; Saunier, A.; Rewald, B. The Interplay Between Ozone and Urban Vegetation—BVOC Emissions, Ozone Deposition, and Tree Ecophysiology. Front. For. Glob. Chang. 2019, 2, 1–17. [Google Scholar] [CrossRef]
  23. Djen, C.S. The urban climate of Shanghai. Atmos. Environ. Part B Urban Atmos. 1992, 26, 9–15. [Google Scholar] [CrossRef]
  24. Hao, R. Analysis and evaluation of soil fertility characteristics of Shanghai urban green area. Acta Agric. Shanghai 2014, 30, 79–84. [Google Scholar]
  25. Xiong, F.; Lyu, J.; Zhou, P.; Yin, S. lsoprene emission rate of five plant species based on in-situ time-of-flight mass spectrometry. J. Shanghai Jiaotong Univ. 2019, 37, 89–94. (In Chinese) [Google Scholar]
  26. Pier, P.A. Isoprene emission rates from northern red oak using a whole-tree chamber. Atmos. Environ. 1995, 29, 1347–1353. [Google Scholar] [CrossRef]
  27. Christof, S.; Bettina, D.; Thomas, K.; Crowley, J.N.; Jonathan, W. Glyoxal measurement with a proton transfer reaction time of flight mass spectrometer (PTR-TOF-MS): Characterization and calibration. J. Mass Spectrom. JMS 2017, 52, 30–35. [Google Scholar]
  28. Taiti, C.; Costa, C.; Nissim, W.G.; Bibbiani, S.; Azzarello, E.; Masi, E.; Pandolfi, C.; Pallottino, F.; Menesatti, P.; Mancuso, S. Assessing VOC emission by different wood cores using the PTR-ToF-MS technology. Wood Sci. Technol. 2017, 51, 273–295. [Google Scholar] [CrossRef]
  29. Guenther, A.B.; Zimmerman, P.R.; Wildermuth, M. Natural volatile organic compound emission rate estimates for U.S. woodland landscapes. Atmos. Environ. 1994, 28, 1197–1210. [Google Scholar]
  30. Jardine, K.J.; Zorzanelli, R.F.; Gimenez, B.O.; Oliveira Piva, L.R.d.; Teixeira, A.; Fontes, C.G.; Robles, E.; Higuchi, N.; Chambers, J.Q.; Martin, S.T. Leaf isoprene and monoterpene emission distribution across hyperdominant tree genera in the Amazon basin. Phytochemistry 2020, 175, 112366. [Google Scholar] [CrossRef]
  31. Guenther, A.B.; Zimmerman, P.R.; Harley, P.C.; Monson, R.K.; Fall, R. Isoprene and monoterpene emission rate variability: Model evaluations and sensitivity analyses. J. Geophys. Res. Atmos. 1993, 98, 12609–12617. [Google Scholar] [CrossRef] [Green Version]
  32. Sanadze, G.A. Biogenic Isoprene (A Review). Russ. J. Plant Physiol. 2004, 51, 729–741. [Google Scholar] [CrossRef]
  33. Monson, R.K.; Jaeger, C.H.; Adams, W.W.; Driggers, E.M.; Silver, G.M.; Fall, R. Relationships among Isoprene Emission Rate, Photosynthesis, and Isoprene Synthase Activity as Influenced by Temperature. Plant Physiol. 2012, 98, 1175–1180. [Google Scholar] [CrossRef] [Green Version]
  34. Lawrence, J.D.; Li, H.; Rauchfuss, T.B.; Bénard, M.; Rohmer, M.M. Diiron Azadithiolates as Models for the Iron-Only Hydrogenase Active Site: Synthesis, Structure, and Stereoelectronics This research was supported by the NIH and the Centre Universitaire et Regional de Ressources Informatiques of ULP and CNRS. Angew. Chem. Int. Ed. Engl. 2001, 40, 1768–1771. [Google Scholar] [CrossRef]
  35. Owen, S.M.; Harley, P.; Guenther, A.; Hewitt, C.N. Light dependency of VOC emissions from selected Mediterranean plant species. Atmos. Environ. 2002, 36, 3147–3159. [Google Scholar] [CrossRef] [Green Version]
  36. Bamberger, I.; Ruehr, N.K.; Schmitt, M.; Gast, A.; Wohlfahrt, G.; Arneth, A. Isoprene emission and photosynthesis during heatwaves and drought in black locust. Biogeosciences 2017, 14, 3649–3667. [Google Scholar] [CrossRef] [Green Version]
  37. Dani, K.G.S.; Benavides, A.M.S.; Michelozzi, M.; Peluso, G.; Torzillo, G.; Loreto, F. Relationship between isoprene emission and photosynthesis in diatoms, and its implications for global marine isoprene estimates. Mar. Chem. 2017, 189, 17–24. [Google Scholar] [CrossRef]
  38. Medeiros, D.B.; Martins, S.C.V.; Cavalcanti, J.H.F.; Daloso, D.M.; Martinoia, E.; Adriano, N.-N.; DaMatta, F.M.; Fernie, A.R.; Araújo, W.L. Enhanced Photosynthesis and Growth in atquac1 Knockout Mutants Are Due to Altered Organic Acid Accumulation and an Increase in Both Stomatal and Mesophyll Conductance. Plant Physiol. 2016, 170, 86–101. [Google Scholar] [CrossRef] [Green Version]
  39. Gago, J.; Daloso, D.; Figueroa, C.M.; Flexas, J.; Fernie, A.R.; Nikoloski, Z. Relationships of leaf net photosynthesis, stomatal conductance, and mesophyll conductance to primary plant metabolism: A multi-species meta-analysis approach. Plant Physiol. 2016, 171, 265–279. [Google Scholar] [CrossRef]
  40. Taylor, S.E.; Terry, N. Limiting Factors in Photosynthesis: V. Photochemical Energy Supply Colimits Photosynthesis at Low Values of Intercellular CO2 Concentration. Plant Physiol. 1984, 75, 82–86. [Google Scholar] [CrossRef] [Green Version]
  41. Fila, G.; Badeck, F.-W.; Meyer, S.; Cerovic, Z.; Ghashghaie, J. Relationships between leaf conductance to CO2 diffusion and photosynthesis in micropropagated grapevine plants, before and after ex vitro acclimatization. J. Exp. Bot. 2006, 57, 2687–2695. [Google Scholar] [CrossRef] [Green Version]
  42. Tiiva, P.; Faubert, P.; Michelsen, A.; Holopainen, T.; Holopainen, J.K.; Rinnan, R. Climatic warming increases isoprene emission from a subarctic heath. New Phytol. 2008, 180, 853–863. [Google Scholar] [CrossRef]
  43. Nguyen, T.B.; Roach, P.J.; Laskin, J.; Physics, A.L.C. Effect of humidity on the composition and yield of isoprene photooxidation secondary organic aerosol. Atmos. Chem. Phys. Discuss. 2011, 11, 9217–9248. [Google Scholar] [CrossRef]
  44. Lamb, B.; Guenther, A.; Gay, D.; Westberg, H. A national inventory of biogenic hydrocarbon emissions. Atmos. Environ. 1987, 21, 1695–1705. [Google Scholar] [CrossRef] [Green Version]
  45. Grote, R.; Samson, R.; Alonso, R.; Amorim, J.H.; Cariñanos, P.; Churkina, G.; Fares, S.; Thiec, D.L.; Niinemets, Ü.; Mikkelsen, T.N. Functional traits of urban trees: Air pollution mitigation potential. Front. Ecol. Environ. 2017, 14, 543–550. [Google Scholar] [CrossRef]
  46. Ghirardo, A.; Xie, J.; Zheng, X.; Wang, Y.; Grote, R.; Block, K.; Wildt, J.; Mentel, T.; Kiendler-Scharr, A.; Hallquist, M. Urban stress-induced biogenic VOC emissions and SOA-forming potentials in Beijing. Atmos. Chem. Phys. 2016, 16, 2901–2920. [Google Scholar] [CrossRef] [Green Version]
  47. Bureau, S.L.C.A.A. Optimizing the Layout of Street Trees and Tree Species to Create “One Street, One Scene” in Shencheng (in Chinese). 2020. Available online: http://lhsr.sh.gov.cn/zz202003/20200714/324d149b95e94333b497aaeda194c22c.html (accessed on 10 December 2020).
  48. Gallaun, H.; Zanchi, G.; Nabuurs, G.-J.; Hengeveld, G.; Schardt, M.; Verkerk, P.J. EU-wide maps of growing stock and above-ground biomass in forests based on remote sensing and field measurements. For. Ecol. Manag. 2010, 260, 252–261. [Google Scholar] [CrossRef]
  49. Cai, C.; Geng, F.; Tie, X.; Yu, Q.; An, J. Characteristics and source apportionment of VOCs measured in Shanghai, China. Atmos. Environ. 2010, 44, 5005–5014. [Google Scholar] [CrossRef]
  50. Guo, H.; Chen, K.; Wang, P.; Hu, J.; Zhang, H. Simulation of summer ozone and its sensitivity to emission changes in China. Atmos. Pollut. Res. 2019, 10, 1543–1552. [Google Scholar] [CrossRef]
  51. Dani, K.G.S.; Jamie, I.M.; Prentice, I.C.; Atwell, B.J. Evolution of isoprene emission capacity in plants. Trends Plant Sci. 2014, 19, 439–446. [Google Scholar] [CrossRef]
  52. Fares, S.; Gentner, D.R.; Park, J.H.; Ormeno, E.; Karlik, J.; Goldstein, A.H. Biogenic emissions from Citrus species in California. Atmos. Environ. 2011, 45, 4557–4568. [Google Scholar] [CrossRef]
  53. Pokorska, O.; Dewulf, J.; Amelynck, C.; Schoon, N.; Joo, E.; Simpraga, M.; Bloemen, J.; Steppe, K.; Langenhove, H.V. Emissions of biogenic volatile organic compounds from Fraxinus excelsior and Quercus robur under ambient conditions in Flanders (Belgium). Int. J. Environ. Anal. Chem. 2012, 92, 1729–1741. [Google Scholar] [CrossRef]
Figure 1. Leaves and shoots of the 10 tree species included in the study.
Ijerph 18 00954 g001
Figure 2. Sampling and measurement of isoprene emission rate. TOF-MS = time of flight mass spectrometry.
Ijerph 18 00954 g002
Figure 3. Isoprene emission rates of 10 typical plants in different seasons. a, b, c, d, e—within a season, species not sharing a common letter differ significantly (α = 0.01) in emission rate. ND = not detectable. NA = not available (Salix babylonica and Ginkgo biloba defoliated in autumn and winter).
Ijerph 18 00954 g003
Figure 4. Correlation matrix of variables measured (*** p < 0.001; ** p < 0.01; * p < 0.05). The data has been standardized. RATE = isoprene emission rate; PN = net photosynthesis rate; COND = stomatal conductance; CI = intercellular CO2 concentration; TR = transpiration rate; PAR = photosynthetically active radiation; HUMI = humidity; TEMP = temperature.
Ijerph 18 00954 g004
Figure 5. Principal component analysis of the 7 parameters. (a) Representation of the correlation coefficient between the principal components and the parameters. (b) Representation of the emission rate of 10 tree species in two seasons. F1 = the first principal component; F2 = the second principal component.
Ijerph 18 00954 g005
Table 1. Photosynthesis and related physiological parameters. Species are listed in decreasing order of photosynthetic rate in spring.
SpeciesPhotosynthetic Rate (μmol CO2·m−2·s−1)Intercellular CO2 Concentration (μmol CO2·mol−1)Stomatal Conductance (mol H2O·m−2·s−1)Transpiration Rate (mmol H2O·m−2·s−1)
Spr.Sum.Spr.Sum.Spr.Sum.Spr.Sum.
Salix babylonica9.6 ± 1.811.8 ± 2.2273.3 ± 11.9258.0 ± 13.50.14 ± 0.040.18 ± 0.053.98 ± 0.993.21 ± 0.73
Ginkgo biloba9.2 ± 0.99.0 ± 1.5260.7 ± 16.4262.2 ± 11.80.11 ± 0.010.13 ± 0.012.49 ± 0.202.76 ± 0.19
Cinnamomum camphora8.4 ± 1.110.6 ± 1.5367.2 ± 13.5216.6 ± 53.30.10 ± 0.010.09 ± 0.041.73 ± 0.081.66 ± 0.50
Magnolia grandiflora7.6 ± 0.89.9 ± 1.9296.8 ± 16.8264.0 ± 6.50.09 ± 0.010.16 ± 0.011.76 ± 0.182.77 ± 0.30
Elaeocarpus decipiens6.6 ± 0.812.3 ± 0.7281.1 ± 14.4226.9 ± 18.20.06 ± 0.020.08 ± 0.011.84 ± 0.331.30 ± 0.23
Fatsia japonica6.4 ± 0.48.1 ± 0.7239.6 ± 7.0273.4 ± 13.20.09 ± 0.020.14 ± 0.021.98 ± 0.332.92 ± 0.36
Viburnum odoratissimum6.3 ± 0.811.2 ± 0.8272.5 ± 12.1228.2 ± 7.00.09 ± 0.010.14 ± 0.022.14 ± 0.232.78 ± 0.26
Osmanthus fragrans5.6 ± 0.614.0 ± 1.4232.2 ± 32.5251.2 ± 17.20.06 ± 0.010.12 ± 0.031.76 ± 0.262.05 ± 0.40
Photinia× fraseri5.4 ± 0.710.3 ± 1.1281.7 ± 15.5218.9 ± 25.70.07 ± 0.010.07 ± 0.011.62 ± 0.261.82 ± 0.04
Ligustrum lucidum4.9 ± 0.48.1 ± 0.6272.2 ± 11.4259.3 ± 16.80.06 ± 0.010.11 ± 0.031.80 ± 0.182.61 ± 0.60
Publisher’s Note: MDPI stays neutral with regard to jurisdictional claims in published maps and institutional affiliations.

