
Multiplex Analysis of Adipose-Derived Stem Cell (ASC) Immunophenotype Adaption to In Vitro Expansion

 ,
,  , ,
, ,  , and
, and
Abstract
:1. Introduction
2. Materials and Methods
2.1. Cell Isolation and Culture
2.2. Multichromatic Flow Cytometry (MFC)
2.3. Statistical Analysis
3. Results
3.1. Phenotypical Variant Evolution
3.2. Interpersonal Variability
4. Discussion
Author Contributions
Funding
Institutional Review Board Statement
Informed Consent Statement
Data Availability Statement
Acknowledgments
Conflicts of Interest
Appendix A

| Antigen | Fluorophore | Host | Company | Cat. No. |
|---|---|---|---|---|
| CD29 | BV650 | M | BD Biosciences | 743785 |
| CD31 | APC-Cy7 | M | BD Biosciences | 563653 |
| CD34 | PE-Cy7 | M | BD Biosciences | 560710 |
| CD36 | BV605 | M | BD Biosciences | 563518 |
| CD146 | PE-CF594 | M | BD Biosciences | 564327 |
| CD166 | BV605 | M | BD Biosciences | 742373 |
| CD200 | BV510 | M | BD Biosciences | 563254 |
| CD201 | BV421 | R | BD Biosciences | 743552 |
| CD248 | BV421 | M | BD Biosciences | 743899 |
| CD271 | BB515 | M | BD Biosciences | 562125 |
| CD274 | APC-R700 | M | BD Biosciences | 565188 |
| Stro-1 | Alexa Fluor 647 | M | R & D system | FAB1038R |
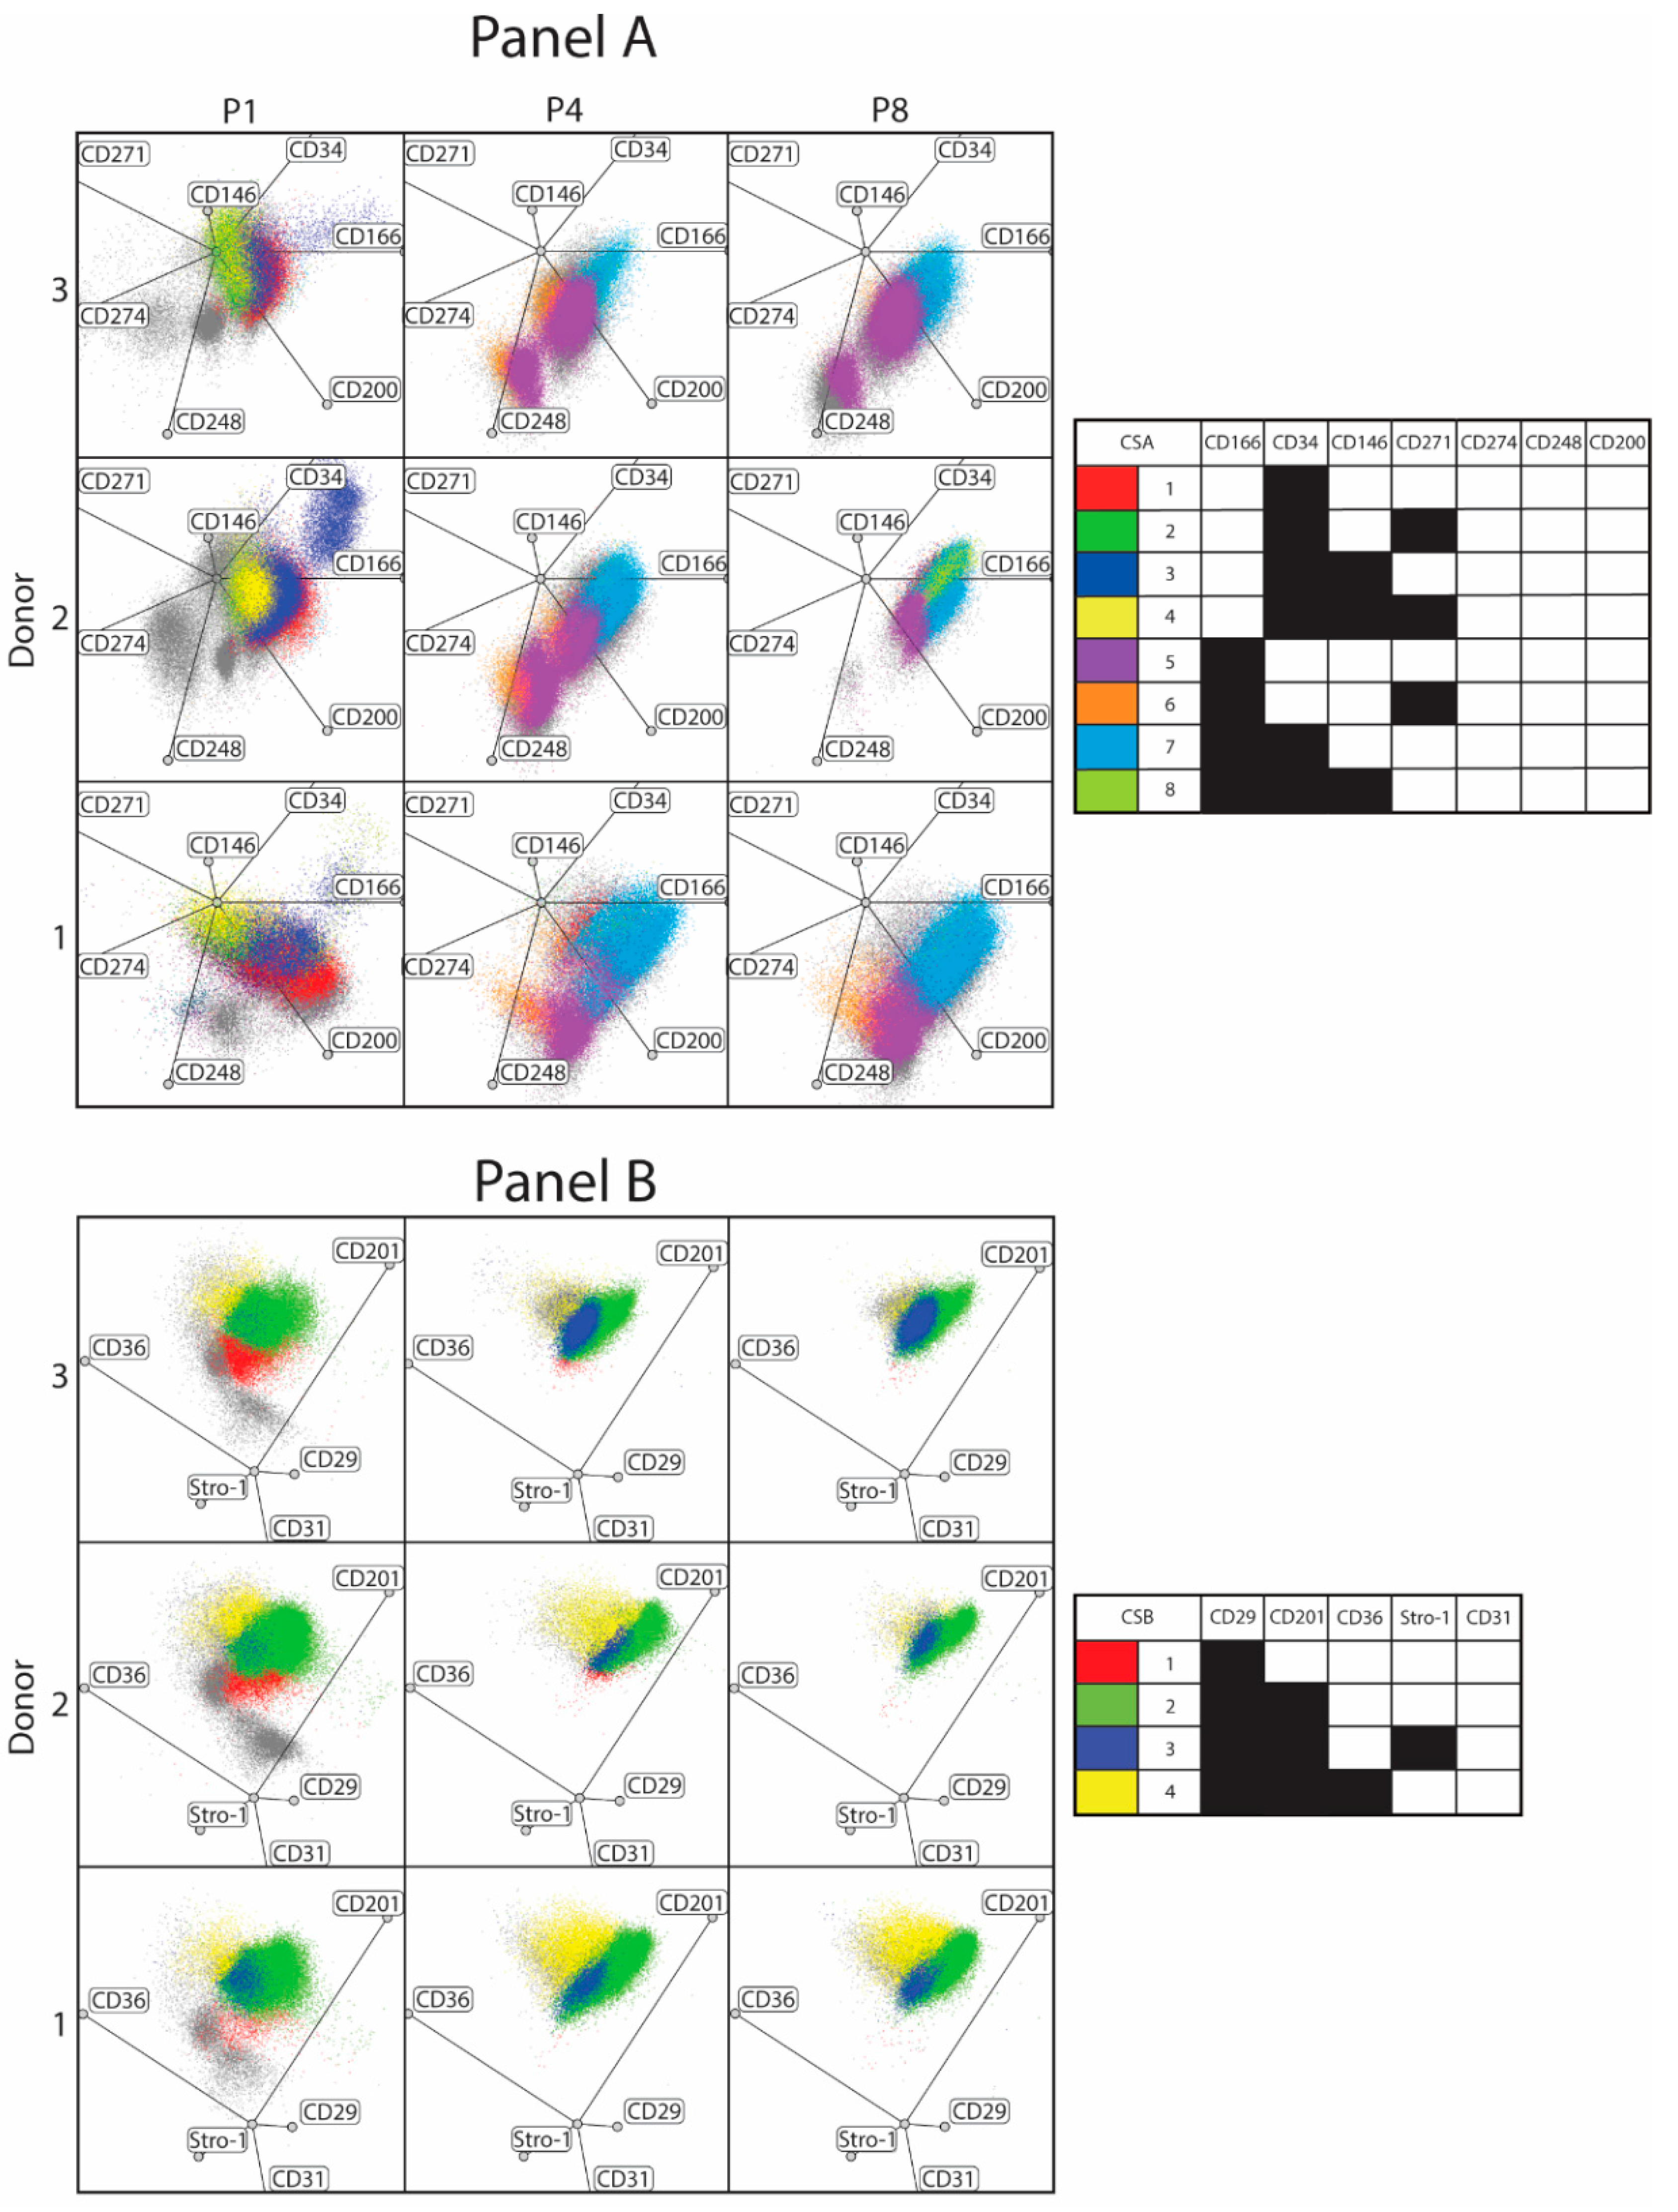
| CSA 1 | CSA 2 | CSA 3 | CSA 4 | CSA 5 | CSA 6 | CSA 7 | CSA 8 | CSB 1 | CSB 2 | CSB 3 | CSB 4 | ||
|---|---|---|---|---|---|---|---|---|---|---|---|---|---|
| P1 | D1 | 13.5 | 7.4 | 8.3 | 7.5 | 0.2 | 0.0 | 6.3 | 3.8 | 2.8 | 82.1 | 4.3 | 4.6 |
| D2 | 15.0 | 5.6 | 28.9 | 14.5 | 0.4 | 0.1 | 3.5 | 4.4 | 6.8 | 79.1 | 1.8 | 5.4 | |
| D3 | 22.9 | 21.6 | 10.5 | 17.2 | 0.2 | 0.2 | 2.2 | 1.4 | 9.5 | 70.4 | 2.7 | 4.9 | |
| P4 | D1 | 0.0 | 0.0 | 0.0 | 0.0 | 26.6 | 4.2 | 42.8 | 0.8 | 0.0 | 75.4 | 4.1 | 13.8 |
| D2 | 0.0 | 0.0 | 0.0 | 0.0 | 38.5 | 4.0 | 37.4 | 0.8 | 15.9 | 63.1 | 5.0 | 7.2 | |
| D3 | 0.0 | 0.0 | 0.0 | 0.0 | 43.9 | 7.2 | 14.9 | 3.6 | 0.2 | 75.3 | 14.9 | 3.2 | |
| P8 | D1 | 0.0 | 0.0 | 0.0 | 0.0 | 27.6 | 4.0 | 36.4 | 0.6 | 0.1 | 75.3 | 5.7 | 14.8 |
| D2 | 0.0 | 0.0 | 0.0 | 0.0 | 10.2 | 0.1 | 53.5 | 20.2 | 0.2 | 86.7 | 5.8 | 3.5 | |
| D3 | 0.0 | 0.0 | 0.0 | 0.0 | 31.6 | 0.5 | 29.9 | 1.4 | 0.1 | 77.6 | 17.3 | 1.4 |
References
- Zuk, P.A.; Zhu, M.; Ashjian, P.; De Ugarte, D.A.; Huang, J.I.; Mizuno, H.; Alfonso, Z.C.; Fraser, J.K.; Hedrick, M.H. Human Adipose Tissue Is a Source of Multipotent Stem Cells D□. Mol. Biol. Cell 2002, 13, 4279–4295. [Google Scholar] [CrossRef] [PubMed]
- Dominici, M.; Paolucci, P.; Conte, P.; Horwitz, E.M. Heterogeneity of Multipotent Mesenchymal Stromal Cells: From Stromal Cells to Stem Cells and Vice Versa. Transplantation 2009, 87, S36–S42. [Google Scholar] [CrossRef] [PubMed]
- Riis, S.; Stensballe, A.; Emmersen, J.; Pennisi, C.P.; Birkelund, S.; Zachar, V.; Fink, T. Mass spectrometry analysis of adipose-derived stem cells reveals a significant effect of hypoxia on pathways regulating extracellular matrix. Stem Cell Res. Ther. 2016, 7, 52. [Google Scholar] [CrossRef] [PubMed] [Green Version]
- Zachar, V.; Duroux, M.; Emmersen, J.; Rasmussen, J.G.; Pennisi, C.P.; Yang, S.; Fink, T. Hypoxia and adipose-derived stem cell-based tissue regeneration and engineering. Expert Opin. Biol. Ther. 2011, 11, 775–786. [Google Scholar] [CrossRef] [PubMed]
- Rasmussen, J.G.; Riis, S.E.; Frøbert, O.; Yang, S.; Kastrup, J.; Zachar, V.; Simonsen, U.; Fink, T. Activation of Protease-Activated Receptor 2 Induces VEGF Independently of HIF-1. PLoS ONE 2012, 7, e46087. [Google Scholar] [CrossRef] [PubMed] [Green Version]
- Hyldig, K.; Riis, S.; Pennisi, C.P.; Zachar, V.; Fink, T. Implications of extracellular matrix production by adipose tissue-derived stem cells for development of wound healing therapies. Int. J. Mol. Sci. 2017, 18, 1167. [Google Scholar] [CrossRef] [Green Version]
- Riis, S.; Newman, R.; Ipek, H.; Andersen, J.I.; Kuninger, D.; Boucher, S.; Vemuri, M.C.; Pennisi, C.P.; Zachar, V.; Fink, T. Hypoxia enhances the wound-healing potential of adipose-derived stem cells in a novel human primarykeratinocyte-based scratch assay. Int. J. Mol. Med. 2017, 39, 587–594. [Google Scholar] [CrossRef] [Green Version]
- Sawada, K.; Takedachi, M.; Yamamoto, S.; Morimoto, C.; Ozasa, M.; Iwayama, T.; Lee, C.M.; Okura, H.; Matsuyama, A.; Kitamura, M.; et al. Trophic factors from adipose tissue-derived multi-lineage progenitor cells promote cytodifferentiation of periodontal ligament cells. Biochem. Biophys. Res. Commun. 2015, 464, 299–305. [Google Scholar] [CrossRef] [Green Version]
- Bateman, M.E.; Strong, A.L.; Gimble, J.M.; Bunnell, B.A. Concise Review: Using Fat to Fight Disease: A Systematic Review of Nonhomologous Adipose-Derived Stromal/Stem Cell Therapies. Stem Cells 2018, 36, 1311–1328. [Google Scholar] [CrossRef] [Green Version]
- Pak, J.; Lee, J.H.; Kartolo, W.A.; Lee, S.H. Cartilage Regeneration in Human with Adipose Tissue-Derived Stem Cells: Current Status in Clinical Implications. Biomed. Res. Int. 2016, 2016. [Google Scholar] [CrossRef] [Green Version]
- Ma, T.; Sun, J.; Zhao, Z.; Lei, W.; Chen, Y.; Wang, X.; Yang, J.; Shen, Z. A brief review: Adipose-derived stem cells and their therapeutic potential in cardiovascular diseases. Stem Cell Res. Ther. 2017, 8, 124. [Google Scholar] [CrossRef] [PubMed] [Green Version]
- Kosaraju, R.; Rennert, R.C.; Maan, Z.N.; Duscher, D.; Barrera, J.; Whittam, A.J.; Januszyk, M.; Rajadas, J.; Rodrigues, M.; Gurtner, G.C. Adipose-Derived Stem Cell-Seeded Hydrogels Increase Endogenous Progenitor Cell Recruitment and Neovascularization in Wounds. Tissue Eng. Part A 2016, 22, 295–305. [Google Scholar] [CrossRef] [PubMed] [Green Version]
- Henriksen, J.L.; Sørensen, N.B.; Fink, T.; Zachar, V.; Porsborg, S.R. Systematic Review of Stem-Cell-Based Therapy of Burn Wounds: Lessons Learned from Animal and Clinical Studies. Cells 2020, 9, 2545. [Google Scholar] [CrossRef] [PubMed]
- Gao, H.; Volat, F.; Sandhow, L.; Galitzky, J.; Nguyen, T.; Esteve, D.; Åström, G.; Mejhert, N.; Ledoux, S.; Thalamas, C.; et al. CD36 Is a Marker of Human Adipocyte Progenitors with Pronounced Adipogenic and Triglyceride Accumulation Potential. Stem Cells 2017, 35, 1799–1814. [Google Scholar] [CrossRef] [PubMed] [Green Version]
- Brett, E.; Zielins, E.R.; Chin, M.; Januszyk, M.; Blackshear, C.P.; Findlay, M.; Momeni, A.; Gurtner, G.C.; Longaker, M.T.; Wan, D.C. Isolation of CD248-expressing stromal vascular fraction for targeted improvement of wound healing. Wound Repair Regen. 2017, 25, 414–422. [Google Scholar] [CrossRef] [PubMed]
- Beckenkamp, L.R.; Souza, L.E.B.; Melo, F.U.F.; Thomé, C.H.; Magalhães, D.A.R.; Palma, P.V.B.; Covas, D.T. Comparative characterization of CD271+ and CD271− subpopulations of CD34+ human adipose-derived stromal cells. J. Cell. Biochem. 2018, 119, 3873–3884. [Google Scholar] [CrossRef] [PubMed]
- Levi, B.; Wan, D.C.; Glotzbach, J.P.; Hyun, J.; Januszyk, M.; Montoro, D.; Sorkin, M.; James, A.W.; Nelson, E.R.; Li, S.; et al. CD105 protein depletion enhances human adipose-derived stromal cell osteogenesis through reduction of transforming growth factor β1 (TGF-β1) signaling. J. Biol. Chem. 2011, 286, 39497–39509. [Google Scholar] [CrossRef] [Green Version]
- Mihaila, S.M.; Frias, A.M.; Pirraco, R.P.; Rada, T.; Reis, R.L.; Gomes, M.E.; Marques, A.P. Human adipose tissue-derived SSEA-4 subpopulation multi-differentiation potential towards the endothelial and osteogenic lineages. Tissue Eng. Part A 2013, 19, 235–246. [Google Scholar] [CrossRef] [Green Version]
- Rada, T.; Santos, T.C.; Marques, A.P.; Correlo, V.M.; Frias, A.M.; Castro, A.G.; Neves, N.M.; Gomes, M.E.; Reis, R.L. Osteogenic differentiation of two distinct subpopulations of human adipose-derived stem cells: An in vitro and in vivo study. J. Tissue Eng. Regen. Med. 2012, 6, 1–11. [Google Scholar] [CrossRef] [Green Version]
- Najar, M.; Raicevic, G.; Jebbawi, F.; De Bruyn, C.; Meuleman, N.; Bron, D.; Toungouz, M.; Lagneaux, L. Characterization and functionality of the CD200-CD200R system during mesenchymal stromal cell interactions with T-lymphocytes. Immunol. Lett. 2012, 146, 50–56. [Google Scholar] [CrossRef]
- Li, X.; Guo, W.; Zha, K.; Jing, X.; Wang, M.; Zhang, Y.; Hao, C.; Gao, S.; Chen, M.; Yuan, Z.; et al. Enrichment of CD146+ adipose-derived stem cells in combination with articular cartilage extracellular matrix scaffold promotes cartilage regeneration. Theranostics 2019, 9, 5105–5121. [Google Scholar] [CrossRef] [PubMed]
- Borrelli, M.R.; Patel, R.A.; Blackshear, C.; Vistnes, S.; Diaz Deleon, N.M.; Adem, S.; Shen, A.H.; Sokol, J.; Momeni, A.; Nguyen, D.; et al. CD34+CD146+ adipose-derived stromal cells enhance engraftment of transplanted fat. Stem Cells Transl. Med. 2020, 9, 1389–1400. [Google Scholar] [CrossRef] [PubMed]
- Brinkhof, B.; Zhang, B.; Cui, Z.; Ye, H.; Wang, H. ALCAM (CD166) as a gene expression marker for human mesenchymal stromal cell characterisation. Gene X 2020, 5, 100031. [Google Scholar] [CrossRef] [PubMed]
- Nielsen, F.M.; Riis, S.E.; Andersen, J.I.; Lesage, R.; Fink, T.; Pennisi, C.P.; Zachar, V. Discrete adipose-derived stem cell subpopulations may display differential functionality after in vitro expansion despite convergence to a common phenotype distribution. Stem Cell Res. Ther. 2016, 7, 177. [Google Scholar] [CrossRef] [PubMed] [Green Version]
- Yang, S.; Pilgaard, L.; Chase, L.G.; Boucher, S.; Vemuri, M.C.; Fink, T.; Zachar, V. Defined xenogeneic-free and hypoxic environment provides superior conditions for long-term expansion of human adipose-derived stem cells. Tissue Eng. Part C Methods 2012, 18, 593–602. [Google Scholar] [CrossRef]
- Baer, P.C.; Kuçi, S.; Krause, M.; Kuçi, Z.; Zielen, S.; Geiger, H.; Bader, P.; Schubert, R. Comprehensive phenotypic characterization of human adipose-derived stromal/stem cells and their subsets by a high throughput technology. Stem Cells Dev. 2013, 22, 330–339. [Google Scholar] [CrossRef]
- Reumann, M.K.; Linnemann, C.; Aspera-Werz, R.H.; Arnold, S.; Held, M.; Seeliger, C.; Nussler, A.K.; Ehnert, S. Donor site location is critical for proliferation, stem cell capacity, and osteogenic differentiation of adipose mesenchymal stem/stromal cells: Implications for bone tissue engineering. Int. J. Mol. Sci. 2018, 19, 1868. [Google Scholar] [CrossRef] [Green Version]
- Peng, Q.; Alipour, H.; Porsborg, S.; Fink, T.; Zachar, V. Evolution of asc immunophenotypical subsets during expansion In Vitro. Int. J. Mol. Sci. 2020, 21, 1408. [Google Scholar] [CrossRef] [Green Version]
- Zachar, V.; Rasmussen, J.G.; Fink, T. Isolation and growth of adipose tissue-derived stem cells. Methods Mol. Biol. 2011, 698, 37–49. [Google Scholar]
- Riis, S.; Nielsen, F.M.; Pennisi, C.P.; Zachar, V.; Fink, T. Comparative Analysis of Media and Supplements on Initiation and Expansion of Adipose-Derived Stem Cells. Stem Cells Transl. Med. 2016, 5, 314–324. [Google Scholar] [CrossRef]
- Calabrese, G.; Giuffrida, R.; Lo Furno, D.; Parrinello, N.L.; Forte, S.; Gulino, R.; Colarossi, C.; Schinocca, L.R.; Giuffrida, R.; Cardile, V.; et al. Potential effect of CD271 on human mesenchymal stromal cell proliferation and differentiation. Int. J. Mol. Sci. 2015, 16, 15609–15624. [Google Scholar] [CrossRef] [PubMed] [Green Version]
- Chung, M.T.; Liu, C.; Hyun, J.S.; Lo, D.D.; Montoro, D.T.; Hasegawa, M.; Li, S.; Sorkin, M.; Rennert, R.; Keeney, M.; et al. CD90 (Thy-1)-positive selection enhances osteogenic capacity of human adipose-derived stromal cells. Tissue Eng. Part A 2013, 19, 989–997. [Google Scholar] [CrossRef] [PubMed] [Green Version]
- Rada, T.; Reis, R.L.; Gomes, M.E. Distinct Stem Cells Subpopulations Isolated from Human Adipose Tissue Exhibit Different Chondrogenic and Osteogenic Differentiation Potential. Stem Cell Rev. Rep. 2011, 7, 64–76. [Google Scholar] [CrossRef] [PubMed] [Green Version]
- Riis, S.; Zachar, V.; Boucher, S.; Vemuri, M.C.; Pennisi, C.P.; Fink, T. Critical steps in the isolation and expansion of adipose-derived stem cells for translational therapy. Expert Rev. Mol. Med. 2015, 17, e11. [Google Scholar] [CrossRef] [PubMed]
- Rezai Rad, M.; Bohloli, M.; Akhavan Rahnama, M.; Anbarlou, A.; Nazeman, P.; Khojasteh, A. Impact of tissue harvesting sites on the cellular behaviors of adipose-derived stem cells: Implication for bone tissue engineering. Stem Cells Int. 2017, 2017. [Google Scholar] [CrossRef] [Green Version]
- Mitchell, J.B.; McIntosh, K.; Zvonic, S.; Garrett, S.; Floyd, Z.E.; Kloster, A.; Di Halvorsen, Y.; Storms, R.W.; Goh, B.; Kilroy, G.; et al. Immunophenotype of Human Adipose-Derived Cells: Temporal Changes in Stromal-Associated and Stem Cell-Associated Markers. Stem Cells 2006, 24, 376–385. [Google Scholar] [CrossRef] [PubMed]
- Suga, H.; Matsumoto, D.; Eto, H.; Inoue, K.; Aoi, N.; Kato, H.; Araki, J.; Yoshimura, K. Functional implications of CD34 expression in human adipose-derived stem/progenitor cells. Stem Cells Dev. 2009, 18, 1201–1209. [Google Scholar] [CrossRef] [Green Version]
- De Francesco, F.; Tirino, V.; Desiderio, V.; Ferraro, G.; D’Andrea, F.; Giuliano, M.; Libondi, G.; Pirozzi, G.; De Rosa, A.; Papaccio, G. Human CD34+/CD90+ ASCs are capable of growing as sphere clusters, producing high levels of VEGF and forming capillaries. PLoS ONE 2009, 4, e6537. [Google Scholar] [CrossRef] [Green Version]
- Ferraro, G.A.; De Francesco, F.; Nicoletti, G.; Paino, F.; Desiderio, V.; Tirino, V.; D’Andrea, F. Human adipose CD34+CD90+ stem cells and collagen scaffold constructs grafted in vivo fabricate loose connective and adipose tissues. J. Cell. Biochem. 2013, 114, 1039–1049. [Google Scholar] [CrossRef]


| Laser | Channel | Dye | Panel A | Panel B |
|---|---|---|---|---|
| 405 nm | 450/45 BP | BV421 | CD248 | CD201 |
| 525/40 BP | BV510 | CD200 | ||
| 610/20 BP | BV605 | CD166 | CD36 | |
| 660/20 BP | BV650 | CD29 | ||
| 561 nm | 610/20 BP | PE-CF594 | CD146 | |
| 585/42 BP | FVS570 | + | + | |
| 780/60 BP | PE-Cy7 | CD34 | ||
| 638 nm | 660/20 BP | Alexa Fluor 647 | Stro-1 | |
| 712/25 BP | APC-R700 | CD274 | ||
| 780/60 BP | APC-Cy7 | CD31 | ||
| 488 nm | 525/40 BP | BB515 | CD271 |
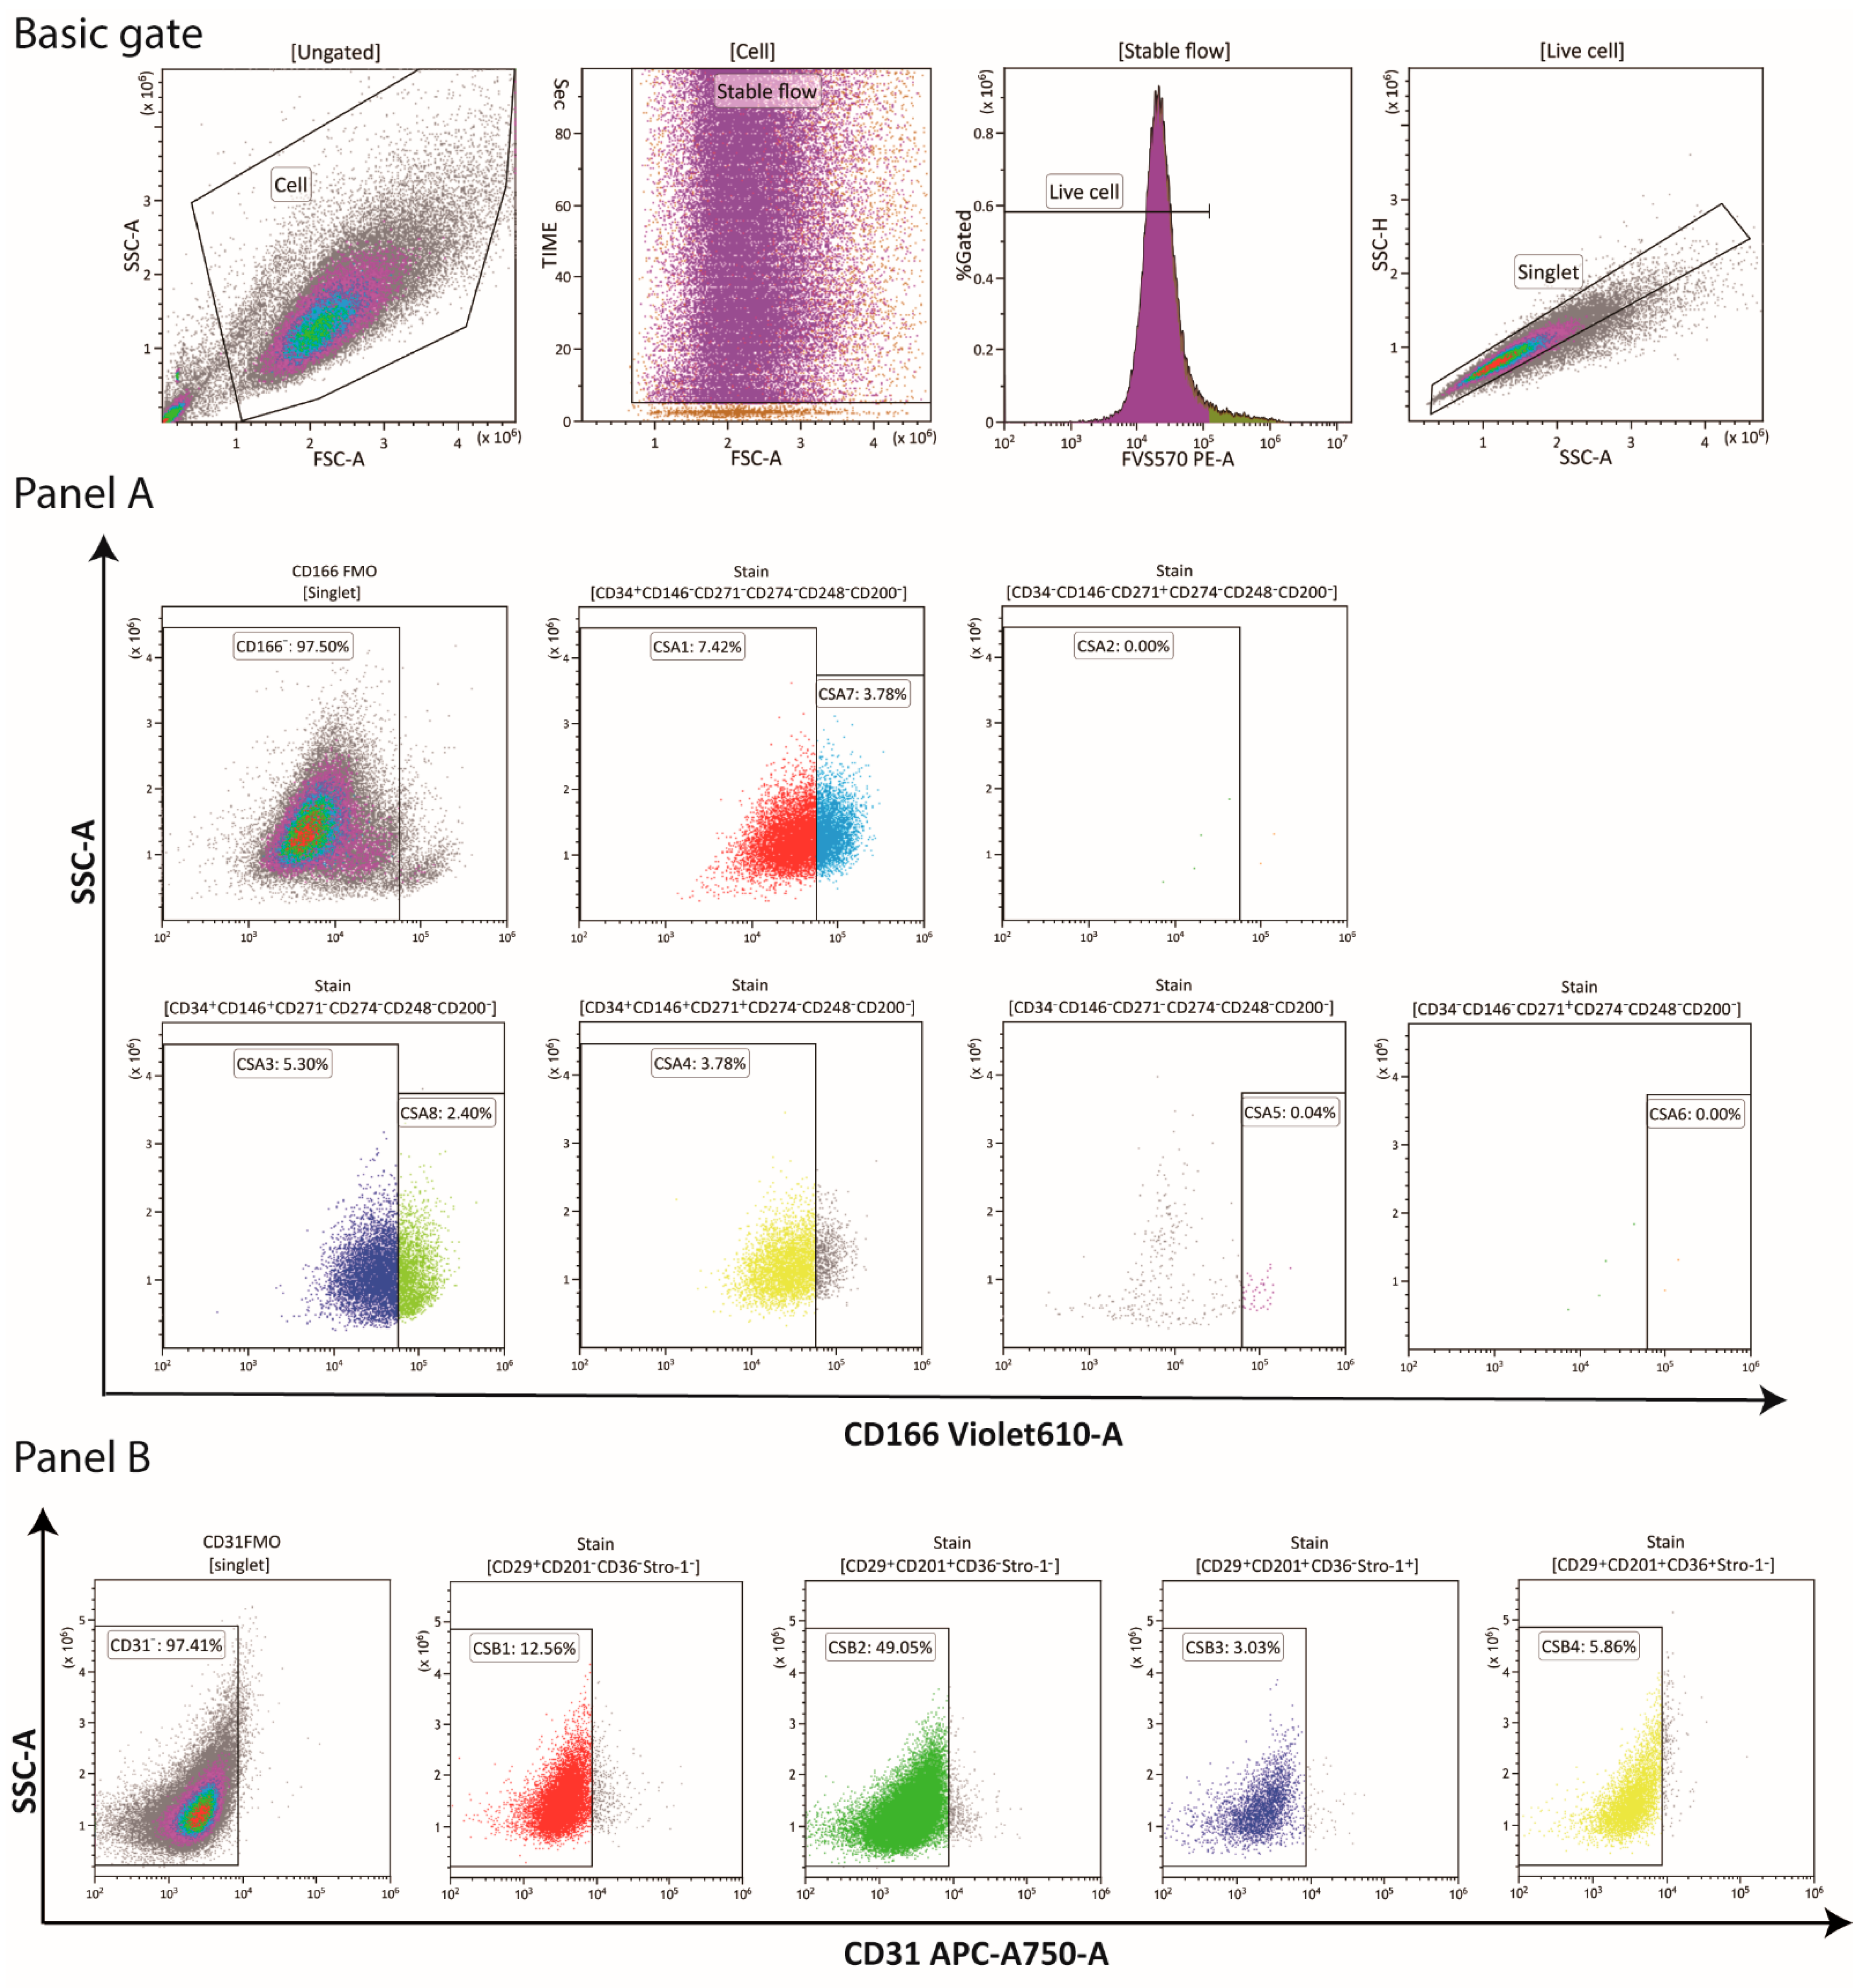
| Panel | Subpopulation | Immunophenotype Profile |
|---|---|---|
| A | CSA1 | CD166–CD34+CD146–CD271–CD274–CD248–CD200– |
| A | CSA2 | CD166–CD34+CD146–CD271+CD274–CD248–CD200– |
| A | CSA3 | CD166–CD34+CD146+CD271–CD274–CD248–CD200– |
| A | CSA4 | CD166–CD34+CD146+CD271+CD274–CD248–CD200– |
| A | CSA5 | CD166+CD34–CD146–CD271–CD274–CD248–CD200– |
| A | CSA6 | CD166+CD34–CD146–CD271+CD274–CD248–CD200– |
| A | CSA7 | CD166+CD34+CD146–CD271–CD274–CD248–CD200– |
| A | CSA8 | CD166+CD34+CD146+CD271–CD274–CD248–CD200– |
| B | CSB1 | CD29+CD201–CD36– Stro-1–CD31– |
| B | CSB2 | CD29+CD201+CD36–Stro-1–CD31– |
| B | CSB3 | CD29+CD201+CD36–Stro-1+CD31– |
| B | CSB4 | CD29+CD201+CD36+Stro-1–CD31– |
Publisher’s Note: MDPI stays neutral with regard to jurisdictional claims in published maps and institutional affiliations. |
© 2021 by the authors. Licensee MDPI, Basel, Switzerland. This article is an open access article distributed under the terms and conditions of the Creative Commons Attribution (CC BY) license (http://creativecommons.org/licenses/by/4.0/).
Share and Cite
Peng, Q.; Duda, M.; Ren, G.; Xuan, Z.; Pennisi, C.P.; Porsborg, S.R.; Fink, T.; Zachar, V. Multiplex Analysis of Adipose-Derived Stem Cell (ASC) Immunophenotype Adaption to In Vitro Expansion. Cells 2021, 10, 218. https://doi.org/10.3390/cells10020218
Peng Q, Duda M, Ren G, Xuan Z, Pennisi CP, Porsborg SR, Fink T, Zachar V. Multiplex Analysis of Adipose-Derived Stem Cell (ASC) Immunophenotype Adaption to In Vitro Expansion. Cells. 2021; 10(2):218. https://doi.org/10.3390/cells10020218
Chicago/Turabian StylePeng, Qiuyue, Martyna Duda, Guoqiang Ren, Zongzhe Xuan, Cristian Pablo Pennisi, Simone Riis Porsborg, Trine Fink, and Vladimir Zachar. 2021. "Multiplex Analysis of Adipose-Derived Stem Cell (ASC) Immunophenotype Adaption to In Vitro Expansion" Cells 10, no. 2: 218. https://doi.org/10.3390/cells10020218