
Assessment of TAF, METAR, and SPECI Reports Based on ICAO ANNEX 3 Regulation


1
Ministry of Defence of the Czech Republic, Tychonova 1, 160 01 Praha, Czech Republic
2
Military Geographic and Hydrometeorological Office, Čs. Odboje 676, 518 16 Dobruska, Czech Republic
3
Martin Gera, Department of Astronomy, Physics of the Earth, and Meteorology, Comenius University in Bratislava, Mlynská Dolina, 842 48 Bratislava, Slovakia
4
Department of Military Geography and Meteorology, University of Defence, Kounicova 65, 662 10 Brno, Czech Republic
*
Author to whom correspondence should be addressed.
†
Formerly.
Atmosphere 2021, 12(2), 138; https://doi.org/10.3390/atmos12020138
Submission received: 13 November 2020
/
Revised: 14 January 2021
/
Accepted: 18 January 2021
/
Published: 22 January 2021
(This article belongs to the Special Issue Weather and Aviation Safety)
Abstract
:The Terminal Aerodrome Forecast (TAF) is one of the most prominent and widely accepted forecasting tools for flight planning. The reliability of this instrument is crucial for its practical applicability, and its quality may further affect the overall air transport safety and economic efficiency. The presented study seeks to objectify the assessment of the success rate of TAFs in the full breadth of their scope, unlike alternative approaches that typically analyze one selected element. It aspires to submit a complex survey on TAF realization in the context of ANNEX 3 (a regulation for Meteorological Service for International Air Navigation issued by the International Civil Aviation Organization (ICAO)) defined methodology and to provoke a discussion on the clarification and completion of ANNEX 3. Moreover, the adherence of TAFs to ICAO ANNEX 3 (20th Edition) is examined and presented on the example of reports issued in the Czech Republic. The study evaluates the accuracy of TAF forecast verified by Aerodrome Routine Meteorological Report (METAR) and Special Meteorological Report (SPECI), whose quality was assessed first. The required accuracy of TAFs was achieved for most evaluated stations. A discrepancy in terms of formal structure between actually issued reports and the ANNEX 3 defined form was revealed in over 90% of reports. The study identifies ambiguities and contradictions contained in ANNEX 3 that lead to loose interpretations of its stipulations and complicate the objectification of TAF evaluation.
1. Introduction
The Terminal Aerodrome Forecast (TAF), Aerodrome Routine Meteorological Report (METAR), and irregularly issued Special Meteorological Report (SPECI) are internationally standardized reports intended to ensure an orderly flow of air traffic. The study focuses on the evaluation of formal error occurrence in the meteorological reports, the justification of their issuance, and the assessment of the success rate of TAF on the basis of a dataset amassed over several years. It strives for the utmost thoroughness in the application of criteria and rules for elaborating and assessing those reports incorporated in the ANNEX 3 Meteorological Service for International Air Navigation issued by the International Civil Aviation Organization (ICAO) (20th Edition) [1]. The study also offers the identification of inherent problems, opacity, and inconsistencies discovered in the regulation and a subsequent discussion of these issues.
The applied criteria and procedures originate from the 20th issue of the ANNEX 3 regulation, dated 2018, which, in parts relevant for this study, does not provide any new information compared to the previous version. In spite of the effort to apply the abovementioned regulation more precisely, in some cases, it was not possible to completely evade an individual interpretation due to a missing or vague description. The adequate document in the purview of the Czech Republic is the flight regulation L3 Meteorologie [2], which de facto represents a translation of ANNEX 3. As the translation, however, contains semantic errors, this study works with the original document ANNEX 3 instead.
The submitted study does not perceive the noncompliance of particular national regulations with ANNEX 3 as inappropriate or undesirable. After all, its statute is a mere recommendation. ICAO even allows for the introduction of additional criteria within its framework on a national level that would, with regard to the national specifics and technical equipment, help better reflect the variations of prevailing weather and climate and, as such, keep the highest possible quality of air traffic management. The majority of countries do in fact take rightful advantage of it. The problem is that, even if a country pledges to follow the rules and conditions cited in ANNEX 3, in some cases, they are not expressly and unambiguously applicable. This is what should not be happening. The potential consequences entail a negative impact on the air traffic economy and, in extreme cases, even a threat for air traffic safety. This paper alerts readers to this situation, analyzes it in the environment of the Czech Republic, and gives examples in the discussion. It is very probable that at least some of the mentioned examples are valid for other countries as well. The study, therefore, in addition to an assessment of the formal quality of reports and the accuracy of TAF forecasts (through METAR and SPECI reports) that at least partly indicate the quality of air traffic provision in terms of meteorological service, presents actual examples of the abovementioned inconsistencies. It aims to provoke a discussion about this applied domain of meteorology within the community and to contribute in this manner to an increase in pressure on relevant authorities to revise and refine the document and, thus, increase the qualitative level of air traffic.
2. Background
Studies focusing on the evaluation of the TAF success rate are not plentiful. Quite often, the approaches used for TAF assessment do not strictly comply with ANNEX 3. Deviation from the regulation, on the other hand, is a way of bypassing its general and ambiguous sections. Such an approach is adopted for example within the extendable module of software application Visual Weather by IBL Software Engineering, used by many national services. The access to verification is set up in accordance with customers’ preferences and, thus, may vary among individual clients. One of the crucial features is the fact that change groups are not assessed individually. All plausible forecast values are considered, even within change groups. On the basis of the customer’s request, it is possible to configure the weight of forecast time in the range of forecasting interval. Alternative approaches are cited in Mahringer [3] or Sharpe [4]. Mahringer’s article perceives TAF as a forecast of elements for a given time interval, not of discrete values in a certain time. It nevertheless represents an application of a deterministic approach that results in a contingency table, providing an overview of forecast accuracy. The table, however, does not contain all characteristics, and some important features such as change group type are omitted due to their complexity. Sharpe elaborated a probability-based method suggested by Harris [5]. The authors combined a probabilistic and deterministic approach, combining hit rates and variability of values within the interval, which are replaced by threshold intervals. Their paper only focuses on visibility, sorting values into categories on the basis of criteria established in ANNEX 3, with a standard reliability table created for each. For visibility exploration, there are six categories that allow for a comparison of the contingency table with the precision rate. The main difference between approaches described in Mahringer and Sharpe is the way they work with the probability of value occurrence. Another possible approach to the assessment was introduced in Caesar’s article [6], which compared verification methods of TAF accuracy of three national services. In terms of the methodology of accuracy assessment, all of them are similar. The only analyzed application that uses METAR-type reports as a source of verification data is in fact TafVer 2.0, and it also works with model output statistics (MOS). The TAF validity period is divided into 5 min slots, and each is individually compared with the observation. In the case of TEMPO (temporary) group or PROB (probability followed by percentage value) group presence, the possibility of validity of one or two forecasts is taken into consideration. Corrective reports TAF AMD (amended) are not verified. Hilden and Hansen [7] used the NORTAF verification scheme (TAF verification scheme developed by the Northern European Meteorological Institutes), which is in reality an extended version of the Gordon scheme [8]. These verification schemes are based on the check of three hourly sections of the TAF validity period, resulting in a contingency table. The occurrence of syntactic (formal) errors is monitored as well, contrary to other methods. An alternative approach using a Localized Aviation Model Output Statistics Program (LAMP) to the TAF for ceiling flight category forecasts was analyzed in an article by Boyd and Guinn [9].
Presently, there is a certain level of checking and TAF assessment taking place in the Czech Military Weather Service. The only assessed period is 6:00–11:00 a.m. Coordinated Universal Time (UTC) in TAFs issued at 5:00 a.m. UTC. If a TAF AMD is issued, it is subjected to assessment instead of the original report. Hence, in the Czech Military Weather Service, the TAF is compared with all available METARs and SPECIs corresponding to the period of its validity. The individual elements are compared independently and, within every hour, are assigned a percentage for the success rate. The observed value of wind direction is compared with the forecast value, and a 100% success rate is attained when deviation is less than 30°. The wind speed forecast is successful if the deviation is ≤5 kt. Visibility and cloud amount are evaluated according to color states, which is a system for the quick evaluation of meteorological conditions used in military environments (in the North Atlantic Treaty Organization (NATO)) [10]. All phenomena are appraised, and the success rate is determined by whether or not they were forecasted. Consequently, an arithmetic average of success rate of individual elements is calculated. Lastly, an average of values for all elements is calculated, resulting in a ratio that represents the success rate of the forecast.
3. Data and Its Preparation for Further Processing
Operative data from the Regional Telecommunication Hub Prague for the period 1 December 2016–3 March 2018 obtained through Military Data Network (METIS) were used for the assessment. However, due to occasional technical problems in the data network or receiving personal computer (PC) station, the data file contained outages, whose volume could not be, mainly due to SPECI report issuing rules, precisely determined.
The processed reports came from eight Czech weather stations (Table 1), all of which are located at airports.
METAR reports are issued regularly, every 30 min, at civilian stations operated by the Czech Hydrometeorological Institute (CHMI) and every hour at military stations operated by Czech Armed Forces (CAF). SPECI reports are issued on the occasion of a significant change in weather, as compared to the most recent METAR report. The criteria legitimizing issuance of a SPECI are codified in ANNEX 3. The TAF issue conditions between civilian and military stations differ more significantly. While TAFs on military stations are issued by a forecaster at the given station with a 24 h validity, TAFs on civilian stations are valid for 30 h and are issued by the headquarters in Prague.
4. Methodology of Report Assessment
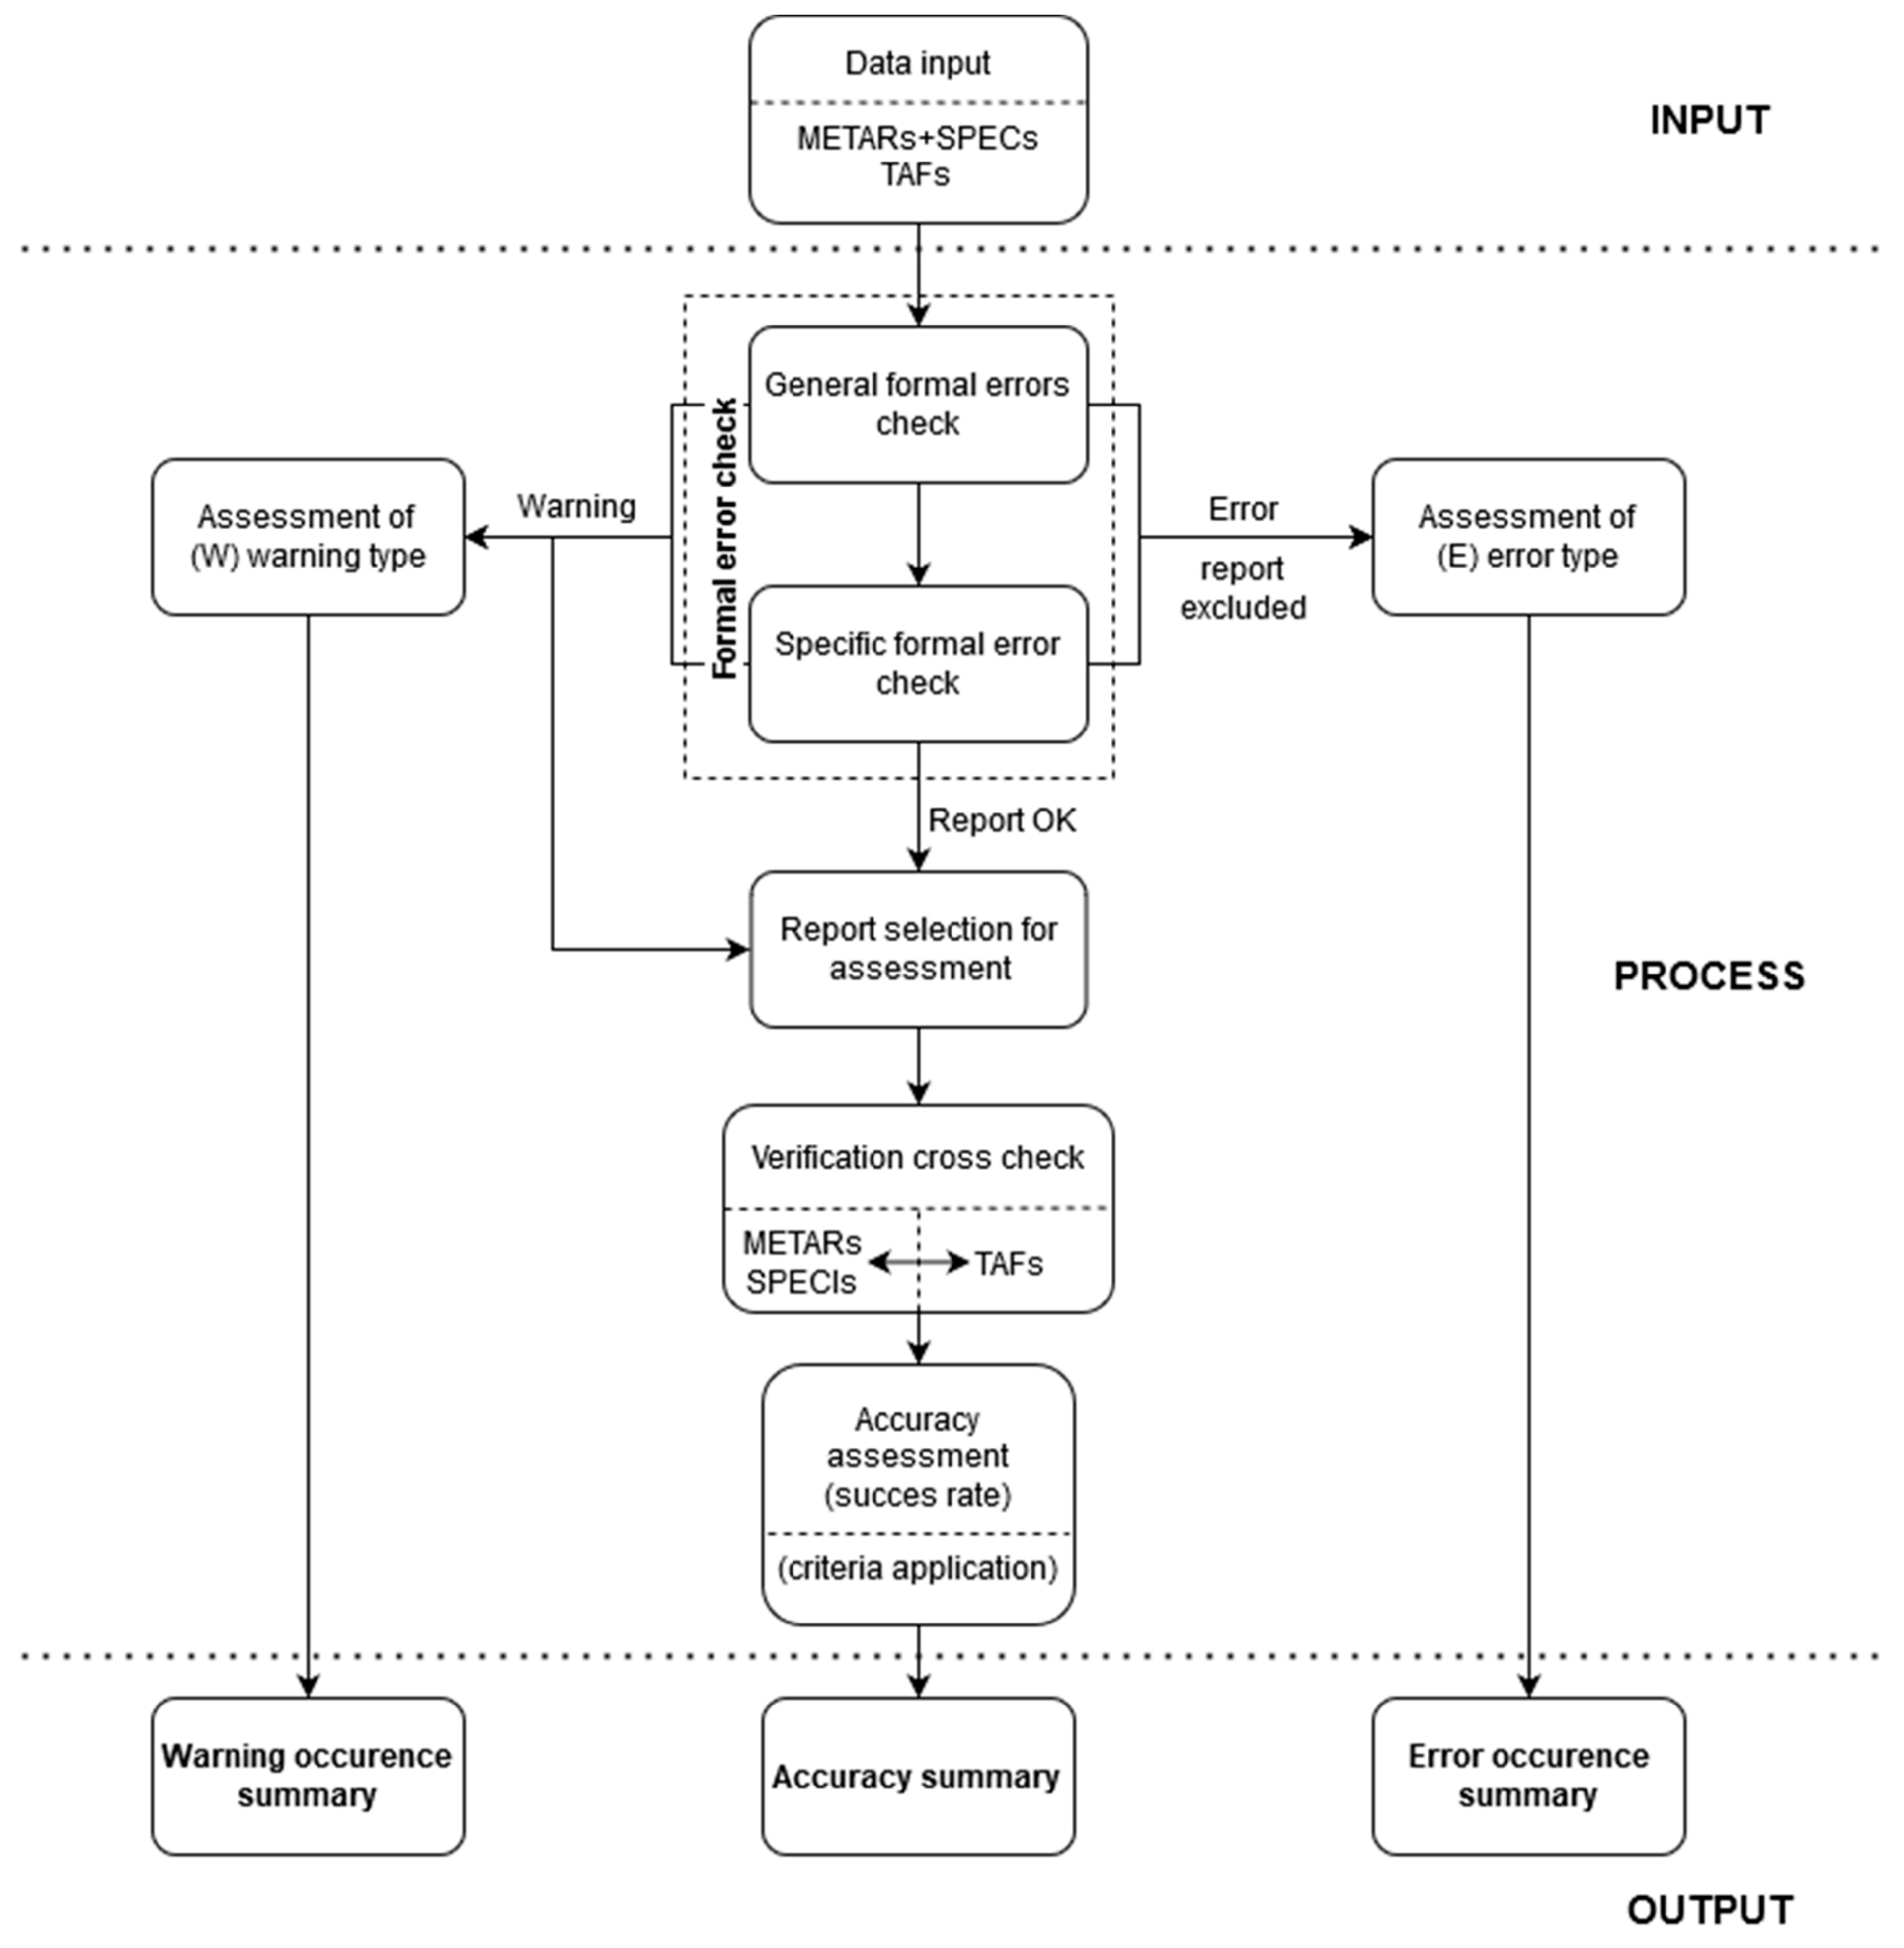
At the beginning, two types of relevant errors are defined and identified in the course of the assessment process:
- ERROR (E)—errors that render a complete and unambiguous interpretation of METARs, SPECIs, and TAFs impossible. Those reports are, thus, excluded from further processing.
- WARNING (W)—less consequential errors. These are mainly inappropriate categorizations of change groups (change criteria allowing the issuance of a report are not fulfilled, but the reported weather is correct). Such reports are not eliminated from subsequent processing.
The data assessment process is depicted in Figure 1.
4.1. Check of General Formal Errors
First, a check of general formal errors present in the reports takes place. Reports containing the following defects are excluded:
- Different non-alphanumeric signs are present (“)”, “(”, “]”, “[”, “?”, or “!”). Such signs should not be a part of a report and might in fact complicate the analysis of the text string.
- Time of issue cannot be ascertained (text string in the report finishes with Z).
- Time is defined incorrectly (formally, a good succession of numbers, but a correct distinction is impossible).
- Date in the body of the report varies from the date stated in the bulletin header by more than the admissible value. The admissible values are defined by us as follows:
- For METARs/SPECIs, the admissible disparity is 30 min.
- For TAFs, the admissible time of issue is 10 min before and 40 min after the actual issue time of the bulletin. In the case of a TAF AMD, the time stated in the bulletin may be greater than 30 h.
- The elements coded in the report do not mutually correspond (e.g., the value of visibility does not correspond with the assigned phenomenon).
4.2. Checking of Specific Formal Errors in Assessed Reports
The check below focuses on those formal errors that may occur specifically in one of the studied reports.
4.2.1. METAR and SPECI
The check of specific errors is limited merely to the actual body of METARs and SPECIs. Those parts of the reports that correspond to the forecast for the next 2 h, TREND (a form of the landing forecast) and RMK (remarks), are not checked. Next, the check for the presence of obligatory groups in the correct order is carried out. In the case of an absence of the report or an incorrect order, the report is excluded from further processing. Furthermore, the legitimacy of SPECI issuance is checked. Statistical evaluation of report issue justification serves as an indicator of the meteorologist observer’s quality of work. However, all issued reports (founded and unfounded) are considered for further processing. For this part of the checking process, it is crucial to know not only criteria cited in ANNEX3 App3_2.3, but also other potential supplementary criteria that might be established through a separate agreement between the customer and the meteorological service provider (in this case, CHMI or CAF). CAF does not apply any additional criteria (Table 2). CHMI does not apply a criterion value of 50 m for the runway visual range element on stations LKKV (Karlovy Vary) and LKTB (Brno–Tuřany).
Complying or not complying with criteria for the SPECI issue is assessed against the latest known preceding report. That might be either the regularly issued METAR or a consequently issued SPECI. For every rightfully issued SPECI report, those elements are identified for which change criteria were fulfilled in the report or the frequency of the occurrence of elements that fulfilled the change criteria is determined. The detection of occurrence frequency in such elements, where the observer has made a mistake, helps to find reasons for the SPECI issue, despite the nonfulfillment of change criteria.
4.2.2. TAF
Due to the different purpose and partly to the structure in comparison with METARs and SPECIs, TAFs are dealt with in a different manner. First, the report is divided into particular time slots defined by identifiers BECMG (becoming), FM (from), TEMPO, PROB, and PROB TEMPO. Next, the check of change group validity consistency against the validity of the whole report is executed. This check concentrates on the length of time range in change groups, which should be consistent with ANNEX 3 requirements. Similarly to METARs and SPECIs, the presence and order of obligatory groups are checked as well. If a group is missing or groups are not sorted in a standard order, the report is eliminated. Although this is not explicitly instructed in ANNEX 3, it is also checked that for any point of time for one type of change group (BECMG, TEMPO, FM, PROB, or PROB TEMPO) and one given weather element (wind, weather status, visibility, and cloud amount), only one group maximum is valid.
The subsequent check monitors the justification of change group inclusion and draws from the conditions stipulated in ANNEX 3, Appendix 5, Chapter 1.3. During this check, for the change in type of BECMG throughout the entire time change interval, all possible and plausible values are considered, which might occur in the event of an element change. For one time and one element, the validity of only one change group of a given type is considered. In order to ensure the validity of this assumption, the approach used in this study works with time intervals of groups that are closed from the left and open from the right. Such measurement applies in cases where one group starts immediately after another. In the case of BECMG for example, the change can occur in the minute preceding the end of interval at the latest. For TEMPO, PROB TEMPO, and PROB, no change in value is expected at the point of the end of group validity (e.g., for TEMPO 2312/2318, the temporary changes are expected between 12:00 p.m. UTC and 5:59 p.m. UTC).
Several different errors might appear in the report at the same time. However, even in the case of the occurrence of multiple errors, for instance, in different groups, the given type of error is included in the final assessment only once.
A check of justification of the issue of the TAF AMD is also executed, verifying that the issuance complies with ANNEX 3, App3_2.3, or other additional agreements between the user and service provider (see Table 3).
The statistical evaluation of issue justification again de facto represents a quality indicator of the work of the forecaster, as all issued reports (justifiably or not) are included in further processing.
4.3. Selection of Reports for Assessment of TAF Success Rate
The evaluation of TAFs in terms of success rate requires the selection of a suitable set of reports about weather status. The basic criterion is the condition that, for one specific date, only one METAR or SPECI report can be valid. In case other reports exist for one date, the latest COR (corrected) report is taken into account. If there is a plurality of reports for a specific date but none of them is designated COR, then none of them are part of the subsequent calculations. The assessment also includes SPECIs whose issuance was declared unfounded. The reason is that the previous report was not registered in all cases, and it is assumed that even an unjustifiably issued report describes a real weather status.
4.4. Methodology of Accuracy Assessment of TAF Forecasts
It is in full harmony with the main objective of this study to start from ANNEX 3 Attachment B. Operationally Desirable Accuracy of Forecasts (Table 4) when assessing the accuracy of TAF forecasts.
However, the accuracy requirements are not always unequivocal; thus, the necessity of resorting to a personal interpretation arose in the process of establishing further steps for the evaluation of success rates. A more detailed discussion on the encountered problems and ambiguity is introduced in Section 5. METARs and SPECIs chosen in accordance with the rules cited in ANNEX 3.3 constitute the set of reports considered for the evaluation of the forecast success rate of elements included in individual TAFs.
The observed parametric values of elements were compared with forecast values. In the case of BECMG, there are two alternative scenarios created for the course of the forecast element. In the first scenario, the change takes place at the very beginning of the validity of the BECMG change interval. In the second scenario, the original status is valid up to the end of the possible change sequence. For those elements, which are not defined by the change, it is expected that the status does not change.
If one of the defined phenomena appears, it is expected that it might only be terminated by another phenomena or by the abbreviation NSW (No Significant Weather). If the nature of the forecast weather in the TAF is described by several change groups at one particular point of time, a minimum interval is determined so that it contains all forecast values of the given element. This interval is next expanded by an acceptable tolerance, defined in line with the conditions stated in Table 4. The forecast is then considered successful in such an event, when the observed value falls within the defined interval. The assessment of individual elements proceeds as described below.
Wind direction is assessed on 10 min averages of wind speed (wind gusts not considered). Wind speeds below 10 kt are excluded from calculation as changes in reports are only cited for speeds equal or higher than this threshold. The assessment of visibility took place through the application of conditions to the information of prevailing visibility status. The amount of cloud must be evaluated in compliance with conditions defined in Attachment B:
- one category below 450 m (1500 ft);
- occurrence or nonoccurrence of broken (BKN) or overcast (OVC) between 450 m (1500 ft) and 3000 m (10,000 ft).
For the evaluation of Condition 2, it is considered that cloud amount BKN or OVC occurs at altitudes from 1500 to 10,000 ft, provided the cloud base BKN or OVC is under 1500 ft.
A successful forecast occurs when both defined conditions are true at the same time in at least one change group. In cases when the sky is impossible to distinguish and vertical cloud amount is encoded instead of the cloud group, this is classified as OVC with the bottom base equal to the quoted value of vertical visibility.
With respect to phenomena, only existence or nonexistence of any moderate or intense precipitation is evaluated. In harmony with criteria defined in ANNEX 3, no other phenomenon is evaluated. Temperature evaluation is not carried out, as the forecast of this element is not part of TAFs in the Czech Republic.
In order to establish the overall success rate, the weight attributed to individual reports is 1/n, where n is the number of reports per one hourly interval (0 to 59th min).
The overall success rate of a given element is calculated as an average value of the success rates of this element in individual reports. The total success rate of a report is then calculated as a weighted average of individual comparisons of METARs and TAFs.
5. Evaluation of Results
5.1. Assessment of Available Data
An overview of the number of real processed reports and the number of problems apparent before decoding from the period 1 December 2016–3 March 2018 is shown in Table 5. The number of dates with different (duplicate) reports (P1) does not include corrective reports AMD and COR, if they are different due to the bulletin header. The columns with all values equal to zero are removed from the table.
The results demonstrate that different versions of reports (namely, METAR reports at military stations) represent a greater issue than inconsistencies between bulletin designation and the contents of the report. The comparison of SPECI count appears to be quite interesting, with civilian airports (other than LKMT (Ostrava–Mošnov)) issuing much more SPECI reports than military stations. It implies a different approach and application of different criteria for their issue.
5.2. Assessment of Rate of Formal Errors of METARs and SPECIs
In general, the assessment suggests that ERROR (E) and WARNING (W) errors are higher in SPECIs that are often issued unexpectedly, without an obvious reason. The total numbers of reports and formal E and W errors (from December 2016) are illustrated in Table 6, where N is the number of analyzed reports, E corresponds to the number of reports with an ERROR only, W corresponds to the number of reports with a WARNING only, EW corresponds to the number of reports with both an ERROR and a WARNING, and OK corresponds to the number of reports without either an ERROR or a WARNING. The situation appears worst at military station LKCV (Čáslav), amounting to a 1% error for METARs and an over 2% error for SPECIs. The remainder of the stations show a markedly lower rate of errors.
5.2.1. Assessment of ERROR (E) Errors
E errors are most commonly due to inconsistency in the order of signs. This group includes typos, missing information related to the meteorological element, incorrectly attributed weather (actual or previous), and incorrect order of groups.
The second most common reason for these errors is indication of mist (BR, abbreviation of the French word “brume”) despite the fact that visibility is lower than 1000 m or higher than 5000 m. The mist was incorrectly coded in the reports during visibilities from 400 m to more than 10,000 m. It appears more often during visibilities above 5000 m, which might be due to a confusion of various definitions of mist in SYNOP reports or possibly in reports for climatologic purposes. This type of error in visibility is more frequent in reports issued by civilian stations. Another detected error that shows similarities to this case is a situation where visibility is less than 5000 m, and no associated phenomenon is cited.
In 20 cases, a particular group is repeated more than is admissible. Such an error is indicated at civilian stations, most often LKMT, for temperature and visibility groups. At military stations, it does not appear at all. In 10 cases, an obligatory group is missing altogether. Most often, this is evidenced at the LKTB station for visibility (usually, it was replaced by the group of runway visual range). Other types of errors appear in totality fewer than 10 times at all stations.
5.2.2. Assessment of WARNING (W) Errors
A summary of E and W errors for METAR (M), SPECI (S), and METAR + SPECI (C) reports at analyzed stations is given in Table 7. W errors are most frequently due to the replacement of space in the report by the letter “s”. These are only detected at military stations and are probably due to a software error in the coding application. The second most common reason is linked to reports with a date that is different than expected. Several records, mainly at military stations but also at LKPR (Praha–Ruzyně) and LKTB, show registered wind gusts exceeding an average wind speed of less than the required 10 kt.
5.2.3. Assessment of the Number of Usable Reports and an Assessment of Justification of the SPECI Issue
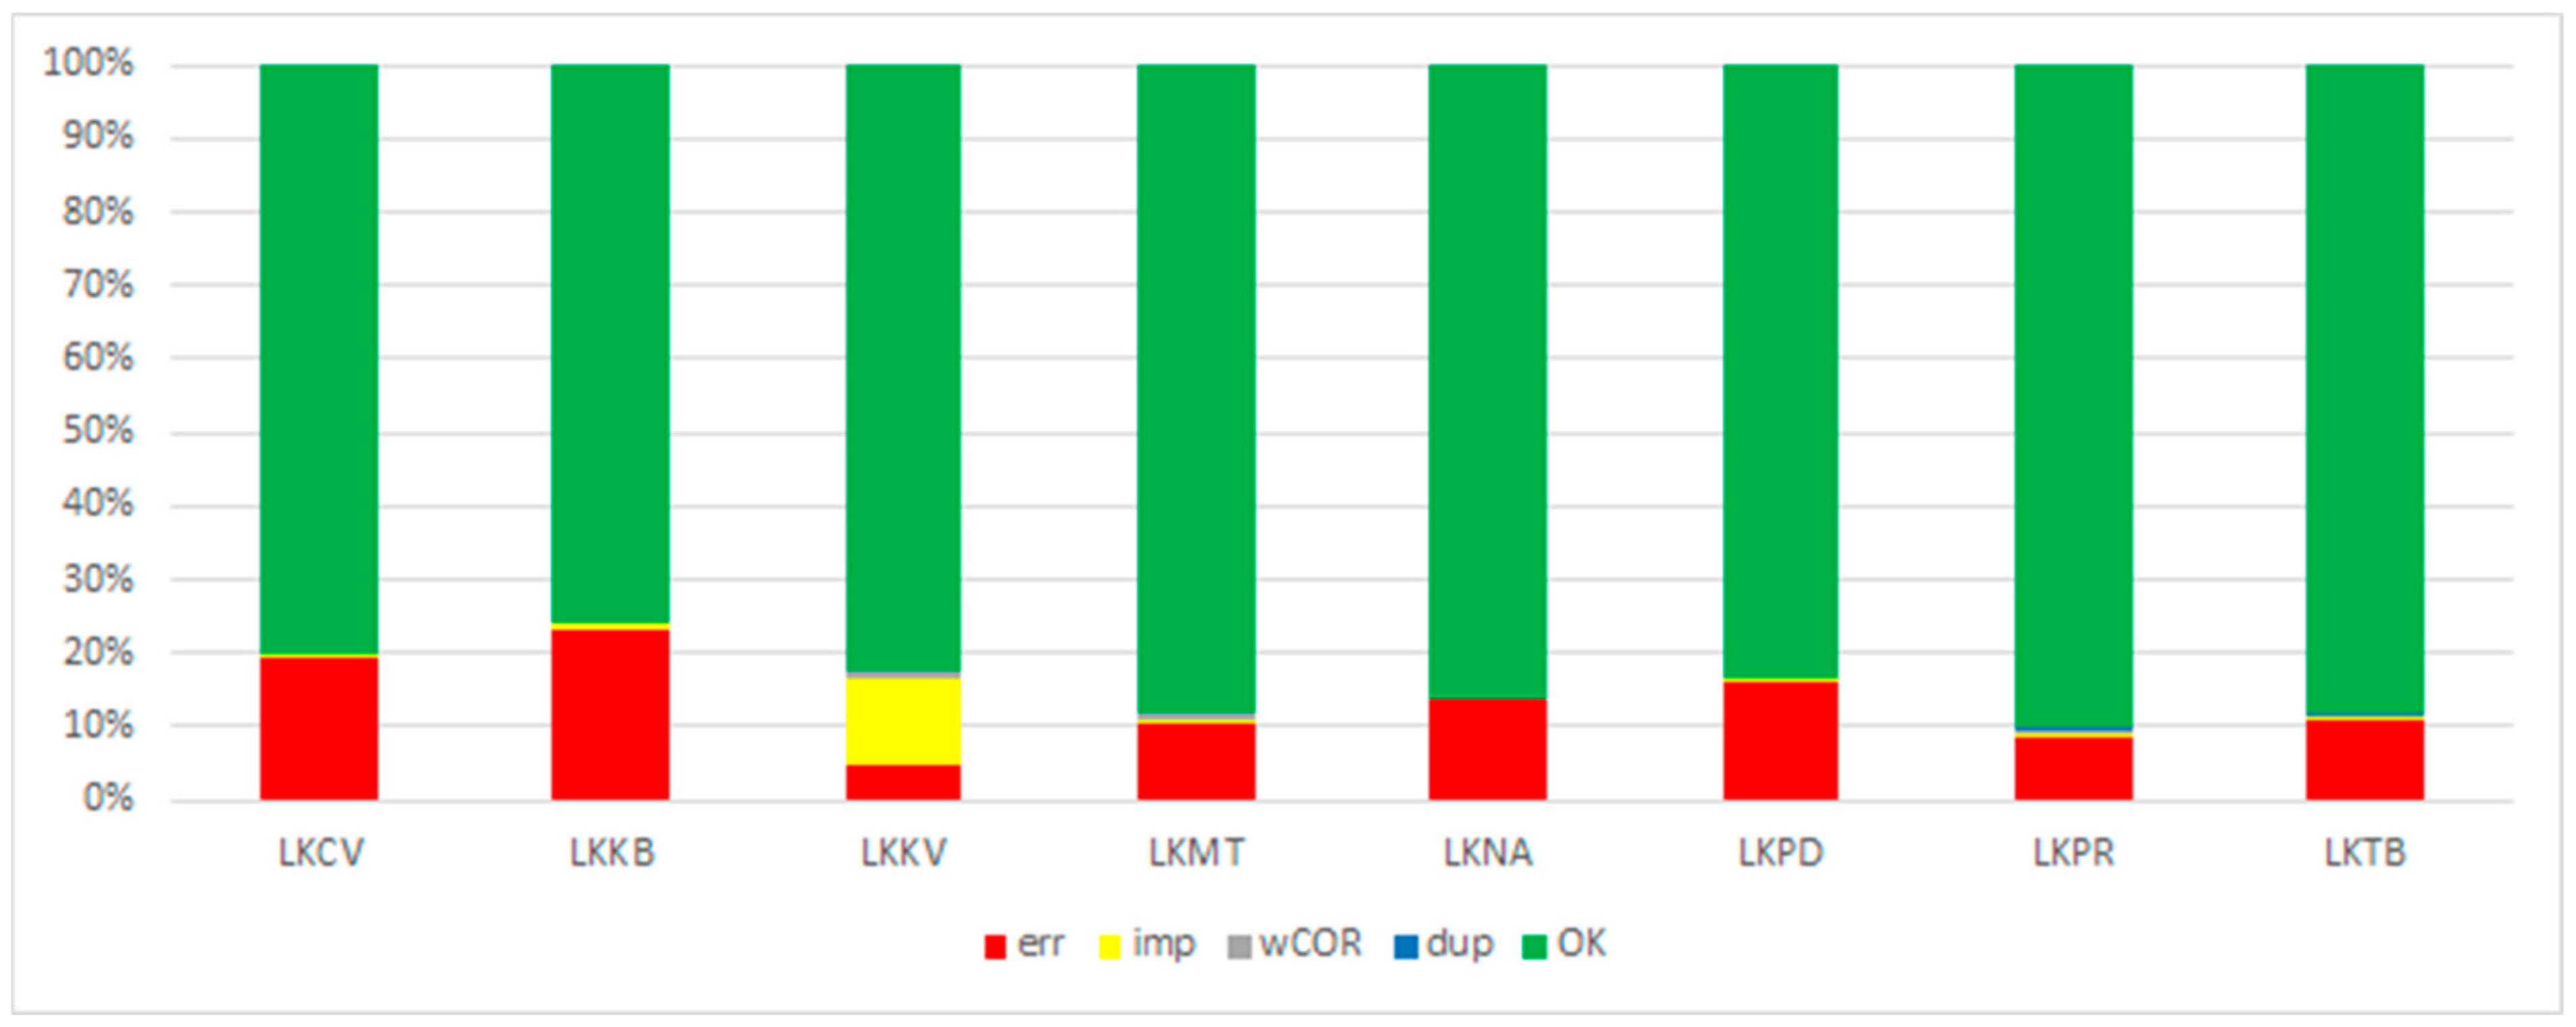
The evaluation of SPECI issue justification provides evidence of the observer’s quality of work. The results of the SPECI issue assessment are shown in Figure 2.
The rate of unfounded SPECI reports at civilian stations accounts for 5% to 10%; at military stations, it is 14% to 23%, most often at the LKKB (Praha–Kbely) station. In the case of the civilian station LKKV, the result is affected by the fact that, although the interval for METAR issue is 30 min, between 7:00 p.m. UTC and 5:00 a.m. UTC, the reports are often issued every hour. Consequently, there is a significant number of unevaluated SPECIs from this station. Most of them are related to night times between the 30th and 59th min. A different evaluation for different times of the day was not adopted, however, as the METARs in several cases, even in these periods (probably for operational reasons), were issued every 30 min.
Given that the same criteria for inclusion as those of the CHMI station were applied at military stations (LKPR), the number of errors declined by more than one-third, and the rate of incorrectly included SPECIs would amount to 7–15%. The number of criteria met for the SPECI issue sorted by a particular element is shown in Table 8.
Since there can be more criteria met in one report, the sum throughout all elements is higher than the total number of correctly issued SPECIs. The overview implies that the most frequently met are the issue criteria for cloud amount, phenomena, and visibility. Application of the other criteria is notably less numerous.
5.3. Evaluation of Rate of Formal Errors of TAFs
The occurrence of formal errors is assessed on approximately 1600 reports per station. The rate of flawless reports is relatively low, less than 10%. The reports with E errors account for 10% to 21% of all assessed reports. The largest proportion of errors is recorded at military stations LKNA (Náměšť nad Oslavou), LKKB, and LKCV, and the smallest error ratio is recorded at the stations LKPD (Pardubice) and LKPR. The remainder of the stations, about 80%, only registered W errors (Figure 3). The proportion of TAFs containing only E errors is designated E, TAFs containing only WARNING errors are labeled W, the proportion of TAFs containing both W and E errors at the same time is marked EW, and OK shows reports without either (1 December 2016–3 March 2018).
One report may contain several different errors at the same time. Even in cases of multiple occurrences, a given type of error will only count once for the purpose of assessment (for example, in different cloud amount groups).
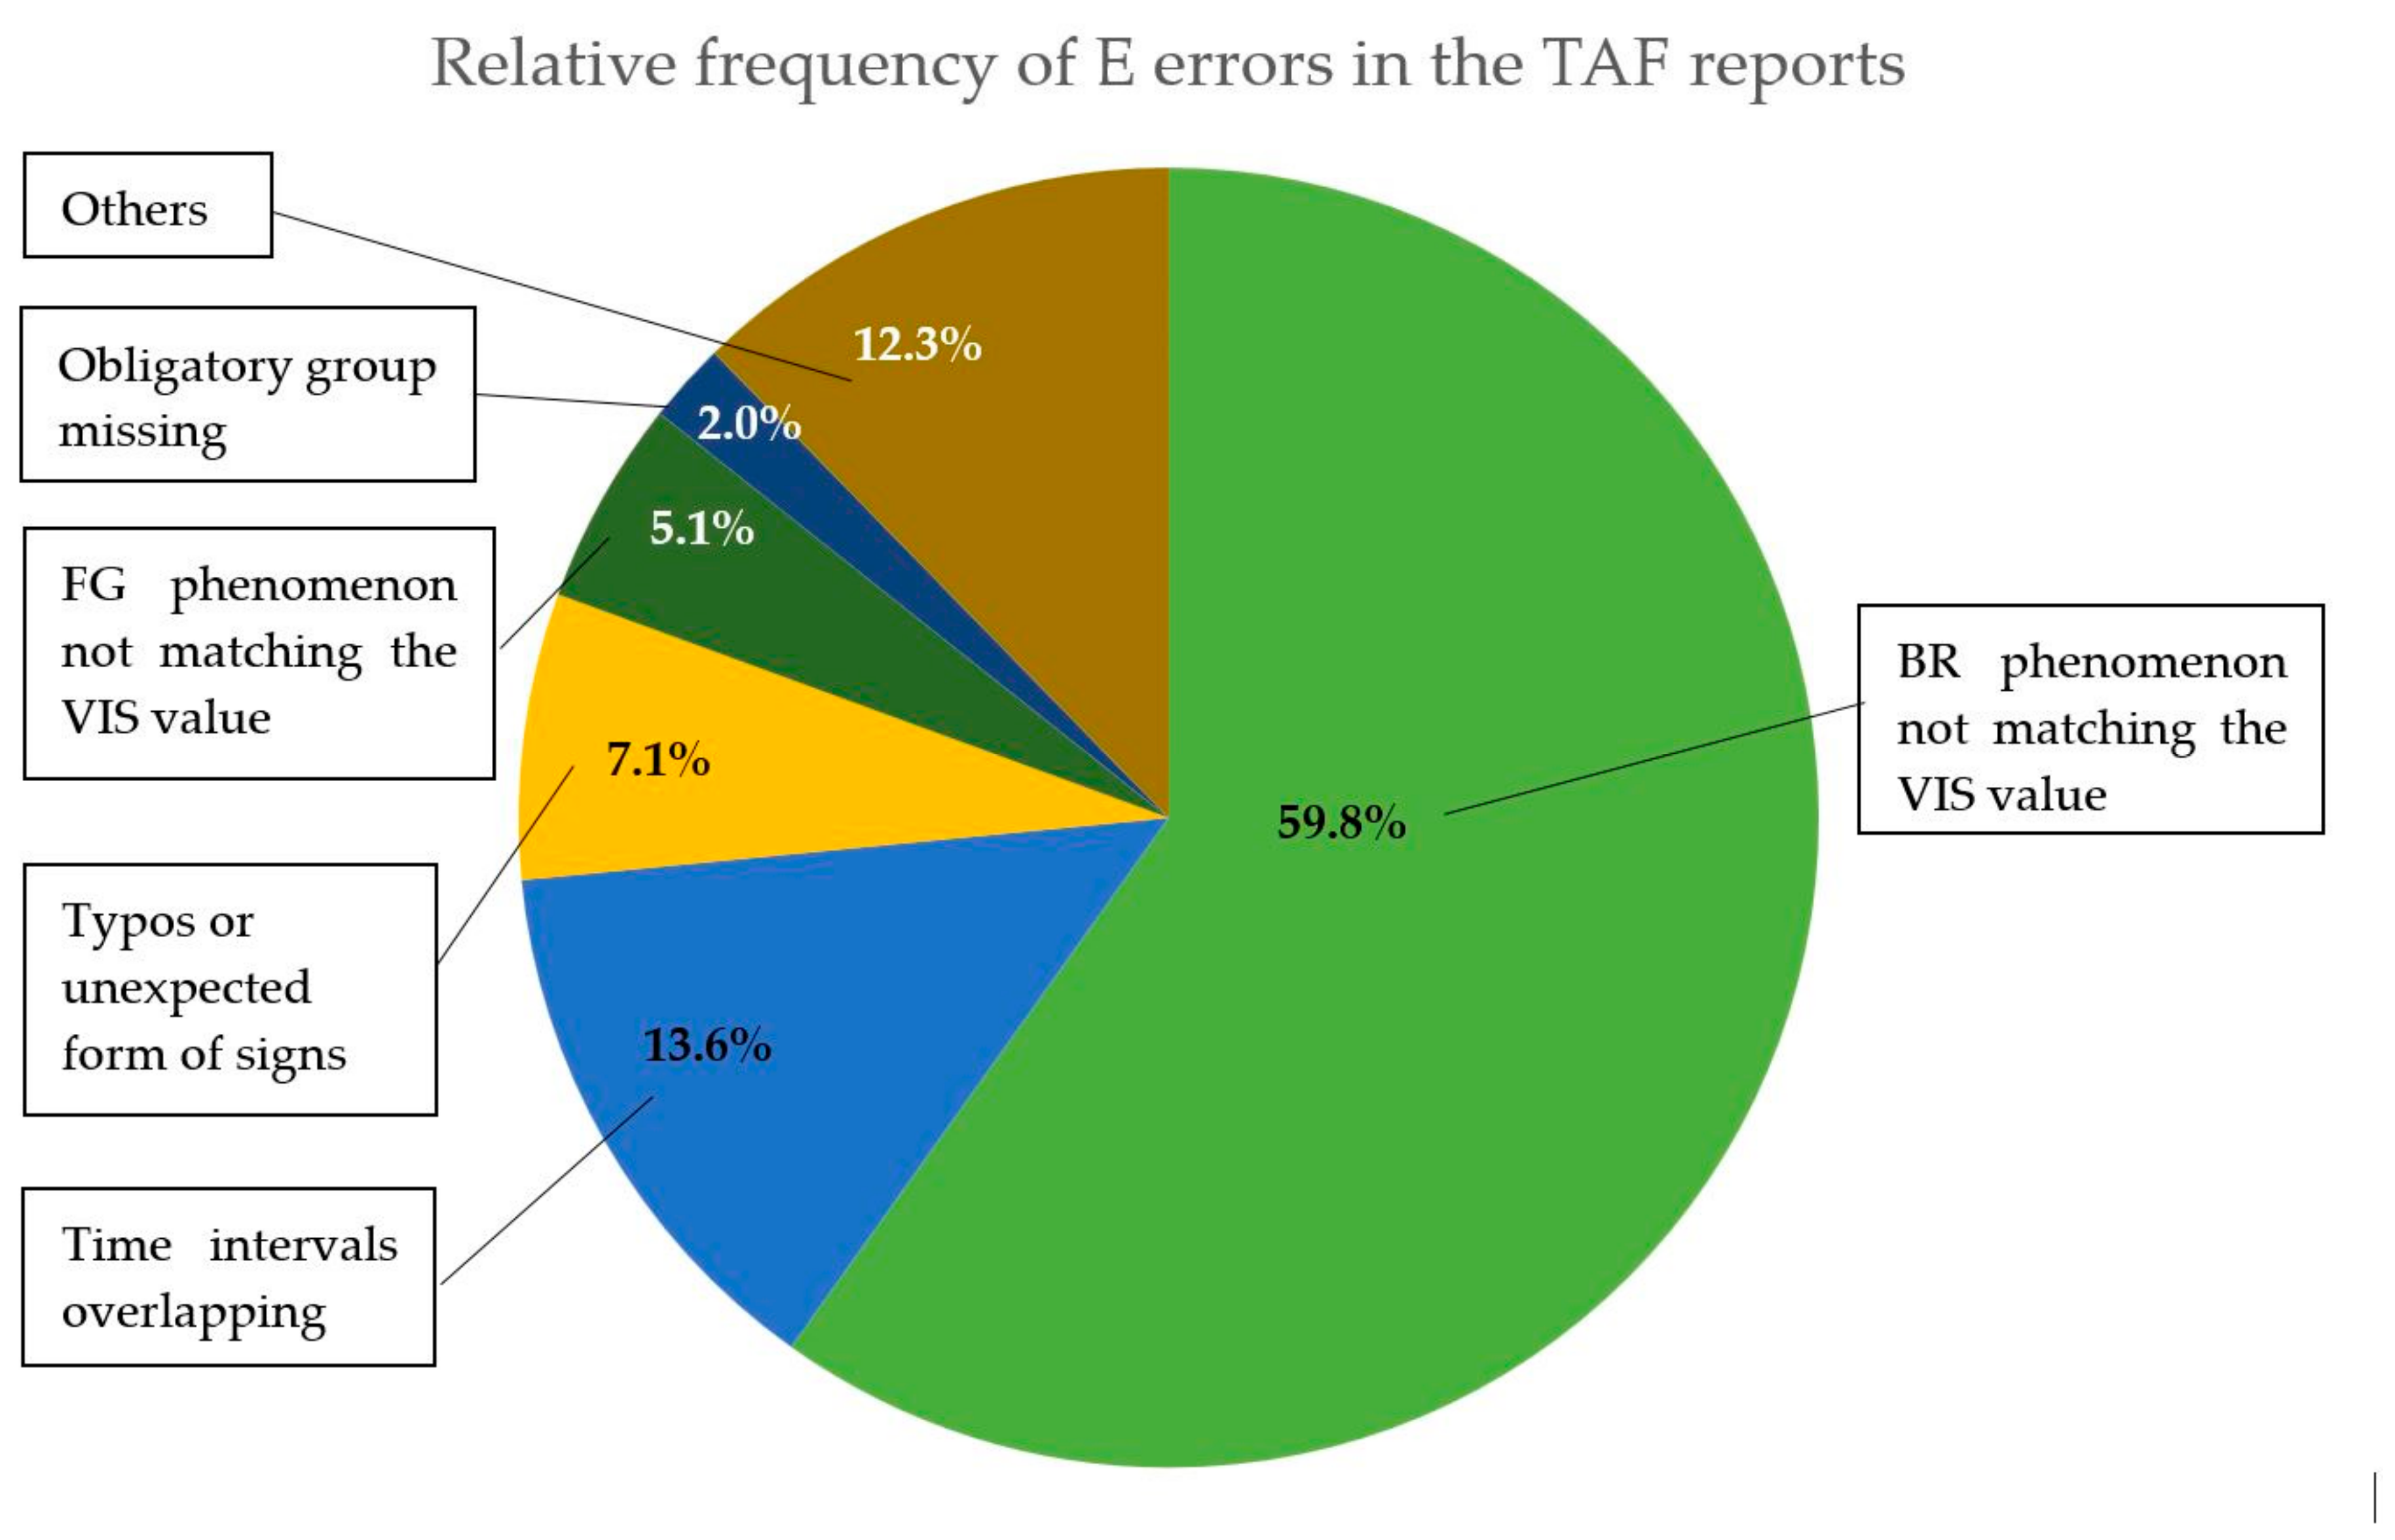
The most frequent error is discordance between the reporting of an occurrence of mist (BR) and the reported value of visibility. The error often appears in change groups where visibility values change from the interval 1–5 km to values outside of that, and the end of the mist phenomenon is not taken into account at the same time. The error during change for values lower than 1 km occurs in only three cases.
The second most frequent error is the overlapping of time intervals for the same type of change group and the same element.
The third is a disharmony in the succession of signs, which does not correspond with the expected form. Such cases involve typos in wind data, time data, a missing sign, or contrarily a redundant space or incorrect order.
The fourth is the recording of a fog phenomenon (FG) when visibility exceeds 1000 m.
The fifth occurs when an obligatory group of the report is missing altogether. This type of error only appears at military stations. The missing data are time validity, visibility, and wind.
Time incongruities between times stated in a report are the most frequent type of error in “others” (with relative frequencies of 1.9% or lower). These are the following time errors of the E type:
- the beginning of the validity of the change group < the beginning of the validity of the TAF;
- the end of the validity of the TAF < the end of the validity of the change group or ≤ the beginning of the validity of the change group;
- the discrepancy between the time of issue of the report and the start of its validity ≠ 1 h (not tested for AMD);
- the group start time ≥ the group end time;
- the length of the BECMG change (from/to) >4 h.
The remainder of the errors from “others” amounts to fewer than 14 TAFs in all stations, e.g., the NSW code and the phenomena mentioned within the same group, NSC and significant clouds, and typos in the date causing an incorrect time of issuance.
The relative frequency of E errors in the TAF reports can be seen in Figure 4.
The majority of detected W errors are connected to unfounded inclusions of change groups, where the required criteria were not met.
5.4. Assessment of TAF Forecast Accuracy
5.4.1. Reports Used for the Assessment of the Success Rate
The total number of dates used for TAF assessment is illustrated in Table 9, where cT shows the number of dates, cTr is the number of dates with a regular report, cTRC is the number of dates with a regular report that are consequently COR (subgroup of cTr), cTa is the number of dates with an AMD, A2 is the number of dates on which two AMDs were recorded, and A3 is the number of dates on which three AMDs were registered.
The working quality at a given station can be understood through a comparison of the number of corrective reports. A remarkably higher quantity of COR corrections is registered at military stations compared to civilian stations. At all stations except LKPD, there was a situation in which, for one date, the AMD correction was issued twice (1–6 cases) or even three times (one case on LKCV).
5.4.2. Assessment of the TAF Forecast Success Rate
In accordance with the proclaimed methodology that aligns as much as possible with ANNEX 3, the success rate of a given element’s forecast at individual stations is ascertained. It is calculated as an average throughout all time intervals. All available TAFs, including the TAF AMD, enter the assessment. Only reports that cannot be decoded are excluded. A summary of success rate values is shown in Table 10, where success rate values of the element forecasts that do not reach the minimum requested values (as stated in ANNEX 3) are highlighted.
Wind direction is an element for which we register low success rate values that do not reach the required minimum (80%). If the success rate was assessed only by the average, the requested forecast accuracy of wind direction for the given period would not be attained at the stations LKKB, LKNA, and LKTB. The majority of dates were not considered for wind direction assessment at all due to a low wind speed. The total share of dates with a wind speed below 10 kt, where the direction is not evaluated due to the methodology and criteria established in ANNEX 3, ranges from 65% (LKMT) to 85% (LKKV). Another element at military stations scoring below the minimum required accuracy rate (70%) is cloud height.
The remaining elements do at least arrive at the minimum required percentage of success rate. If we judge the forecast success rate by 1 h intervals, then the required accuracy is accomplished as described below. In the case of precipitation forecasts, the minimum success rate value is achieved for all time sequences and all stations, with the exception of the 30 h forecast at the LKMT station, where the minimum required success rate is reached for wind speed as well. The wind direction element registered the achievement of the required success rate at the stations LKNA, LKCV, and LKTB in the first 6 h only, while this is attained for all time sequences except at 30 h at LKMT and LKKV. The success rate of visibility forecast is problematic only near the end of TAF validity at three stations, i.e., after 24 h or more. In the case of “cloud amount” element, the minimum success rate value is reached at most stations around the 24th hour from the beginning of forecast validity.
6. Discussion
The aim of the study was to assess the quality of TAFs and the related reports METAR and SPECI in terms of the requirements cited in ANNEX 3. However, in the course of creating an algorithm that would objectify the error rate assessment of METARs, SPECIs, TAFs, and the success rate of TAFs, it was evident that ANNEX 3 is vague or missing important instructions. These issues are more closely discussed and outlined in this section.
6.1. Difficulties with Assessment of METARs and SPECIs
Owing to the use of operative data and possible outages during their distribution, it is not de facto feasible to verify whether all of the issued reports, or their corrections, are truly available for processing. A report is eliminated from further processing if it was actually issued but, due to the presence of formal errors or errors, not rectifiable by the authors of this study; thus, it is not comprehensible or unequivocal. This fact might be considered a simplification.
In cases of a presence of a runway visual range group in reports, its development tendency (up/down/neutral, U/D/N) was not evaluated, as the evaluation method is not specified in ANNEX 3. This finding may be a suggestion for the further refinement of ANNEX 3. Afterward, the runway visual range could be a subject of an interesting analysis.
6.2. Difficulties with Assessment of TAFs
Although not explicitly mentioned in ANNEX 3, the checking algorithm of formal errors is derived from the basic assumption that, at any point of validity of the TAF, there can be at most one valid group describing the weather course per given change group (FM, BECMG, or TEMPO) and related weather element (wind, weather status, visibility, or cloud amount).
In addition, ANNEX 3 does not cover the coding rules of some phenomena, such as mist in all details and, thus, makes space for ambiguities. This means that the mere adoption of these coding conditions from ANNEX 3 into national regulations presupposing their easy and practical application is not feasible, as those ambiguities allow for a variable interpretation. The only remaining solution to this situation is to resolve the ambiguities on a national level (however, the content of such national particularizations and deviations of the ANNEX 3 criteria are de facto inaccessible from abroad).
6.2.1. Difficulties with Coding and Assessment of NSW
A significant uncertainty complicating the assessment proves to be the inconsistent termination of phenomena via the abbreviation NSW. According to ANNEX 3, App 5, 1.2.3, this abbreviation should terminate every phenomenon (and any other phenomena stated in App 3, 4.4.2.3, in line with the agreement between a meteorological support provider and a user). Contrarily, according to App 5, 1.3.–1.3.1a 1.3.2f, termination through NSW only concerns a small defined subset of phenomena. The approach presented in this study assumes that any encoded phenomenon must be terminated by NSW (apart from the cases of replacement by a different phenomenon).
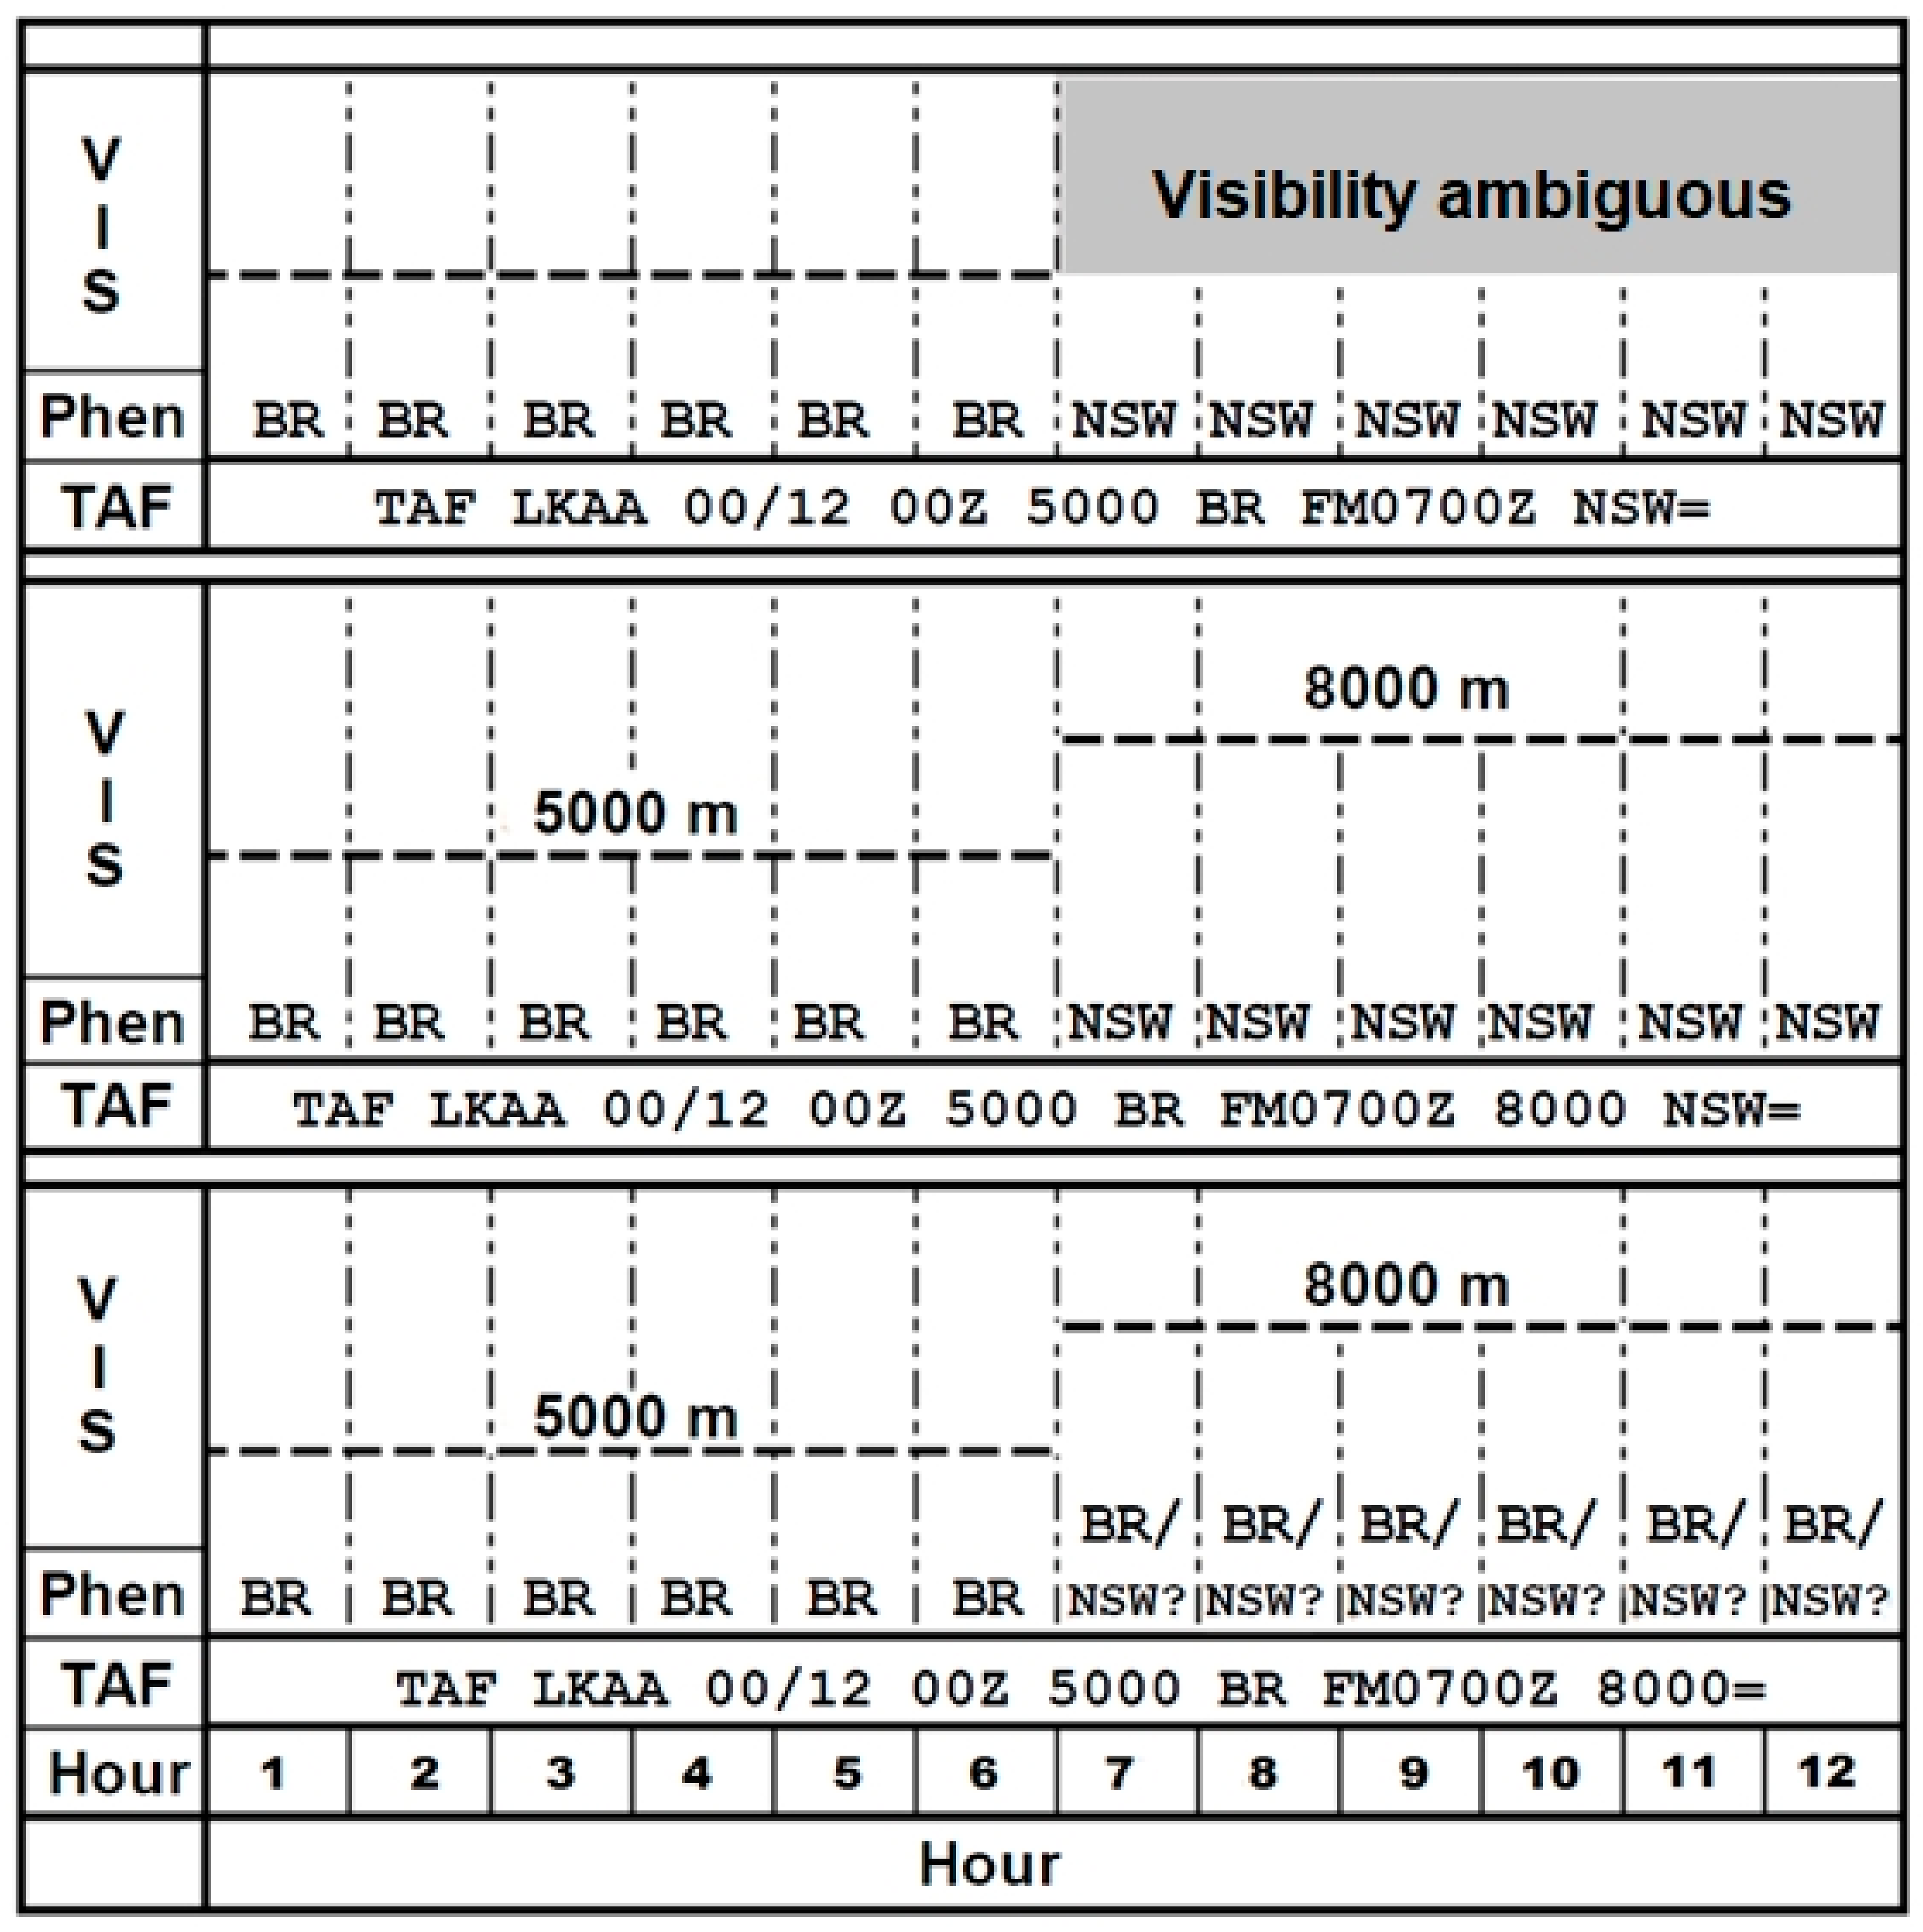
A good example of problematic coding is a situation where visibility is improved from 5000 m (necessary to cite BR) to 8000 m (no phenomenon). There are three possible coding methods, none of which is in reality correct (Figure 5):
- 5000 BR → 8000 NSW—According to the given change criteria, the conditions for coding the change of visibility value are not met. Error type: WARNING.
- 5000 BR → NSW—According to the given change criteria, it is not possible to encode a value of improved visibility. This implies that the original visibility value (5000 m) is valid. However, that value does not correspond with the use of NSW. Error type: ERROR.
- 5000 BR → 8000—The phenomenon is not terminated through NSW, which indicates that it still persists. The parallel existence of a visibility value of 8000 m and BR is not admissible, and the occurrence is, thus, classified as an E error. Moreover, the described change of visibility values does not comply with the criteria for inclusion. Error type: WARNING.
6.2.2. Difficulties with Coding of the Cloud Amount
An issue with coding justifiability and subsequent evaluation arises on the occasion, when ANNEX 3 does not allow one to code the change in cloud amount CAVOK (clouds and visibility OK) → BKN, or OVC015 → 10,000 ft, because there is no foundation for encoding these changes into reports given the occurrence of a cloud base above 5000 ft (except cases with towering cumulus (TCU) and cumulonimbus (CB)). As a result, there is a problem with the evaluation of cloud amount, because it is not possible to meet both accuracy requirements as stated in Table 4 and rightfully coded data that are different.
6.2.3. Difficulties with Evaluation of Success Rate
Evaluation of the TAF success rate in ANNEX 3 is described in ATT-B1. Unfortunately, it is unclear. The text does not clarify what data the values of forecast elements should be compared with, i.e., only with METAR or METAR + SPECI, or another source of real data.
The text works with the term “case”, but the interpretation of this word is not evident. Does it refer to the comparison of values of the forecast element with values published in METARs (+ SPECIs) or a comparison of values of the forecast element for every minute of TAF validity with real minute values of the given element?
For the purposes of this study, METAR and SPECI reports were used for assessment. The minute values of the real weather were derived on the basis of available METARs or SPECIs. In accordance with ANNEX 3, where insignificant changes in the weather course do not justify the issuance of any reports, the course of weather in the period between individual METARs (or SPECIs) was considered without change.
The text of ANNEX 3 also does not clearly state whether the required minimum values of the success rate relate to each individual TAF or whether it is a minimum accuracy requirement for the assessment of a certain number of TAFs within a period not explicitly specified in the regulation.
Another process that ANNEX 3 fails to explain is how the presence of change groups is projected into the evaluation of the success rate. This ambiguity was out of necessity replaced by a personalized approach whereby the entire range of possible values indicated by change groups of a given element in a defined date within the time validity of the TAF is assessed. A successful forecast is a forecast where an observed value falls within this range, which is extended by the admissible tolerance defined in ANNEX 3, Attachment B (see Table 4).
Another challenge during TAF assessment is posed by the vague application of criteria cited in ANNEX 3/L3, Attachment B—Operationally Desirable Accuracy of Forecasts:
- Visibility and cloud height assessment lacks clarification, whether the cited criterion concerns the forecast or the observed value. For instance, suppose the observed value of visibility is 1 km, but the value forecast in the TAF is 700 m. If the tolerance is derived from the forecast value, then the forecast is not successful, because the reality does not fall within the 500–900 m range. However, if the tolerance was derived from the real value, then the forecast value 700 m is inside the 700–1300 m range, and the forecast is, therefore, successful.
- The assessment of cloud amount suffers from discordance between the criteria of change coding and the criteria of success evaluation. It is not possible to code changes of a cloud amount CAVOK/FEW (few clouds), or SCT (scattered) → OVC/BKN and vice versa, in levels above 1500 ft. The resulting difference between real and coded values of cloud volume and cloud height consequently impacts the assessment of the success rate.
- In the case of cloud height assessment, it is not explicitly stated whether the evaluation concerns only the height of the lowest base of cloud amount. Such is the personal approach applied in this study. The problem is that SPECI alone cannot grasp cloud changes for the volume of FEW and SCT. This is also the case for the change in height of the lowest base from 5000 ft to 2000 ft (for BKN and OVC), provided the post-change value does not fall inside the range defined by criteria: ±30%.
- ANNEX 3 does not directly instruct one how to evaluate the cloud amount on the occasion of vertical visibility. Again, after applying a necessary personal approach, we define OVC not from the ground, but from the value designated as vertical visibility in reports.
- Wind assessment demonstrates an evident disharmony between the criteria for success rate evaluation, the inclusion of change groups, and the issuance of SPECIs. For example, if the wind speed of 3 kt gradually increases by the end of the interval to 12 kt, it is not possible to code such a change. In order to comply with criteria for a successful forecast, the forecasted wind speed for the entire period would have to be 7 kt or 8 kt, or a change from 3 kt to 13 kt would have to be coded.
- Success rate evaluation of phenomenon forecast is only carried out for precipitation. Moreover, their nature (state, character, and intensity) is not distinguished. In accordance with ANNEX 3, the evaluation of the success rate of a forecast of any other phenomena is not calculated.
7. Conclusions
The objective of this study was to test the actual applicability of the rules and criteria defined by ANNEX 3 Meteorological Service for International Air Navigation (20th Edition) in order to assess the quality of coded aviation meteorological forecasts from TAFs issued in the Czech Republic in terms of both formal quality and forecast accuracy. It employs regularly issued METAR reports and occasionally issues SPECI reports as sources of verification of actual weather course information. On that account, a quality and credibility assessment of both types of reports took place first, including an appraisal of issue justification in the case of SPECI. This procedure, therefore, delimits the number of usable verification reports.
The study, in contrast with other known studies/papers, strives to assess the quality of a TAF in its full content and chronological complexity. That is, according to ANNEX 3 established criteria, all requested elements on several years of long, routine series of reports, as opposed to approaches that process a given set of ad hoc selected examples of reports and selected elements, were analyzed.
The findings of the study, acquired on a portfolio of Czech aviation meteorological stations, reveal that the applicability of ANNEX 3 instruction is unfortunately not unequivocal, as its interpretation is ambiguous or at times even incomplete. The situation necessarily implies an individual interpretation of disputable combinations of rules and criteria and consequentially burdens the objectification with an undesirable subjective perspective that in the end impacts its assessment.
The results, however, also show that, even in cases where the rules and criteria stipulated in ANNEX 3 (20th Edition) are unequivocally applicable, the formal quality of TAF reports is not in fact satisfactory—only less than 10% of reports are faultless. On the other hand, the forecast accuracy in cases of unambiguous applicability of rules and criteria reached the minimum required levels for the most of ANNEX 3 listed elements and most of stations. The accuracy threshold values defined by ANNEX 3 were not met for the wind direction element at three of eight stations (LKKB, LKNA, and LKTB) or for cloud height at four of eight stations (LKCV, LKKB, LKNA, and LKPD). This may be attributed to a low quality of work of the forecasters, a more frequent occurrence of complex and more variable weather course, a determination of too demanding criteria, or a combination of these.
Imperfections regarding low formal quality and insufficient forecast accuracy of two important elements should be eliminated, and the presented algorithm may aid in the process. Such imperfections undoubtedly impact the economic efficiency of air traffic in a negative manner (for example, pilots will need to wait on a traffic pattern for more favorable weather conditions to land or be forced to land at another airport). Extreme cases may even lead to events threatening the actual safety of the flight.
An important part of this study is the identification and discussion of ambiguities and contradictions in ANNEX 3 that complicate the assessment and lead to loose interpretations of its stipulations. The authors aimed to explore TAF realization and its outcomes with regard to the methodology defined by ANNEX 3. The reliability of this source of information is crucial for its practical applicability, and the findings of the presented study may provoke a community discussion on the clarification and completion of ANNEX 3.
Author Contributions
Conceptualization, J.N., K.D., V.R., and M.G.; methodology, J.N. and K.D.; software, K.D.; validation, K.D.; formal analysis, J.N. and M.G.; investigation, J.N., K.D., and V.R.; resources, J.N., K.D., and V.R.; data curation, K.D. and D.S.; writing—original draft preparation, J.N. and K.D.; writing—review and editing, J.N. and M.G.; visualization, K.D., D.S., and J.N.; supervision, J.N. and M.G.; funding acquisition, M.G. All authors have read and agreed to the published version of the manuscript.
Funding
This research was supported within the institutional support for “Development of the methods of evaluation of environment in relation to defence and protection of the Czech Republic territory” (NATURENVIR) by the Ministry of Defence of the Czech Republic.
Institutional Review Board Statement
Not applicable.
Informed Consent Statement
Not applicable.
Data Availability Statement
Restrictions apply to the availability of these data. Data was obtained from Military Geographic and Hydrometeorological Office and are available at www.hydrometeoservice.army.cz and with the permission of Czech Hydrometeorological Institute.
Conflicts of Interest
The authors declare no conflict of interest.
Abbreviations
| ANNEX 3 | A regulation for Meteorological Service for International Air Navigation issued by International Civil Aviation Organization (ICAO) |
| AMD | Amended |
| BECMG | Becoming (used in TREND and TAF code) |
| BKN | Broken (5–7/8 cloud cover; used in METAR, SPECI, TREND, and TAF code) |
| BL | Blowing (used in METAR, SPECI, TREND, and TAF code) |
| BR | An abbreviation of the French word “brume”, standing for “mist” (used in METAR, SPECI, TREND, and TAF code) |
| CAA | Civil Aviation Authority of the Czech Republic |
| CAVOK | Clouds and visibility OK (used in METAR, SPECI, TREND, and TAF code) |
| CAF | Czech Armed Forces |
| CB | Cumulonimbus (used in METAR, SPECI, TREND, and TAF code) |
| COR | Corrected (used in METAR, SPECI, and TAF code) |
| DR | Drifted (used in METAR, SPECI, TREND, and TAF code) |
| DRSA | Drifted Sand (used in METAR, SPECI, TREND, and TAF code) |
| FEW | Few (1–2/8 cloud cover; used in METAR, SPECI, TREND, and TAF code) |
| FG | Fog (used in METAR, SPECI, TREND, and TAF code) |
| FM | From (used in TREND and TAF code) |
| Ft | Feet |
| ICAO | International Civil Aviation Organization |
| Kt | Knots |
| L3 Meteorologie | A regulation issued by Civil Aviation Authority of the Czech Republic |
| METAR | Meteorological Aviation Routine Weather Report |
| METIS | Military Data Network |
| MOS | Model output statistics |
| NORTAF | TAF verification scheme developed by the Northern European Meteorological Institutes |
| NSC | No significant clouds (used in METAR, SPECI, TREND, and TAF code) |
| NSW | No Significant Weather |
| OVC | Overcast (8/8 cloud cover; used in METAR, SPECI, TREND, and TAF code) |
| PROB | Probability followed by percentage value (used in TAF code) |
| QNH | The value of the atmospheric pressure adjusted to mean sea in an aeronautical code Q code |
| REG QNH | The forecast value of the atmospheric pressure adjusted to mean sea level for an altimeter setting region in an aeronautical code Q code |
| RMK | Remarks (used in METAR and SPECI code) |
| RVR | Runway visual range |
| RWY | Runway |
| SCT | Scattered (3–4/8 cloud cover; used in METAR, SPECI, TREND, and TAF code) |
| SPECI | Special Meteorological Report, issued when an operationally significant deterioration or improvement in airport weather conditions is observed |
| SYNOP | Synoptic code used for reporting weather observations |
| TAF | Terminal Aerodrome Forecast |
| TCU | Towering cumulus (used in METAR, SPECI, TREND, and TAF code) |
| TEMPO | Temporary (used in TREND and TAF code) |
| Td | Dew point temperature |
| TREND | A form of the landing forecast (used in METAR and SPECI code) |
| U/D/N | Up/down/neutral |
| UTC | Coordinated universal time |
| VA | Volcanic ash (used in METAR, SPECI, TREND, and TAF code) |
| VFR | Visual flight rules: a set of regulations under which a pilot operates |
| WMO | World Meteorological Organization |
References
- International Civil Aviation Organization (ICAO). Annex 3 to the Convention on International Civil Aviation: Meteorological Service for International Air Navigation, 20th ed.; International Civil Aviation Organization: Montréal, QC, Canada, 2018. [Google Scholar]
- Civil Aviation Authority of the Czech Republic (CAA). Letecký Předpis Meteorologie L3; Ministerstvo Dopravy České Republiky: Prague, Czech Republic, 2018.
- Mahringer, G. Terminal aerodrome forecast verification in Austro Control using time windows and ranges of forecast conditions. Meteorol. Appl. 2008, 15, 113–123. [Google Scholar] [CrossRef]
- Sharpe, M.; Bysouth, C.; Trueman, M. Towards an improved analysis of Terminal Aerodrome Forecasts. Meteorol. Appl. 2016, 23, 698–704. [Google Scholar] [CrossRef]
- Harris, G.R. Comparison of different scoring methods for TAFs and other probabilistic forecasts. In Proceedings of the 15th Conference on Probability and Statistics in the Atmospheric Sciences, Asheville, NC, USA, 8–11 May 2000. [Google Scholar]
- Caesar, K.-A. CMO Terminal Aerodrome Forecast (TAF): Verification Programme (CMOTafV). 2007. Available online: http://www.cmo.org.tt/docs/cmc47/pdfs/presentations/cmotafv.pdf (accessed on 29 September 2019).
- Hilden, A.; Hansen, J. Forecast Verification Report: Technical Report, 1999, 99-06. Available online: https://www.dmi.dk/fileadmin/user_upload/Rapporter/TR/1999/tr99-6.pdf (accessed on 8 July 2019).
- Gordon, N.D. Why and How to Verify TAFs: Doc. 45 Part G; CaEM-X: Geneva, Switzerland, 1994. [Google Scholar]
- Boyd, D.; Guinn, T. Efficacy of the Localized Aviation MOS Program in Ceiling Flight Category Forecasts. Atmosphere 2019, 10, 127. [Google Scholar] [CrossRef] [Green Version]
- North Atlantic Treaty Organization (NATO). AWP-4(B) NATO Meteorological Codes Manual; NATO s.l.: Bruxelles, Belgium, 2005. [Google Scholar]
Figure 1.
Scheme of the data assessment process.

Figure 2.
Results of the SPECI report evaluation; err: the portion of SPECI, where criteria for inclusion were not met; imp: the ratio of reports, where evaluation was not possible; wCOR: the rate of reports not assessed due to the upcoming corrective report COR; dup: the number of duplicated reports or identical reports; OK: the number of reports where criteria for the issue were met.

Figure 3.
Evaluation of the formal error rate of TAFs by individual station (see the text for details).
Figure 3.
Evaluation of the formal error rate of TAFs by individual station (see the text for details).

Figure 4.
Relative frequency of E errors in the TAF reports.

Figure 5.
An example of problematic coding of visibility.


Table 1.
List of stations. ICAO, International Civil Aviation Organization.
| Station | ICAO Indicator | Status | Station | ICAO Indicator | Status |
|---|---|---|---|---|---|
| Praha–Ruzyně | LKPR | Civilian | Praha–Kbely | LKKB | Military |
| Karlovy Vary | LKKV | Civilian | Čáslav | LKCV | Military |
| Ostrava–Mošnov | LKMT | Civilian | Pardubice | LKPD | Military |
| Brno–Tuřany | LKTB | Civilian | Náměšť nad Oslavou | LKNA | Military |
Table 2.
Criteria for the issue of Special Meteorological Report (SPECI) according to ANNEX3 App 3-2 (a regulation for Meteorological Service for International Air Navigation issued by the ICAO) with deviations from ANNEX 3 (Czech Hydrometeorological Institute, CHMI). VFR, visual flight rules; SCT, scattered; BKN, broken; OVC, overcast; QNH, value of the atmospheric pressure adjusted to mean sea in an aeronautical code Q code; REG QNH, forecast value of QNH; METAR, Aerodrome Routine Meteorological Report.
| Element | Conditions According to ANNEX 3 | Deviation from ANNEX 3 (CHMI) |
|---|---|---|
| Wind direction | ≥60° when the mean speed before and/or after the change being ≥10 kt | None |
| Wind speed | The mean surface wind speed has changed ≥10 kt | None |
| Gust wind | Change ≥10 kt when mean speed ≥15 kt | None |
| Visibility | Improving: changes to or passes through; deteriorating: passes through | 600 m, 800 m, 1500 m, 3000 m, and 5000 m |
| −800 m, 1500 m, and 3000 m | ||
| −5000 m (if significant numbers of VFR flights are operated) | ||
| Runway visual range (runway visibility) | Improving: to or passes through; deteriorating: passes through 50, 175, 300, 550, or 800 m | 50 m—not applicable for LKMT and LKTB |
| Temperature | An increase in air temperature of ≥2 °C | An increase in air temperature of ≥2 °C when temperature ≥20 °C |
| Onset or cessation of | Freezing fog | None |
| Thunderstorm (without precipitation) | ||
| Low drifting dust, sand, or snow | None | |
| Blowing dust, sand, or snow | ||
| Squall | ||
| Onset, cessation, or change in intensity of | Freezing precipitation | None |
| Moderate or heavy precipitation (including showers thereof) | ||
| Thunderstorm (with precipitation) | ||
| Duststorm | None | |
| Sandstorm | ||
| Funnel cloud (tornado or waterspout) | ||
| Onset or change in intensity of | Light precipitation (including showers) | |
| Clouds | Changes in amount of a cloud layer below 1500 ft | None |
| From SCT or less to BKN or OVC; or from BKN or OVC to SCT or less | ||
| Lowest cloud layer of BKN or OVC is lifting and changes to or passes through/is lowering and passes through (1) 100, 200, 500, or 1000 ft; (2) 1500 ft if significant numbers of flights are operated in accordance with VFR | 100, 200, 300, 500, 600, 1000, 1500, and 2000 ft | |
| QNH | Decrease ≥2 hPa | |
| Vertical visibility | improving: to or passes through; deteriorating: passes through 100, 200, 500, or 1000 ft | 100, 200, 300, 500, or 1000 ft |
| REG QNH | when new REG QNH is issued out of a regular METAR time | |
| Wind shear | when wind shear is reported out of a regular METAR time | |
| Runway condition | when change in the runway condition group is reported out of a regular METAR time |
Table 3.
The criteria used for the inclusion of change groups in the TAF or for the amendment of the TAF (App5 1.3). NSC, no significant clouds; FEW, few clouds; CB, cumulonimbus.
Table 3.
The criteria used for the inclusion of change groups in the TAF or for the amendment of the TAF (App5 1.3). NSC, no significant clouds; FEW, few clouds; CB, cumulonimbus.
| Element | Conditions According to ANNEX 3 | Deviation from ANNEX 3 (CHMI) |
|---|---|---|
| Wind direction | ≥60° for speed ≥10 kt | None |
| Wind speed | ≥10 kt | None |
| Gust wind | Change ≥10 kt when mean speed ≥15 kt | None |
| Visibility | 150, 350, 600, 800, 1500, 3000, or 5000 m (if significant numbers of VFR flights are operated) | None |
| Onset, cessation, or change in intensity of | Freezing fog | |
| Freezing precipitation | Moderate or heavy precipitation (including showers) | |
| Moderate or heavy precipitation (including showers) | Freezing precipitation | |
| Thunderstorm | Thunderstorm with precipitation | |
| Duststorm | Duststorm | |
| Sandstorm | Sandstorm | |
| Onset or cessation of | Freezing fog | |
| Low drifting dust, sand, or snow | Low drifting dust, sand, or snow | |
| Blowing dust, sand, or snow | Blowing dust, sand, or snow Thunderstorm with no precipitation | |
| Squall | Squall | |
| Funnel cloud (tornado or waterspout) | Funnel cloud (tornado or waterspout) | |
| Vertical visibility | 100, 200, 500, or 1000 ft | 100, 200, 300, 500, or 1000 ft |
| Changes in amount of a cloud layer below 450 m (1500 ft) | From NSC, FEW, or SCT to BKN or OVC From BKN or OVC to NSC, FEW, or SCT | None |
| Development/decline of CB | None | Cb |
| Lowest cloud layer BKN or OVC | 100, 200, 500, 1000, or 1500 ft (if significant numbers of VFR flights are operated) | 100, 200, 300, 500, 1000, or 1500 ft |
Table 4.
Operationally desirable accuracy of forecasts.
| Element to Be Forecasted | Operationally Desirable Accuracy of Forecasts | Minimum Percentage of Cases within Range |
|---|---|---|
| Wind direction | ±20° | 80% |
| Wind speed | ±5 kt | 80% |
| Visibility | ±200 m up to 800 m | 80% |
| ±30% between 0.8 and 10 km | ||
| Visibility | Occurrence or nonoccurrence | 80% |
| Cloud amount | One category below 450 m (1500 ft) Occurrence or nonoccurrence of BKN or OVC between 450 m (1500 ft) and 3000 m (10,000 ft) | 70% |
| Cloud height | ±100 ft up to 1000 ft | 70% |
| ±30% between 1000 ft and 10,000 ft | ||
| Air temperature | ±1 °C | 70% |
Table 5.
Overview of the number of real processed reports and reports eliminated from processing for the period 1 December 2016–3 March 2018. N: number of reports; E0: number of reports where the time in the body of the report is smaller than that in the bulletin by more than the tolerable margins; E1: number of reports where the time in the body of the report is higher than that in the bulletin by more than an hour; EZ: number of reports containing non-alphanumeric signs; EC: number of reports where designation COR (corrected) does not correspond with the header of the corrective bulletin; P1: number of dates with different reports.
| Station ICAO | TAF | METAR | SPECI | |||||||||||
|---|---|---|---|---|---|---|---|---|---|---|---|---|---|---|
| N | E0 | E1 | P1 | EC | N | E1 | EZ | P1 | EC | N | E0 | E1 | P1 | |
| LKCV | 1565 | 2 | 1 | 2 | 1 | 10,120 | 0 | 0 | 3 | 0 | 536 | 0 | 0 | 0 |
| LKKB | 1648 | 1 | 2 | 2 | 2 | 10,010 | 1 | 0 | 8 | 0 | 631 | 0 | 2 | 0 |
| LKKV | 1703 | 1 | 2 | 1 | 0 | 15,230 | 0 | 0 | 0 | 2 | 1793 | 0 | 0 | 1 |
| LKMT | 1685 | 0 | 0 | 1 | 0 | 19,555 | 0 | 0 | 1 | 1 | 832 | 0 | 0 | 1 |
| LKNA | 1562 | 1 | 3 | 3 | 2 | 10,125 | 0 | 0 | 49 | 1 | 768 | 0 | 0 | 0 |
| LKPD | 1600 | 0 | 1 | 3 | 0 | 10,033 | 3 | 1 | 1 | 0 | 707 | 1 | 0 | 0 |
| LKPR | 1673 | 1 | 0 | 1 | 0 | 19,452 | 0 | 0 | 0 | 1 | 2912 | 0 | 0 | 4 |
| LKTB | 1679 | 0 | 2 | 1 | 0 | 19,464 | 0 | 0 | 0 | 0 | 2005 | 0 | 0 | 2 |
Table 6.
Overview of the total numbers of reports and ERROR (E) and WARNING (W) errors in METARs and SPECIs.
Table 6.
Overview of the total numbers of reports and ERROR (E) and WARNING (W) errors in METARs and SPECIs.
| Station ICAO | METAR | SPECI | ||||||||
|---|---|---|---|---|---|---|---|---|---|---|
| N | E | W | EW | OK | N | E | W | EW | OK | |
| LKCV | 10,120 | 103 | 167 | 0 | 9850 | 536 | 12 | 20 | 0 | 504 |
| LKKB | 10,010 | 37 | 419 | 3 | 9551 | 631 | 14 | 32 | 0 | 585 |
| LKKV | 15,230 | 39 | 34 | 0 | 15,157 | 1793 | 13 | 2 | 0 | 1778 |
| LKMT | 19,555 | 74 | 71 | 0 | 19,410 | 832 | 9 | 4 | 0 | 819 |
| LKNA | 10,125 | 31 | 257 | 3 | 9834 | 768 | 6 | 16 | 0 | 746 |
| LKPD | 10,033 | 8 | 140 | 1 | 9884 | 707 | 10 | 18 | 0 | 679 |
| LKPR | 19,452 | 9 | 35 | 0 | 19,408 | 2912 | 26 | 13 | 0 | 2873 |
| LKTB | 19,464 | 36 | 37 | 2 | 19,389 | 2005 | 37 | 6 | 0 | 1962 |
Table 7.
Overview of total number of ERROR (E) and WARNING (W) errors at the analyzed stations in the METAR (M), SPECI (S), and METAR + SPECI (C) reports. BR, abbreviation of the French word “brume”; CAVOK, clouds and visibility OK; TCU, towering cumulus; BL, blowing; DR, drifted; DRSA, drifted sand; VA, volcanic ash; RVR, runway visual range.
| Error Type | Error Description | M | S | C |
|---|---|---|---|---|
| W | A space is replaced with the character “s” | 528 | 48 | 576 |
| W | METAR is from other than the expected date | 314 | 0 | 314 |
| W | Wind gust exceeds the average speed less by 10 kt | 272 | 35 | 307 |
| E | Character sequence does not match the expected format | 170 | 51 | 221 |
| E | Mist (BR) is indicated, but encoded visibility is <1000 m or >5000 m | 56 | 22 | 78 |
| E | Encoded visibility is ≤5000 m, but with no indicated phenomenon | 55 | 18 | 73 |
| W | Criteria for inclusion of the minimum visibility group are not met | 32 | 6 | 38 |
| W | Criteria for CAVOK are met, but separated groups are used instead | 29 | 3 | 32 |
| E | Element group is repeated more than possible | 20 | 6 | 26 |
| E | A mandatory group is missing | 10 | 13 | 23 |
| E | A fog is indicated, but encoded visibility is ≥1000 m | 7 | 8 | 15 |
| W | Report is from the time pertaining to a regular METAR | 0 | 14 | 14 |
| E | The height of the cloud base is lower than the height of the previous layer | 4 | 6 | 10 |
| W | Nonstandard visibility is detected | 7 | 3 | 10 |
| E | Cloud group or vertical visibility group is missing | 7 | 0 | 7 |
| W | Weather at the time of observation is recent | 4 | 3 | 7 |
| E | Variation of wind direction is larger than 180° | 6 | 0 | 6 |
| E | Temperature error Td > T | 4 | 1 | 5 |
| E | Encoded amount of cloud is lower than the required minimum for a given layer, and no TCU or CB is indicated | 2 | 2 | 4 |
| E | The indicated average wind direction does not lie between the indicated extreme wind directions (xxxVxxx) | 4 | 0 | 4 |
| E | The height of the cloud base is just like the previous one, and neither of them is TCU nor CB | 3 | 0 | 3 |
| E | When visibility is deteriorated due to lithometeors, with respect to BL + DR lithometeors (excluding DRSA), VA >5000 m | 2 | 0 | 2 |
| W | Value of RVR is nonstandard | 1 | 1 | 2 |
Table 8.
Overview of the number of criteria met for the SPECI issue per element.
| Element | LKCV | LKKB | LKKV | LKMT | LKNA | LKPD | LKPR | LKTB | C |
|---|---|---|---|---|---|---|---|---|---|
| Clouds | 172 | 159 | 566 | 228 | 315 | 236 | 1034 | 660 | 3370 |
| Phenomenon | 145 | 119 | 719 | 330 | 177 | 129 | 1016 | 683 | 3318 |
| Visibility | 227 | 299 | 523 | 335 | 416 | 356 | 609 | 507 | 3272 |
| Runway visual range | 0 | 6 | 99 | 65 | 0 | 39 | 310 | 212 | 731 |
| State of the runway | 0 | 0 | 171 | 94 | 0 | 0 | 174 | 112 | 551 |
| Wind gust | 28 | 25 | 29 | 0 | 25 | 38 | 130 | 0 | 275 |
| Temperature | 26 | 31 | 14 | 9 | 19 | 36 | 41 | 32 | 208 |
| Wind direction | 14 | 7 | 10 | 16 | 4 | 4 | 33 | 23 | 111 |
| Vertical visibility | 3 | 5 | 7 | 3 | 1 | 2 | 35 | 40 | 96 |
| Regional QNH | 0 | 0 | 10 | 11 | 0 | 0 | 25 | 15 | 61 |
| Wind speed | 4 | 6 | 6 | 4 | 4 | 3 | 9 | 13 | 49 |
| QNH | 0 | 0 | 0 | 1 | 0 | 0 | 8 | 4 | 13 |
| RWY wind shear | 0 | 0 | 1 | 0 | 0 | 0 | 3 | 0 | 4 |
Table 9.
Total number of dates used in the TAF assessment.
| File | cT | cTr | cTrC | cTa | A2x | A3x |
|---|---|---|---|---|---|---|
| LKCV | 1262 | 1222 | 38 | 79 | 6 | 1 |
| LKKB | 1317 | 1291 | 56 | 45 | 1 | 0 |
| LKKV | 1382 | 1371 | 3 | 81 | 3 | 0 |
| LKMT | 1366 | 1361 | 5 | 64 | 1 | 0 |
| LKNA | 1199 | 1178 | 67 | 44 | 1 | 0 |
| LKPD | 1403 | 1392 | 56 | 39 | 0 | 0 |
| LKPR | 1436 | 1434 | 2 | 54 | 2 | 0 |
| LKTB | 1424 | 1418 | 5 | 58 | 5 | 0 |
Table 10.
Success rate of evaluated elements in TAFs per station.
| Aggregate Success Rate of Evaluated Elements in TAF | ||||||||
|---|---|---|---|---|---|---|---|---|
| LKCV | LKKB | LKKV | LKMT | LKNA | LKPD | LKPR | LKTB | |
| Wind speed | 91.2 | 93.3 | 91.8 | 87.1 | 91.2 | 92.5 | 91.0 | 89.8 |
| Wind direction | 80.1 | 74.9 | 86.8 | 89.2 | 75.4 | 86.4 | 81.5 | 74.1 |
| Precipitation | 96.8 | 97.6 | 98.1 | 99.3 | 97.9 | 96.2 | 99.0 | 99.1 |
| Cloud amount | 79.1 | 77.2 | 73.1 | 75.3 | 73.4 | 79.6 | 75.7 | 78.3 |
| Cloud height | 69.6 | 67.0 | 76.0 | 71.7 | 67.3 | 68.6 | 72.6 | 74.8 |
| Visibility | 90.9 | 91.4 | 83.6 | 86.2 | 85.2 | 90.4 | 91.1 | 88.6 |
Publisher’s Note: MDPI stays neutral with regard to jurisdictional claims in published maps and institutional affiliations. |
© 2021 by the authors. Licensee MDPI, Basel, Switzerland. This article is an open access article distributed under the terms and conditions of the Creative Commons Attribution (CC BY) license (http://creativecommons.org/licenses/by/4.0/).
Share and Cite
MDPI and ACS Style
Novotny, J.; Dejmal, K.; Repal, V.; Gera, M.; Sladek, D. Assessment of TAF, METAR, and SPECI Reports Based on ICAO ANNEX 3 Regulation. Atmosphere 2021, 12, 138. https://doi.org/10.3390/atmos12020138
AMA Style
Novotny J, Dejmal K, Repal V, Gera M, Sladek D. Assessment of TAF, METAR, and SPECI Reports Based on ICAO ANNEX 3 Regulation. Atmosphere. 2021; 12(2):138. https://doi.org/10.3390/atmos12020138
Chicago/Turabian StyleNovotny, Josef, Karel Dejmal, Vladimir Repal, Martin Gera, and David Sladek. 2021. "Assessment of TAF, METAR, and SPECI Reports Based on ICAO ANNEX 3 Regulation" Atmosphere 12, no. 2: 138. https://doi.org/10.3390/atmos12020138
Note that from the first issue of 2016, this journal uses article numbers instead of page numbers. See further details here.