

Abstract
Externally generated, axial magnetic fields used to confine high-current plasma beams in compact linear devices are usually 0.5 Tesla or less and can be insufficient to suppress plasma instabilities. Such an issue is addressed in this study by closely winding the current-carrying cable around a small chamber attached to the end of a linear device. The magnetic field generated inside the small chamber during the high-current pulse reached 0.8 Tesla at the peak current of 10.83 kA. Formation of a steady plasma beam through a mixture of argon, hydrogen and helium was photographed by a high-speed camera at the instant of the peak current. The beam width profile starts from over 24.8 mm at the upstream location and becomes thinner with distance down-stream. At the location of laser-interferometer measurement, at the right-most viewing window on the test chamber, the beam width was estimated as 7.4 mm and plasma density was evaluated to be 1.0 × 10²² m−3, an increase of two orders of magnitude compared to a previous study. A simple relationship was derived for the plasma density as a function of beam width. Based on examination of the metal target at the far end, the final beam width was estimated as 50 µm, with the plasma density evaluated to be 4.31 × 10²² m−3, with a calculated ion energy of 4.35 keV, consistent with x-ray spectrum measurements.
Export citation and abstract BibTeX RIS

Original content from this work may be used under the terms of the Creative Commons Attribution 4.0 license. Any further distribution of this work must maintain attribution to the author(s) and the title of the work, journal citation and DOI.
1. Introduction
Early attempts to achieve controlled nuclear fusion were based on some variation of 'pinch' machines where an axial electric current was applied through a plasma in order to compress it [1, 2]. Early Z-pinch tests were usually characterized by kink and sausage instabilities [3] which prevented the achievement of sufficient confinement time to sustain fusion reactions and consequently, drove a shift to tokamak configurations with higher plasma temperatures and improved plasma confinement. Later Z-pinch research investigated implosion of metal wires [4, 5]. By arranging the metal wires into an X-shape (X-pinch) [6, 7], using two wires passing through a single point, a record near-solid density and a temperature of ∼1000 eV were observed at the region of intersection [8]. Alternatively, metal wire arrays were arranged in parallel [9, 10] and a record temperature of 200 keV was measured when tungsten wires were replaced by steel wires at Sandia Labs [11]. A recent review of electrical explosion of a wire (EEW) research at Tsinghua University [12], including both X-pinch and wire array Z-pinch techniques, summarized methods of optimizing EEW for radiographic and nanopowder applications. Alternative approaches using laser beams focused on a small deuterium–tritium (D–T) target achieved a plasma density of 6 × 10⁵ kg m−3 [13]. Laser methods of plasma confinement are also being explored for proton–boron fusion, e.g. [14]. While the recent experiments [8, 11, 13] demonstrated that the extreme temperature and density conditions existing naturally in the centre of the sun can be achieved in the laboratory, the confinement times still need to be improved to meet the Lawson criteria [15].
A novel approach to fusion power was proposed recently based on the concept of high energy density particle beams passing through a common focal region [16] and the intersection of at least two opposing pairs of plasma beams pinched by electric currents [17]. The inspiration for this approach is based on observations of lightning strikes in nature, which remain stable for multiple pulses extending for a period of up to 100 ms. Individual pulses/strikes can have a duration of up to 1 ms, although typical values are in the order of 100 μs [18]. It is commonly understood that lightning strikes are natural manifestations of the Z-pinch phenomenon. This innovative approach proposes that a multiple beam configuration can improve plasma stability in the spherical common focal region [19]. However, as a precursor to performing experiments with multiple intersecting plasma beams, investigations have been carried out using a single beam generated in a linear device. Experimental measurements from a single beam test can be compared against theoretical predictions.
Previous work [20, 21] has demonstrated the efficacy of the application of a prior axial B field, in combination with laser heating in a high power Z-pinch device, to produce higher D–D fusion neutron yields. Other recent studies [22, 23] were similar in their use of an external magnetic field to stabilize a high-density plasma beam during high-current pulses in a linear device to achieve Z-pinch conditions. However, instead of external laser-heating, high voltage was used to form the plasma. In the work described in [23], the magnitude of the axial B field (0.3 Tesla) was insufficient to suppress plasma instabilities under high-current conditions. In the present work, this issue is addressed by means of a novel magnetic confinement approach, stabilized by an external magnetic field, described below.
2. Experiments
Figure 1 shows the experimental apparatus, consisting of a large primary vacuum chamber to which a smaller chamber is attached, housing solid metal target #2. The purpose of the configuration is to permit a high-current pulse to pass through the full length of the primary chamber, from the plasma generator on the left (driven by pulse #1), through hollow target #1 (driven by pulse #2) to the solid target #2, located in the small chamber on the right (driven by pulse #3). A typical 'discharge' utilized a 1:6:10 mixture of argon, hydrogen and helium at a background pressure of 3.2 Pa. Power supplies #1 and #2 are set to trigger simultaneously followed by power supply #3, 1–2 ms later. Pulse #1 triggers the plasma generation while pulse #2 accelerates this plasma towards the hollow target (target #1 in figure 1). The hollow target permits plasma to be accelerated beyond the target into the downstream region of the chamber, towards target #2. Pulse #3 completes the high-current plasma beam connection between targets #1 and #2. One end of the cable from pulse #3 was tightly wound around the exterior of the small chamber for approximately its full length. During the pulse #3 discharge, for a typical peak current of 15 ka, the axial B field in the small chamber was calculated to be 0.8 Tesla. Hence, this self-generated B field easily exceeds the typical value of 0.3 Tesla for the external magnetic field in the primary vacuum chamber. The much stronger B field in the axial direction is intended to stabilize the plasma beam in the small chamber before it hits the target.
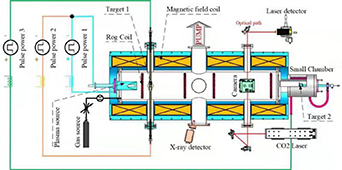
Figure 1. Schematic arrangement of test apparatus showing locations of measurements and discharge circuits (top view). The magnetic field strength was 0.3 Tesla.
Download figure:
Standard image High-resolution imageIn addition, multiple hollow, conical ceramic 'filtering devices' were installed between target #1 and the third viewing window where the high-speed camera was installed. The intention of these was to enforce separation of the heavier gyro-rotating ions, such as Ar from the lighter ions, H and He. During the tests, these devices appeared to have a stabilizing effect on the plasma beam. Without these devices, it was not possible to observe beams with the high-speed camera. It is believed that these devices constrain the electrons and ions to follow a narrower, more central path, resulting in more collisions and momentum transfer. With some modifications, the filtering devices were found to stabilize the plasma for the full duration of the pulse.
In previous experiments, (e.g. figure 14 of [23]), the plasma beam generated by the second circuit was observed to pass through the hollow target that led to the design of the third circuit. However, the current needed to achieve magnetic compression (or pinching) was still not reached due to instabilities at higher voltages. This observation led to the addition of the small chamber and relocation of the target.
With the new configuration, the peak electric current from pulse #3 passing through the plasma exceeded 10 ka and the records from the high-speed camera showed that the plasma beam can remain stable for the entire duration of the pulse. Figure 2 shows a typical image. This type of stable image was not observed in the previous experiments described in [23]. This indicates that the additional self-generated magnetic field in the small chamber was successful in stabilizing the plasma beam through magnetic confinement.
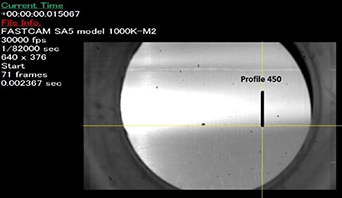
Figure 2. Decreasing beam width and intensity in the direction towards the small chamber (discharge 200 738).
Download figure:
Standard image High-resolution imageFigure 2, captured some distance to the left of the small chamber, and therefore outside of the additional self-generated magnetic field, shows both a decrease in intensity and width of the plasma beam in the direction towards the small chamber. This may be explained by the converging trajectory of electrons towards a smaller gyro-radius as they approach the small chamber. The resulting reduction in the cross-section of the beam path in the axial direction would lead to fewer electron-ion collisions and a reduction in emitted photons. Additionally, since a filtering device was located immediately to the left of the window area of figure 2, ions in the visible region would no longer have been constrained by the device and will be free to rotate at a larger radius, thereby leading to a decrease in the frequency of collisions, giving rise to the tail in intensity. Unimpeded by ions, the electrons will have greater freedom to accelerate towards the target #2. Their velocity will increase, leading to an increase in the magnetic compression towards the central axis (Lorentz force). The decrease in intensity and width may also of be a result of conventional magnetic-field-line mapping (width decrease) and pitch-angle alignment with B-field (intensity decrease). In weak field, the particles have less magnetic-field-aligned speed, spend more time at an axial location, and appear more intense, whereas the particles follow the magnetic field lines faster, appearing less intense as they cover more axial distance in the stronger axial magnetic field region. Attempts will be made to clarify these mechanisms in future experiments.
3. Beam radius distribution in axial direction
Based on the previous discussion, the width of the intense region of the plasma beam as observed by the high-speed camera is expected to be representative of width of the electron beam. The image captured by the high-speed camera consists of an array of 640 × 376 square pixels, calibrated such that each pixel is 0.167 mm in length. The intensity of each pixel image is represented in a grayscale by a number from 0 to 255, the latter representing saturation of the detector. It is assumed that the intensity increases radially towards the centre of the plasma beam, due to the increased plasma density and the associated frequency of electron–ion collisions.
Considering discharge 200 738 (figure 2), the maximum and minimum greyscale intensity values were 255 and 133, respectively, with an average of 194. Figure 3 shows the calculated shape of the plasma beam with a cut-off at the 194 level of grayscale intensity. This corresponds to an accepted image analysis approach based on the half-peak value of 194.

Figure 3. Calculated shape of plasma beam at 15.067 ms based on half-peak intensity value of 194.
Download figure:
Standard image High-resolution imageThis appears to be very different from the photograph shown in figure 2. The difference was attributed to the saturation of the data points, seen as the plateau or cut-off shown in figure 4 at the peak grey value of 255. The horizontal axis in the figure represents the vertical location of the beam in mm at the chosen profile. Using simple extrapolation from left and right side of the plateau, a more realistic peak value was estimated to be 326, with a revised greyscale value average of 230.

Figure 4. Grey value of profile 316 in the radial direction showing extrapolation from left and right side of the plateau.
Download figure:
Standard image High-resolution imageThe shape of plasma beam calculated using the revised greyscale value average of 230 is shown in figure 5, which looks quite similar to the photograph shown in figure 2. The maximum thickness at the upstream (left, not shown) was estimated as 24.8 mm. The thickness at a down-stream location of profile 450 was estimated as 7.4 mm (not shown).
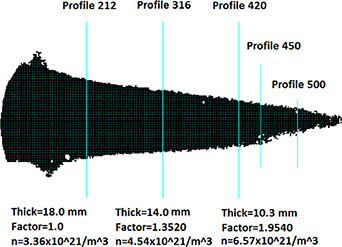
Figure 5. Shape of plasma beam at 15.067 ms adjusted using the revised greyscale value average of 230. The 'Factors' are the ratios of the thickness of profile 212 to the thickness of the other profiles, all to the power of 1.2 (from equation (6)).
Download figure:
Standard image High-resolution image4. Plasma beam density
The plasma densities during the pulse were measured using a single-channel CO2 laser dispersion interferometer [24] at the left and right side of the viewing window, figure 2, which may be represented by the locations of profiles 212 and 450 in figure 5 (The thick black line superimposed on figure 2 represents the profile 450 location). The laser paths were set up as shown in figure 6.
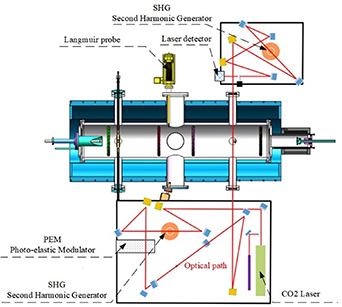
Figure 6. Laser paths for measurement of plasma beam densities, performed at the right-most viewing window.
Download figure:
Standard image High-resolution imageOnly one measurement location may be selected for each discharge. For the case of discharge 200 738, the plasma densities were measured from the left-side of the window (profile 212). The measured value was 6.05 × 10²¹ m−3 at the instant of 15.067 ms for a reference plasma beam width of 10 mm, figure 7. Since the raw measurement data are the line integrals of the plasma densities, the above measured value needs to be linearly prorated using the beam width at the measurement location, i.e. the location of profile 212 shown in figure 5. Using the width value of 18 mm at this location, the final plasma beam density as measured by the CO2 laser dispersion interferometer was 3.36 × 10²¹ n m−3.
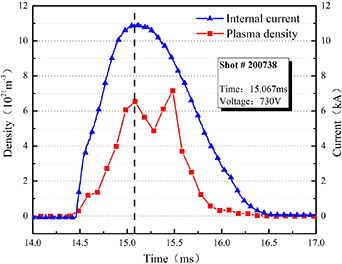
Figure 7. Beam densities measured by laser interferometer for an assumed plasma beam width of 10 mm—discharge 200 738. The current is from pulse #3. The vertical dashed line corresponds to the time of peak current (15.067 ms).
Download figure:
Standard image High-resolution imageNote that the plasma density profile shown in figure 7 is based on the reference thickness of 10 mm for consistency with time instants other than 15.067 ms, as detailed calculation was only carried out for the instant at the peak electric current.
5. A simple relationship
Plasma density only provides limited information about the beam upstream of the measurement location of profile 212 in figure 5, for the instant of 15.067 ms. For discharge 200 738, similar information at the down-stream was not measured. Instead, the plasma densities were measured at the down-stream location (profile 450) for discharges 200 825, 200 826 and 200 840 under similar conditions, i.e. power supply voltage of 1800 V, Ar/H/He ratio of 1:6:10, background pressure of 3.2 Pa and external magnetic field of 0.3 Tesla. In addition to discharge 200 738, there were nine more discharges with density measurements at the upstream (left side). The plasma densities measured from the left side are compared with the ones from the right side in figure 8. The measured values on the left side are generally smaller than the ones measured from the right side, with differences less than 50%. Therefore, it appears to be conservative to use the values measured from an upstream for a location further down-stream. For the case of discharge 200 738, the plasma density for an arbitrary axial location having beam width W, can be conservatively estimated using the following empirical relationship:


Figure 8. Beam densities measured from left and right sides of the right-most viewing window.
Download figure:
Standard image High-resolution imagewhere Wm= 18.0 mm and nm= 3.36 × 10²¹ n m−3 for the measurement location of profile 212 shown in figure 5.
Equation (1) implies that the product of plasma beam width and density is a constant at any location. This is an over-simplification, as is shown by equation (6). In order to improve its accuracy, the conservative relationship (1) may be generalized to be
where α is a constant to be determined, Wm and nm are known thickness and plasma density at a measurement location. On the other hand, plasma density at an arbitrary location may be calculated using the relationship given in equation (22) of reference [23], i.e.
In addition to equations (2) and (3), a third relationship between electric current and plasma density may apply, i.e.
where I0 is the electric current at the given location. The basis for equation (4) is that Joule heating is proportional to how many collisions a free electron experiences per unit time, which in turn is inversely proportional to the mean free path for the electron. Such a consideration is included in equation (4).
Replacing equation (4) into equation (3) and re-organizing, we have

or
Comparing the exponent of W on the right-hand side of equation (5), versus the one on the right-hand side of equation (2), we conclude that α equals 1.2. Consequently, equation (2) becomes
Replacing equation (6) into equation (4), equation (7) (below) was derived.
Using equation (7), as well as the maximum thickness (i.e. Wm = 24.8 mm) and I0 = 10.83 kA, the current at the down-stream location of profile 450 (W = 7.4 mm) was calculated to be 6.676 kA. This implies that a significant portion of electrons flow through a shell region surrounding the visible beam.
Measurement of electron temperature was attempted using a Langmuir probe with three sensors and a diameter of about 1.2 mm. Compared to the beam width of 7.4 mm, the probe is considered to be relatively thick. The probe was set up at the downstream location prior to discharge from the capacitor during a pulse. It was discovered that the probe interfered with the path of the plasma beam, figure 9, and, hence, the accuracy of this temperature measurement technique is unknown. Although ion and electron temperatures could be quite different, it is assumed that they are in thermal equilibrium here as the plasma shown in figure 9 is dense, associated with enhanced electron/ion collisions.
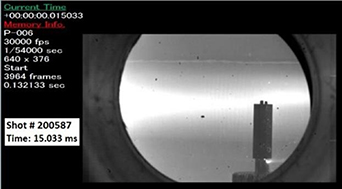
Figure 9. Interaction between Langmuir probe and plasma beam showing their relative sizes.
Download figure:
Standard image High-resolution imageThe measured results during the discharge shown in figure 9 were plotted in figure 10. At the time instant of 15.033 ms, the temperature was measured to be 41. 9 eV.
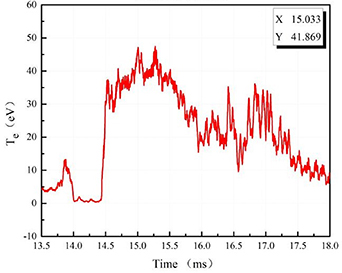
Figure 10. Electron temperature measured by Langmuir probe during the pulse for discharge 200 587 shown in figure 9.
Download figure:
Standard image High-resolution imageSeveral additional discharges were performed using parameters similar to those for discharge 200 738 (i.e. applied voltage, proportions of Ar/H/He and background pressure), figure 11. The temperature was estimated to be 43.9 eV based on average of four data points at the instant of 15.067 ms, corresponding to the four discharges shown in figure 11. Using the measured beam width and density for profile 212 in figure 5, the current of 6.676 ka and width of 7.4 mm for the down-stream location, equation (6) gives a plasma density of 0.98 × 10²² n m−3.

Figure 11. Electron temperature measured by the Langmuir probe for discharges 200 553–556.
Download figure:
Standard image High-resolution imageRelationship (6) has been derived based on a simple Joule-heating model. In order to verify its accuracy, the plasma density calculation was repeated for the down-stream location of profile 450 using the full-set of governing equations, assuming equilibrium between thermal and magnetic pressures, and applying the same simulation technique used for figure 15 of [23]. The result obtained was 1.00 × 10²² n m−3. The error produced from the simple Joule heating model was therefore negligible. Consequently, relationship (4), and the derived relationships (6) and (7), are accurate. In addition, this implies that the Langmuir probe temperature used as input to the simulation is also accurate.
Relationship (6) may be further generalized to include the effect of temperature variation along the axial direction of the vacuum chamber, measured at the third viewing window, towards the molybdenum target inside the small chamber, figure 1, i.e.
An inversely linear relation between plasma density and temperature is employed in equation (8) as the plasma nearly obeys the ideal gas law at high temperatures [19], considering the balance between thermal and magnetic pressures.
For the location near the metal target, the ion temperature can increase substantially due to anticipated conversion of its kinetic energy into thermal energy. This does not apply to the electrons as they are not stopped at, but flow through, the positive electrode (i.e. metal target). Ignoring the electron temperature near the target, equation (8) may be re-written as
where x is the average number of free electrons per ion at an upper-stream location with values of T, Wm and nm available.
6. Plasma density near metal target
The plasma temperature before the beam hits the solid metal target was not measured due the size of the small chamber. An upper-bound estimation may be given by the applied voltage between target #1 (inside vacuum chamber) and target #2 (inside small chamber), as shown in figure 1. This voltage was measured as 730 V at 15.067 ms for a typical 'discharge' 200 738 (figure 7). Assuming the electric power was fully converted into thermal energy, the ion temperature was estimated to be 730 eV. The uncertainty associated with this estimate is within one order of magnitude, based on comparison with figures 14 and 15. This differs from a temperature value of 43.9 eV (averaged over 4 data points from other, similar discharges, figure 11, measured at the down-stream location of profile 450) by a factor of 16.6.
After completion of a series of tests under conditions similar to discharge 200 738, the surface of the molybdenum target in the small chamber was examined and impression marks were found on the surface, figure 12. The width of the marks was measured to be in the range of 0.03–0.05 mm. The maximum electron energy was limited by the power supply voltage to 730 eV, which is well below the typical energy level required for the electrons to melt the surface (20–150 keV) [25]. Furthermore, if surface melting were the cause, the edges of the surface features would be more rounded, reflecting the effects of surface tension on molten metal. Figure 12 shows that the edges of the surface channels on the target appear sharp, indicating highly localized material removal.
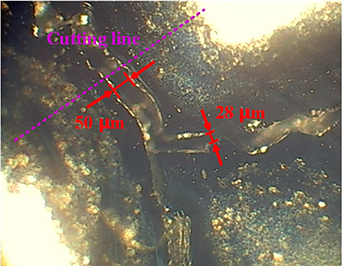
Figure 12. Surface channels left on molybdenum target.
Download figure:
Standard image High-resolution imageExamination of a polished tungsten target after a single discharge in an H plasma has confirmed that a single pulse discharge results in a single, circular damage region on the target surface. The formation of elongated channels may be explained by the tendency for subsequent electric discharges to be focused at locations with sharp edges of previously damaged regions and hence, the channels are believed to be the result of many consecutive discharges. However, the possibility that a single discharge could have produced some of the longer features seen in figure 12 cannot be discounted.
It is believed that the channels shown in figure 12 are the result of 'ion-etching' or 'ion-sputtering', but that the localized high density of ions is a result of pinching, and that the acceleration of ions occurs in the same direction as the electrons, as a result of Coulomb attraction to the concentrated negative charge associated with the high-current pulse. Indirect evidence for this effect was provided in [23]. At the target surface, while electrons continue to flow, the ions collide with the surface, creating the sputtering effect. Evidence for this is shown in figure 13, which was taken on a cross-section shown in figure 12.
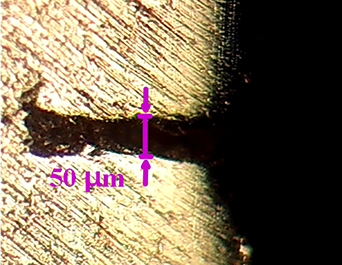
Figure 13. Cross-section of a 'channel' indicated by the 'cutting line' shown in figure 12.
Download figure:
Standard image High-resolution imageBased on the evidence from figures 12 and 13, an estimate of plasma beam width at the target location is 0.04 ± 0.01 mm. Using the conservative width of 0.05 mm, in combination with the beam width of 7.4 mm at the location of profile 450 and the density of 0.98 × 10²² n m−3 calculated using equation (6), equation (9) gives a most-likely estimate of 5.0 ± 1.5 × 10²³ n m−3 for the plasma density near the metal target, where the error term (30%) relates to uncertainty in the estimate of beam width from the measured channel width on the sputtered target. The value of x, the number of free electrons per ion, was approximated as 1.12, based on the reported ionization potentials of Ar:H:He in the stated proportions of 1:6:10 and the measured electron temperature of 43.9 eV. Recognizing the uncertainty associated with the assumed ion temperature of 730 eV, it is desirable to measure it near the metal target directly inside the small chamber in future experiments.
The accuracy of equation (9) was evaluated by repeating the calculation above using the full-set of governing equations and applying the same simulation technique as in [23]. Additional input information required for the simulation includes the external B field inside the small chamber (0.8 Tesla) as well as the electric current passing through the plasma beam of 0.05 mm in width before it hits the target. Such a current was calculated to be 0.905 ka using equation (7) and the input information from the location of profile 450, i.e. the current of 6.676 ka and the width of 7.4 mm. The simulation result was 5.2 × 10²³ n m−3, which compares very well with the previous estimate of 5.0 × 10²³ n m−3. This implies that equation (9) should be accurate to within 10% and total uncertainty in plasma density is about 40%.
7. Particle velocity and ion energy
In order to measure the ion energies associated with the collisions, the target was moved from the small chamber to the middle of the second or third viewing window and the small chamber was removed. Figure 14 shows the energy spectrum of x-rays measured using the silicon drift detector [26] shown in figure 1. The spectrum in figure 14 is a single Maxwellian distribution with a particle energy of 2.0 keV, obtained by statistical analysis of the energy spectrum. In order to increase the statistics of the measured spectra, the energy spectra of 60 discharges under conditions similar to discharge 200 738 were accumulated. A reasonable upper-bound energy, measured at a cut-off line shown in the figure 14, was 5.0 keV. Since this is much larger than the energy of the electrons (730 eV), it is believed that the energy of the ions must have been increased as a result of multiple collisions with electrons. Using the average particle mass of 8.48 × 10⁻²⁷ kg, (i.e. 5.06 × proton mass, for the mixed plasma with Ar:H:He = 1:6:10), a representative upper-bound particle velocity was evaluated to be 435 km s−1. The source of the x-rays is understood to be Bremsstrahlung resulting from deceleration of the particles as they collide with the target (at the second or third viewing window in the large chamber).
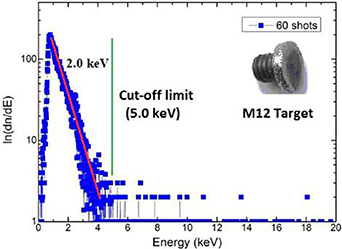
Figure 14. X-ray energy spectrum taken at the right-most viewing window, closest to the small chamber (max. value = 5.0 keV).
Download figure:
Standard image High-resolution imageIn the initial round of experiments, the copper rod connected to the molybdenum target was thinner, i.e. 4 mm in diameter (figure 15). The size was changed later (figure 14) to permit easier passage of the high currents through the copper rod. However, the x-ray spectrum shown in figure 15 for the earlier tests looked much stronger and the maximum photon energy estimated was 18 keV. The effect of the reduced diameter on the x-ray spectrum may be explained by additional radial compression of the beam striking the target, with a corresponding higher density of particle collisions. The small holes found on the metal surface suggest that the x-rays exceeding 730 eV were most likely produced by the ion/target collisions (figure 16). Since the metal target conducts electricity, electrons are anticipated to flow freely.
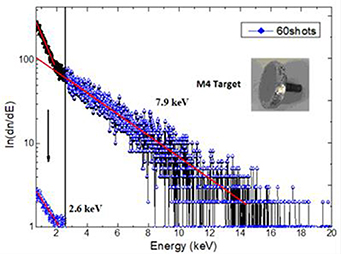
Figure 15. X-ray energy spectrum taken at the middle viewing window (figure 1) (max. value = 18 keV).
Download figure:
Standard image High-resolution image
Figure 16. Small holes discovered on M4 target after 60 discharges.
Download figure:
Standard image High-resolution image
The spectrum in figure 15 is a bi-Maxwellian distribution. The low-energy spectrum can be obtained by deducting the suprathermal components from the original spectrum. The former temperature is 2.6 keV and the latter is 7.9 keV 5 . Since the measurement location for figure 15 is at the second viewing window, the electron travel time is relatively short and consequently, the ions and electrons have not reached thermal equilibrium before striking the target. By comparison, the energy distribution shown in figure 14 demonstrates that the ions and electrons have reached thermal equilibrium by the time they have travelled to the third viewing window. Since the target in the small chamber is even further downstream, we conclude that ions and electrons are also in thermal equilibrium by the time they strike the target.
The average particle energy near the target in the small chamber may also be estimated using the ratio of peak current (10.830 kA) versus final current (0.905 kA) i.e. 13.09, as a multiplier applied to the voltage of 730 V (figure 7). This assumes that the electrons within and outside the visible width of the plasma beam are thermally coupled and the energies of all the electrons may be transported to the ions in the beam through collisions. The corresponding particle energy was estimated to be 4.35 keV (for hydrogen isotopes 6 ). This theoretical, calculated value is consistent with the average value of 2.0 keV in figure 14. The difference is believed to relate to the distance between the measurement location in the large chamber (right-most window in figure 1) and target in the small chamber. The longer the distance, the more collisions and the higher the energy of the ions. This average ion energy gives a plasma density of 4.31 × 10²² m−3 near the target. However, given the distance between the measured values and the target location, this estimate requires further validation.
8. Future experiments
The calculated ion density (4.31 × 10²² m−3) and measured energy (4.35 keV) determined from these experiments are encouraging. Confinement time is presently unknown. However, this could be inferred from the neutron yield in future experiments using deuterium plasma and deuterided target materials. It is planned to prepare metal deuteride targets in order to produce fusion neutrons through a beam/target mechanism [27].
9. Summary
The external magnetic fields to confine plasma beams in compact linear devices are usually 0.5 Tesla or less and can be insufficient to suppress plasma instabilities for beams generated by pulsed power supplies with high current passing through. Such an issue is addressed in this study by closely winding the cable carrying high current to form coils around a small chamber attached to the end of a linear device. The self-enhanced magnetic field inside the small chamber reached 0.8 Tesla at the peak electric current of 10.83 kA through a mixture of argon, hydrogen and helium plasma during a typical pulse. Formation of stable plasma beams under magnetic compression were photographed by a high-speed camera (100 kHz) at the instant of the peak current during the tests.
The measurement of beam width was performed for discharge 200 738 where the proportions of argon, hydrogen and helium gases in the background equal to 1:6:10. The beam width profile starts from over 24.8 mm at the upstream and becomes increasingly thinner in the down-stream. At a measurement location on the right-hand side of the third viewing window, the thickness was measured to be 7.4 mm. The beam thinning was found to continue after this location until the plasma beam width/thickness becomes invisible.
Laser-interferometer measurement was carried out for discharge 200 738 at a left-hand location of the third viewing window, corresponding to a measured thickness of 18.0 mm, and the plasma density was evaluated to be 3.36 × 10²¹ n m−3. Using a simple relationship derived in this paper the plasma density on the right hand side of the viewing window was calculated to be 1.0 × 10²² m−3, based on the difference in beam width between the left (18.0 mm) and right (7.4 mm) hand side locations. This represents an increase of two orders of magnitude compared to a previous study [23].
Based on examination of the metal target at the far end, the final beam width was estimated as 0.05 mm, with the plasma density evaluated to be 4.31 × 10²² m−3. This is associated with a plasma energy level of 4.35 keV at the target in the small chamber. Uncertainties in these values, plus insight into confinement time may be obtained through measurement of neutron yield in future planned experiments using deuterium plasma and target.
Acknowledgments
This work is supported partially by the National Natural Science Foundation of China under Grant Nos. 11775068, 11875198 and 11905151 and the Innovation Program of Southwestern Institute of Physics under Grant No. 201901XWCXRC004.
Footnotes
- 5
The energy limit for electrons under ohmic heating is <3 keV due to rapidly increasing radiative energy losses.
- 6
This assumes that the final beam at the target in the small chamber is primarily hydrogen. This is justified by the smaller gyro-radius of the hydrogen ions under the external B field.