Characterisation of High Temperature Oxidation Phenomena during AISI 430 Stainless Steel Manufacturing under a Controlled H2 Atmosphere for Bright Annealing

 ,
,  ,
,  and
and
Abstract
:1. Introduction
2. Materials and Methods
2.1. Materials and Bright Annealing Atmosphere
2.2. Oxide Scale Characterisation
3. Results
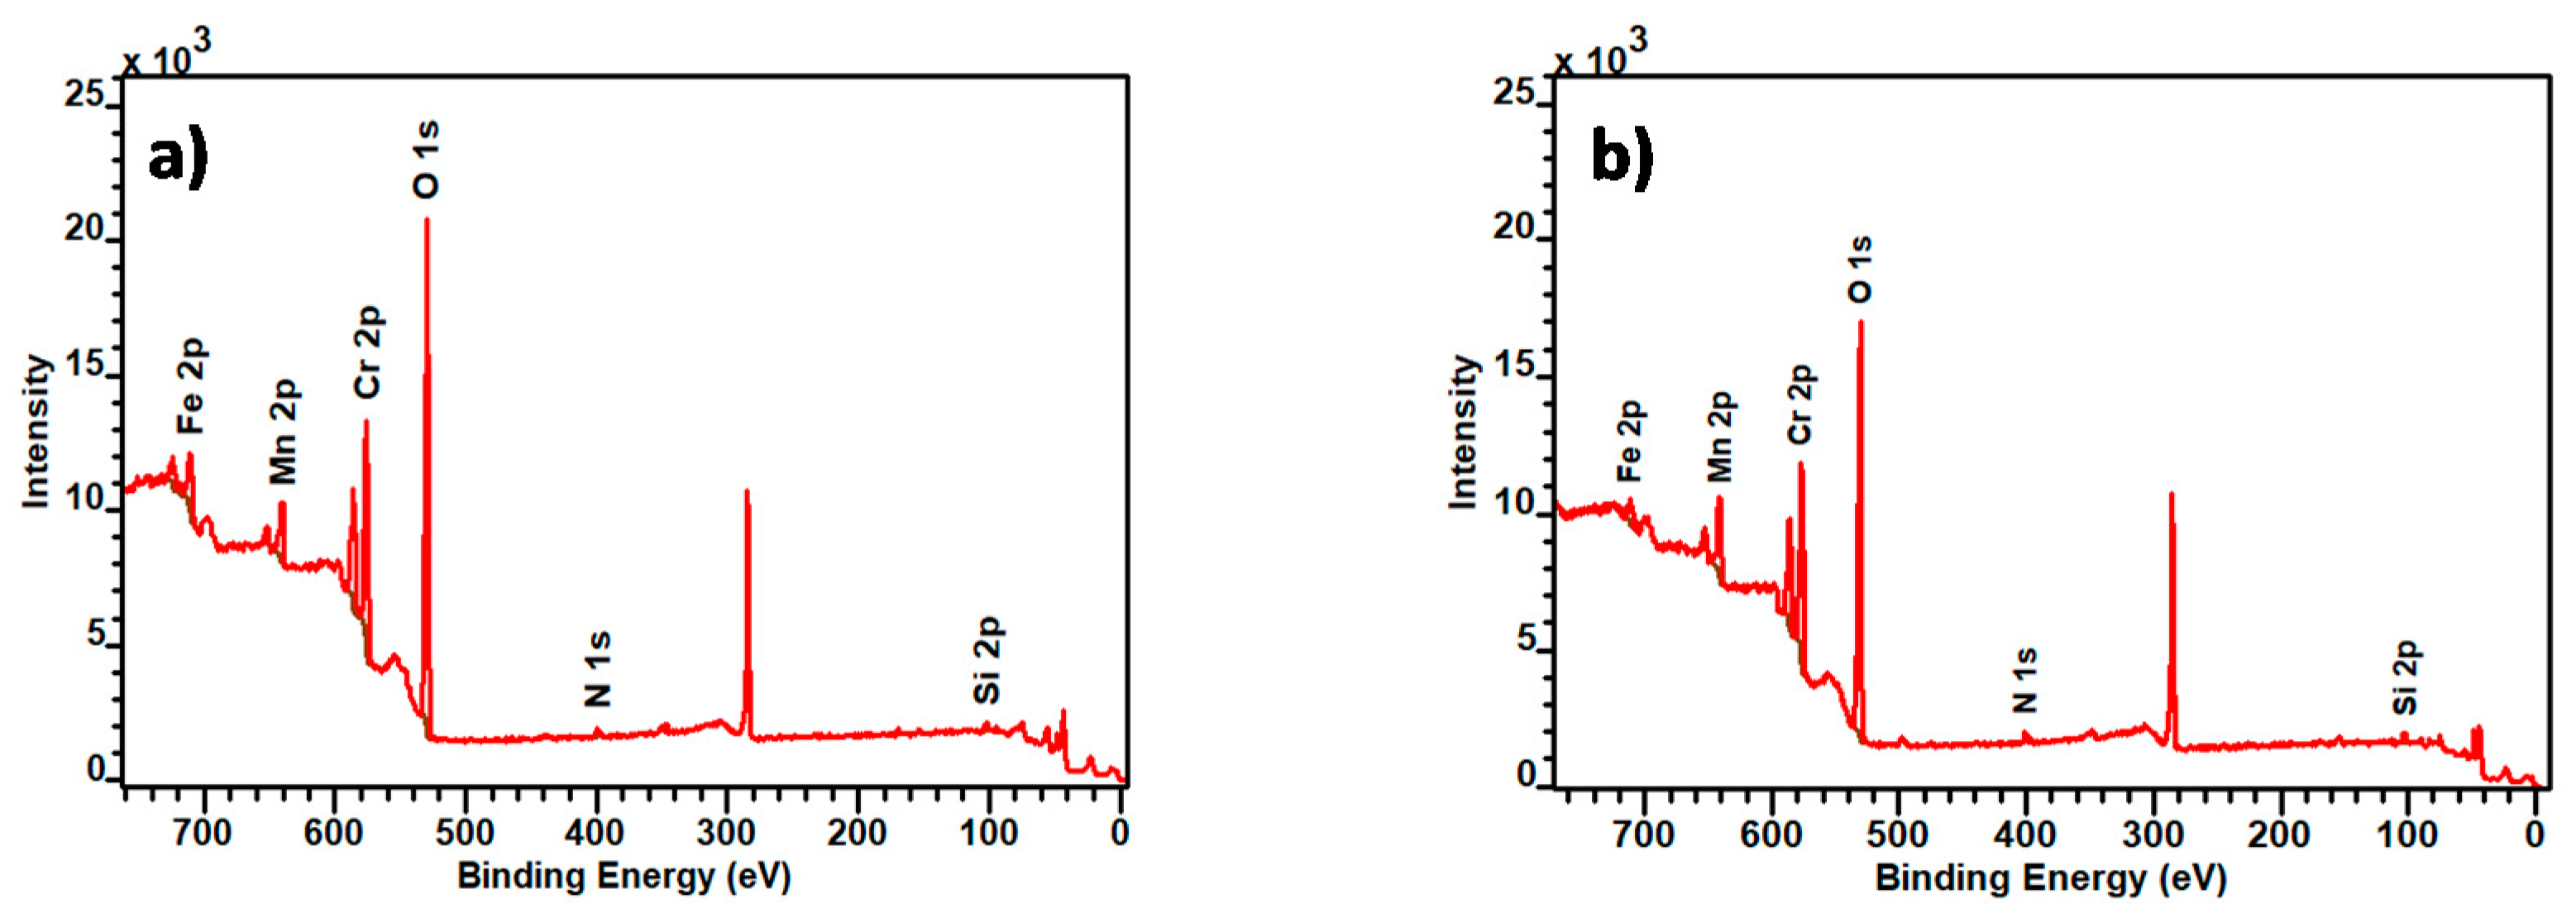
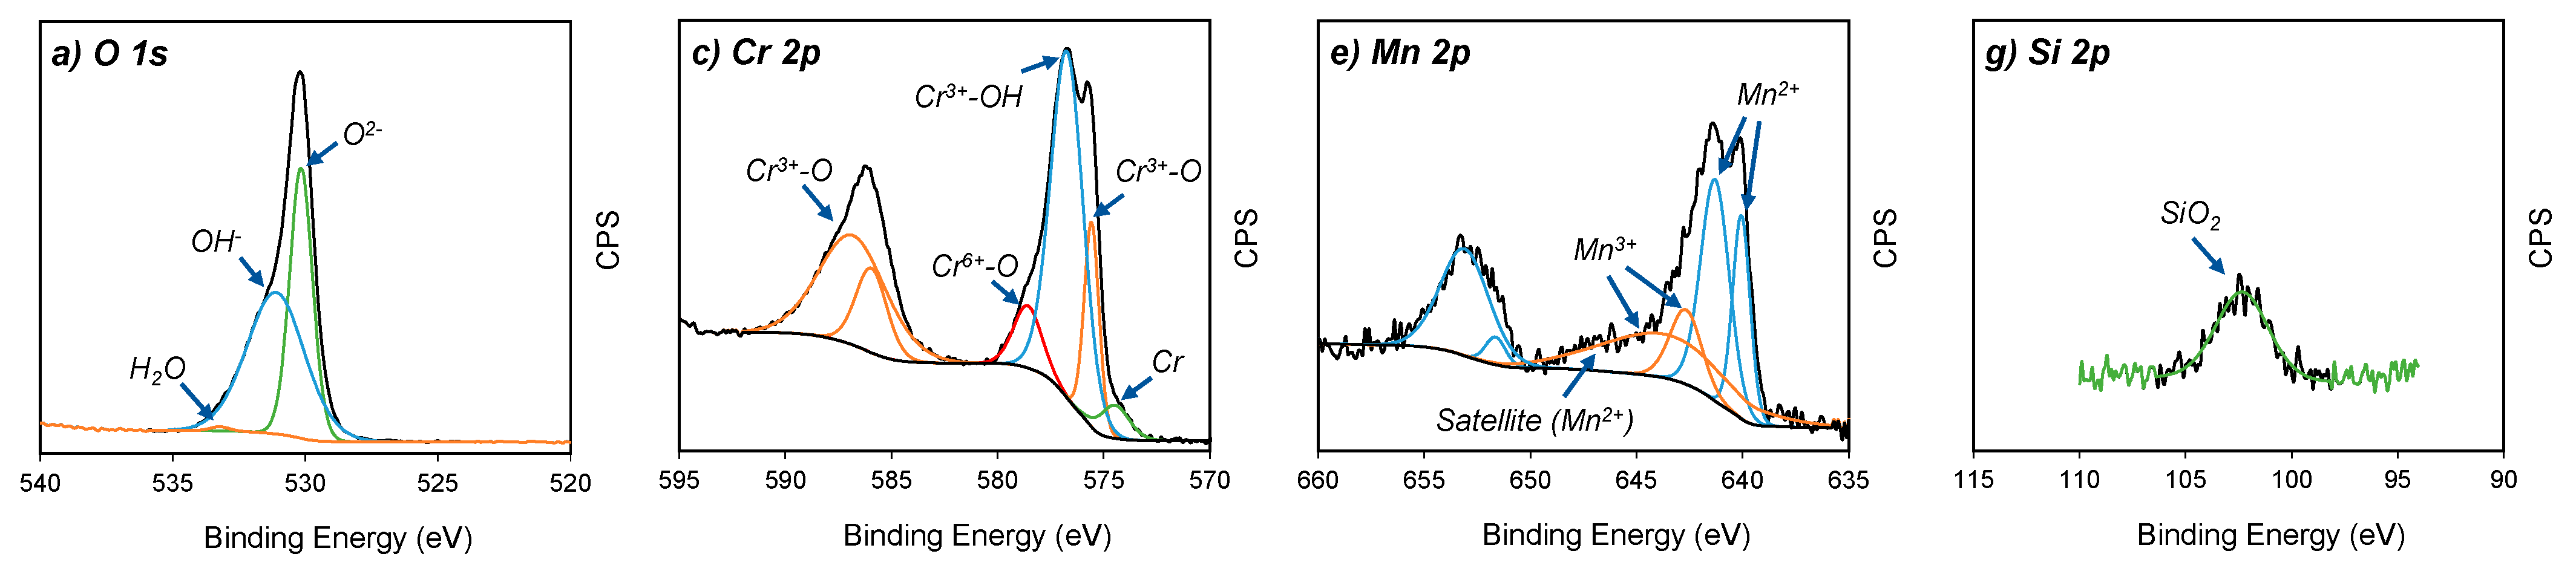
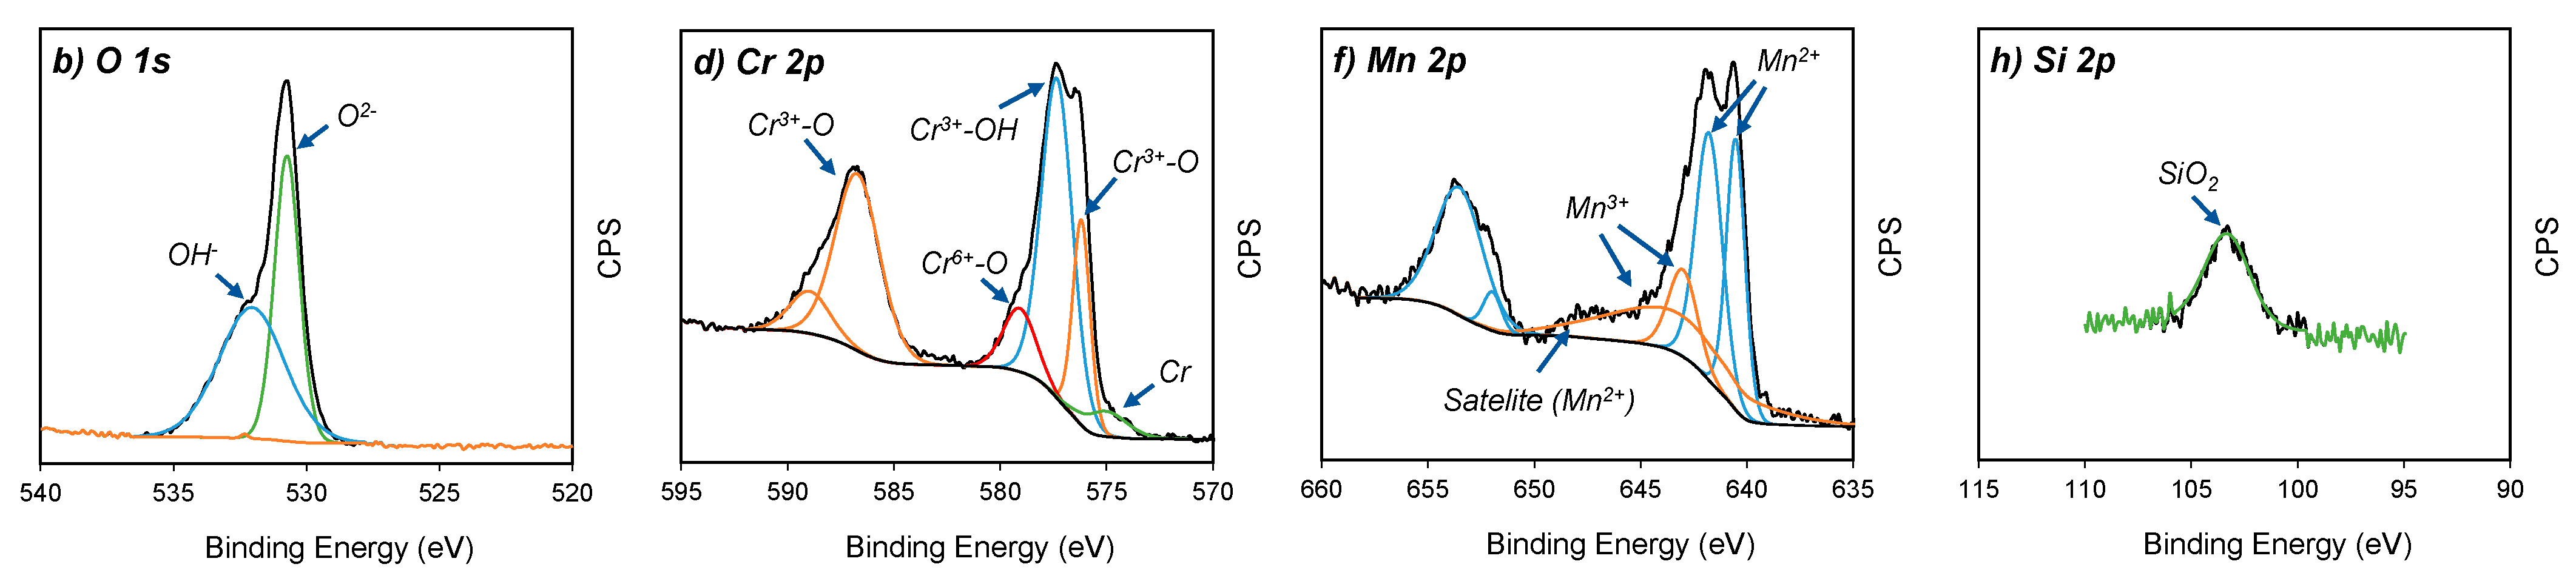
3.1. X-ray Photoelectron Spectroscopy
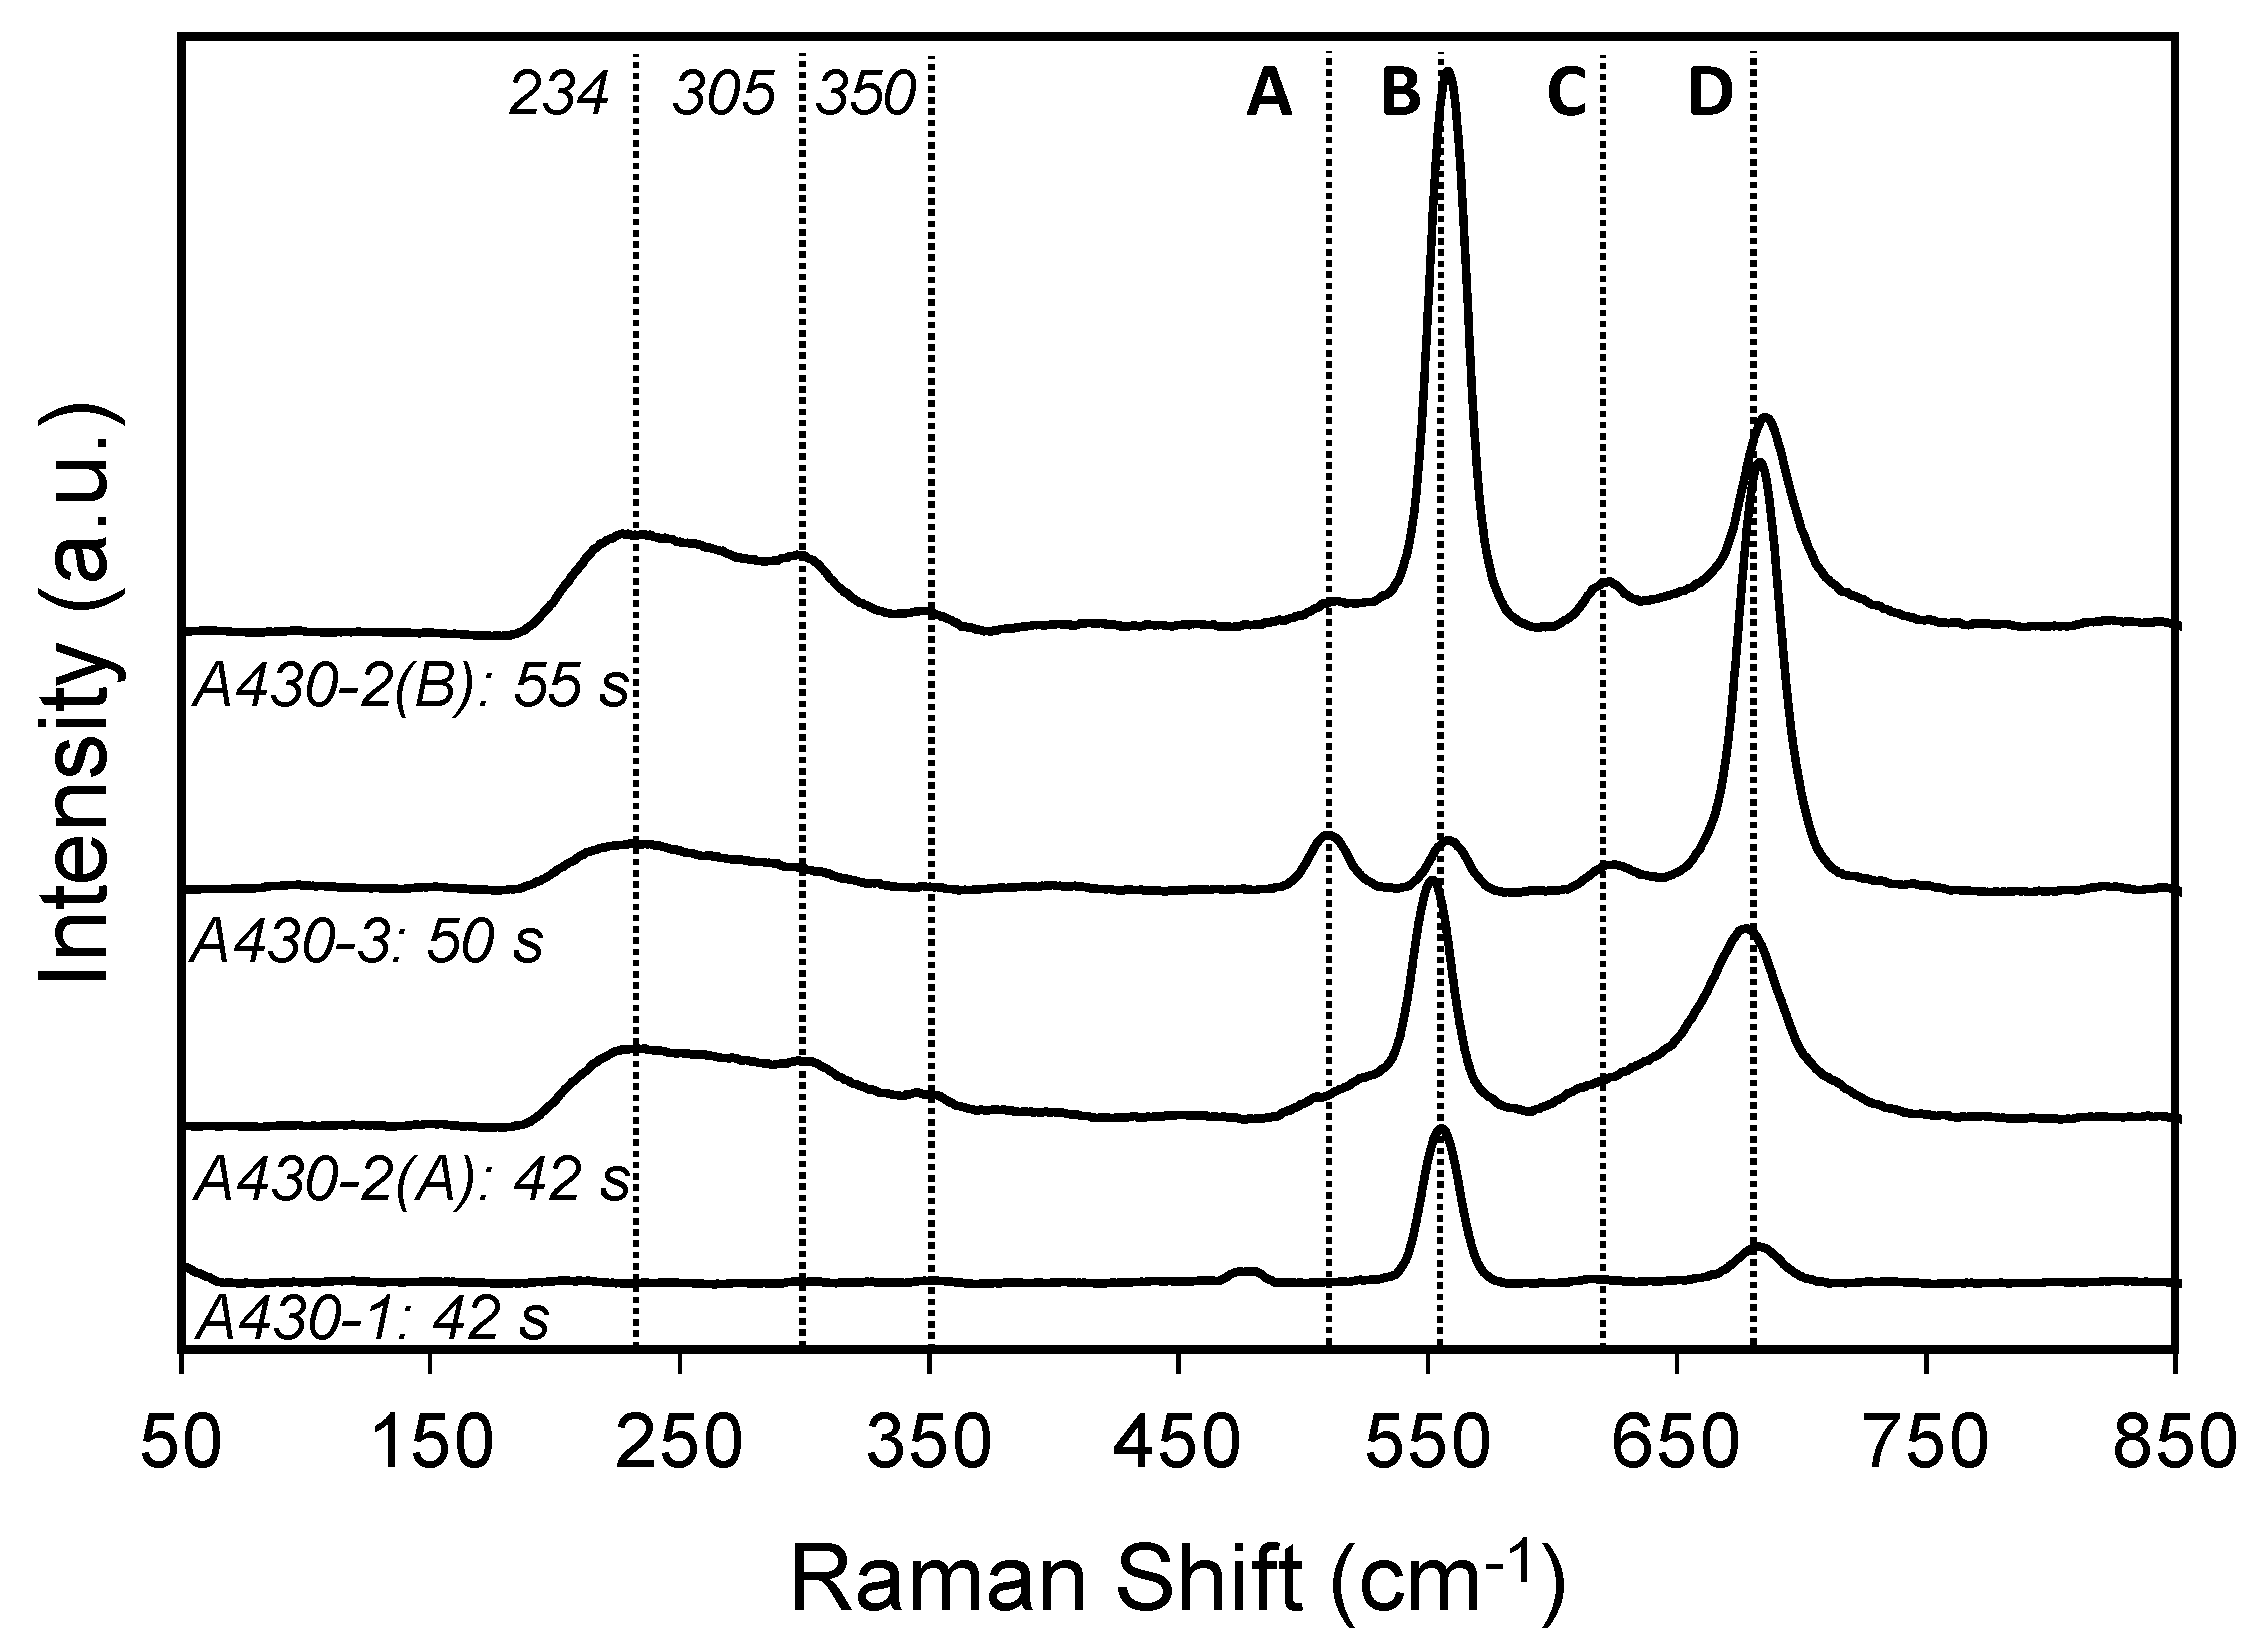
3.2. Raman Spectroscopy
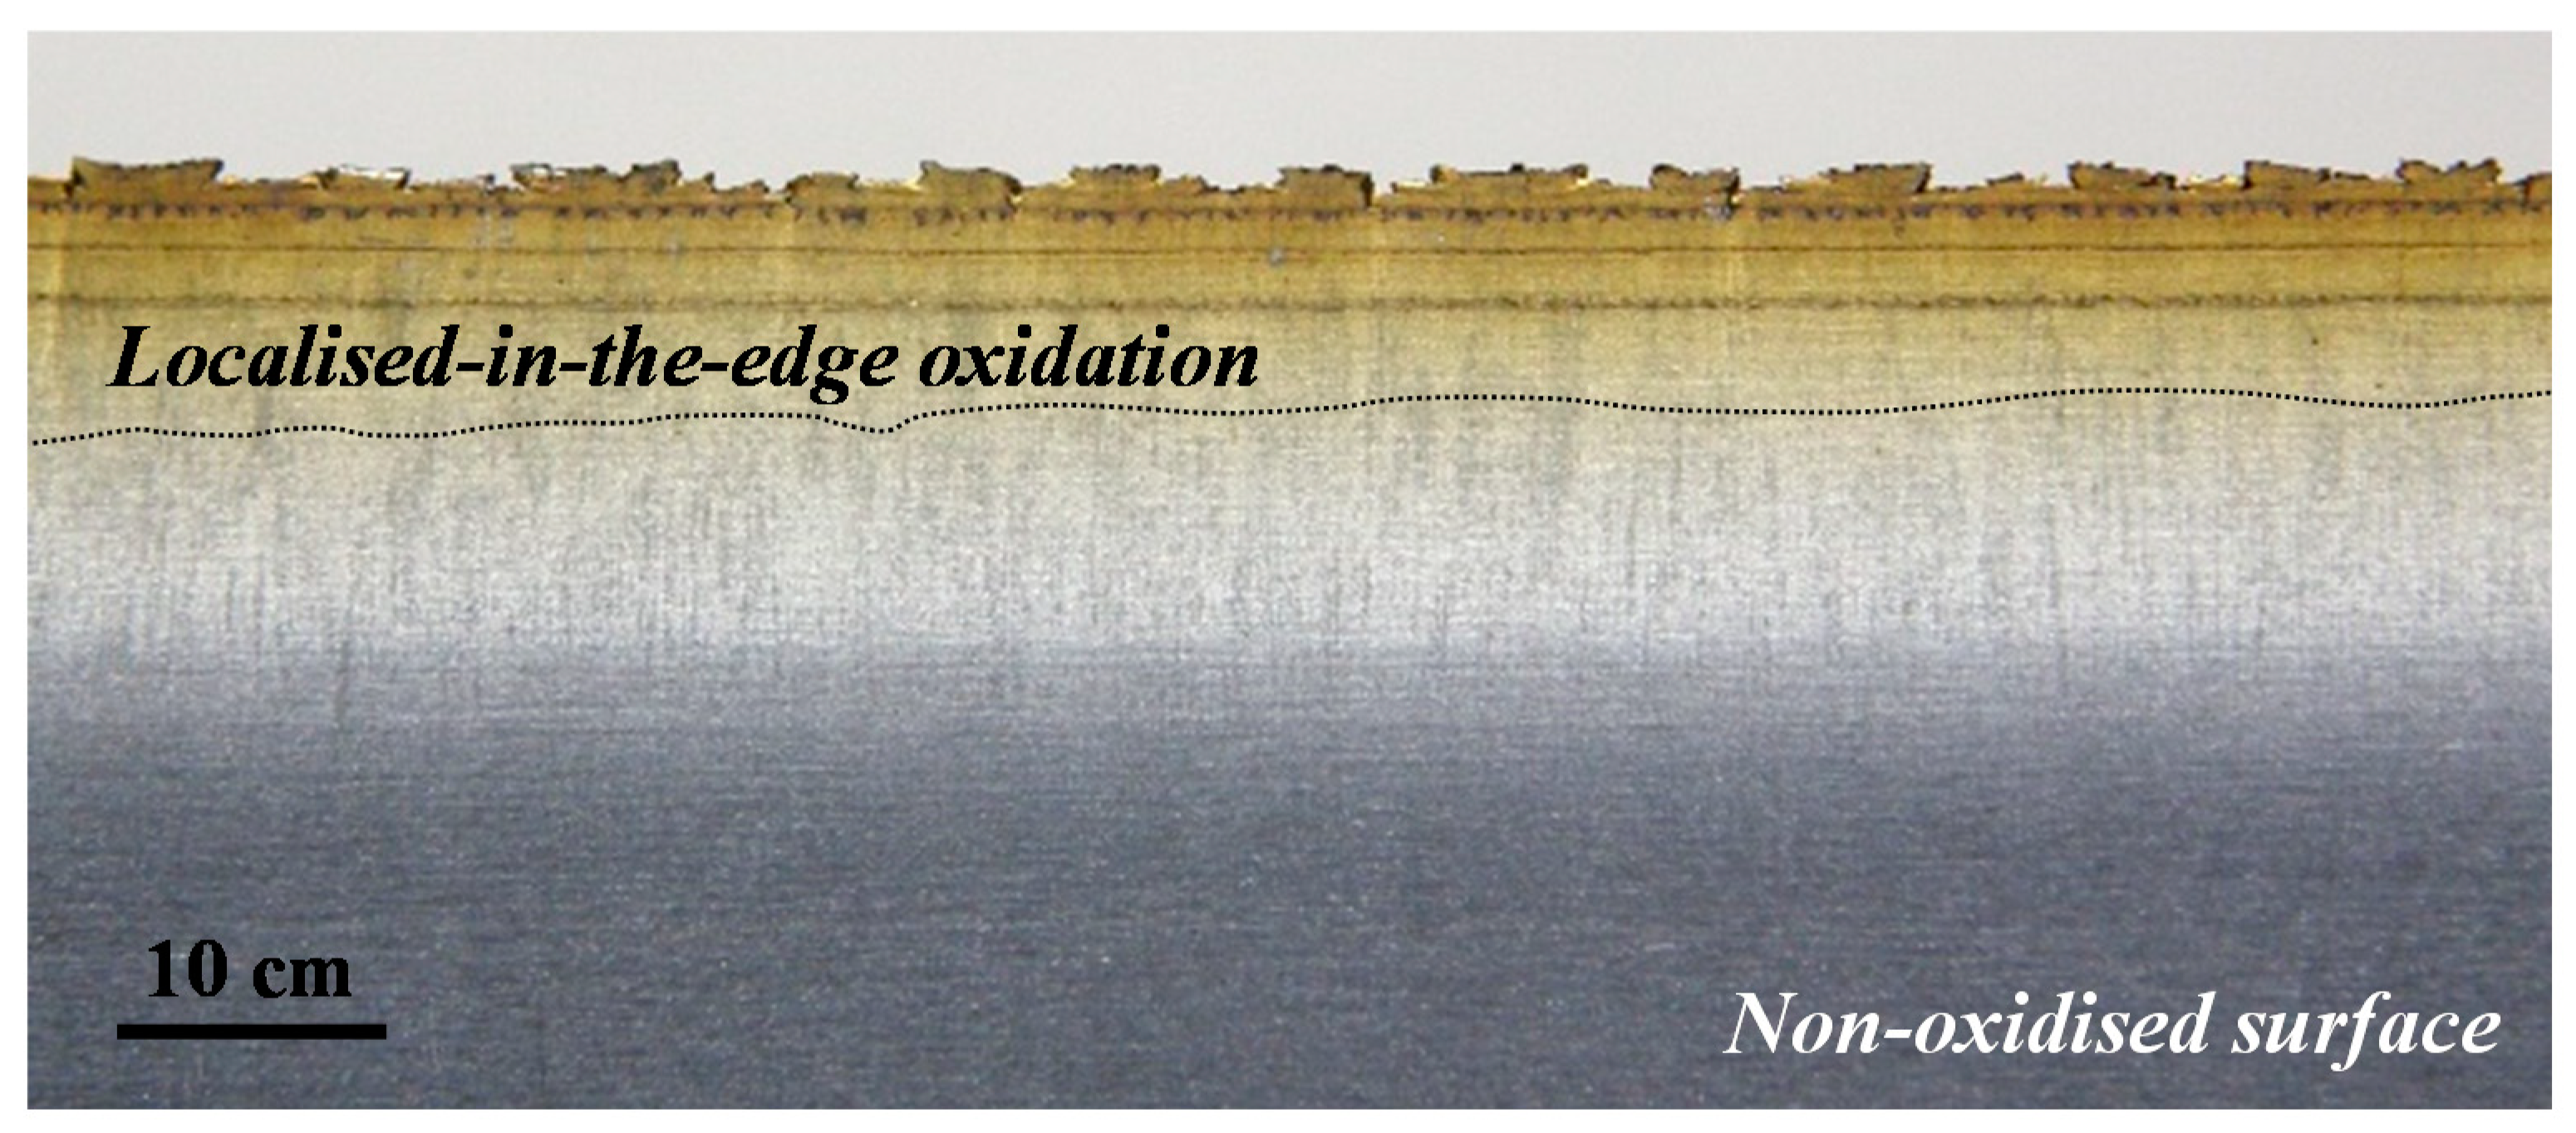
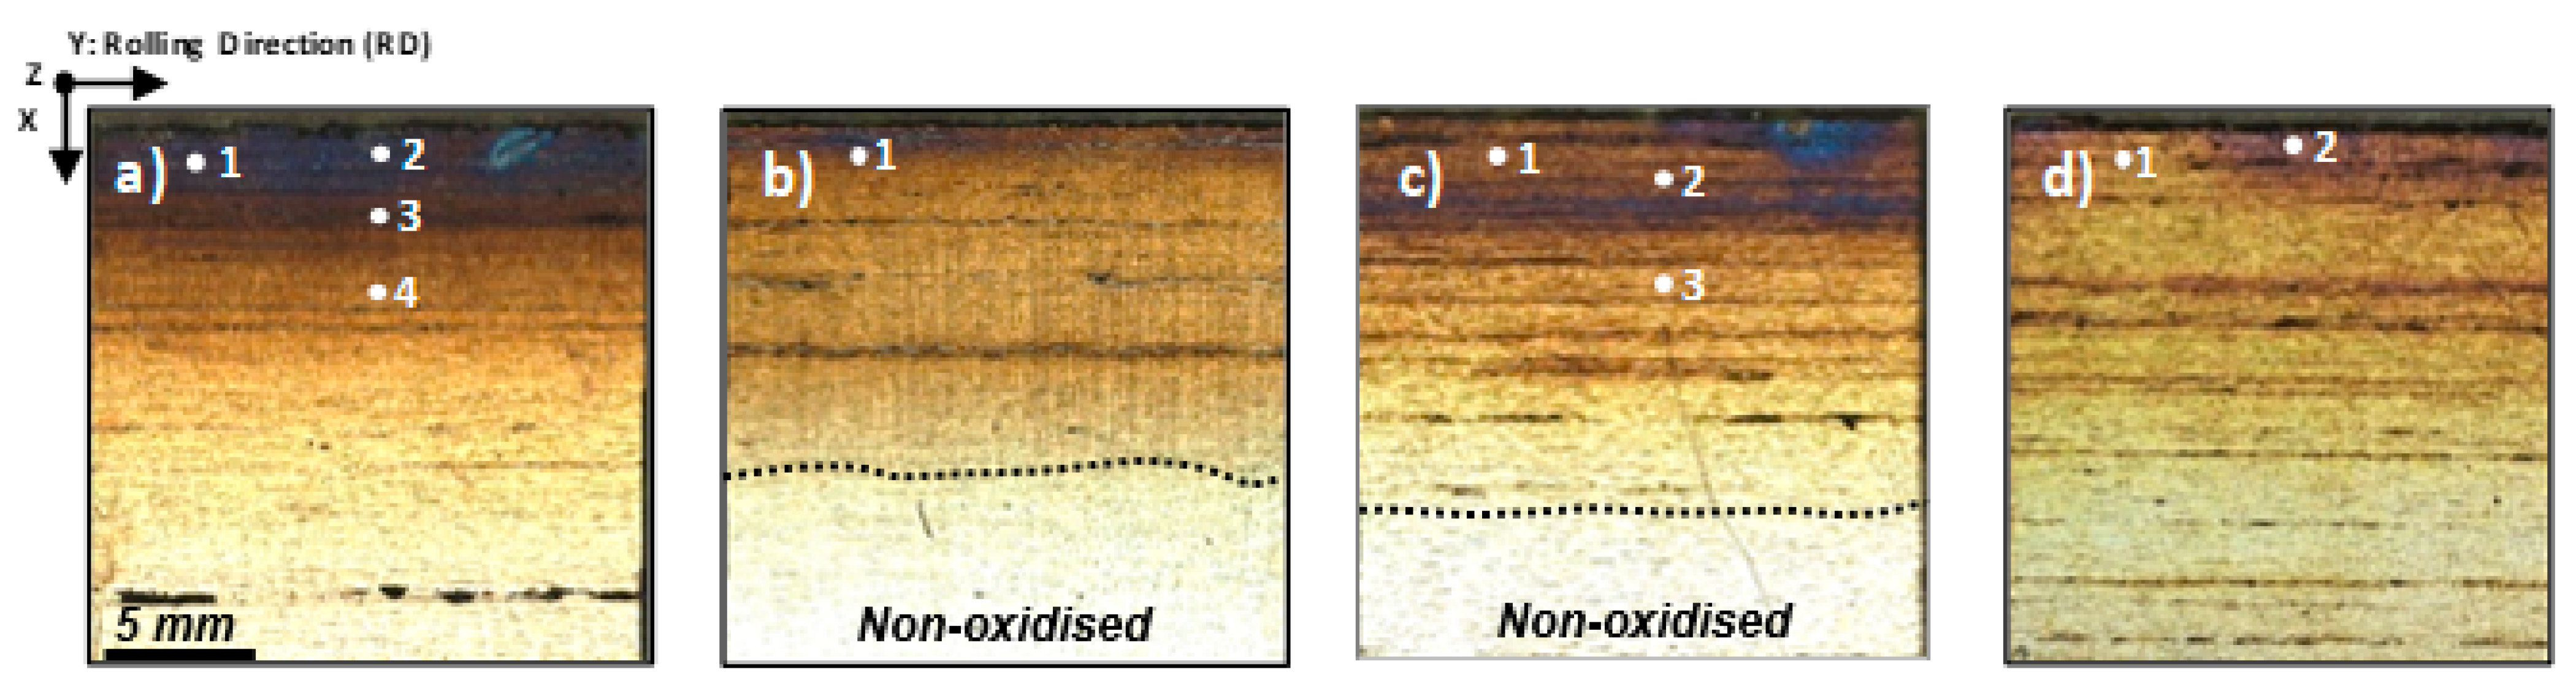
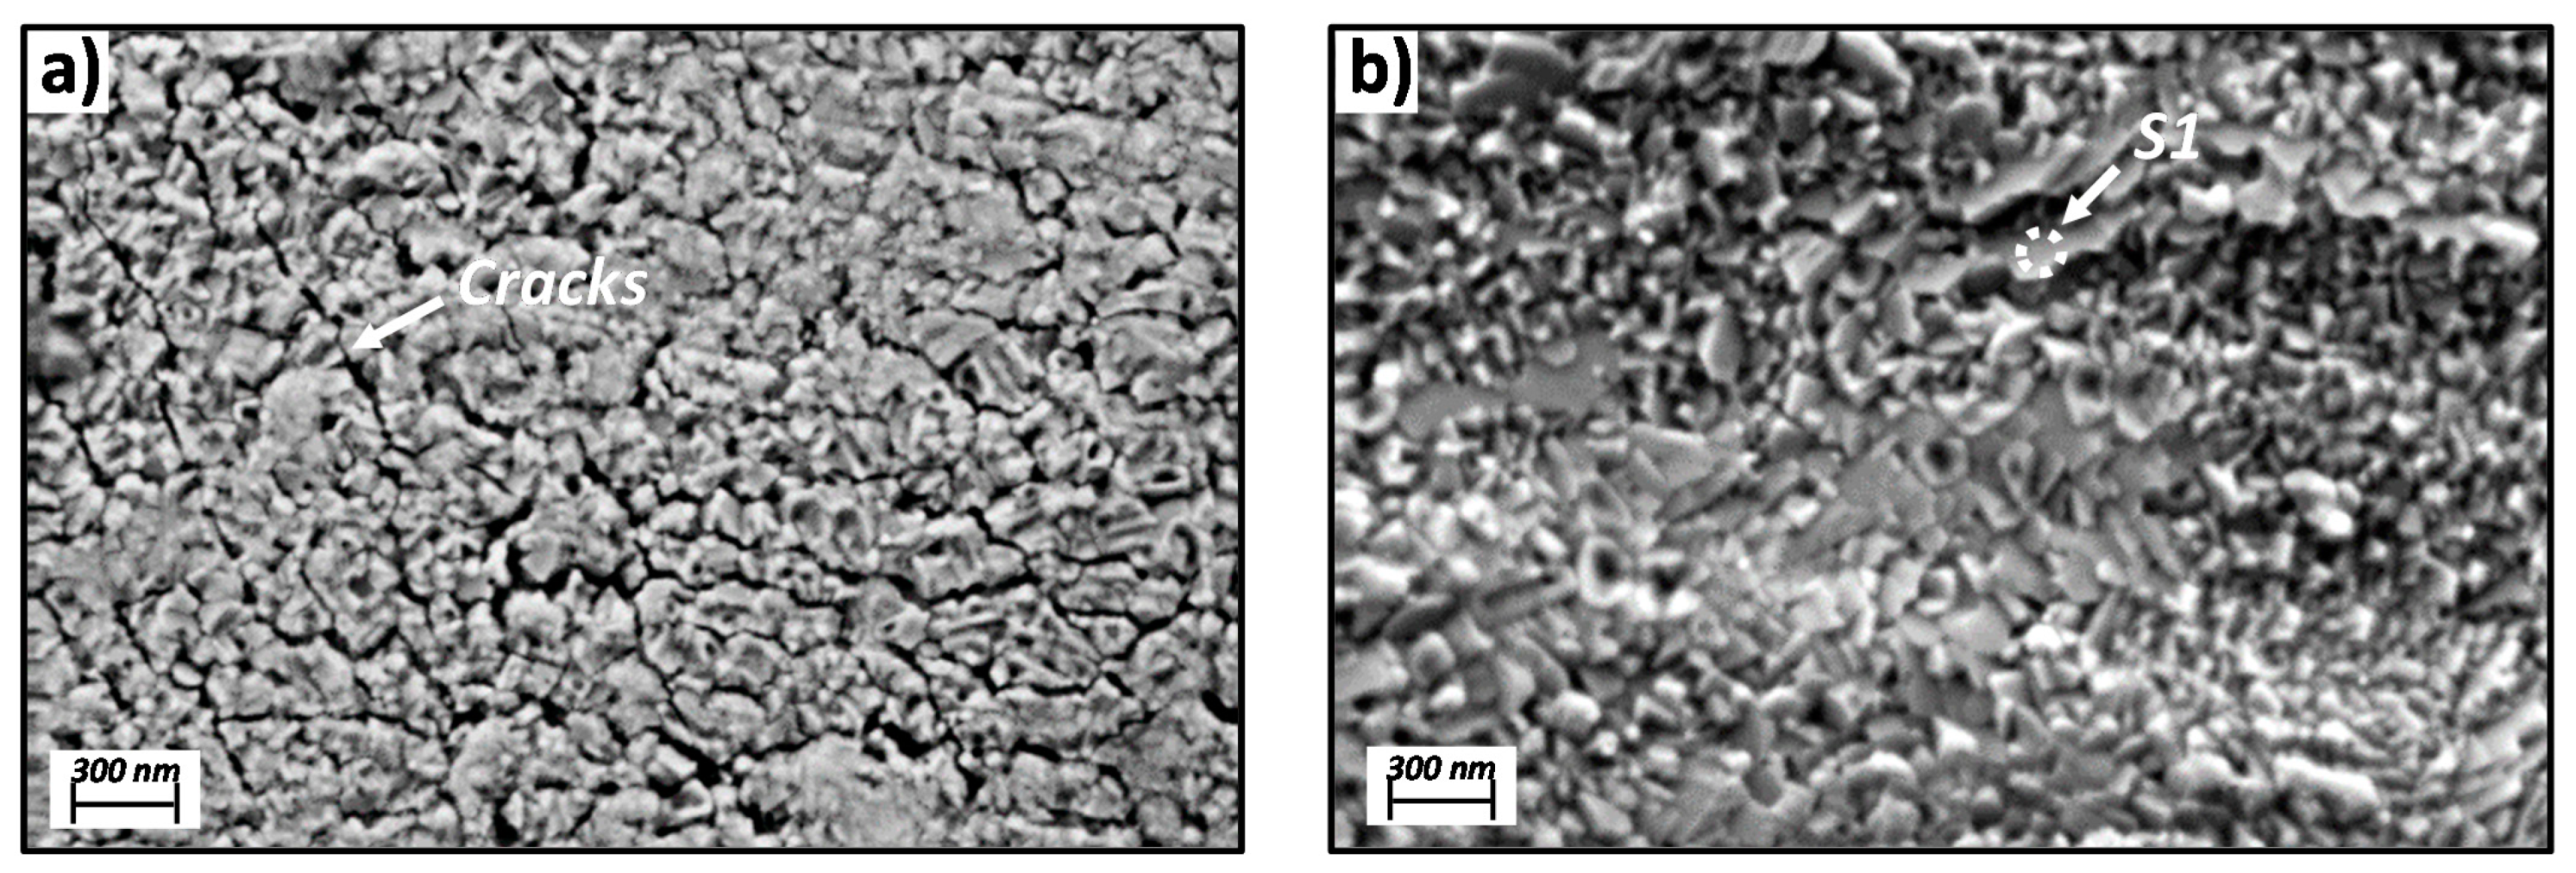
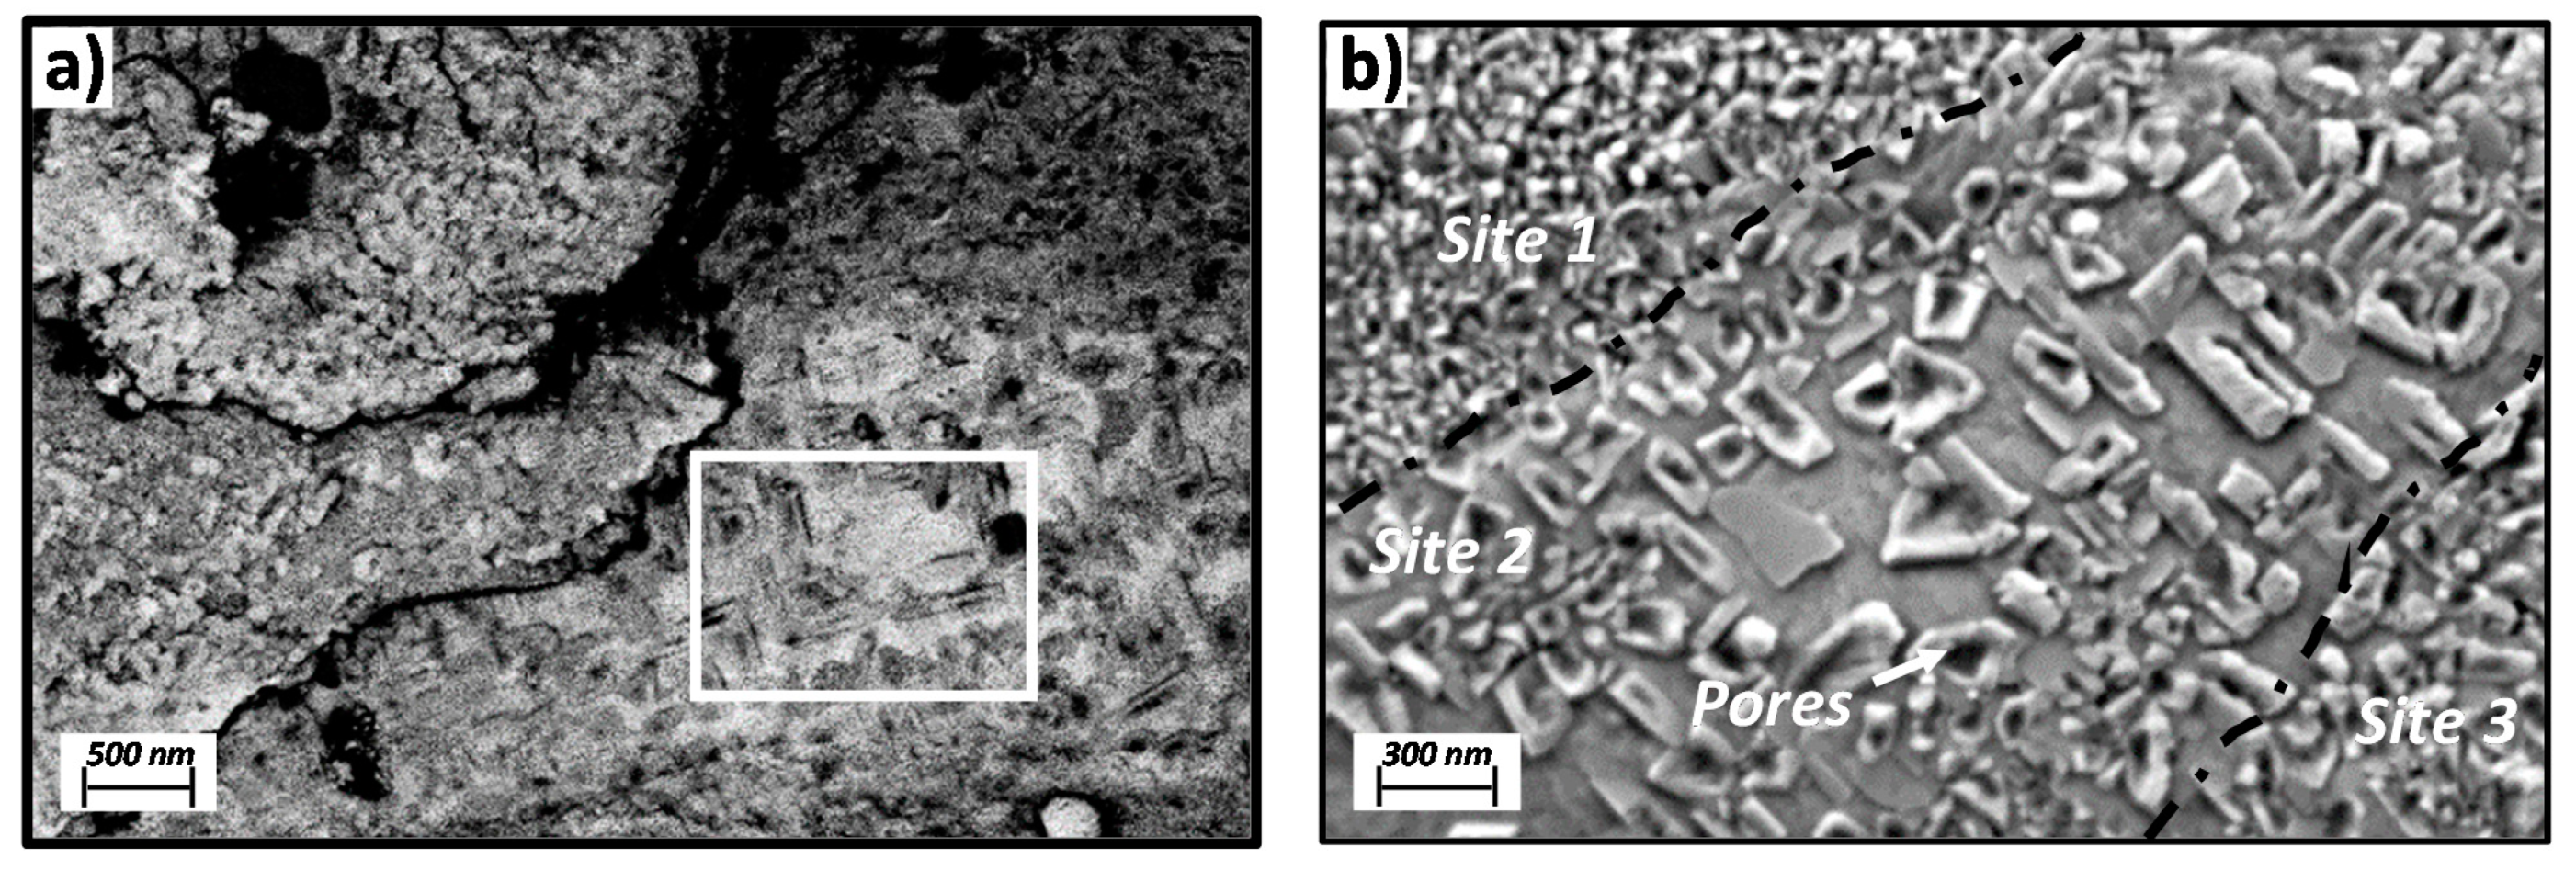
3.3. SEM Morphology
4. Discussion
5. Conclusions
Author Contributions
Funding
Conflicts of Interest
References
- Acerinox, S.A. Cedinox Spanish Stainless Steel Investigation & Research Association, (n.d.). Available online: https://www.cedinox.es (accessed on 20 April 2020).
- Swaminathan, S.; Spiegel, M. Effect of alloy composition on the selective oxidation of ternary Fe-Si-Cr, Fe-Mn-Cr model alloys. Surf. Interface Anal. 2008, 40, 268–272. [Google Scholar] [CrossRef]
- Hashimoto, K.; Asami, K.; Kawashima, A.; Habazaki, H.; Akiyama, E. The role of corrosion-resistant alloying elements in passivity. Corros. Sci. 2007, 49, 42–52. [Google Scholar] [CrossRef]
- Young, D.J.; Zurek, J.; Singheiser, L.; Quadakkers, W.J. Temperature dependence of oxide scale formation on high-Cr ferritic steels in Ar-H2-H2O. Corros. Sci. 2011, 53, 2131–2141. [Google Scholar] [CrossRef]
- Yu, Y.; Shironita, S.; Souma, K.; Umeda, M. Effect of chromium content on the corrosion resistance of ferritic stainless steels in sulfuric acid solution. Heliyon 2018, 4, e00958. [Google Scholar] [CrossRef] [PubMed] [Green Version]
- Kim, Y.; Lee, J.; Shin, K.S.; Jeon, S.H.; Chin, K.G. Effect of dew point on the formation of surface oxides of twinning-induced plasticity steel. Mater. Charact. 2014, 89, 138–145. [Google Scholar] [CrossRef]
- Schütze, M.; Renusch, D.; Schorr, M. Parameters determining the breakaway oxidation behaviour of ferritic martensitic 9%Cr steels in environments containing H2O. Corros. Eng. Sci. Technol. 2004, 39, 157–166. [Google Scholar] [CrossRef]
- Cvijović, I.; Parezanović, I.; Spiegel, M. Influence of H2-N2 atmosphere composition and annealing duration on the selective surface oxidation of low-carbon steels. Corros. Sci. 2006, 48, 980–993. [Google Scholar] [CrossRef]
- Norden, M.; Blumenau, M.; Wuttke, T.; Peters, K.J. The change of steel surface chemistry regarding oxygen partial pressure and dew point. Appl. Surf. Sci. 2013, 271, 19–31. [Google Scholar] [CrossRef]
- Young, D.J. High Temperature Oxidation and Corrosion of Metals, 2nd ed.; Elsevier: Sydney, Australia, 2008; ISBN 9780081001011. [Google Scholar]
- Ehlers, J.; Young, D.J.; Smaardijk, E.J.; Tyagi, A.K.; Penkalla, H.J.; Singheiser, L.; Quadakkers, W.J. Enhanced oxidation of the 9%Cr steel P91 in water vapour containing environments. Corros. Sci. 2006, 48, 3428–3454. [Google Scholar] [CrossRef]
- Yin, H.; Yuen, W.Y.D.; Young, D.J. Effects of water vapour and oxygen partial pressures on low carbon steel oxidation in N2–H2–H2O mixtures. Mater. Corros. 2012, 63, 869–877. [Google Scholar] [CrossRef]
- Nickel, H.; Wouters, Y.; Thiele, M.; Quadakkers, W.J. The effect of water vapor on the oxidation behaviour of 9%Cr steels in simulated combustion gases. Am. Soc. Mech. Eng. Press. Vessel. Pip. Div. PVP 1997, 359, 269–273. [Google Scholar]
- Tanahashi, M.; Furuta, N.; Yamauchi, C.; Fujisawa, T. Phase equilibria of the MnO-SiO2-CrOx system at 1873 K under controlled oxygen partial pressure. ISIJ Int. 2001, 41, 1309–1315. [Google Scholar] [CrossRef]
- Jung, I.H. Critical evaluation and thermodynamic modeling of the Mn-Cr-O system for the oxidation of SOFC interconnect. Solid State Ionics 2006, 177, 765–777. [Google Scholar] [CrossRef]
- Lins, V.D.F.C.; Madeira, L.; Vilela, J.M.C.; Andrade, M.S.; Buono, V.T.L.; Guimarães, J.P.; Alvarenga, E.D.A. Selective oxidation of dual phase steel after annealing at different dew points. Appl. Surf. Sci. 2011, 257, 5871–5878. [Google Scholar] [CrossRef] [Green Version]
- Wang, H.; Jin, X.; Hu, G.; He, Y. Changing oxide layer structures with respect to the dew point prior to hot-dip galvanizing of δ-TRIP steel. Surf. Coatings Technol. 2018, 337, 260–269. [Google Scholar] [CrossRef]
- Yang, Q.; Luo, J.L. Effects of Hydrogen on Disorder of Passive Films and Pitting Susceptibility of Type 310 Stainless Steel. J. Electrochem. Soc. 2001, 148, B29. [Google Scholar] [CrossRef]
- Guo, L.Q.; Qin, S.X.; Yang, B.J.; Liang, D.; Qiao, L.J. Effect of hydrogen on semiconductive properties of passive film on ferrite and austenite phases in a duplex stainless steel. Sci. Rep. 2017, 7, 8–13. [Google Scholar] [CrossRef]
- Bao, B.; Liu, J.; Xu, H.; Liu, B.; Zhang, K.; Jin, Z. Insight into a high temperature selective oxidation of HP40 alloy under a H2-H2O environment. RSC Adv. 2017, 7, 8589–8597. [Google Scholar] [CrossRef] [Green Version]
- Pardo Sainz, M.; Campo Ruiz, J.J. ¿Podría Estabilizarse una Fase Helicoidal en Mn1-xMgxCr2O4? Master’s Thesis, Universidad de Zaragoza, Zaragoza, Spain, 2019. [Google Scholar]
- Dutta, B.; Pal, D. Absorption and Raman spectroscopy: Ferrimagnet spinel MnCr2O4. AIP Conf. Proc. 2019, 2115, 2–6. [Google Scholar]
- Kjellqvist, L. Thermodynamic Description of the Fe-C-Cr-Mn-Ni-O System. Ph.D. Thesis, KTH Industrial Engineering and Management, Stockholm, Sweden, 2009. [Google Scholar]
- Manganese, Technetium and Rhenium. In Chemistry of the Elements, 2nd ed.; Greenwood, N.N.; Earnshaw, A. (Eds.) Butterworth-Heinemann: Oxford, UK, 1997; pp. 1040–1069. ISBN 978-0-7506-3365-9. [Google Scholar]
- Biesinger, M.C.; Payne, B.P.; Grosvenor, A.P.; Lau, L.W.M.; Gerson, A.R.; Smart, R.S.C. Resolving surface chemical states in XPS analysis of first row transition metals, oxides and hydroxides: Cr, Mn, Fe, Co and Ni. Appl. Surf. Sci. 2011, 257, 2717–2730. [Google Scholar] [CrossRef]
- Curia, M.V. Estudio Fisicoquímico y Catalítico Del Sistema Mn-O-V. Ph.D. Thesis, Universidad Nacional de La Plata, Buenos Aires, Argentina, 2010; p. 209. [Google Scholar] [CrossRef]
- Hu, L.; Wang, W.; Tu, J.; Hou, J.; Zhu, H.; Jiao, S. Self-assembled amorphous manganese oxide/hydroxide spheres via multi-phase electrochemical interactions in reverse micelle electrolytes and their capacitive behavior. J. Mater. Chem. A 2013, 1, 5136–5141. [Google Scholar] [CrossRef]
- Li, L.; Sui, J.; Qin, W. Superior capacity, rate, long cycle life and high temperature performance of multilayered porous ultralong LiMn2O4 nanorods for lithium ion batteries. J. Electroanal. Chem. 2019, 833, 304–312. [Google Scholar] [CrossRef]
- Thermo Scientific. XPS Simplified, (n.d.). Available online: https://xpssimplified.com/index.php (accessed on 8 September 2020).
- Badin, V.; Diamanti, E.; Forêt, P.; Darque-Ceretti, E. Water Vapor Oxidation of Ferritic 441 and Austenitic 316L Stainless Steels at 1100 °C for Short Duration. Procedia Mater. Sci. 2015, 9, 48–53. [Google Scholar] [CrossRef]
- Essuman, E.; Meier, G.H.; Żurek, J.; Hänsel, M.; Quadakkers, W.J. The effect of water vapor on selective oxidation of Fe-Cr alloys. Oxid. Met. 2008, 69, 143–162. [Google Scholar] [CrossRef]
- Hilson, G.; Hallam, K.R.; Flewit, P.E.J. The measurement of stresses within oxides produced on austenitic and ferritic steels using Raman spectroscopy. Mater. Sci. Forum 2006, 524–525, 957–962. [Google Scholar] [CrossRef]
- Gao, T.; Fjellvåg, H.; Norby, P. A comparison study on Raman scattering properties of α- and β-MnO2. Anal. Chim. Acta 2009, 648, 235–239. [Google Scholar] [CrossRef]
- Pettersson, R.; Enecker, J.; Liu, L. Role of nickel in the oxidation of Fe-Cr-Ni alloys in air-water vapour atmospheres. Mater. High Temp. 2005, 22, 269–281. [Google Scholar] [CrossRef]
- Asteman, H.; Svensson, J.E.; Norell, M.; Johansson, L.G. Influence of water vapor and flow rate on the high-temperature oxidation of 304L; effect of chromium oxide hydroxide evaporation. Oxid. Met. 2000, 54, 11–26. [Google Scholar] [CrossRef]
- Othman, N.K.; Othman, N.; Zhang, J.; Young, D.J. Effects of water vapour on isothermal oxidation of chromia-forming alloys in Ar/O2 and Ar/H2 atmospheres. Corros. Sci. 2009, 51, 3039–3049. [Google Scholar] [CrossRef]
- Ma, X.; Nie, X.; Zhao, J.; Shrotriya, P.; Zhang, Y.; Cui, Y.; Wang, J. Effect of nanosecond pulsed laser parameters on the color making of 304 stainless steel. Opt. Laser Technol. 2020, 126, 106104. [Google Scholar] [CrossRef]


| Material | Fe (wt. %) | Si (wt. %) | Mn (wt. %) | Cr (wt. %) | C (wt. %) | N2 (wt. %) | Annealing Time (s) |
|---|---|---|---|---|---|---|---|
| A430-1 | Balance | 0.42 ± 0.008 | 0.34 ± 0.008 | 17.0 ± 0.061 | 0.023 ± 0.0014 | 0.019 ± 0.0013 | 42 |
| A430-2(A) | Balance | 0.43 ± 0.007 | 0.52 ± 0.009 | 16.4 ± 0.060 | 0.027 ± 0.0014 | 0.023 ± 0.0014 | 42 |
| A430-2(B) | Balance | 0.48 ± 0.008 | 0.54 ± 0.009 | 16.4 ± 0.060 | 0.016 ± 0.0010 | 0.030 ± 0.0016 | 55 |
| A430-3 | Balance | 0.39 ± 0.007 | 0.78 ± 0.011 | 16.7 ± 0.061 | 0.030 ± 0.0015 | 0.030 ± 0.0016 | 50 |
| Element | at. % A430-1 | at. % A430-3 |
|---|---|---|
| O 1s | 69.8 ± 0.639 | 71.6 ± 0.588 |
| N 1s | 2.6 ± 0.331 | 2.4 ± 0.192 |
| Cr 2p | 18.8 ± 0.291 | 16.0 ± 0.289 |
| Mn 2p | 2.8 ± 0.153 | 4.5 ± 0.154 |
| Fe 2p | 0.5 ± 0.123 | 0.4 ± 0.125 |
| Si 2p | 5.5 ± 0.719 | 5.1 ± 0.661 |
| Oxidation State | A430-1 (%) | A430-3 (%) |
|---|---|---|
| O 1s | ||
| O2− | 56.8 | 45.8 |
| OH− | 42.7 | 54.2 |
| H2O | 0.5 | - |
| Cr 2p | ||
| Cr metal | 3.6 | 4.1 |
| Cr3+—oxide | 48.2 | 49.9 |
| Cr3+–hydroxide | 41.7 | 38.1 |
| Cr6+—oxide | 6.5 | 7.9 |
| Mn 2p | ||
| Mn2+—oxide | 58.3 | 58.5 |
| Tetragonal site | 18.2 | 24.4 |
| Octahedral site | 40.1 | 34.1 |
| Mn3+—hydroxide | 41.7 | 41.5 |
| Si 2p | ||
| Si4+—oxide | 100 | 100 |
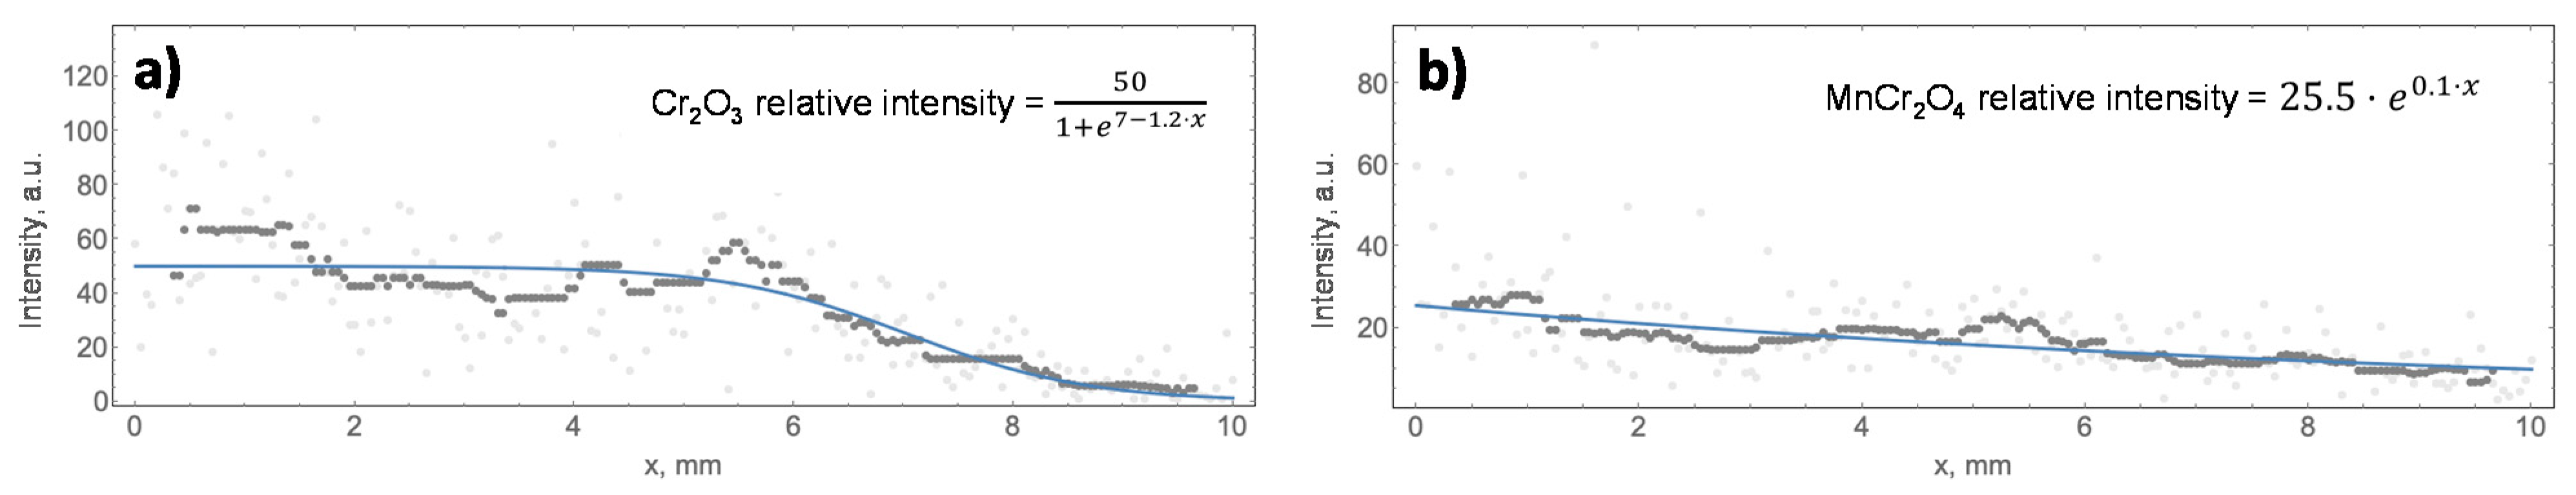
| Cr2O3 | |||||||
|---|---|---|---|---|---|---|---|
| Sample | Annealing Time (s) | a (a.u.) | b (a.u.) | x0 (mm) | n (a.u.) | m (a.u.) | Model |
| A430-1 | 42 | - | - | - | 139.0 | 0.38 | Equation (2) |
| A430-2(A) | 42 | 50.0 | 1.22 | 7.0 | - | - | Equation (1) |
| A430-2(B) | 55 | 89.0 | 0.55 | 6.0 | - | - | Equation (1) |
| A430-3 | 50 | - | - | - | 6.0 | 0.01 | Equation (2) |
| MnCr2O4 | |||||||
|---|---|---|---|---|---|---|---|
| Sample | Annealing Time (s) | a (a.u.) | b (a.u.) | x0 (mm) | n (a.u.) | m (a.u.) | Model |
| A430-1 | 42 | - | - | - | 43.1 | 0.16 | Equation (2) |
| A430-2(A) | 42 | - | - | - | 25.5 | 0.10 | Equation (2) |
| A430-2(B) | 55 | 47.3 | 0.46 | 7.0 | - | - | Equation (1) |
| A430-3 | 50 | - | - | - | 119.0 | 0.13 | Equation (2) |
Publisher’s Note: MDPI stays neutral with regard to jurisdictional claims in published maps and institutional affiliations. |
© 2021 by the authors. Licensee MDPI, Basel, Switzerland. This article is an open access article distributed under the terms and conditions of the Creative Commons Attribution (CC BY) license (http://creativecommons.org/licenses/by/4.0/).
Share and Cite
García, I.C.; Galindo, A.N.; Bello, J.F.A.; Leal, J.M.G.; Pedemonte, J.F.B. Characterisation of High Temperature Oxidation Phenomena during AISI 430 Stainless Steel Manufacturing under a Controlled H2 Atmosphere for Bright Annealing. Metals 2021, 11, 191. https://doi.org/10.3390/met11020191
García IC, Galindo AN, Bello JFA, Leal JMG, Pedemonte JFB. Characterisation of High Temperature Oxidation Phenomena during AISI 430 Stainless Steel Manufacturing under a Controlled H2 Atmosphere for Bright Annealing. Metals. 2021; 11(2):191. https://doi.org/10.3390/met11020191
Chicago/Turabian StyleGarcía, Irene Collado, Andrés Núñez Galindo, Juan F. Almagro Bello, Juan M. González Leal, and Javier F. Botana Pedemonte. 2021. "Characterisation of High Temperature Oxidation Phenomena during AISI 430 Stainless Steel Manufacturing under a Controlled H2 Atmosphere for Bright Annealing" Metals 11, no. 2: 191. https://doi.org/10.3390/met11020191