
The Risk Factors for Musculoskeletal Injuries in Thoroughbred Racehorses in Queensland, Australia: How These Vary for Two-Year-Old and Older Horses and with Type of Injury

 , ,
, ,  ,
,
Abstract
:Simple Summary
Abstract
1. Introduction
2. Materials and Methods
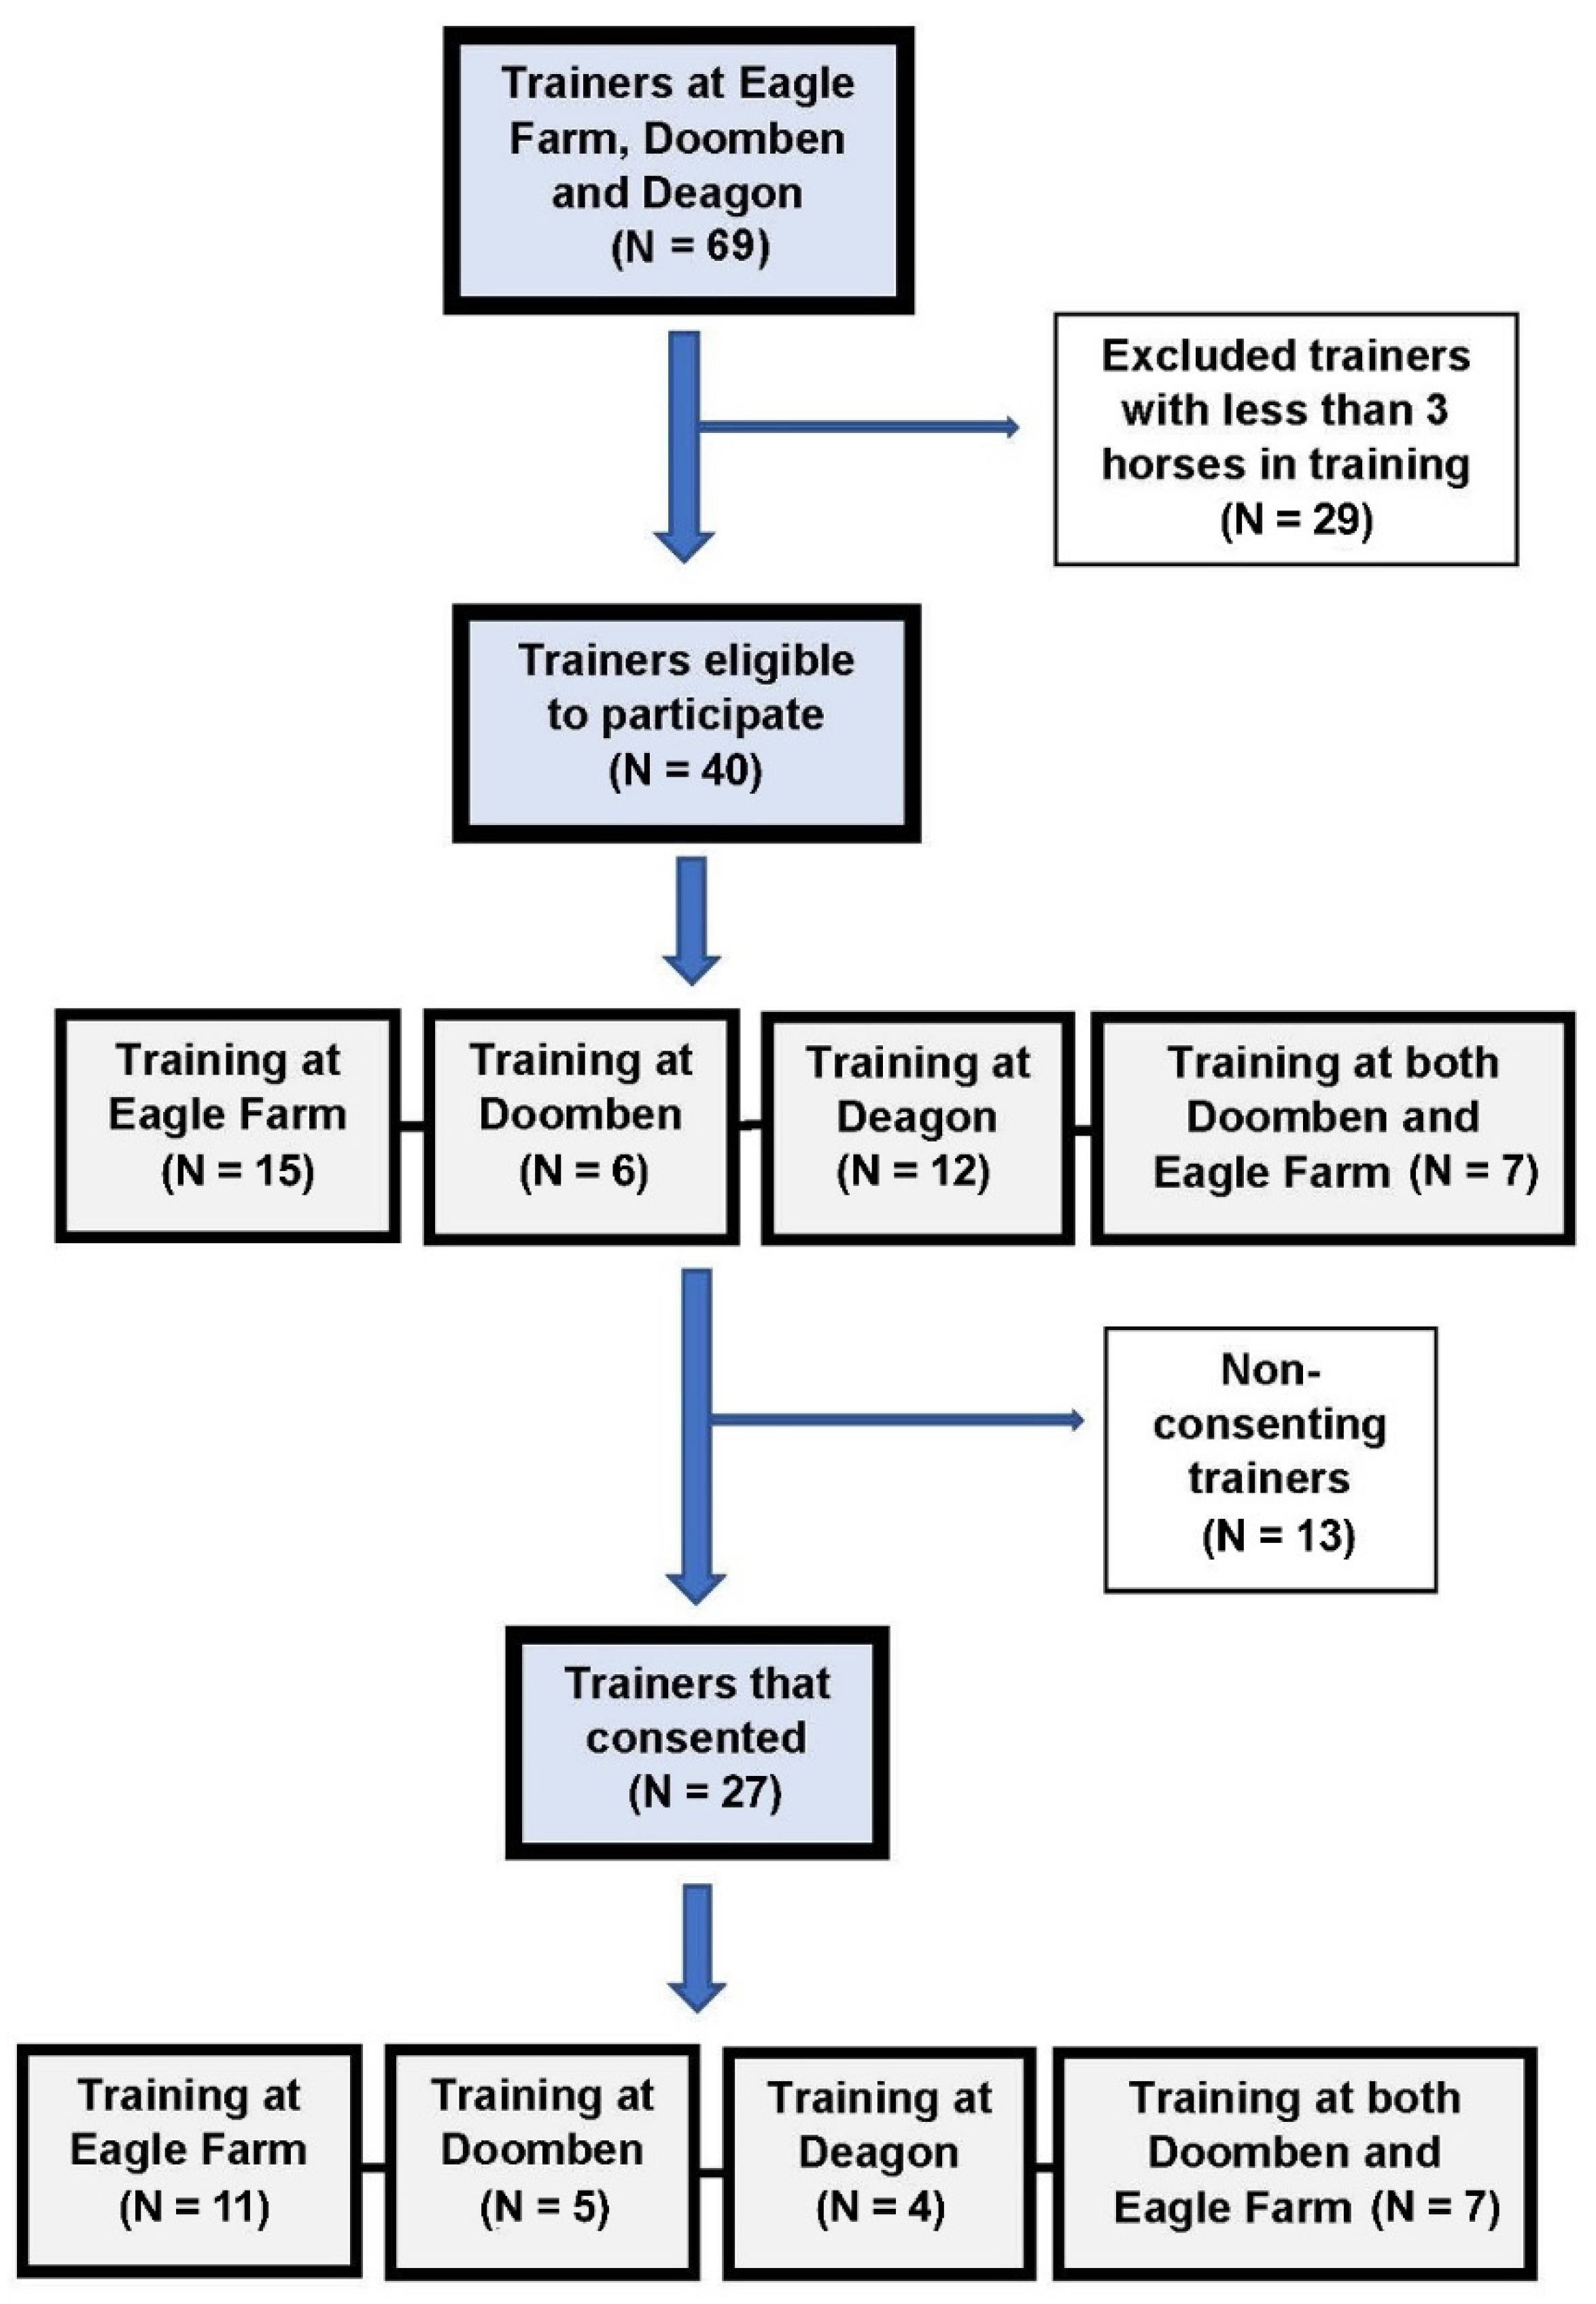
2.1. Recruitment of Participants
2.2. Study Design
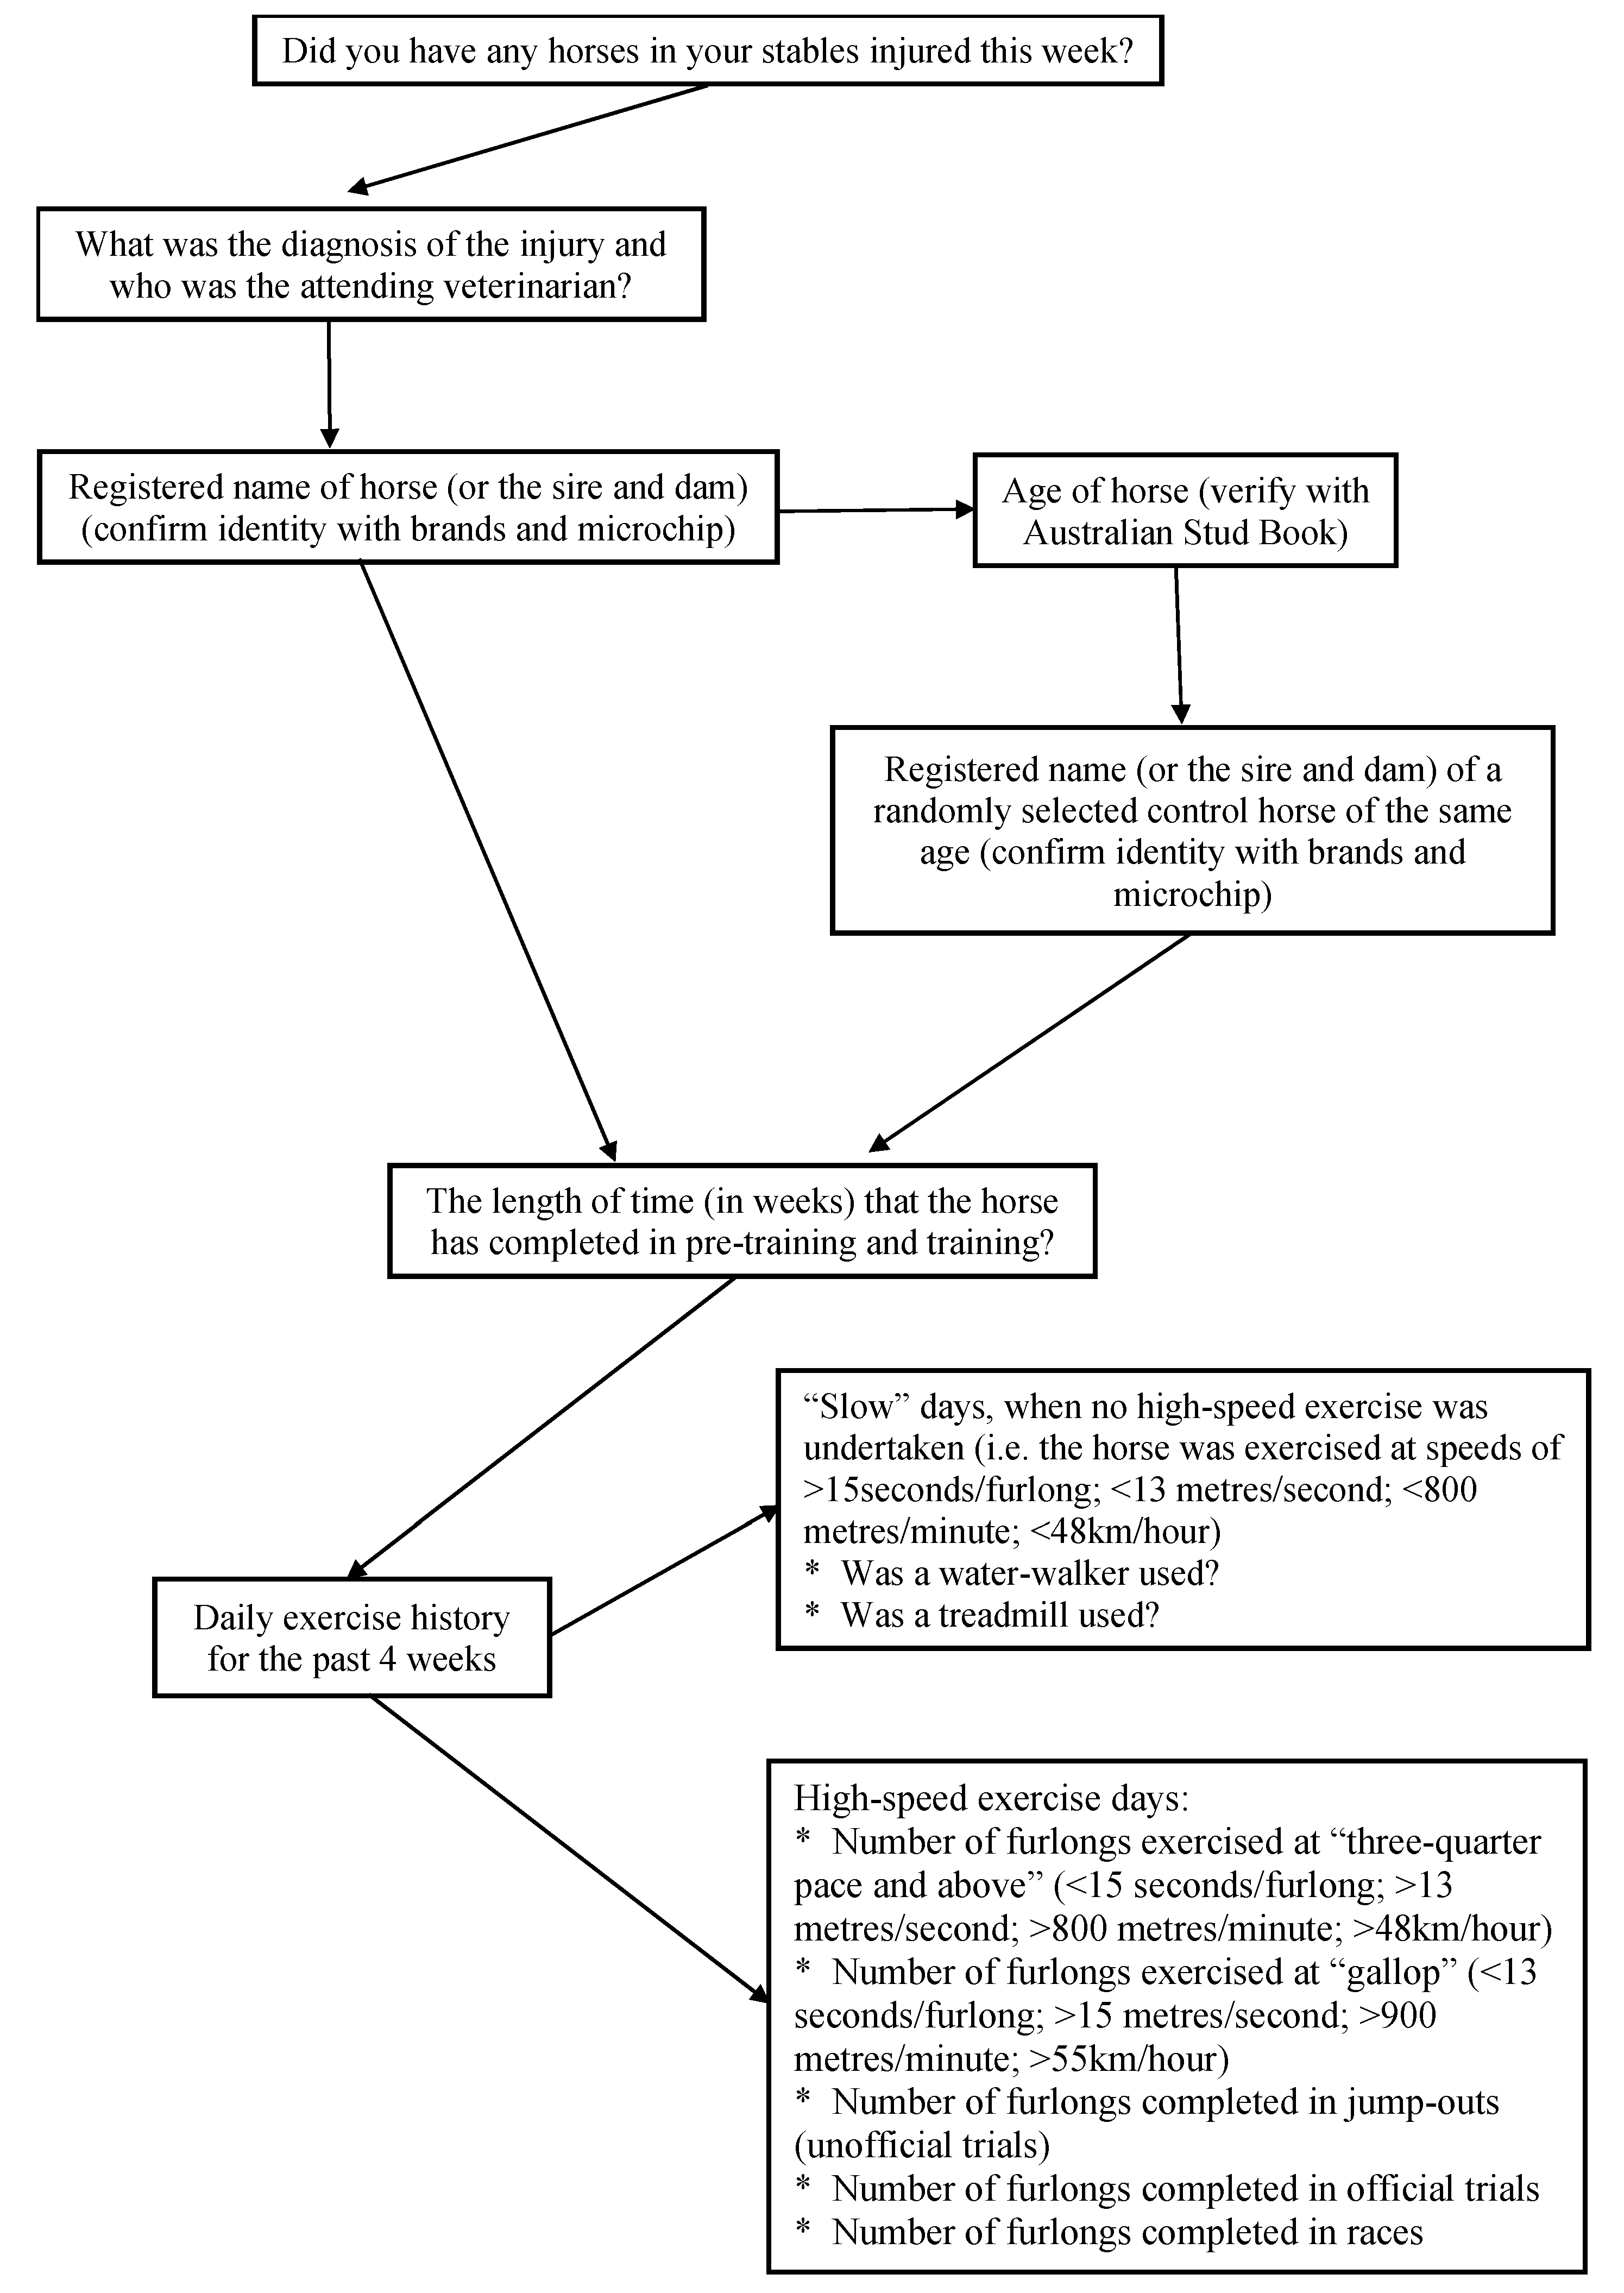
2.3. Data Collection
- (1)
- Cases of MSI and the diagnosis
- (2)
- One control matched to every case of MSI
- (3)
- Risk factors for MSI
2.3.1. Case Selection
2.3.2. Control Selection
2.3.3. Definitions of Speeds and Terminology
2.3.4. Risk Factors for Musculoskeletal Injury
- (1)
- Population characteristics
- (2)
- General racing and training history
- (3)
- High-speed exercise history
- (4)
- Racing career and performance indices
Population Characteristics
General Racing and Training History
High-Speed Exercise History
- (1)
- The total number of days (events) exercised at “three-quarter pace and above” (faster than 13 m/s; 15 s/furlong; 800 m/min; 48 km/h)
- (2)
- The total distance (furlongs) travelled at “three-quarter pace and above”
- (3)
- The average distance per event at “three-quarter pace and above”
- (4)
- The total number of days (events) exercised at “gallop” (faster than 15 m/s; 13 s/furlong; 900 m/min; 55 km/h) during trackwork
- (5)
- The total distance (furlongs) travelled at “gallop” during trackwork
- (6)
- The average distance per event at “gallop” during trackwork
- (7)
- The total distance (furlongs) travelled in jump-outs (non-official trials)
- (8)
- The total distance (furlongs) travelled in official trials
- (9)
- The total distance (furlongs) travelled in races
- (10)
- The combined distance travelled for jump-outs, official trials, and races
- (11)
- The total distance travelled at “gallop” during trackwork, jump-outs, official trials, and races (furlongs)
Racing Career and Performance Indices
2.4. Power Calculations
2.5. Data Analysis
Analysis by Type of Musculoskeletal Injury
- (1)
- Dorsal metacarpal disease
- (2)
- Carpal and fetlock injuries
- (3)
- Tendon and ligament injuries
- (4)
- Fractures
- (5)
- Other
3. Results
3.1. Characteristics of Cases and Controls
3.2. Univariable Analysis of Risk Factors for Musculoskeletal Injury
3.3. Multivariable Analysis of Risk Factors for Musculoskeletal Injury
3.4. Analysis by Type of Musculoskeletal Injury
4. Discussion
5. Conclusions
Author Contributions
Funding
Institutional Review Board Statement
Conflicts of Interest
Appendix A


| Horses of All Ages by Type of Injury | Univariable OR (95% CI) | p-Value † |
|---|---|---|
| Dam parity | ||
| Dorsal metacarpal disease (N = 47) | 0.41 | |
| 1 | ref | |
| 2–3 | 0.34 (0.09, 1.35) | 0.13 |
| 4 | 0.38 (0.08, 1.89) | 0.24 |
| 5–14 | 0.30 (0.07, 1.30) | 0.11 |
| Other types of injuries (N = 155) | 0.35 | |
| 1 | reference | |
| 2–3 | 0.64 (0.32, 1.23) | 0.21 |
| 4 | 0.75 (0.34, 1.66) | 0.48 |
| 5–14 | 0.53 (0.25, 1.10) | 0.40 |
| Distance 3/4 pace and above last 4 weeks (furlongs) | ||
| Dorsal metacarpal disease (N = 47) | 0.24 | |
| 0–14 | reference | |
| 15–24 | 3.73 (0.99, 14.08) | 0.05 |
| 25–31 | 1.82 (0.30, 10.86) | 0.51 |
| 32–62 | 2.09 (0.27, 16.41) | 0.48 |
| Carpal and fetlock injuries (N = 41) | 0.48 | |
| 0–14 | reference | |
| 15–24 | 1.69 (0.43, 6.60) | 0.45 |
| 25–31 | 0.65 (1.52, 2.81) | 0.57 |
| 32–62 | 0.48 (0.09, 2.63) | 0.40 |
| Tendon and ligament injuries (N = 40) | 0.44 | |
| 0–14 | reference | |
| 15–24 | 2.25 (0.39, 13.06) | 0.37 |
| 25–31 | 0.96 (0.18, 5.12) | 0.96 |
| 32–62 | 0.45 (0.09, 2.29) | 0.34 |
| Fractures and stress fractures (N = 33) | 0.07 | |
| 0–14 | reference | |
| 15–24 | 5.14 (0.59, 44.90) | 0.14 |
| 25–31 | 0.39 (0.03, 4.37) | 0.44 |
| 32–62 | 0.12 (0.01, 1.15) | 0.07 |
| Other (N = 41) | 0.17 | |
| 0–14 | reference | |
| 15–24 | 0.39 (0.07, 2.13) | 0.28 |
| 25–31 | 0.18 (0.02, 1.32) | 0.09 |
| 32–62 | 0.08 (0.01, 0.74) | 0.03 |
| Total distance galloped last 4 weeks (furlongs) | ||
| Dorsal metacarpal disease (N = 47) | 0.25 | |
| 0–5 | reference | |
| 6–11 | 1.22 (0.36, 4.16) | 0.74 |
| 12–19 | 4.62 (0.92, 23.24) | 0.06 |
| 20–33 | 3.60 (0.76, 17.11) | 0.11 |
| Carpal and fetlock injuries (N = 41) | 0.30 | |
| 0–5 | reference | |
| 6–11 | 1.61 (0.30, 8.65) | 0.58 |
| 12–19 | 3.52 (0.75, 16.58) | 0.11 |
| 20–33 | 1.02 (0.28, 3.70) | 0.30 |
| Tendon and ligament injuries (N = 40) | 0.57 | |
| 0–5 | reference | |
| 6–11 | 1.57 (0.24, 10.32) | 0.57 |
| 12–19 | 3.26 (0.47, 22.84) | 0.23 |
| 20–33 | 1.11 (0.26, 4.80) | 0.88 |
| Fractures and stress fractures (N = 33) | 0.38 | |
| 0–5 | reference | |
| 6–11 | 0.24 (0.02, 3.39) | 0.29 |
| 12–19 | 1.15 (0.22, 6.09) | 0.87 |
| 20–33 | 0.28 (0.04, 2.00) | 0.21 |
| Other (N =41) | 0.60 | |
| 0–5 | reference | |
| 6–11 | 2.00 (0.18, 22.06) | 0.57 |
| 12–19 | 0.79 (0.14, 4.54) | 0.79 |
| 20–33 | 0.39 (0.08, 1.82) | 0.23 |
References
- Jeffcott, L.B.; Rossdale, P.D.; Freestone, J.; Frank, C.J.; Towers-Clark, P.F. An assessment of wastage in thoroughbred racing from conception to 4 years of age. Equine Vet. J. 1982, 14, 185–198. [Google Scholar] [CrossRef] [PubMed]
- Rossdale, P.D.; Hopes, R.; Digby, N.J. Epidemiological study of wastage among racehorses 1982 and 1983. Vet. Rec. 1985, 116, 66–69. [Google Scholar] [CrossRef]
- Clegg, P.D. Musculoskeletal disease and injury, now and in the future. Part 1: Fractures and fatalities. Equine Vet. J. 2011, 43, 643–649. [Google Scholar] [CrossRef]
- Bailey, C.J.; Reid, S.W.; Hodgson, D.R.; Suann, C.J.; Rose, R.J. Risk factors associated with musculoskeletal injuries in Australian thoroughbred racehorses. Prev. Vet. Med. 1997, 32, 47–55. [Google Scholar] [CrossRef]
- Cohen, N.D.; Peloso, J.G.; Mundy, G.D.; Fisher, M.; Holland, R.E.; Little, T.V.; Misheff, M.M.; Watkins, J.P.; Honnas, C.M.; Moyer, W. Racing-related factors and results of prerace physical inspection and their association with musculoskeletal injuries incurred in thoroughbreds during races. J. Am. Vet. Med. Assoc. 1997, 211, 454–463. [Google Scholar]
- Parkin, T.D.; Rossdale, P.D. Epidemiology of equine performance wastage: Importance of analysing facts and implementing their message in management. Equine Vet. J. 2006, 38, 98–100. [Google Scholar] [CrossRef] [PubMed]
- Estberg, L.; Stover, S.M.; Gardner, I.A.; Johnson, B.J.; Case, J.T.; Ardans, A.; Read, D.H.; Anderson, M.L.; Barr, B.C.; Daft, B.M.; et al. Fatal musculoskeletal injuries incurred during racing and training in thoroughbreds. J. Am. Vet. Med. Assoc. 1996, 208, 92–96. [Google Scholar] [PubMed]
- Hitchens, P.L.; Hill, A.E.; Stover, S.M. The role of catastrophic injury or sudden death of the horse in race-day jockey falls and injuries in California, 2007–2012. Equine Vet. J. 2016, 48, 50–56. [Google Scholar] [CrossRef]
- Diab, S.S.; Poppenga, R.; Uzal, F.A. Sudden death in racehorses: Postmortem examination protocol. J. Vet. Diagn. Investig. 2017, 29, 442–449. [Google Scholar] [CrossRef]
- Johnson, B.J.; Stover, S.M.; Daft, B.M.; Kinde, H.; Read, D.H.; Barr, B.C.; Anderson, M.; Moore, J.; Woods, L.; Stoltz, J.; et al. Causes of death in racehorses over a 2 year period. Equine Vet. J. 1994, 26, 327–330. [Google Scholar] [CrossRef]
- Perkins, N.R.; Reid, S.W.; Morris, R.S. Profiling the New Zealand Thoroughbred racing industry. 2. Conditions interfering with training and racing. N. Z. Vet. J. 2004, 53, 69–76. [Google Scholar] [CrossRef]
- Boden, L.A.; Anderson, G.A.; Charles, J.A.; Morgan, K.L.; Morton, J.M.; Parkin, T.D.; Slocombe, R.F.; Clarke, A.F. Risk of fatality and causes of death of Thoroughbred horses associated with racing in Victoria, Australia: 1989–2004. Equine Vet. J. 2006, 38, 312–318. [Google Scholar] [CrossRef]
- Rosanowski, S.M.; Chang, Y.M.; Stirk, A.J.; Verheyen, K.L. Descriptive epidemiology of veterinary events in flat racing Thoroughbreds in Great Britain (2000 to 2013). Equine Vet. J. 2017, 49, 275–281. [Google Scholar] [CrossRef] [Green Version]
- DeLay, J. Postmortem findings in Ontario racehorses, 2003–2015. J. Vet. Diagn. Investig. 2017, 29, 457–464. [Google Scholar] [CrossRef]
- Physick-Sheard, P.W.; Avison, A.; Chappell, E.; MacIver, M. Ontario Racehorse Death Registry, 2003–2015: Descriptive analysis and rates of mortality. Equine Vet. J. 2017. [Google Scholar] [CrossRef]
- Parkin, T.D.; Clegg, P.D.; French, N.P.; Proudman, C.J.; Riggs, C.M.; Singer, E.R.; Webbon, P.M.; Morgan, K.L. Race- and course-level risk factors for fatal distal limb fracture in racing Thoroughbreds. Equine Vet. J. 2004, 36, 521–526. [Google Scholar] [CrossRef]
- Parkin, T.D.; Clegg, P.D.; French, N.P.; Proudman, C.J.; Riggs, C.M.; Singer, E.R.; Webbon, P.M.; Morgan, K.L. Horse-level risk factors for fatal distal limb fracture in racing Thoroughbreds in the UK. Equine Vet. J. 2004, 36, 513–519. [Google Scholar] [CrossRef]
- Wood, J.L.N.; Harkins, L.; Rogers, K. A retrospective study of factors associated with racehorse fatality on British racecourses from 1990–1999. In Proceedings of the 13th International Conference of Racing Analysts and Veterinarians, Cambridge, UK, 5 August 2000; pp. 274–277. [Google Scholar]
- Bailey, C.J.; Reid, S.W.; Hodgson, D.R.; Bourke, J.M.; Rose, R.J. Flat, hurdle and steeple racing: Risk factors for musculoskeletal injury. Equine Vet. J. 1998, 30, 498–503. [Google Scholar] [CrossRef]
- Peloso, J.G.; Mundy, G.D.; Cohen, N.D. Prevalence of, and factors associated with, musculoskeletal racing injuries of thoroughbreds. J. Am. Vet. Med. Assoc. 1994, 204, 620–626. [Google Scholar]
- Verheyen, K.L.; Wood, J.L. Descriptive epidemiology of fractures occurring in British Thoroughbred racehorses in training. Equine Vet. J. 2004, 36, 167–173. [Google Scholar] [CrossRef]
- Ely, E.R.; Avella, C.S.; Price, J.S.; Smith, R.K.; Wood, J.L.; Verheyen, K.L. Descriptive epidemiology of fracture, tendon and suspensory ligament injuries in National Hunt racehorses in training. Equine Vet. J. 2009, 41, 372–378. [Google Scholar] [CrossRef]
- Allen, S.E.; Rosanowski, S.M.; Stirk, A.J.; Verheyen, K.L. Description of veterinary events and risk factors for fatality in National Hunt flat racing Thoroughbreds in Great Britain (2000–2013). Equine Vet. J. 2017. [Google Scholar] [CrossRef] [Green Version]
- Riggs, C.M. Fractures—A preventable hazard of racing thoroughbreds? Vet. J. 2002, 163, 19–29. [Google Scholar] [CrossRef]
- Whitton, R.C.; Ayodele, B.A.; Hitchens, P.L.; Mackie, E.J. Subchondral bone microdamage accumulation in distal metacarpus of Thoroughbred racehorses. Equine Vet. J. 2018, 50, 766–773. [Google Scholar] [CrossRef]
- Stover, S.M.; Johnson, B.J.; Daft, B.M.; Read, D.H.; Anderson, M.; Barr, B.C.; Kinde, H.; Moore, J.; Stoltz, J.; Ardans, A.A.; et al. An association between complete and incomplete stress fractures of the humerus in racehorses. Equine Vet. J. 1992, 24, 260–263. [Google Scholar] [CrossRef]
- Boden, L.A.; Anderson, G.A.; Charles, J.A.; Morgan, K.L.; Morton, J.M.; Parkin, T.D.; Clarke, A.F.; Slocombe, R.F. Risk factors for Thoroughbred racehorse fatality in flat starts in Victoria, Australia (1989–2004). Equine Vet. J. 2007, 39, 430–437. [Google Scholar] [CrossRef]
- Anthenill, L.A.; Stover, S.M.; Gardner, I.A.; Hill, A.E. Risk factors for proximal sesamoid bone fractures associated with exercise history and horseshoe characteristics in Thoroughbred racehorses. Am. J. Vet. Res. 2007, 68, 760–771. [Google Scholar] [CrossRef]
- Boden, L.A.; Anderson, G.A.; Charles, J.A.; Morgan, K.L.; Morton, J.M.; Parkin, T.D.; Clarke, A.F.; Slocombe, R.F. Risk factors for Thoroughbred racehorse fatality in jump starts in Victoria, Australia (1989–2004). Equine Vet. J. 2007, 39, 422–428. [Google Scholar] [CrossRef]
- Estberg, L.; Gardner, I.A.; Stover, S.M.; Johnson, B.J.; Case, J.T.; Ardans, A. Cumulative racing-speed exercise distance cluster as a risk factor for fatal musculoskeletal injury in Thoroughbred racehorses in California. Prev. Vet. Med. 1995, 24, 253–263. [Google Scholar] [CrossRef]
- Estberg, L.; Stover, S.M.; Gardner, I.A.; Drake, C.M.; Johnson, B.; Ardans, A. High-speed exercise history and catastrophic racing fracture in thoroughbreds. Am. J. Vet. Res. 1996, 57, 1549–1555. [Google Scholar]
- Estberg, L.; Stover, S.M.; Gardner, I.A.; Johnson, B.J.; Jack, R.A.; Case, J.T.; Ardans, A.; Read, D.H.; Anderson, M.L.; Barr, B.C.; et al. Relationship between race start characteristics and risk of catastrophic injury in thoroughbreds: 78 cases (1992). J. Am. Vet. Med. Assoc. 1998, 212, 544–549. [Google Scholar]
- Estberg, L.; Gardner, I.A.; Stover, S.M.; Johnson, B.J. A case-crossover study of intensive racing and training schedules and risk of catastrophic musculoskeletal injury and lay-up in California thoroughbred racehorses. Prev. Vet. Med. 1998, 33, 159–170. [Google Scholar] [CrossRef]
- Morrice-West, A.V.; Hitchens, P.L.; Walmsley, E.A.; Stevenson, M.A.; Whitton, R.C. Training practices, speed and distances undertaken by Thoroughbred racehorses in Victoria, Australia. Equine Vet. J. 2019. [Google Scholar] [CrossRef]
- Verheyen, K.L.; Henley, W.E.; Price, J.S.; Wood, J.L. Training-related factors associated with dorsometacarpal disease in young Thoroughbred racehorses in the UK. Equine Vet. J. 2005, 37, 442–448. [Google Scholar] [CrossRef]
- Verheyen, K.; Price, J.; Lanyon, L.; Wood, J. Exercise distance and speed affect the risk of fracture in racehorses. Bone 2006, 39, 1322–1330. [Google Scholar] [CrossRef]
- Boston, R.C.; Nunamaker, D.M. Gait and speed as exercise components of risk factors associated with onset of fatigue injury of the third metacarpal bone in 2-year-old Thoroughbred racehorses. Am. J. Vet. Res. 2000, 61, 602–608. [Google Scholar] [CrossRef]
- Vallance, S.A.; Entwistle, R.C.; Hitchens, P.L.; Gardner, I.A.; Stover, S.M. Case-control study of high-speed exercise history of Thoroughbred and Quarter Horse racehorses that died related to a complete scapular fracture. Equine Vet. J. 2013, 45, 284–292. [Google Scholar] [CrossRef]
- Cohen, N.D.; Berry, S.M.; Peloso, J.G.; Mundy, G.D.; Howard, I.C. Association of high-speed exercise with racing injury in thoroughbreds. J. Am. Vet. Med. Assoc. 2000, 216, 1273–1278. [Google Scholar] [CrossRef]
- Perkins, N.R.; Reid, S.W.; Morris, R.S. Risk factors for musculoskeletal injuries of the lower limbs in Thoroughbred racehorses in New Zealand. N. Z. Vet. J. 2005, 53, 171–183. [Google Scholar] [CrossRef]
- Parkin, T.D.H.; Clegg, P.D.; French, N.P.; Proudman, C.J.; Riggs, C.M.; Singer, E.R.; Webbon, P.M.; Morgan, K.L. Risk factors for fatal lateral condylar fracture of the third metacarpus/metatarsus in UK racing. Equine Vet. J. 2005, 37, 192–199. [Google Scholar] [CrossRef]
- Mohammed, H.O.; Hill, T.; Lowe, J. Risk factors associated with injuries in thoroughbred horses. Equine Vet. J. 1991, 23, 445–448. [Google Scholar] [CrossRef] [PubMed]
- Vallance, S.A.; Case, J.T.; Entwistle, R.C.; Kinde, H.; Barr, B.C.; Moore, J.; Anderson, M.L.; Arthur, R.M.; Stover, S.M. Characteristics of Thoroughbred and Quarter Horse racehorses that sustained a complete scapular fracture. Equine Vet. J. 2012, 44, 425–431. [Google Scholar] [CrossRef] [PubMed]
- Perkins, N.R.; Reid, S.W.; Morris, R.S. Risk factors for injury to the superficial digital flexor tendon and suspensory apparatus in Thoroughbred racehorses in New Zealand. N. Z. Vet. J. 2005, 53, 184–192. [Google Scholar] [CrossRef] [PubMed]
- Bolwell, C.F.; Rogers, C.W.; French, N.P.; Firth, E.C. Risk factors for interruptions to training occurring before the first trial start of 2-year-old Thoroughbred racehorses. N. Z. Vet. J. 2012, 60, 241–246. [Google Scholar] [CrossRef]
- Verheyen, K.L.; Newton, J.R.; Price, J.S.; Wood, J.L. A case-control study of factors associated with pelvic and tibial stress fractures in Thoroughbred racehorses in training in the UK. Prev. Vet. Med. 2006, 74, 21–35. [Google Scholar] [CrossRef]
- Cruz, A.M.; Poljak, Z.; Filejski, C.; Lowerison, M.L.; Goldie, K.; Martin, S.W.; Hurtig, M.B. Epidemiologic characteristics of catastrophic musculoskeletal injuries in Thoroughbred racehorses. Am. J. Vet. Res. 2007, 68, 1370–1375. [Google Scholar] [CrossRef]
- Mason, T.A.; Bourke, J.M. Closure of the distal radial epiphysis and its relationship to unsoundness in two year old Thoroughbreds. Aust. Vet. J. 1973, 49, 221–228. [Google Scholar] [CrossRef]
- Sun, T.C.; Riggs, C.M.; Cogger, N.; Wright, J.; Al-Alawneh, J.I. Noncatastrophic and catastrophic fractures in racing Thoroughbreds at the Hong Kong Jockey Club. Equine Vet. J. 2018, 51, 77–82. [Google Scholar] [CrossRef]
- Crawford, K.L.; Finnane, A.; Greer, R.M.; Phillips, C.J.C.; Woldeyohannes, S.M.; Perkins, N.R.; Ahern, B.J. Appraising the Welfare of Thoroughbred Racehorses in Training in Queensland, Australia: The Incidence and Type of Musculoskeletal Injuries Vary between Two-Year-Old and Older Thoroughbred Racehorses. Animals 2020, 10, 2046. [Google Scholar] [CrossRef]
- Cogger, N.; Evans, D.L.; Hodgson, D.R.; Reid, S.W.; Perkins, N. Incidence rate of musculoskeletal injuries and determinants of time to recovery in young Australian Thoroughbred racehorses. Aust. Vet. J. 2008, 86, 473–480. [Google Scholar] [CrossRef]
- Anon. Racing Australia Database. Available online: http://www.racingaustralia.horse/home.aspx (accessed on 1 September 2020).
- Parkin, T.D.H. Epidemiology of training and racing injuries. Equine Vet. J. 2007, 39, 466–469. [Google Scholar] [CrossRef] [PubMed]
- Agresti, A. An Introduction to Categorical Data Analysis, 2nd ed.; Wiley-Interscience: Hoboken, NJ, USA, 2007. [Google Scholar]
- Kuo, C.-L.; Duan, Y.; Grady, J. Unconditional or Conditional Logistic Regression Model for Age-Matched Case-Control Data? Front. Public Health 2018, 6, 57. [Google Scholar] [CrossRef] [Green Version]
- Pearce, N. Analysis of matched case-control studies. BMJ (Clin. Res. Ed.) 2016, 352, i969. [Google Scholar] [CrossRef] [PubMed] [Green Version]
- Kirkwood, B.R.; Sterne, J.A.C. Essential Medical Statistics, 2nd ed.; Blackwell Science: Hoboken, NJ, USA; Blackwell Pub.: Malden, MA, USA, 2003. [Google Scholar]
- Juul, S.; Frydenberg, M. An Introduction to Stata for Health Researchers, 4th ed.; Stata Corp LP: College Station, TX, USA, 2014. [Google Scholar]
- Firth, E.C.; Rogers, C.W. Musculoskeletal responses of 2-year-old Thoroughbred horses to early training. 7. Bone and articular cartilage response in the carpus. N. Z. Vet. J. 2005, 53, 113–122. [Google Scholar] [CrossRef]
- Firth, E.C.; Rogers, C.W.; Anderson, B.H. Musculoskeletal responses of 2-year-old Thoroughbred horses to early training. 4. Morphometric, microscopic and biomechanical properties of the digital tendons of the forelimb. N. Z. Vet. J. 2004, 52, 285–292. [Google Scholar] [CrossRef] [PubMed]
- Firth, E.C.; Rogers, C.W.; Doube, M.; Jopson, N.B. Musculoskeletal responses of 2-year-old Thoroughbred horses to early training. 6. Bone parameters in the third metacarpal and third metatarsal bones. N. Z. Vet. J. 2005, 53, 101–112. [Google Scholar] [CrossRef]
- Wilsher, S.; Allen, W.R. The effects of maternal age and parity on placental and fetal development in the mare. Equine Vet. J. 2003, 35, 476–483. [Google Scholar] [CrossRef]
- Faulkner, R.A.; Bailey, D.A.; Drinkwater, D.T.; McKay, H.A.; Arnold, C.; Wilkinson, A.A. Bone densitometry in Canadian children 8-17 years of Age. Calcif. Tissue Int. 1996, 59, 344–351. [Google Scholar] [CrossRef]
- Beck, T.J.; Ruff, C.B.; Shaffer, R.A.; Betsinger, K.; Trone, D.W.; Brodine, S.K. Stress fracture in military recruits: Gender differences in muscle and bone susceptibility factors. Bone 2000, 27, 437–444. [Google Scholar] [CrossRef]
- Cresswell, E.N.; McDonough, S.P.; Palmer, S.E.; Hernandez, C.J.; Reesink, H.L. Can quantitative computed tomography detect bone morphological changes associated with catastrophic proximal sesamoid bone fracture in Thoroughbred racehorses? Equine Vet. J. 2019, 51, 123–130. [Google Scholar] [CrossRef]
- Loughridge, A.B.; Hess, A.M.; Parkin, T.D.; Kawcak, C.E. Qualitative assessment of bone density at the distal articulating surface of the third metacarpal in Thoroughbred racehorses with and without condylar fracture. Equine Vet. J. 2017, 49, 172–177. [Google Scholar] [CrossRef] [PubMed]
- Verheyen, K.L.; Price, J.S.; Wood, J.L. Fracture rate in Thoroughbred racehorses is affected by dam age and parity. Vet. J. 2007, 174, 295–301. [Google Scholar] [CrossRef] [PubMed]
- Firth, E.C.; Rogers, C.W.; Perkins, N.R.; Anderson, B.H.; Grace, N.D. Musculoskeletal responses of 2-year-old Thoroughbred horses to early training. 1. Study design, and clinical, nutritional, radiological and histological observations. N. Z. Vet. J. 2004, 52, 261–271. [Google Scholar] [CrossRef] [PubMed]
- Bennell, K.L.; Malcolm, S.A.; Wark, J.D.; Brukner, P.D. Models for the pathogenesis of stress fractures in athletes. Br. J. Sports Med. 1996, 30, 200–204. [Google Scholar] [CrossRef] [PubMed] [Green Version]
- Carrier, T.K.; Estberg, L.; Stover, S.M.; Gardner, I.A.; Johnson, B.J.; Read, D.H.; Ardans, A.A. Association between long periods without high-speed workouts and risk of complete humeral or pelvic fracture in thoroughbred racehorses: 54 cases (1991–1994). J. Am. Vet. Med. Assoc. 1998, 212, 1582–1587. [Google Scholar] [PubMed]
- Firth, E.C. The response of bone, articular cartilage and tendon to exercise in the horse. J. Anat. 2006, 208, 513–526. [Google Scholar] [CrossRef]
- Boyde, A. The real response of bone to exercise. J. Anat. 2003, 203, 173–189. [Google Scholar] [CrossRef]
- Boyde, A.; Firth, E.C. Musculoskeletal responses of 2-year-old Thoroughbred horses to early training. 8. Quantitative back-scattered electron scanning electron microscopy and confocal fluorescence microscopy of the epiphysis of the third metacarpal bone. N. Z. Vet. J. 2005, 53, 123–132. [Google Scholar] [CrossRef]
- Da Costa Gomez, T.M.; Barrett, J.G.; Sample, S.J.; Radtke, C.L.; Kalscheur, V.L.; Lu, Y.; Markel, M.D.; Santschi, E.M.; Scollay, M.C.; Muir, P. Up-regulation of site-specific remodeling without accumulation of microcracking and loss of osteocytes. Bone 2005, 37, 16–24. [Google Scholar] [CrossRef]
- Whitton, R.C.; Trope, G.D.; Ghasem-Zadeh, A.; Anderson, G.A.; Parkin, T.D.; Mackie, E.J.; Seeman, E. Third metacarpal condylar fatigue fractures in equine athletes occur within previously modelled subchondral bone. Bone 2010, 47, 826–831. [Google Scholar] [CrossRef]
- Young, D.R.; Nunamaker, D.M.; Markel, M.D. Quantitative evaluation of the remodeling response of the proximal sesamoid bones to training-related stimuli in Thoroughbreds. Am. J. Vet. Res. 1991, 52, 1350–1356. [Google Scholar] [PubMed]
- Smith, R.K.; Birch, H.; Patterson-Kane, J.; Firth, E.C.; Williams, L.; Cherdchutham, W.; van Weeren, W.R.; Goodship, A.E. Should equine athletes commence training during skeletal development? Changes in tendon matrix associated with development, ageing, function and exercise. Equine Vet. J. Suppl. 1999, 201–209. [Google Scholar] [CrossRef] [PubMed]
- Patterson-Kane, J.C.; Parry, D.A.D.; Birch, H.L.; Goodship, A.E.; Firth, E.C. An age-related study of morphology and cross-link composition of collagen fibrils in the digital flexor tendons of young thoroughbred horses. Connect. Tissue Res. 1997, 36, 253–260. [Google Scholar] [CrossRef]
- Patterson-Kane, J.C.; Wilson, A.M.; Firth, E.C.; Parry, D.A.; Goodship, A.E. Comparison of collagen fibril populations in the superficial digital flexor tendons of exercised and nonexercised thoroughbreds. Equine Vet. J. 1997, 29, 121–125. [Google Scholar] [CrossRef] [PubMed]
- Patterson-Kane, J.C.; Wilson, A.M.; Firth, E.C.; Parry, D.A.; Goodship, A.E. Exercise-related alterations in crimp morphology in the central regions of superficial digital flexor tendons from young thoroughbreds: A controlled study. Equine Vet. J. 1998, 30, 61–64. [Google Scholar] [CrossRef]
- Kasashima, Y.; Smith, R.K.; Birch, H.L.; Takahashi, T.; Kusano, K.; Goodship, A.E. Exercise-induced tendon hypertrophy: Cross-sectional area changes during growth are influenced by exercise. Equine Vet. J. Suppl. 2002, 34, 264–268. [Google Scholar] [CrossRef]
- Perkins, N.R.; Rogers, C.W.; Firth, E.C.; Anderson, B.H. Musculoskeletal responses of 2-year-old Thoroughbred horses to early training. 3. In vivo ultrasonographic assessment of the cross-sectional area and echogenicity of the superficial digital flexor tendon. N. Z. Vet. J. 2004, 52, 280–284. [Google Scholar] [CrossRef]
- Patterson-Kane, J.C.; Firth, E.C.; Parry, D.A.; Wilson, A.M.; Goodship, A.E. Effects of training on collagen fibril populations in the suspensory ligament and deep digital flexor tendon of young thoroughbreds. Am. J. Vet. Res. 1998, 59, 64–68. [Google Scholar]
- Velie, B.D.; Knight, P.K.; Thomson, P.C.; Wade, C.M.; Hamilton, N.A. The association of age at first start with career length in the Australian Thoroughbred racehorse population. Equine Vet. J. 2013, 45, 410–413. [Google Scholar] [CrossRef]
- Reed, S.R.; Jackson, B.F.; Mc Ilwraith, C.W.; Wright, I.M.; Pilsworth, R.; Knapp, S.; Wood, J.L.; Price, J.S.; Verheyen, K.L. Descriptive epidemiology of joint injuries in Thoroughbred racehorses in training. Equine Vet. J. 2012, 44, 13–19. [Google Scholar] [CrossRef]
- Perkins, N.R.; Reid, S.W.; Morris, R.S. Profiling the New Zealand Thoroughbred racing industry. 1. Training, racing and general health patterns. N. Z. Vet. J. 2004, 53, 59–68. [Google Scholar] [CrossRef] [PubMed]
- Thrusfield, M.V.; Christley, R. Veterinary Epidemiology, 4th ed.; Wiley: Hoboken, NJ, USA, 2018. [Google Scholar]

| Variable | Horses of All Ages | Two-Year-Old Horses | Horses Three Years and Older | ||||
|---|---|---|---|---|---|---|---|
| Cases (n = 202) | Controls (n = 202) | Cases (n = 103) | Controls (n = 103) | Cases (n = 99) | Controls (n = 99) | ||
| Population characteristics | |||||||
| Median (IQR) | Median (IQR) | Median (IQR) | Median (IQR) | Median (IQR) | Median (IQR) | p-value # | |
| Dam Age (years) | 9 (7–12) | 10 (8–12) | 9 (7–11) | 10 (8–12) | 9 (7–13) | 10 (7–12) | 0.24 |
| Dam Parity | 3 (2–5) | 4 (2–6) | 3 (2–4) | 4 (2–6) | 4 (2–6) | 3 (2–6) | 0.52 |
| N (%) | N (%) | N (%) | N (%) | N (%) | N (%) | p-value # | |
| Sex | <0.001 | ||||||
| Entire males | 34 (17.0) | 34 (17) | 31 (30) | 33 (32) | 3 (3) | 1 (1) | |
| Geldings | 82 (40) | 88 (43) | 24 (23) | 23 (22) | 58 (59) | 65 (66) | |
| Females | 86 (43) | 80 (40) | 48 (47) | 47 (46) | 38 (38) | 33 (33) | |
| General racing and training history | |||||||
| N (%) | N (%) | N (%) | N (%) | N (%) | N (%) | p-value # | |
| Started in a race | <0.001 | ||||||
| Yes | 97 (48) | 105 (52) | 13 (13) | 14 (14) | 84 (85) | 91 (92) | |
| No | 105 (52) | 97 (48) | 90 (87) | 89 (86) | 15 (15) | 8 (8) | |
| Median (IQR) | Median (IQR) | Median (IQR) | Median (IQR) | Median (IQR) | Median (IQR) | p–value # | |
| Length of training prep (wks) | 9 (6–14) | 8 (5–15) | 7 (5–10) | 6 (5–8) | 13 (8–24) | 14 (8–20) | <0.001 |
| Length of pre-training (wks) | 0 (0–2) | 0 (0–2) | 2 (0–3) | 0 (0–3) | 0 (0–0) | 0 (0–0) | <0.001 |
| Total prep length (wks) | 10 (8–15) | 10 (7–15) | 9 (7–11) | 8 (6–10) | 14 (8–24) | 14 (9–20) | <0.001 |
| Days slow last 4 wks | 15 (13–17) | 16 (15–18) | 15 (13–17) | 17 (15–19) | 15 (13–17) | 16 (15–17) | 0.06 |
| Days water-walker last 4 wks | 0 (0–0) | 0 (0–0) | 0 (0–0) | 0 (0–0) | 0 (0–0) | 0 (0–0) | 0.01 |
| Days treadmill last 4 wks | 0 (0–0) | 0 (0–0) | 0 (0–0) | 0 (0–0) | 0 (0–0) | 0 (0–0) | 0.24 |
| High-speed exercise history | |||||||
| Median (IQR) | Median (IQR) | Median (IQR) | Median (IQR) | Median (IQR) | Median (IQR) | p-value # | |
| Days 3/4 pace and above last 4 wks | 6 (4–7) | 7 (5–8) | 6 (4–7) | 6 (3–7) | 6 (5–8) | 7 (6–8) | <0.001 |
| Dist 3/4 pace and above last 4 wks (f) | 24 (15–31) | 27 (16–34) | 18 (10–24) | 20 (9–26) | 30 (22–37) | 33 (29–40) | <0.001 |
| Dist 3/4 pace and above per event (f) | 4 (3–5) | 4 (3–5) | 3 (3–4) | 3 (3–4) | 5 (4–5) | 5 (4–5) | <0.001 |
| Days track gallop last 4 wks | 5 (2–6) | 5 (1–6) | 3 (1–5) | 3 (0–5) | 6 (4–7) | 6 (5–7) | <0.001 |
| Dist track gallop last 4 wks (f) | 12 (4–16) | 12 (2–18) | 6 (2–12) | 5 (0–12) | 16 (11–19) | 18 (12–21) | <0.001 |
| Dist track gallop per event (f) | 2 (2–3) | 2 (1–3) | 2 (1–2) | 2 (0–2) | 3 (2–3) | 3 (2–3) | <0.001 |
| Dist jump-outs last 4 wks (f) | 0 (0–2) | 0 (0–0) | 0 (0–2) | 0 (0–2) | 0 (0–0) | 0 (0–0) | <0.001 |
| Dist trials last 4 wks (f) | 0 (0–0) | 0 (0–0) | 0 (0–0) | 0 (0–0) | 0 (0–0) | 0 (0–0) | 0.07 |
| Dist races last 4 wks (f) | 0 (0–5) | 0 (0–6) | 0 (0–0) | 0 (0–0) | 4 (0–7) | 5 (0–11) | <0.001 |
| Dist jump-outs, trials and races (f) | 4 (0–8) | 4 (0–10) | 2 (0–5) | 0 (0–4) | 6 (0–10) | 7 (0–12) | <0.001 |
| Total dist galloped (track, jump-outs, trials, races) | 16 (4–22) | 16 (2–28) | 8 (3–17) | 6 (0–17) | 21 (16–30) | 24 (12–33) | <0.001 |
| Racing career and performance indices | |||||||
| N (%) | N (%) | N (%) | N (%) | N (%) | N (%) | p-value # | |
| Started as two-year-old | |||||||
| Yes | 48 (49) | 56 (53) | † | † | 35 (42) | 43 (47) | † |
| No | 49 (51) | 49 (47) | † | † | 49 (58) | 48 (53) | † |
| Median (IQR) | Median (IQR) | Median (IQR) | Median (IQR) | Median (IQR) | Median (IQR) | p-value # | |
| No. starts as two-year-old | 2 (1–4) | 3 (2–5) | † | † | 2 (1–4) | 2 (2–5) | † |
| Age at first race (years) | 3 (2–3) | 2 (2–3) | † | † | 3 (2–3) | 3 (2–3) | † |
| Length of career to date (months) | 17 (8–29) | 17 (8–27) | 3 (1–3) | 5 (3–8) | 19 (12–30) | 20 (10–29) | <0.001 |
| No. of starts | 10 (3–19) | 9 (4–20) | 2 (2–3) | 3 (2–5) | 11 (5–22) | 11 (6–21) | <0.001 |
| Starts per 12 months over career | 8 (5–11) | 8 (6–10) | 12 (8–12) | 8 (6–10) | 8 (5–10) | 8 (6–10) | 0.11 |
| No. of races won | 1 (0–3) | 2 (0–3) | 1 (0–1) | 0 (0–1) | 2 (0–4) | 2 (1–4) | <0.001 |
| % of races won | 17 (0–25) | 15 (0–24) | 50 (0–50) | 0 (0–25) | 16 (0–21) | 15 (7–24) | 0.30 |
| No. of races 1st, 2nd or 3rd place | 3 (2–9) | 4 (2–9) | 2 (1–2) | 1 (0–2) | 4 (2–9) | 6 (2–10) | <0.001 |
| % of races 1st, 2nd or 3rd place | 44 (33–55) | 46 (31–58) | 67 (50–100) | 50 (0–71) | 43 (30–53) | 45 (33–56) | 0.11 |
| Total dist raced (5 f/1 km) | 11 (3–26) | 11 (5–26) | 2 (2–3) | 3 (2–5) | 14 (6–28) | 14 (7–29) | <0.001 |
| Average dist per start (f) | 6 (6–7) | 6 (6–7) | 5 (5–6) | 5 (5–6) | 6 (6–7) | 6 (6–7) | <0.001 |
| Total prizemoney ($1000 AUD) | 33 (10–83) | 41 (12–89) | 26 (10–51) | 13 (2–67) | 34 (10–99) | 46 (16–90) | 0.03 |
| Prizemoney per start ($1000 AUD) | 4 (1–6) | 4 (2–8) | 13 (3–25) | 5 (0–18) | 3 (1–5) | 4 (2–7) | 0.06 |
| Variable | Horses of All Ages | p-Value † | Two-Year-Old Horses | p-Value † | Horses Three Years and Older | p-Value † |
|---|---|---|---|---|---|---|
| Univariable OR (95% CI) | Univariable OR (95% CI) | Univariable OR (95% CI) | ||||
| Population characteristics | ||||||
| Dam Age (years) | 0.65 | 0.28 | 0.52 | |||
| 4–6 | reference | reference | reference | |||
| 7–8 | 1.09 (0.55, 2.16) | 0.81 | 1.82 (0.59, 5.55) | 0.30 | 0.88 (0.35, 2.21) | 0.79 |
| 9–11 | 0.79 (0.44, 1.42) | 0.42 | 0.80 (0.36, 1.79) | 0.59 | 0.74 (0.30, 1.79) | 0.50 |
| 12–27 | 0.98 (0.52, 1.84) | 0.94 | 0.72 (0.29, 1.79) | 0.48 | 1.27 (0.52, 3.12) | 0.60 |
| Dam Parity | 0.13 | 0.02 | 0.89 | |||
| 1 | reference | reference | reference | |||
| 2–3 | 0.56 (0.30, 1.03) | 0.06 | 0.30 (0.12, 0.77) | 0.01 | 1.11 (0.45, 2.73) | 0.82 |
| 4 | 0.65 (0.32, 1.32) | 0.23 | 0.28 (0.09, 0.84) | 0.02 | 1.44 (0.53, 3.94) | 0.48 |
| 5-14 | 0.47 (0.25, 0.90) | 0.02 | 0.19 (0.07, 0.52) | 0.001 | 1.18 (0.46, 2.99) | 0.73 |
| Sex | 0.76 | 0.95 | 0.45 | |||
| Entire males | reference | reference | reference | |||
| Geldings | 0.91 (0.48, 1.71) | 0.76 | 1.11 (0.52, 2.34) | 0.79 | 0.33 (0.03, 3.20) | 0.34 |
| Females | 1.09 (0.58, 2.02) | 0.79 | 1.09 (0.56, 2.15) | 0.79 | 0.44 (0.04, 4.61) | 0.49 |
| General racing and training history | ||||||
| Started in a race | 0.17 | 0.82 | 0.08 | |||
| Yes | reference | reference | reference | |||
| No | 1.62 (0.81, 3.23) | 0.17 | 1.11 (0.45, 2.73) | 0.82 | 2.75 (0.88, 8.64) | 0.08 |
| Total preparation length (weeks) | 0.15 | 0.07 | 0.47 | |||
| 2–7 | reference | reference | reference | |||
| 8–9 | 2.04 (1.00, 4.14) | 0.05 | 1.96 (0.77, 5.02) | 0.16 | 2.23 (0.72, 6.88) | 0.16 |
| 10–14 | 1.91 (1.02, 3.60) | 0.05 | 3.34 (1.35, 8.24) | 0.01 | 1.03 (0.40, 2.68) | 0.95 |
| 15–48 | 1.59 (0.75, 3.34) | 0.22 | 1.50 (0.44, 5.13) | 0.52 | 1.25 (0.45, 3.48) | 0.66 |
| Days slow last 4 weeks | <0.001 | <0.001 | 0.01 | |||
| 0–12 | reference | reference | reference | |||
| 13–15 | 0.45 (0.21, 0.99) | 0.05 | 0.92 (0.31, 2.69) | 0.88 | 0.22 (0.06, 0.76) | 0.02 |
| 16–17 | 0.13 (0.06, 0.32) | <0.001 | 0.19 (0.06, 0.62) | 0.01 | 0.09 (0.02, 0.35) | 0.001 |
| 18–24 | 0.13 (0.05, 0.33) | <0.001 | 0.15 (0.04, 0.56) | <0.001 | 0.11 (0.03, 0.45) | 0.002 |
| Days water-walker last 4 weeks | 0.41 | 0.37 | 1.00 | |||
| 0–1 | reference | reference | reference | |||
| 2–24 | 0.63 (0.20, 1.91) | 0.41 | 0.57 (0.17, 1.95) | 0.37 | 1.00 (0.06, 15.99) | 1.00 |
| Days treadmill last 4 weeks | 0.42 | 0.66 | ||||
| 0–1 | reference | reference | ||||
| 2–12 | 0.50 (0.09, 2.73) | 0.42 | 0.67 (0.11, 3.99) | 0.66 | ||
| High-speed exercise history | ||||||
| Days 3/4 pace and above last 4 weeks | 0.02 | 0.10 | 0.09 | |||
| 0–3 | reference | reference | reference | |||
| 4–5 | 1.99 (0.95, 4.16) | 0.07 | 1.93 (0.79, 4.69) | 0.15 | 2.82 (0.65, 12.33) | 0.17 |
| 6–7 | 1.46 (0.75, 2.84) | 0.27 | 2.22 (0.92, 5.37) | 0.08 | 0.82 (0.28, 2.41) | 0.71 |
| 8–12 | 0.65 (0.32, 1.31) | 0.23 | 0.69 (0.23, 2.05) | 0.50 | 0.52 (0.18, 1.48) | 0.22 |
| Distance 3/4 pace and above last 4 weeks (furlongs) | <0.001 | 0.09 | 0.01 | |||
| 0–14 | reference | reference | reference | |||
| 15–24 | 1.84 (0.97, 3.48) | 0.06 | 1.53 (0.77, 3.03) | 0.22 | 5.52 (0.89, 34.21) | 0.07 |
| 25–31 | 0.66 (0.31, 1.39) | 0.27 | 0.40 (0.13, 1.20) | 0.10 | 1.41 (0.43, 4.68) | 0.57 |
| 32–62 | 0.33 (0.15, 0.72) | 0.01 | 0.61 (0.15, 2.41) | 0.48 | 0.41 (0.15, 1.17) | 0.10 |
| Distance 3/4 pace and above per event (furlongs) | 0.35 | 0.62 | 0.79 | |||
| 0–2 | reference | reference | reference | |||
| 3 | 1.35 (0.72, 2.54) | 0.35 | 1.24 (0.61, 2.53) | 0.55 | 1.55 (0.34, 6.99) | 0.57 |
| 4–5 | 1.15 (0.56, 2.37) | 0.71 | 2.03 (0.71, 5.84) | 0.71 | 0.94 (0.25, 3.49) | 0.92 |
| 6–11 | 0.66 (0.27, 1.59) | 0.35 | 0.86 (0.22, 3.28) | 0.82 | ||
| Days track gallop last 4 weeks | 0.31 | 0.32 | 0.41 | |||
| 0–1 | reference | reference | reference | |||
| 2–4 | 1.62 (0.90, 2.89) | 0.11 | 1.81 (0.91, 3.62) | 0.09 | 1.31 (0.42, 4.07) | 0.64 |
| 5–6 | 1.17 (0.55, 2.47) | 0.68 | 1.08 (0.38, 3.03) | 0.89 | 1.17 (0.36, 3.77) | 0.79 |
| 7–9 | 0.97 (0.51, 1.85) | 0.94 | 1.77 (0.65, 4.82) | 0.27 | 0.65 (0.25, 1.65) | 0.36 |
| Distance track gallop last 4 weeks (furlongs) | 0.04 | 0.53 | 0.05 | |||
| 0–5 | reference | reference | reference | |||
| 6–11 | 1.40 (0.73, 2.68) | 0.31 | 1.71 (0.80, 3.67) | 0.17 | 0.77 (0.21, 2.84) | 0.69 |
| 12–19 | 1.49 (0.79, 2.79) | 0.22 | 1.42 (0.59, 3.41) | 0.43 | 1.29 (0.49, 3.41) | 0.60 |
| 20–33 | 0.57 (0.26, 1.25) | 0.16 | 0.91 (0.14, 6.07) | 0.93 | 0.45 (0.16, 1.24) | 0.12 |
| Distance track gallop per event (furlongs) | 0.50 | 0.66 | 0.70 | |||
| 0–1.4 | reference | reference | reference | |||
| 1.5–2 | 1.53 (0.80, 2.93) | 0.20 | 1.64 (0.75, 3.56) | 0.21 | 1.25 (0.38, 4.11) | 0.71 |
| 2.1–2.9 | 1.33 (0.70, 2.52) | 0.39 | 1.34 (0.54, 3.31) | 0.53 | 1.15 (0.43, 3.09) | 0.78 |
| 3–10.6 | 1.03 (0.53, 2.02) | 0.92 | 1.40 (0.52, 3.81) | 0.51 | 0.78 (0.28, 2.17) | 0.64 |
| Distance jump-outs last 4 weeks (furlongs) | 0.07 | 0.12 | 0.37 | |||
| 0–1 | reference | reference | reference | |||
| 2–9.3 | 1.75 (0.95, 3.23) | 0.07 | 1.75 (0.86, 3.56) | 0.12 | 1.75 (0.51, 5.98) | 0.37 |
| Distance trials last 4 weeks (furlongs) | 0.57 | 0.28 | 0.85 | |||
| 0–1 | reference | reference | reference | |||
| 2–14.2 | 1.17 (0.67, 2.05) | 0.57 | 1.63 (0.67, 3.92) | 0.28 | 0.93 (0.45, 1.93) | 0.85 |
| Distance races last 4 weeks (furlongs) | 0.78 | 0.78 | 0.33 | |||
| 0–1 | reference | reference | reference | |||
| 2–22.2 | 0.86 (0.29, 2.55) | 0.78 | 0.86 (0.29, 2.55) | 0.78 | 0.73 (0.38, 1.38) | 0.33 |
| Combined distance jump-outs, trials and races (furlongs) | 0.01 | 0.08 | 0.09 | |||
| 0–3.9 | reference | reference | reference | |||
| 4–9.9 | 1.84 (1.03, 3.28) | 0.04 | 2.30 (0.93, 5.68) | 0.07 | 1.61 (0.74, 3.50) | 0.23 |
| 10–22.2 | 0.72 (0.38, 1.36) | 0.31 | 0.60 (0.20, 1.82) | 0.37 | 0.73 (0.32, 1.64) | 0.44 |
| Total distance galloped (track, jump-outs, trials, races) | 0.04 | 0.30 | 0.70 | |||
| 0–5 | reference | reference | reference | |||
| 6–11 | 1.03 (0.50, 2.15) | 0.93 | 1.31 (0.57, 3.09) | 0.53 | 0.48 (0.10, 2.36) | 0.37 |
| 12–19 | 2.34 (1.14, 4.78) | 0.02 | 2.00 (0.83, 4.84) | 0.12 | 2.71 (0.77, 9.53) | 0.12 |
| 20–33 | 0.94 (0.50, 1.77) | 0.86 | 1.40 (0.54, 3.61) | 0.49 | 0.70 (0.28, 1.76) | 0.45 |
| Racing career and performance indices | ||||||
| Number starts as two-year-old | 0.50 | 0.60 | ||||
| 0 | reference | reference | ||||
| 1–2 | 0.85 (0.40, 1.81) | 0.68 | 0.78 (0.36, 1.68) | 0.52 | ||
| 3–5 | 0.45 (0.16, 1.26) | 0.13 | 0.50 (0.18, 1.41) | 0.19 | ||
| 6–9 | 0.65 (0.16, 2.54) | 0.53 | 0.82 (0.20, 3.41) | 0.78 | ||
| Age at first race (years) | 0.19 | 0.19 | ||||
| 2 | reference | reference | ||||
| 3 | 1.31 (0.68, 2.52) | 0.41 | 1.31 (0.68, 2.52) | 0.41 | ||
| 4 | 3.61 (0.90, 14.42) | 0.07 | 3.61 (0.90, 14.42) | 0.07 | ||
| Length of career to date (months) | 0.99 | 0.85 | ||||
| 1–7 | reference | reference | ||||
| 8–16 | 1.16 (0.40, 3.33) | 0.79 | 1.68 (0.52, 5.39) | 0.39 | ||
| 17–28 | 1.06 (0.35, 3.21) | 0.92 | 1.33 (0.42, 4.20) | 0.63 | ||
| 29–68 | 1.19 (0.33, 4.31) | 0.79 | 1.48 (0.39, 5.62) | 0.58 | ||
| Number of starts | 0.62 | 0.70 | ||||
| 1–3 | reference | reference | ||||
| 4–8 | 0.72 (0.24, 2.20) | 0.57 | 0.99 (0.30, 3.30) | 0.99 | ||
| 9–19 | 0.81 (0.24, 2.76) | 0.73 | 1.01 (0.28, 3.61) | 0.98 | ||
| 20–67 | 0.43 (0.10, 1.93) | 0.27 | 0.55 (0.12, 2.58) | 0.45 | ||
| Starts per 12 months over career duration | 0.46 | 0.44 | ||||
| 0.4–5.7 | reference | reference | ||||
| 5.8–8.2 | 0.46 (0.18, 1.21) | 0.12 | 0.45 (0.16, 1.23) | 0.12 | ||
| 8.3–10 | 0.73 (0.29, 1.80) | 0.49 | 0.72 (0.29, 1.81) | 0.49 | ||
| 10.1–24 | 0.69 (0.26, 1.81) | 0.49 | 0.83 (0.31, 2.24) | 0.72 | ||
| Number of races won | 0.72 | 0.68 | ||||
| 0 | reference | reference | ||||
| 1–2 | 0.57 (0.22, 1.48) | 0.25 | 0.53 (0.19, 1.47) | 0.22 | ||
| 3–5 | 0.63 (0.20, 2.00) | 0.44 | 0.60 (0.18, 1.96) | 0.39 | ||
| 6–13 | 0.62 (0.13, 2.96) | 0.55 | 0.58 (0.12, 2.87) | 0.51 | ||
| % of races won | 0.26 | 0.19 | ||||
| 0 | reference | reference | ||||
| 1–15 | 0.42 (0.14, 1.29) | 0.14 | 0.44 (0.14, 1.40) | 0.17 | ||
| 16–25 | 0.84 (0.28, 2.49) | 0.76 | 0.93 (0.29, 2.96) | 0.90 | ||
| 26–100 | 0.63 (0.21, 1.84) | 0.40 | 0.52 (0.16, 1.67) | 0.28 | ||
| Number of races 1st, 2nd or 3rd place | 0.49 | 0.47 | ||||
| 0 | reference | reference | ||||
| 1–2 | 1.86 (0.50, 6.92) | 0.36 | 1.88 (0.50, 7.06) | 0.35 | ||
| 3–6 | 1.08 (0.25, 4.62) | 0.91 | 1.04 (0.24, 4.50) | 0.96 | ||
| 7–27 | 0.87 (0.19, 4.02) | 0.86 | 0.85 (0.18, 3.95) | 0.83 | ||
| % of races 1st, 2nd or 3rd place | 0.50 | 0.38 | ||||
| 0 | reference | reference | ||||
| 1–30 | 2.40 (0.56, 10.20) | 0.24 | 2.70 (0.62, 11.86) | 0.19 | ||
| 31–50 | 1.19 (0.30, 4.65) | 0.81 | 1.17 (0.30, 4.63) | 0.82 | ||
| 51–100 | 1.29 (0.34, 4.97) | 0.71 | 1.21 (0.31, 4.69) | 0.78 | ||
| Total distance raced (5 furlongs/1 km) | 0.87 | 0.89 | ||||
| 1–4.3 | reference | reference | ||||
| 4.4–11.2 | 0.81 (0.27, 2.44) | 0.70 | 1.13 (0.34, 3.74) | 0.84 | ||
| 11.3–26.5 | 0.66 (0.19, 2.21) | 0.50 | 0.84 (0.24, 2.97) | 0.79 | ||
| 26.6–139.9 | 0.53 (0.12, 2.40) | 0.41 | 0.69 (0.15, 3.27) | 0.64 | ||
| Average distance per start (furlongs) | 0.13 | 0.15 | ||||
| 4.5–5.6 | reference | reference | ||||
| 5.7–6.0 | 0.41 (0.13, 1.27) | 0.12 | 0.53 (0.16, 1.69) | 0.28 | ||
| 6.1–6.8 | 1.00 (0.27, 3.63) | 0.99 | 1.39 (0.35, 5.51) | 0.64 | ||
| 6.9–10.4 | 0.43 (0.12, 1.55) | 0.20 | 0.57 (0.15, 2.13) | 0.41 | ||
| Total prizemoney ($1000 AUD) | 0.25 | 0.40 | ||||
| 0–11.0 | reference | reference | ||||
| 11.1–36.9 | 0.43 (0.13, 1.42) | 0.17 | 0.46 (0.14, 1.54) | 0.21 | ||
| 37.0–88.6 | 0.28 (0.07, 1.02) | 0.05 | 0.34 (0.09, 1.27) | 0.11 | ||
| 88.7–1039.5 | 0.26 (0.06, 1.09) | 0.07 | 0.30 (0.07, 1.27) | 0.10 | ||
| Prizemoney per start ($1000 AUD) | 0.05 | 0.06 | ||||
| 0–1.8 | reference | reference | ||||
| 1.9–3.7 | 0.16 (0.04, 0.62) | 0.01 | 0.16 (0.04, 0.62) | 0.01 | ||
| 3.8–6.8 | 0.25 (0.07, 0.92) | 0.04 | 0.25 (0.07, 0.90) | 0.03 | ||
| 6.9–67.2 | 0.17 (0.04, 0.69) | 0.01 | 0.18 (0.04, 0.74) | 0.02 | ||
| Population Characteristics | Horses of All Ages | Two-Year-Old Horses | Horses Three Years and Older | |||
|---|---|---|---|---|---|---|
| Adjusted OR (95% CI) | p-Value † | Adjusted OR (95% CI) | p-Value † | Adjusted OR (95% CI) | p-Value † | |
| Dam Parity | 0.01 | 0.01 | ||||
| 1 | reference | reference | ||||
| 2–3 | 0.55 (0.25, 1.22) | 0.14 | 0.19 (0.05, 0.70) | 0.01 | ||
| 4 | 0.62 (0.25, 1.54) | 0.30 | 0.16 (0.03, 0.76) | 0.02 | ||
| 5–14 | 0.27 (0.12, 0.64) | 0.003 | 0.08 (0.02, 0.36) | 0.001 | ||
| General racing and training history | ||||||
| Total preparation length (weeks) | 0.01 | 0.04 | ||||
| 2–7 | reference | reference | ||||
| 8–9 | 4.77 (1.69, 13.43) | 0.003 | 5.17 (1.27, 21.02) | 0.02 | ||
| 10–14 | 4.73 (1.65, 13.52) | 0.004 | 8.05 (1.92, 33.76) | 0.004 | ||
| 15–48 | 5.56 (1.59, 19.46) | 0.01 | 2.61 (0.51, 13.44) | 0.25 | ||
| Days slow last 4 weeks | <0.001 | 0.004 | 0.005 | |||
| 0–12 | reference | reference | reference | |||
| 13–15 | 0.31 (0.12, 0.84) | 0.02 | 1.04 (0.27, 4.00) | 0.96 | 0.19 (0.05, 0.74) | 0.02 |
| 16–17 | 0.10 (0.03, 0.28) | <0.001 | 0.20 (0.05, 0.83) | 0.03 | 0.08 (0.02, 0.36) | 0.001 |
| 18–24 | 0.09 (0.03, 0.28) | <0.001 | 0.14 (0.03, 0.65) | 0.01 | 0.08 (0.02, 0.37) | 0.001 |
| High-speed exercise history | ||||||
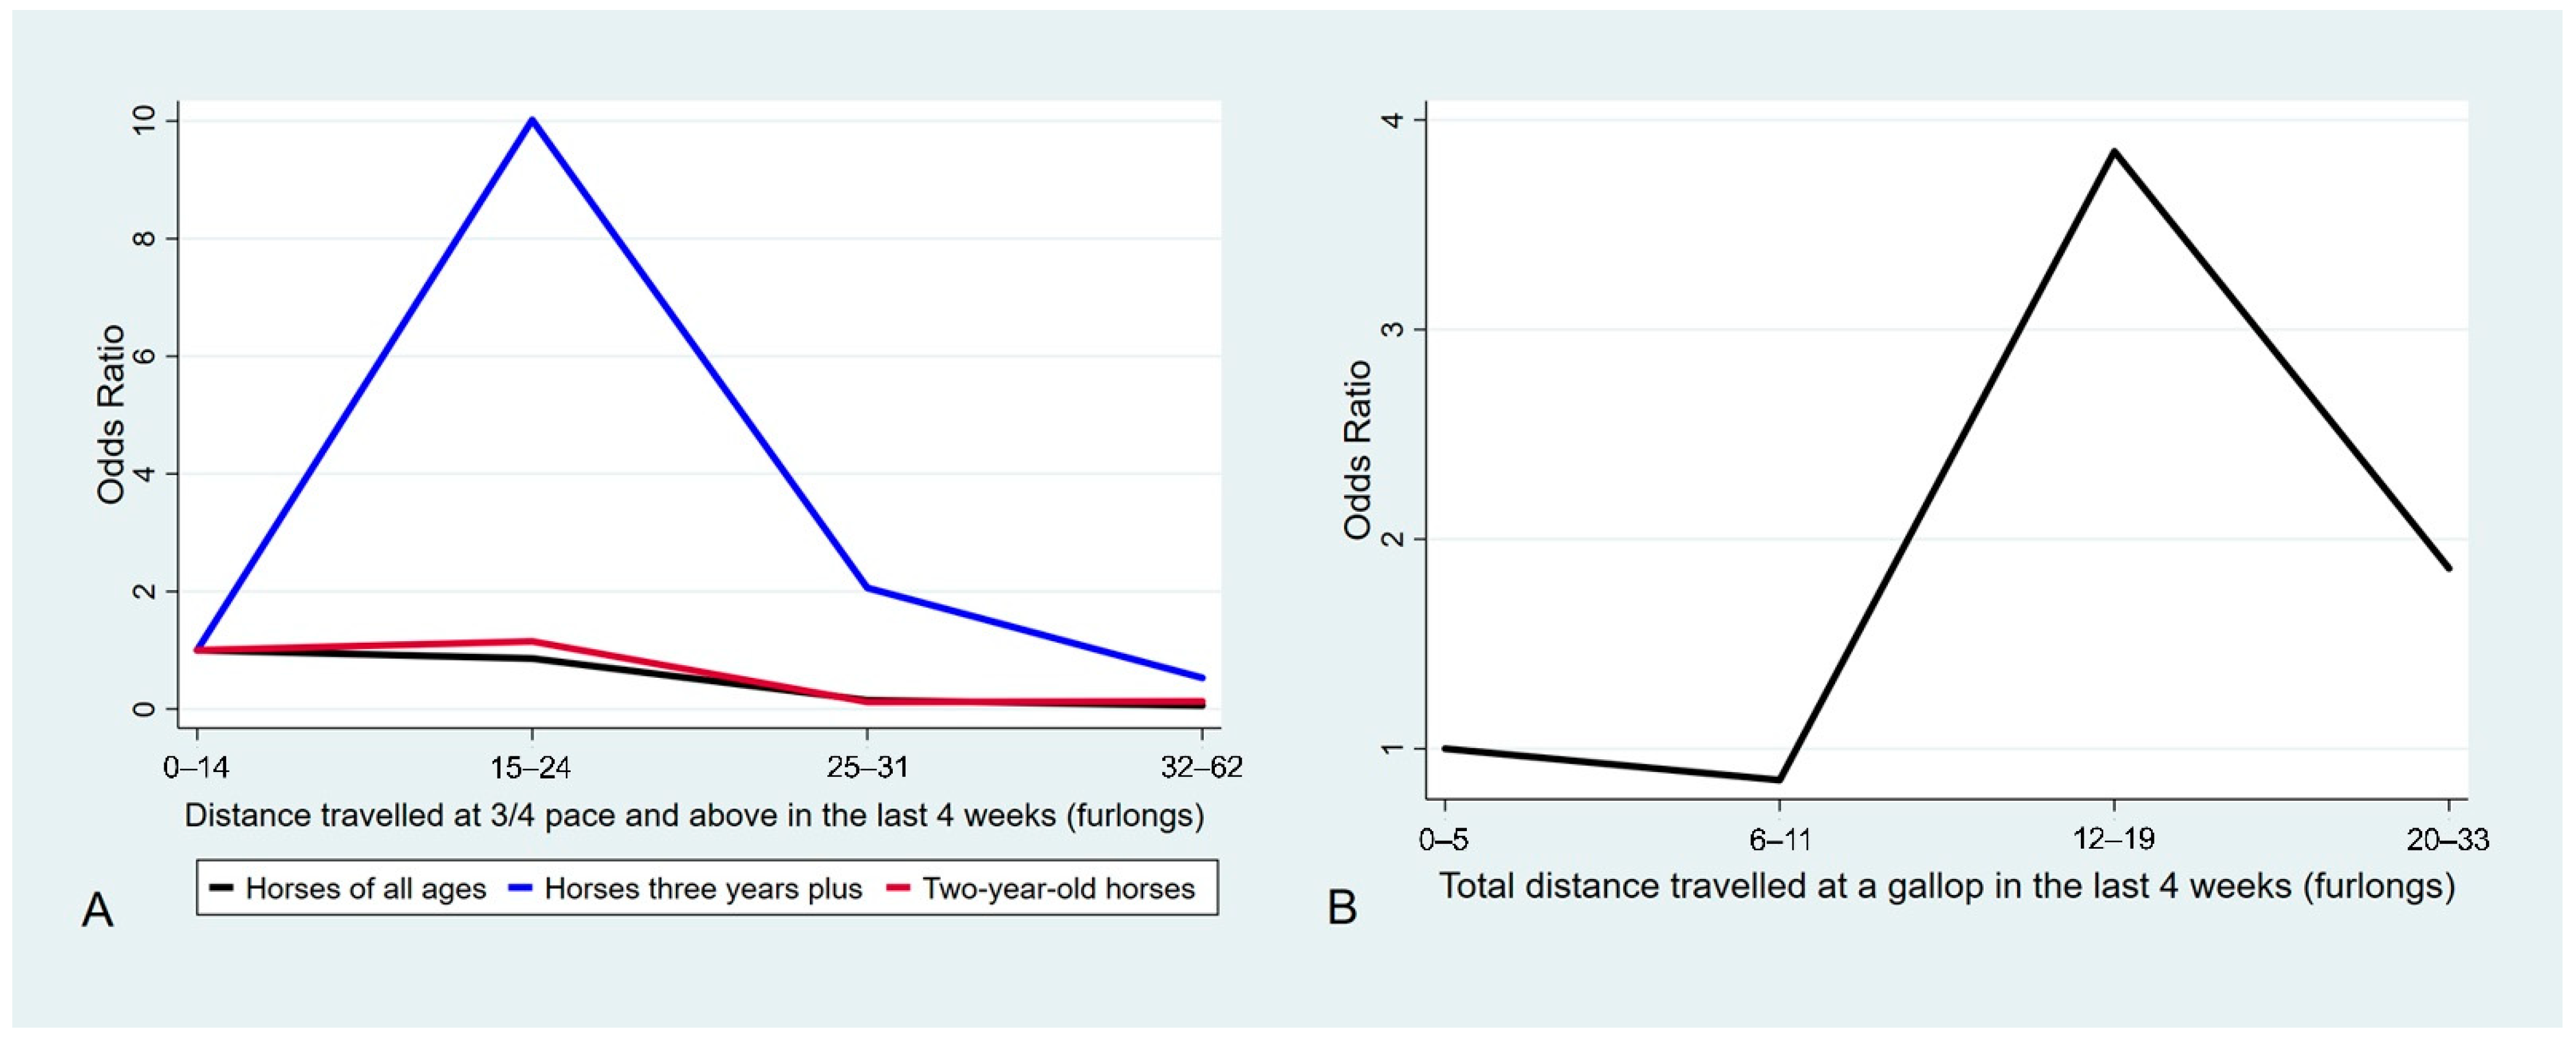
| Distance 3/4 pace and above last 4 weeks (furlongs) | <0.001 | 0.05 | 0.007 | |||
| 0–14 | reference | reference | reference | |||
| 15–24 | 0.86 (0.30, 2.52) | 0.79 | 1.15 (0.43, 3.08) | 0.78 | 10.02 (1.34, 75.77) | 0.03 |
| 25–31 | 0.15 (0.04, 0.64) | 0.01 | 0.12 (0.02, 0.70) | 0.02 | 2.06 (0.49, 8.60) | 0.32 |
| 32–62 | 0.06 (0.01, 0.26) | <0.001 | 0.13 (0.02, 0.91) | 0.04 | 0.53 (0.14, 1.93) | 0.33 |
| Total distance galloped (track, jump-outs, trials, races) | 0.08 | |||||
| 0–5 | reference | |||||
| 6–11 | 0.85 (0.26, 2.77) | 0.79 | ||||
| 12–19 | 3.85 (1.04, 14.25) | 0.04 | ||||
| 20–33 | 1.87 (0.51, 6.82) | 0.34 | ||||
Publisher’s Note: MDPI stays neutral with regard to jurisdictional claims in published maps and institutional affiliations. |
© 2021 by the authors. Licensee MDPI, Basel, Switzerland. This article is an open access article distributed under the terms and conditions of the Creative Commons Attribution (CC BY) license (http://creativecommons.org/licenses/by/4.0/).
Share and Cite
Crawford, K.L.; Finnane, A.; Phillips, C.J.C.; Greer, R.M.; Woldeyohannes, S.M.; Perkins, N.R.; Kidd, L.J.; Ahern, B.J. The Risk Factors for Musculoskeletal Injuries in Thoroughbred Racehorses in Queensland, Australia: How These Vary for Two-Year-Old and Older Horses and with Type of Injury. Animals 2021, 11, 270. https://doi.org/10.3390/ani11020270
Crawford KL, Finnane A, Phillips CJC, Greer RM, Woldeyohannes SM, Perkins NR, Kidd LJ, Ahern BJ. The Risk Factors for Musculoskeletal Injuries in Thoroughbred Racehorses in Queensland, Australia: How These Vary for Two-Year-Old and Older Horses and with Type of Injury. Animals. 2021; 11(2):270. https://doi.org/10.3390/ani11020270
Chicago/Turabian StyleCrawford, Kylie L., Anna Finnane, Clive J. C. Phillips, Ristan M. Greer, Solomon M. Woldeyohannes, Nigel R. Perkins, Lisa J. Kidd, and Benjamin J. Ahern. 2021. "The Risk Factors for Musculoskeletal Injuries in Thoroughbred Racehorses in Queensland, Australia: How These Vary for Two-Year-Old and Older Horses and with Type of Injury" Animals 11, no. 2: 270. https://doi.org/10.3390/ani11020270