Copper Oxide Spectral Emission Detection in Chalcopyrite and Copper Concentrate Combustion
by
 , , , , and
Gonzalo Reyes
1,* ,
,
Walter Diaz
1 ,
,
Carlos Toro
2, 
Eduardo Balladares
1 ,
,
Sergio Torres
3,
Roberto Parra
1 and
Alejandro Vásquez
1 
1
Metallurgical Engineering Department, University of Concepción, Concepción CCP4070386, Chile
2
Dirección de Investigación, Technological University of Chile INACAP, Avenida El Condor 720, Ciudad Empresarial, Huechuraba, Santiago RM858000, Chile
3
Electrical Engineering Department, University of Concepción, Concepción CCP4070386, Chile
*
Author to whom correspondence should be addressed.
Processes 2021, 9(2), 188; https://doi.org/10.3390/pr9020188
Submission received: 21 December 2020
/
Revised: 14 January 2021
/
Accepted: 16 January 2021
/
Published: 20 January 2021
(This article belongs to the Special Issue Advanced Process Monitoring for Industry 4.0)
Abstract
:In this research, the spectral detection of copper oxide is reported from different combustion tests of chalcopyrite particles and copper concentrates. Combustion experiments were performed in a bench reactor. In all the tests, the radiation emitted from the sulfide particle reactions was captured in the VIS–NIR range. The obtained spectral data were processed by using the airPLS (adaptive iteratively reweighted penalized least squares) algorithm to remove their baseline, and principal component analysis (PCA) and the multivariate curve resolution method alternate least squares (MCR-ALS) methods were applied to identify the emission lines or spectral bands of copper oxides. The extracted spectral pattern is directly correlated with the emission profile reported in the literature, evidencing the potential of using spectral analysis techniques on copper sulfide combustion spectra.
1. Introduction
The need for better process monitoring, control, and optimization of industrial reactors, and to secure environmental sustainability, has driven the development of new technologies in metallurgical processes. For example, many conventional reactors in the metallurgical industry have undergone improvements and optimization in their design and operation. Advanced sensing techniques, such as those presented in this work, increase understanding of the physical chemistry phenomena that take place in the process, facilitating these process improvements.
Flash smelting technology produces over 50% of the primary copper in the world [1] and it is widely used by the top producers of primary copper, such as China, Japan, Chile, and Russia, who represent more than 60% of the copper production through the pyrometallurgy processes. The flash furnace used in this type of process originated in Finland at the end of World War II and presented an excellent alternative to the energy shortage that existed in post-war Europe since, at that time, the intensive demand for thermal energy was mainly supplied by the combustion of hydrocarbons [2]. Over the years, flash smelting furnaces have become the most widely used technology in new smelting companies due to their ability to take advantage of the heat released through combustion reactions.
At present, new processes and technologies have emerged as competitors to flash combustion [3,4]. The flash furnace continues to be widely used for both its energy efficiency and its environmental performance. Since these furnaces appeared on the market, numerous studies have been reported to improve the understanding of physicochemical phenomena and thus optimize their performance. One example is the work of Jorgensen in 1981 [5], who measured the temperature of pyrite particles reacting inside a laminar flow reactor, all of which was facilitated by optical pyrometry techniques and particularly by the two-color pyrometry method.
Over the years, it led to the improvement of measurement techniques as can be seen in the work of Tuffrey et al. [6], who also measured the temperature of pyrite, registering much higher values (maximum 3127 °C) than those reported by Jorgensen. The latter was attributed to the higher speed of the pyrometer data acquisition system used by Tuffrey. Subsequently, many studies on combustion kinetics, reaction mechanisms, and particle size measurement, among others, have applied two-color pyrometry as a support in their experiences [7,8,9,10].
The latest works reported on spectral measurements of sulfide combustion in laboratory tests have been carried out by a group of researchers from the Metallurgical and Electrical Engineering Departments of the Universidad de Concepción, Chile. This group has made use of optical pyrometry techniques to retrieve the flame temperature of concentrates and pure mineral species under combustion conditions. In these investigations, different spectral ranges of all the captured radiation were used and a cooled optical fiber was specially designed for high-temperature applications [11,12].
The application of spectroscopy at an industrial level is scarce, and one of the few examples is the mentioned by Sun et al. [13], who measured a coal-fired flame in a boiler, while the only reported measurements in an industrial flash furnace were performed at the Chagres smelter, Anglo American [12]. These tests were carried out by introducing a cooled optical probe inside the furnace through a sight glass positioned on the roof of the reaction tower, which allowed this optical system to capture flame combustion similarly to those found in laboratory experiments [14,15].
2. Spectral Emissions of Iron and Copper Oxides
In the last 50 years, different researchers in the field of emission spectroscopy have found the ranges of wavelengths in which certain chemical elements and molecules emit radiation, thus determining their spectral profiles. Among them are the emission spectra profiles of iron oxide and copper oxide. Although in these investigations, these emission profiles have not been obtained from sulfide combustion tests, they can be used as a reference when determining the presence of these oxides in a copper and iron sulfide emission spectrum, as Toro et al. did in their research on high-grade pyrite combustion spectra [16].
2.1. Spectral Emission of Iron Oxide
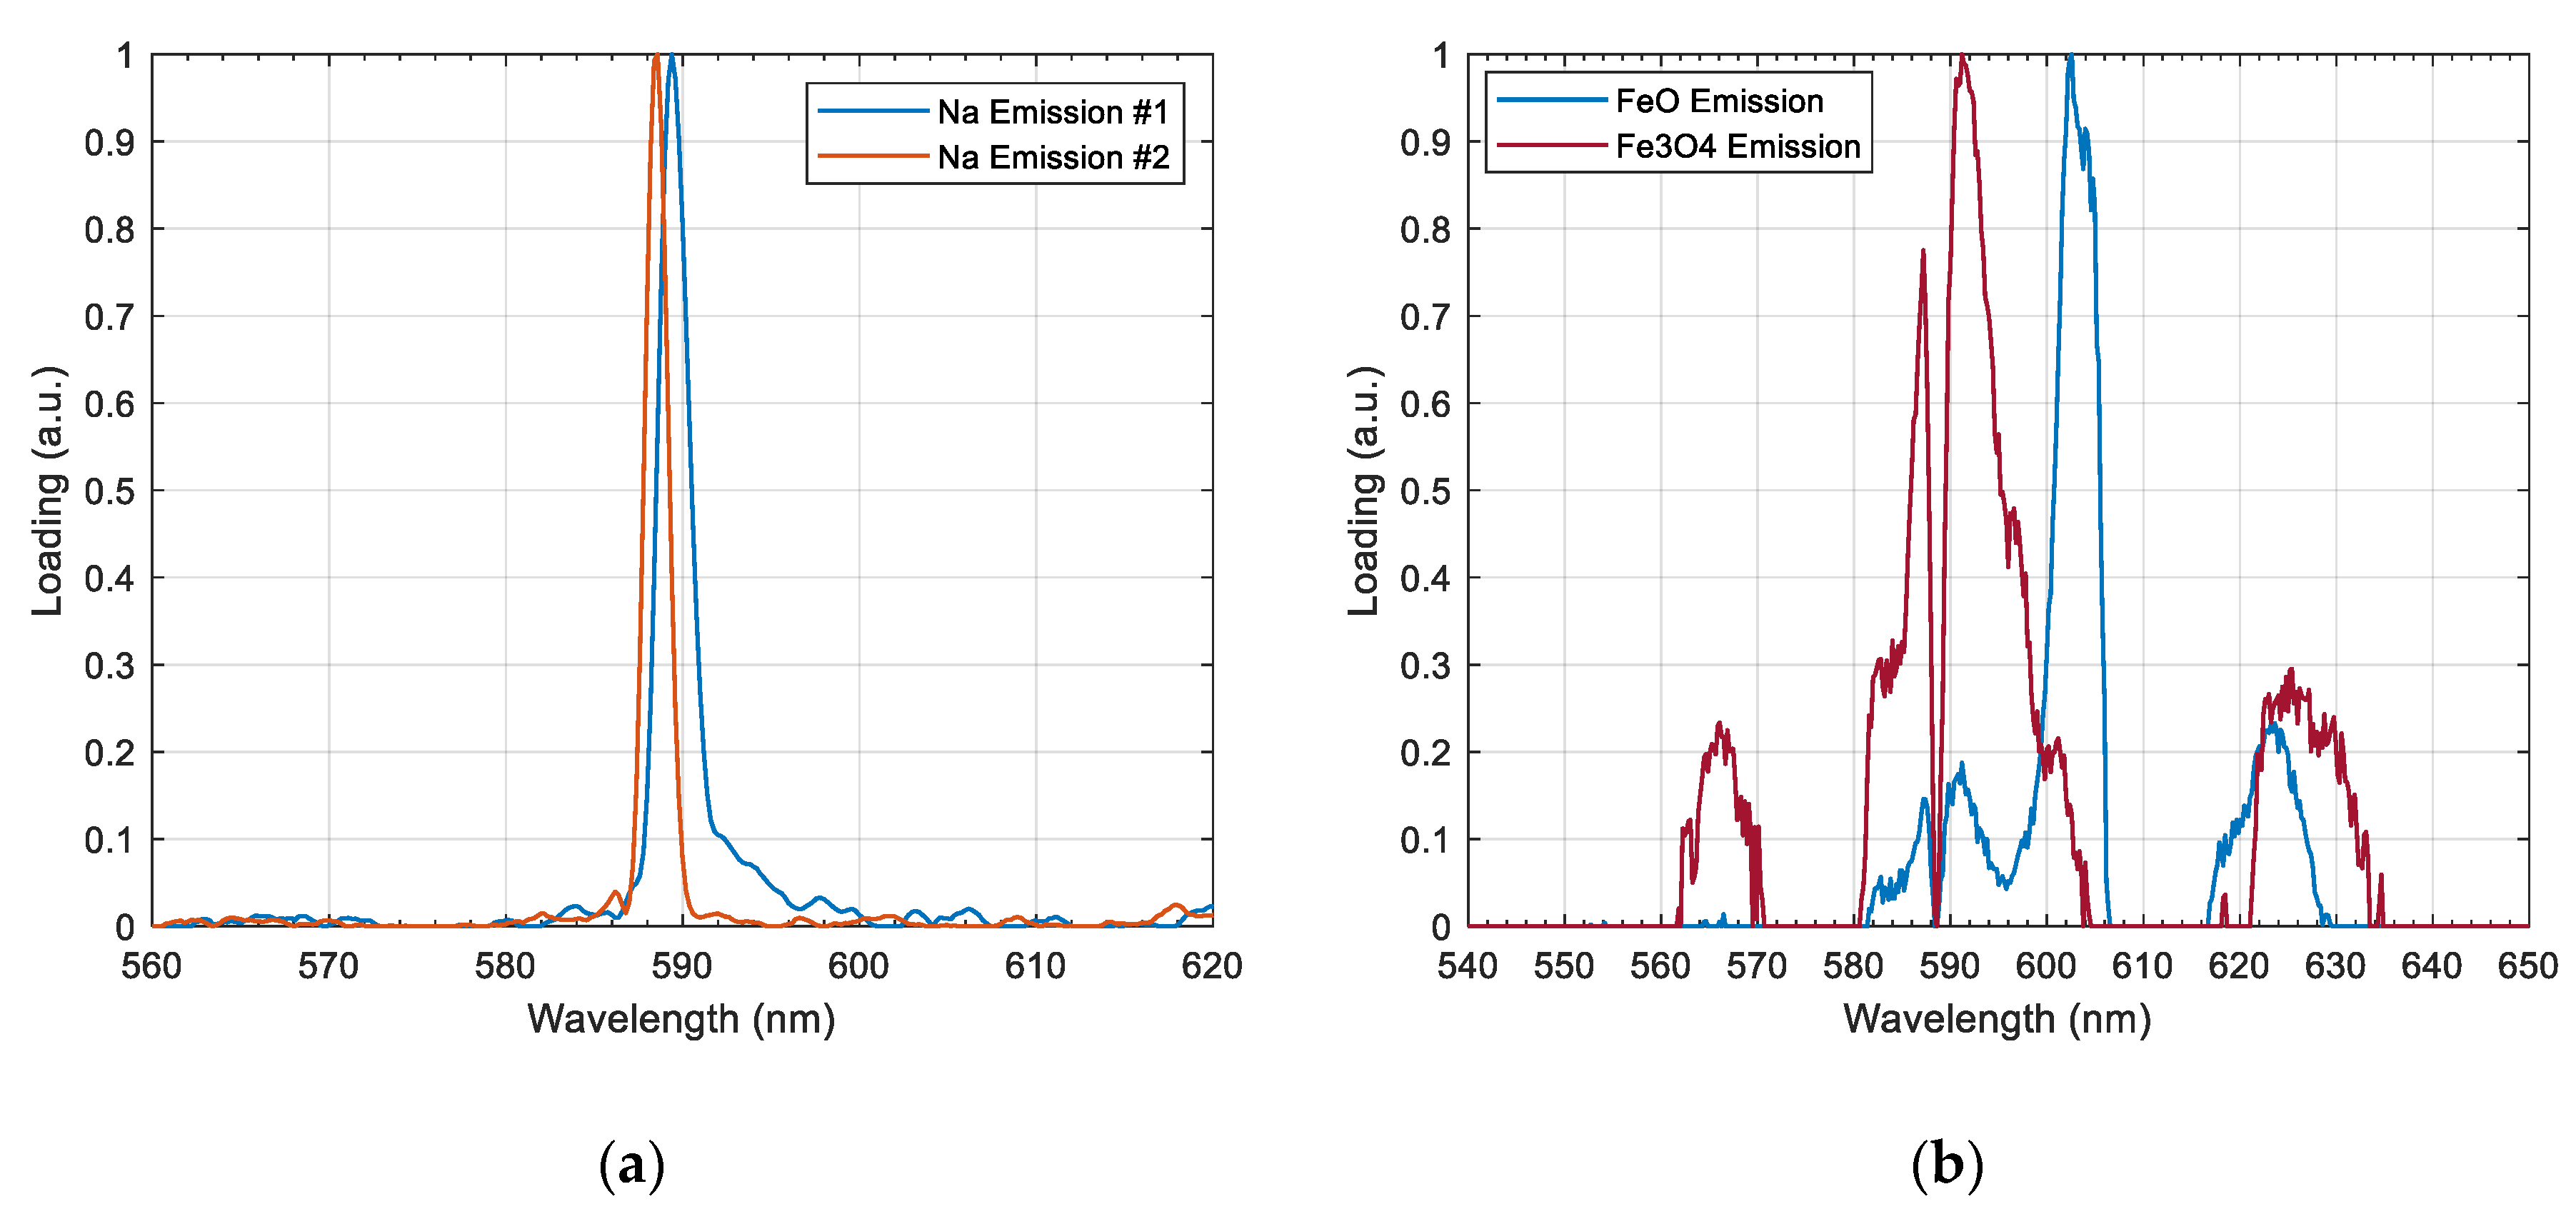
In the case of iron oxide (FeO), West and Broida [17] conducted a study in the visible spectral range (VIS). In their work, they reported that the FeO molecule emits a continuous spectrum between 500 and 700 nm. The emission profile contains wide spectral bands centered at 570, 590, and 620 nm. In the case of the wavelength of 590 nm, it is usually not perceived due to the interference of the sodium emission [18]. Toro et al. applied multivariate techniques on high-grade pyrite emission spectra. Through principal component analysis (PCA) and multivariate curve resolution method alternate least squares (MCR-ALS) analysis, the combustion spectrum was deconvolved obtaining pure emission profiles of Na, FeO, and Fe3O4 [16].
2.2. Spectral Emission of CuOx
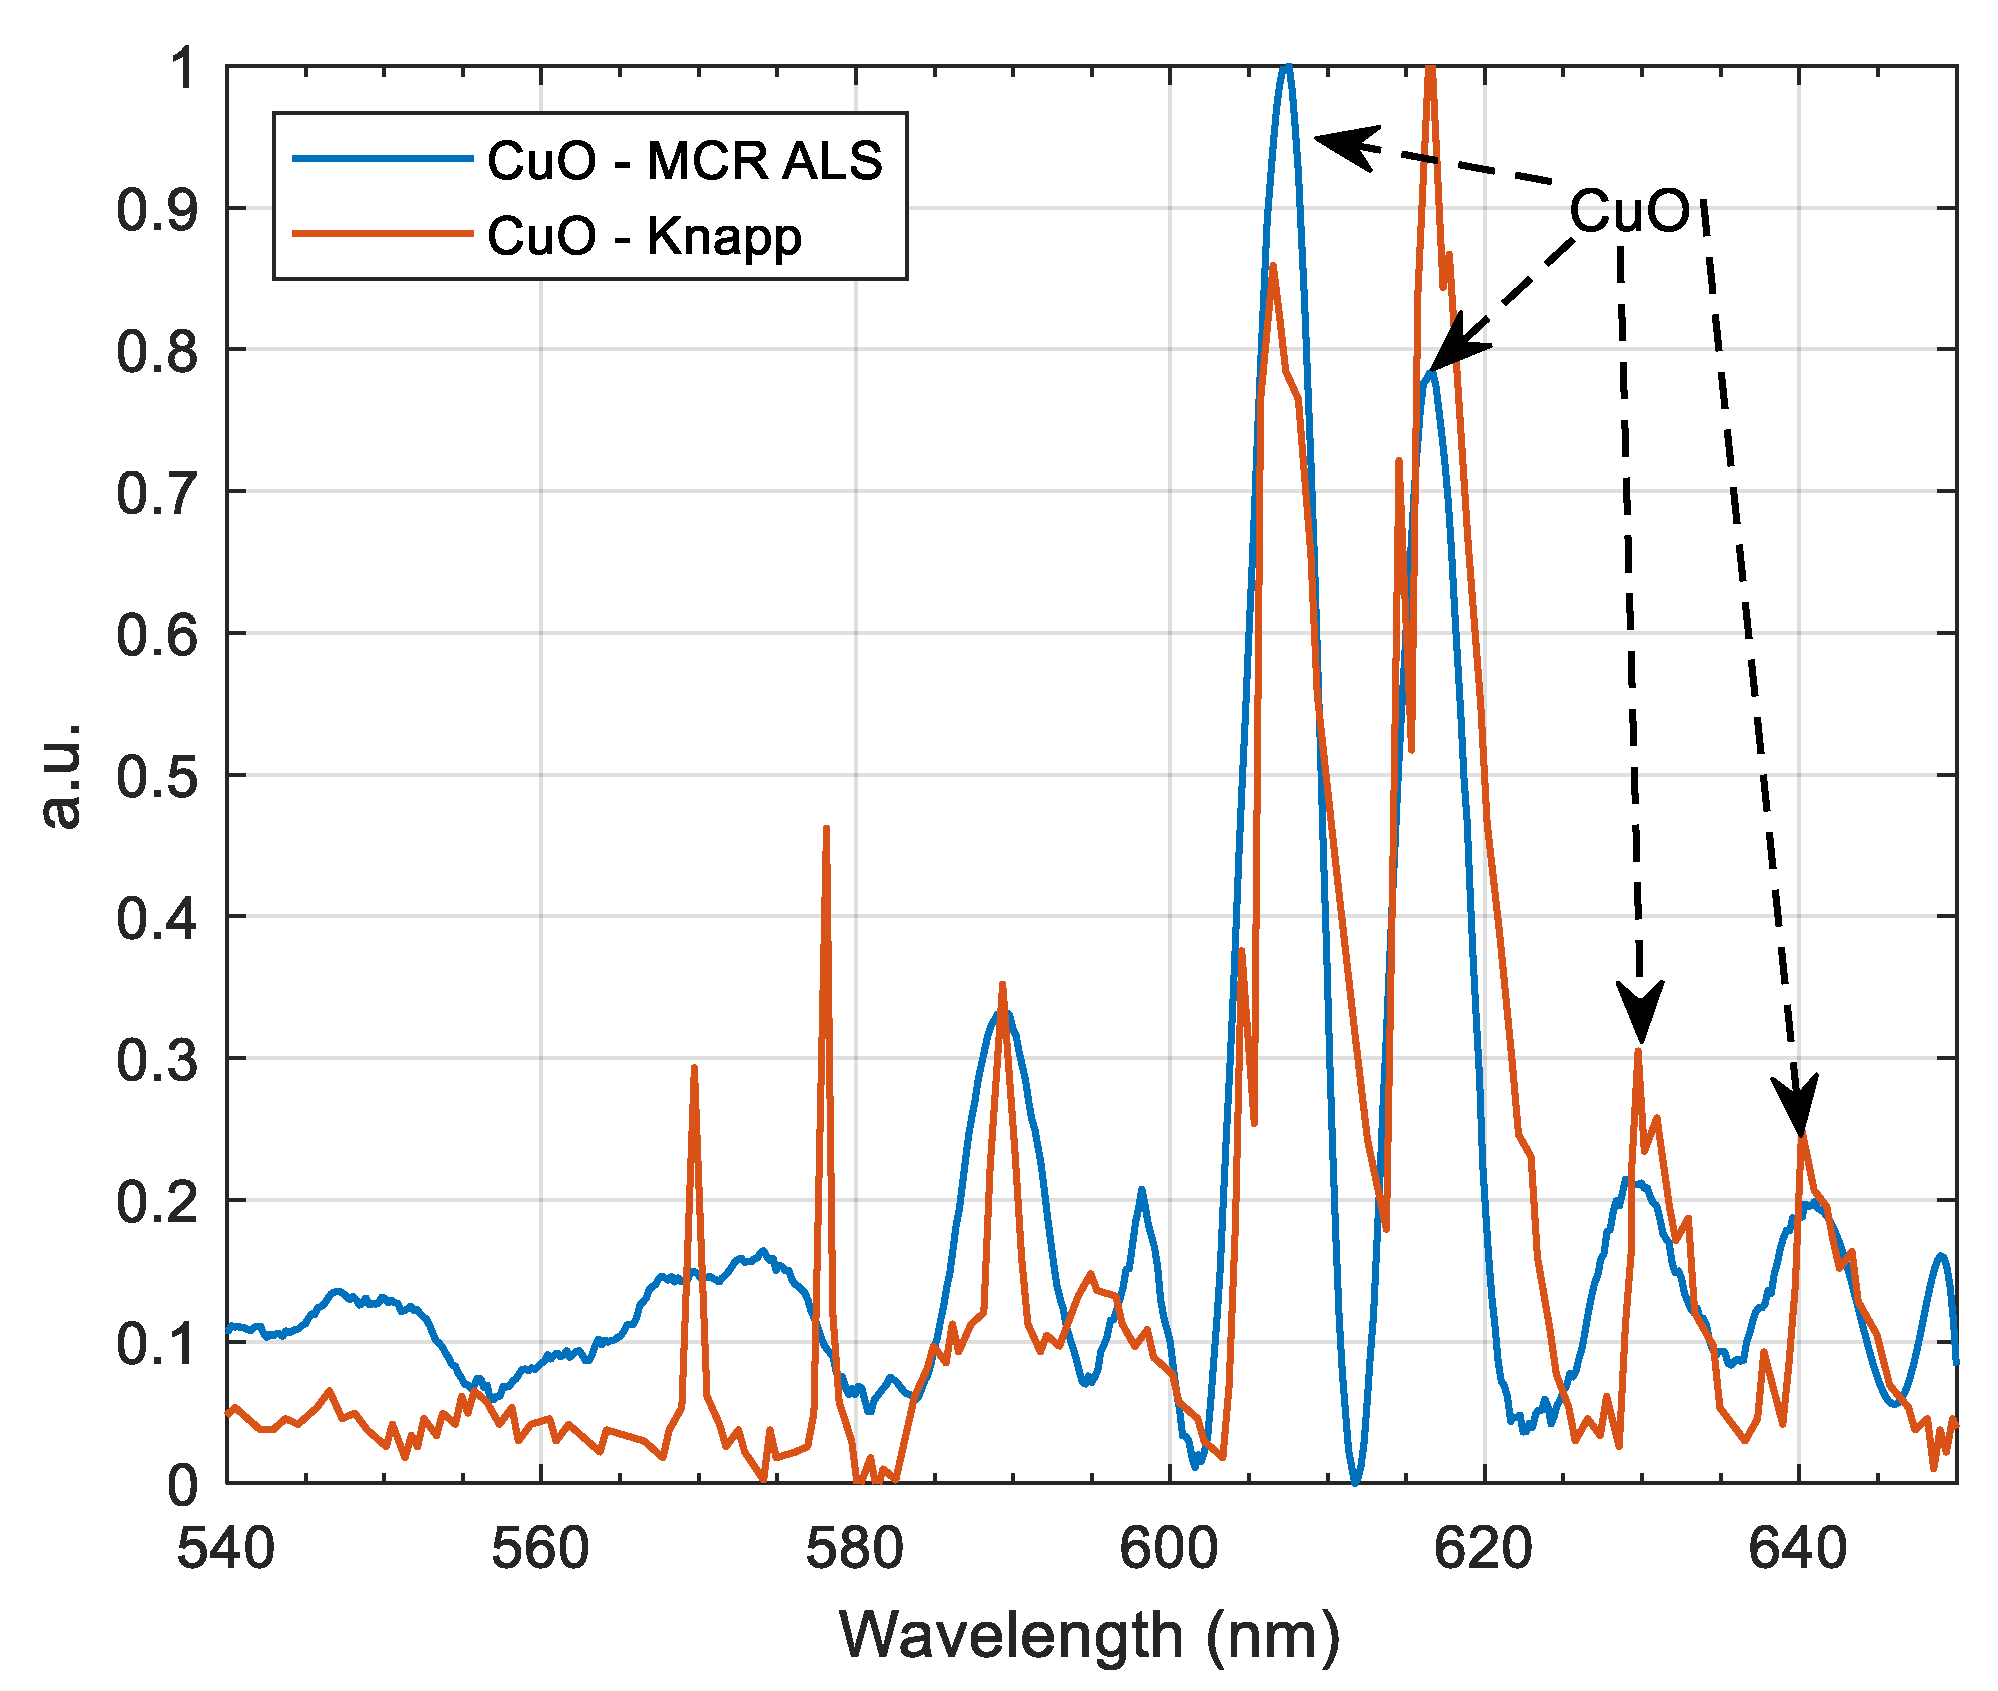
The study presented by Gole in the early 1990s was the first to report the emission profile of copper oxide, with spectral bands located in the range of 580 to 720 nm [19]. For their part, Knapp et al. proposed a spectral profile of copper oxide and aluminum oxide in their study of the emission spectroscopy of the termite combustion flame [20]. In this study, they presented four peaks located at 606, 616, 629 and 640 nm, which represent CuOx emissions.
This research shows the application of an optoelectronic technique to measure the combustion flame produced by copper concentrates. The obtained spectral information was related to the physicochemical processes. The industrial process control could be performed with the application of this optoelectronic technique, allowing the operators to visualize important indicators of the processes online and in real-time.
The objective of this research is to study the emission spectra of chalcopyrite and a real copper concentrate when it is exposed to combustion conditions using an optical measurement system.
3. Methodology
The combustion tests were performed to detect spectral characteristics of interest associated with copper oxides. The emission spectrum of a flame represented by I (λ, T) = Ic (λ, T) + Id (λ, T) + Imol (λ, T) + n, where λ is a wavelength sample, T is the flame temperature, Ic is the baseline, Imol and Id are components associated with molecular and elementals emissions (discontinuous), respectively [21], and n is a noise component related to the electronics and detectors themselves. The spectral range and the number of sampled wavelengths were defined by the spectrometer. Research methods and considerations are represented below.
Experimental Setup and Sample Characteristic
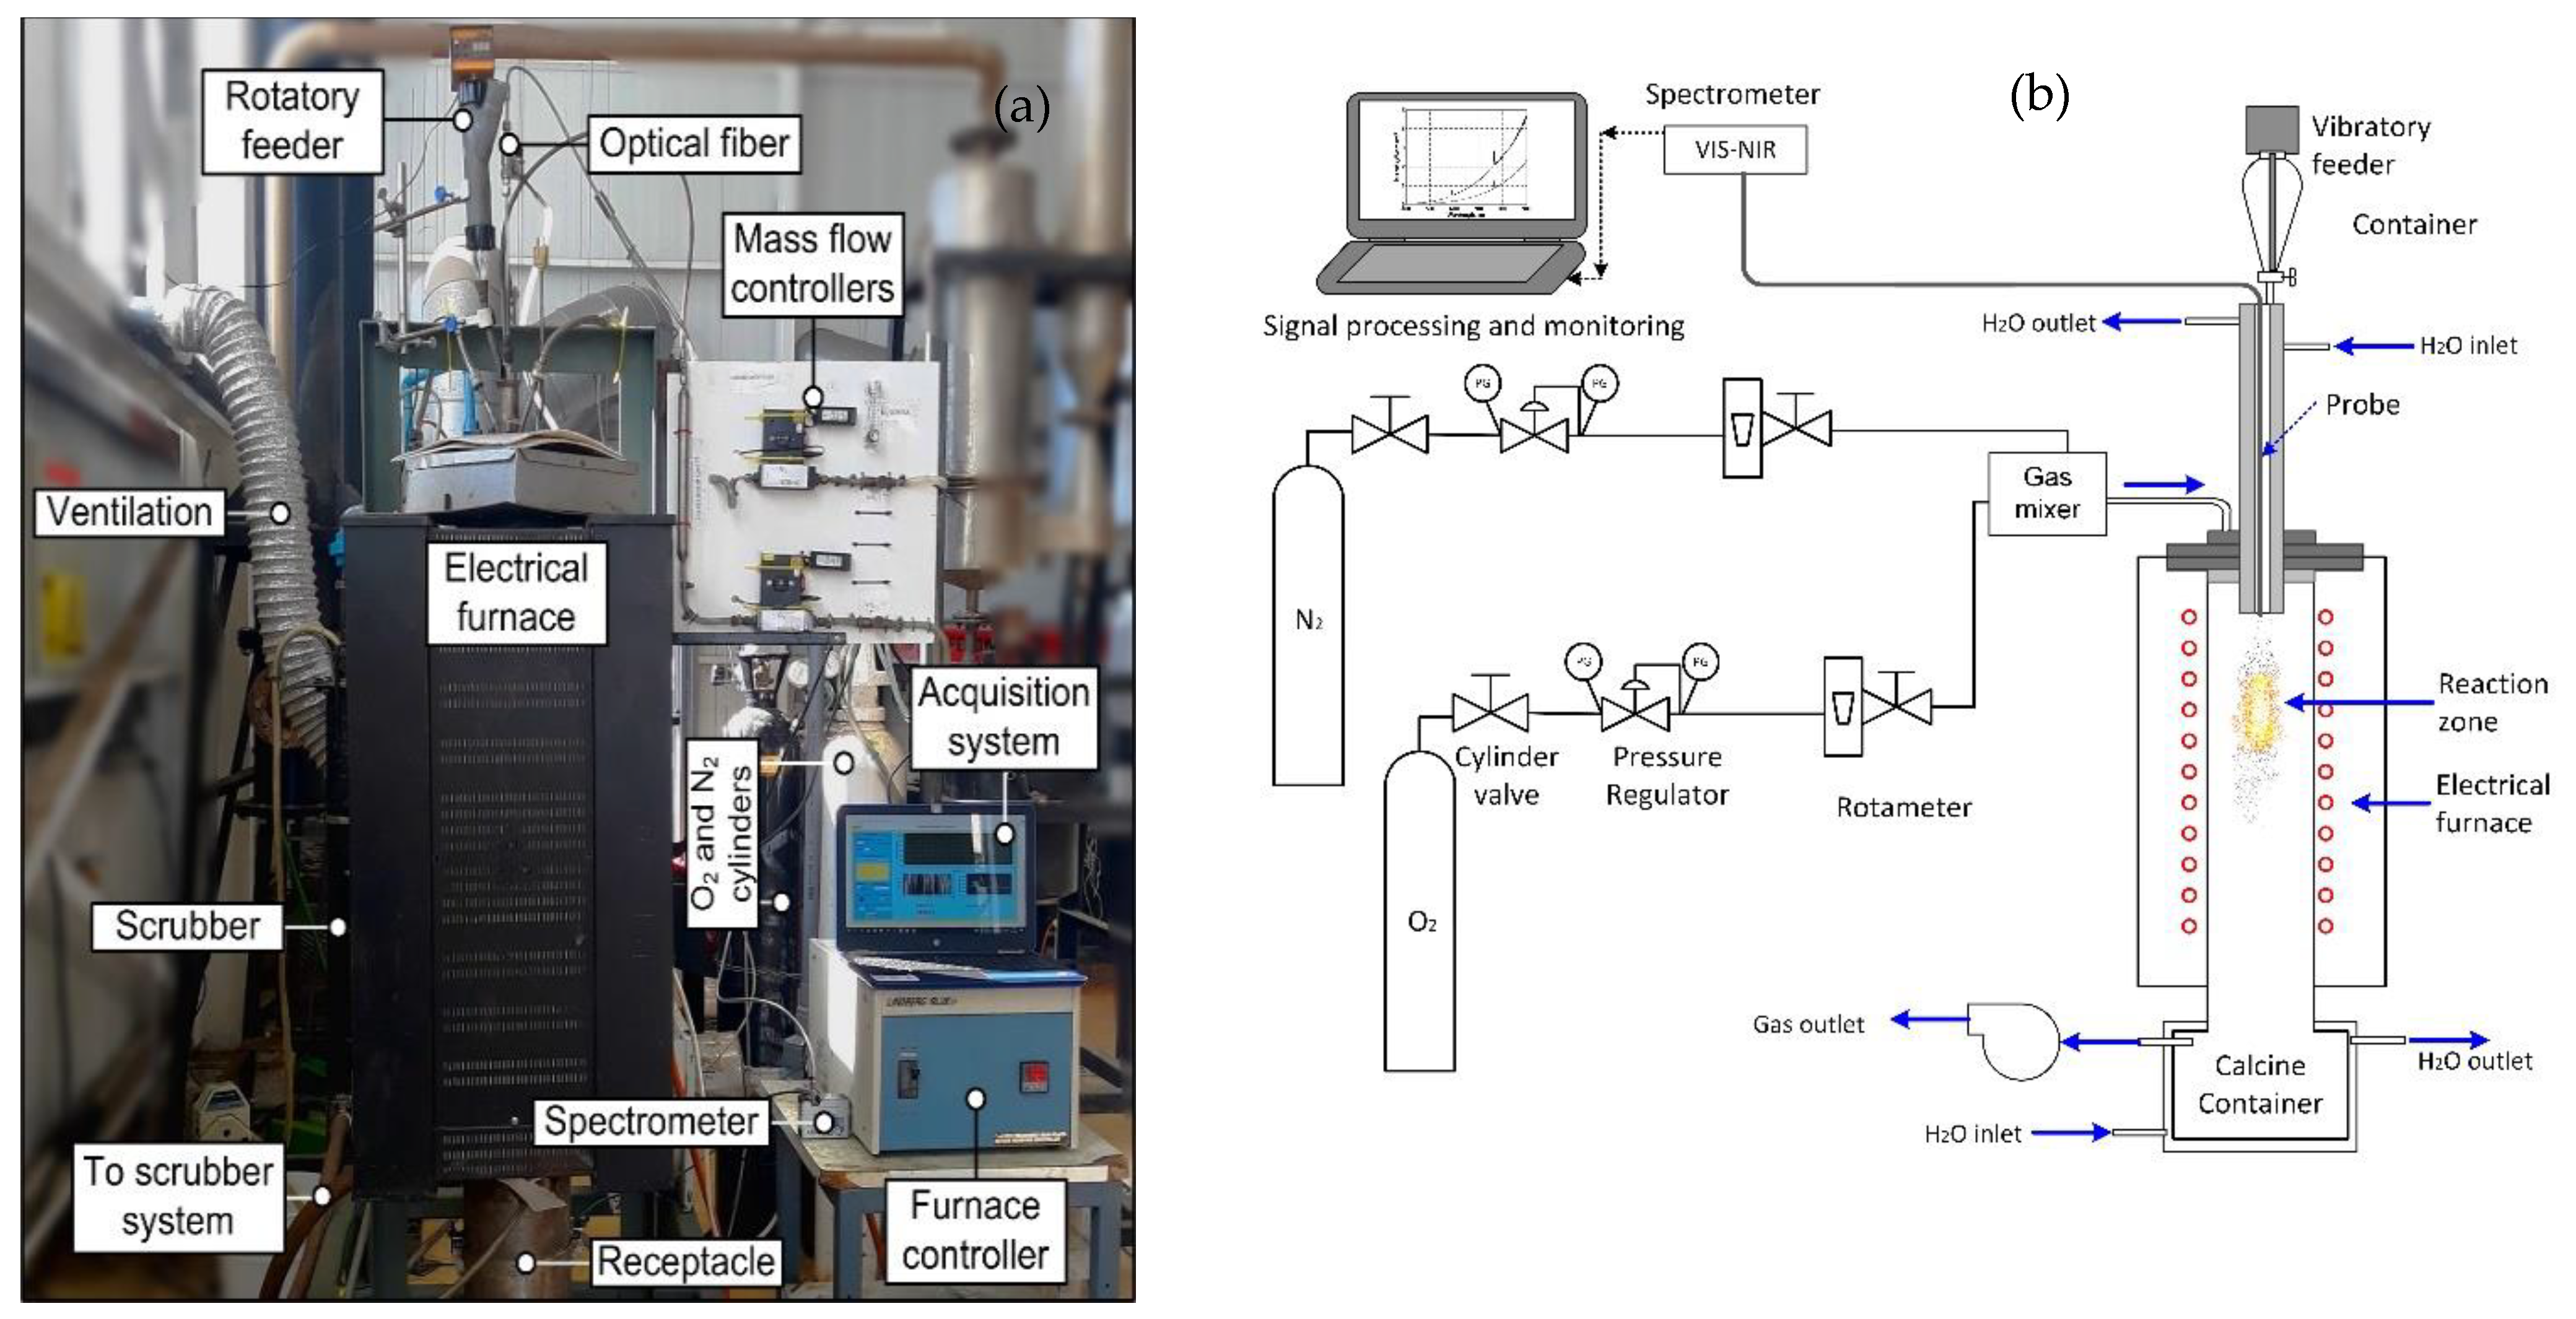
Briefly, the combustion experiments were performed in a bench-scale setup consisting of a drop-tube reactor under laminar flow conditions and heated by a controlled electrical furnace at 1273 K (Figure 1). The spectral data acquisition was composed of cooled optical fiber (Avantes®) and a VIS–NIR spectrometer (Ocean Optics USB4000®) which is sensitive in the spectral range between 344 and 1034 nm and can deliver 3648 wavelengths samples in such a range.
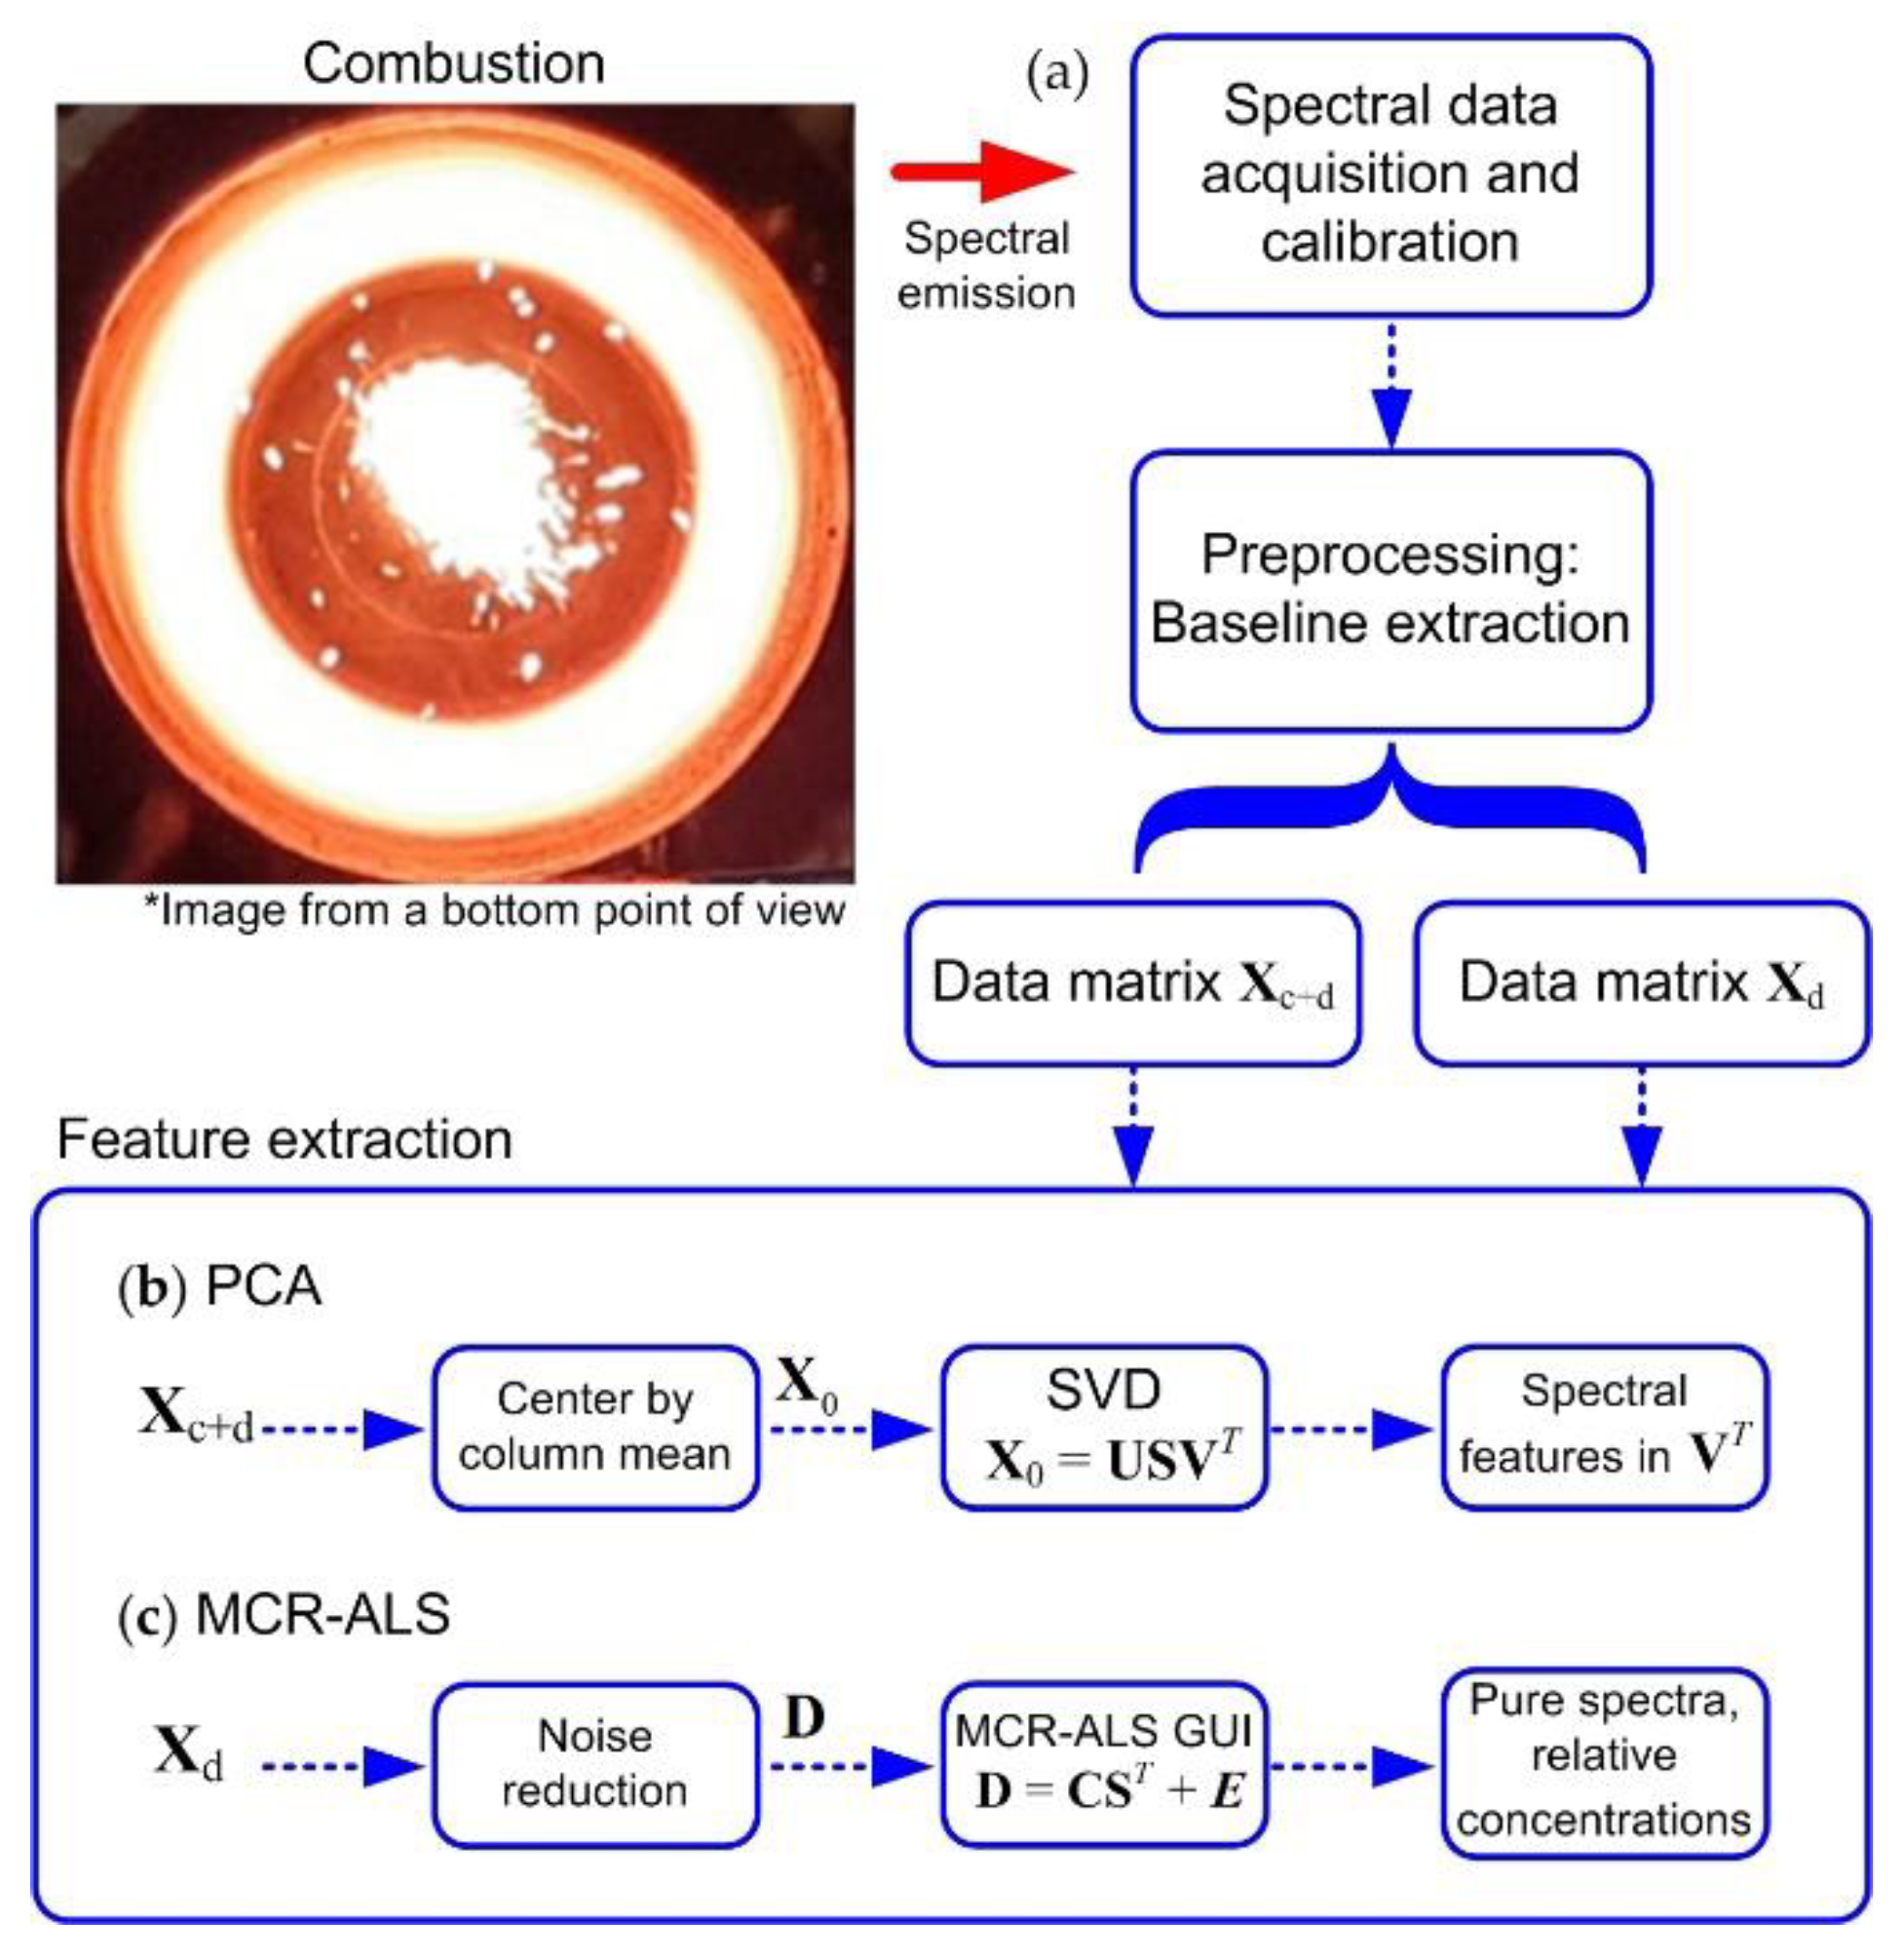
The measurement and interpretation of the emitted radiation from the cloud of particles in the reactor is a difficult task, especially for copper concentrates, since it involves many chemical and physical processes and interactions between the particles and the particles with their surroundings. In Figure 2, a sample of the incandescent cloud generated during combustion is depicted. This figure also summarizes the spectral data acquisition and the implemented methodologies to process and analyze the spectral information.
In this research, spectral data processing with multivariate data analysis methods were implemented to extract important characteristics related to the formation of copper oxides. PCA was used for an exploratory analysis on the data matrix containing all the spectral information, whilst MCR-ALS was used to deconvolve the original emission spectrum based on its pure spectral components. The airPLS (adaptive iteratively reweighted penalized least squares) algorithm baseline correction [16,22] was used to unmix the continuous and discontinuous spectral components to ensure that the analysis was on the chemical behavior of the combustion and not on its energy. The data analysis was carried out in MATLAB™ (MathWorks, Inc., Natick, MA, USA) with the PLS Toolbox 8.9 (Eigenvector Research, Inc., Manson, WA, USA) and MCR-ALS GUI 2.0.
The chalcopyrite sample was purchased from Ward’s Science® (Rochester, NY, USA), while the concentrate was donated by a Chilean mining company. The predominant mineralogical composition of the concentrates is detailed in Table 1.
In this research, eight sets of tests were carried out. Six of them consisted of the combustion of chalcopyrite at different particle sizes, corresponding to 105 to 149, 74 to 105, 53 to 74, 44 to 53, 37 to 44, and <37 μm. From now on, these samples will be referred to as CpyA, CpyB, CpyC, CpyD, CpyE, and CpyF respective to the previous order. The concentrates used had a granulometric distribution with a p80 of ~36 µm for sample Conc. A and ~47 µm for sample Conc. B. A Sympatec Helos-Succel™ particle size analyzer based on a diffraction laser was used for the particle size analysis. All the laboratory experiments were carried out under similar conditions. In addition, we worked with oxygen supply three times over the stoichiometric quantity to ensure the total oxidation of the chalcopyrite and the sulfurized species in the concentrates to form copper oxides. The calcines obtained in each test were analyzed using scanning electronic technology. For more details about the methodology and special considerations, see Toro et al. [16].
4. Results
4.1. Spectral Measurement from Chalcopyrite
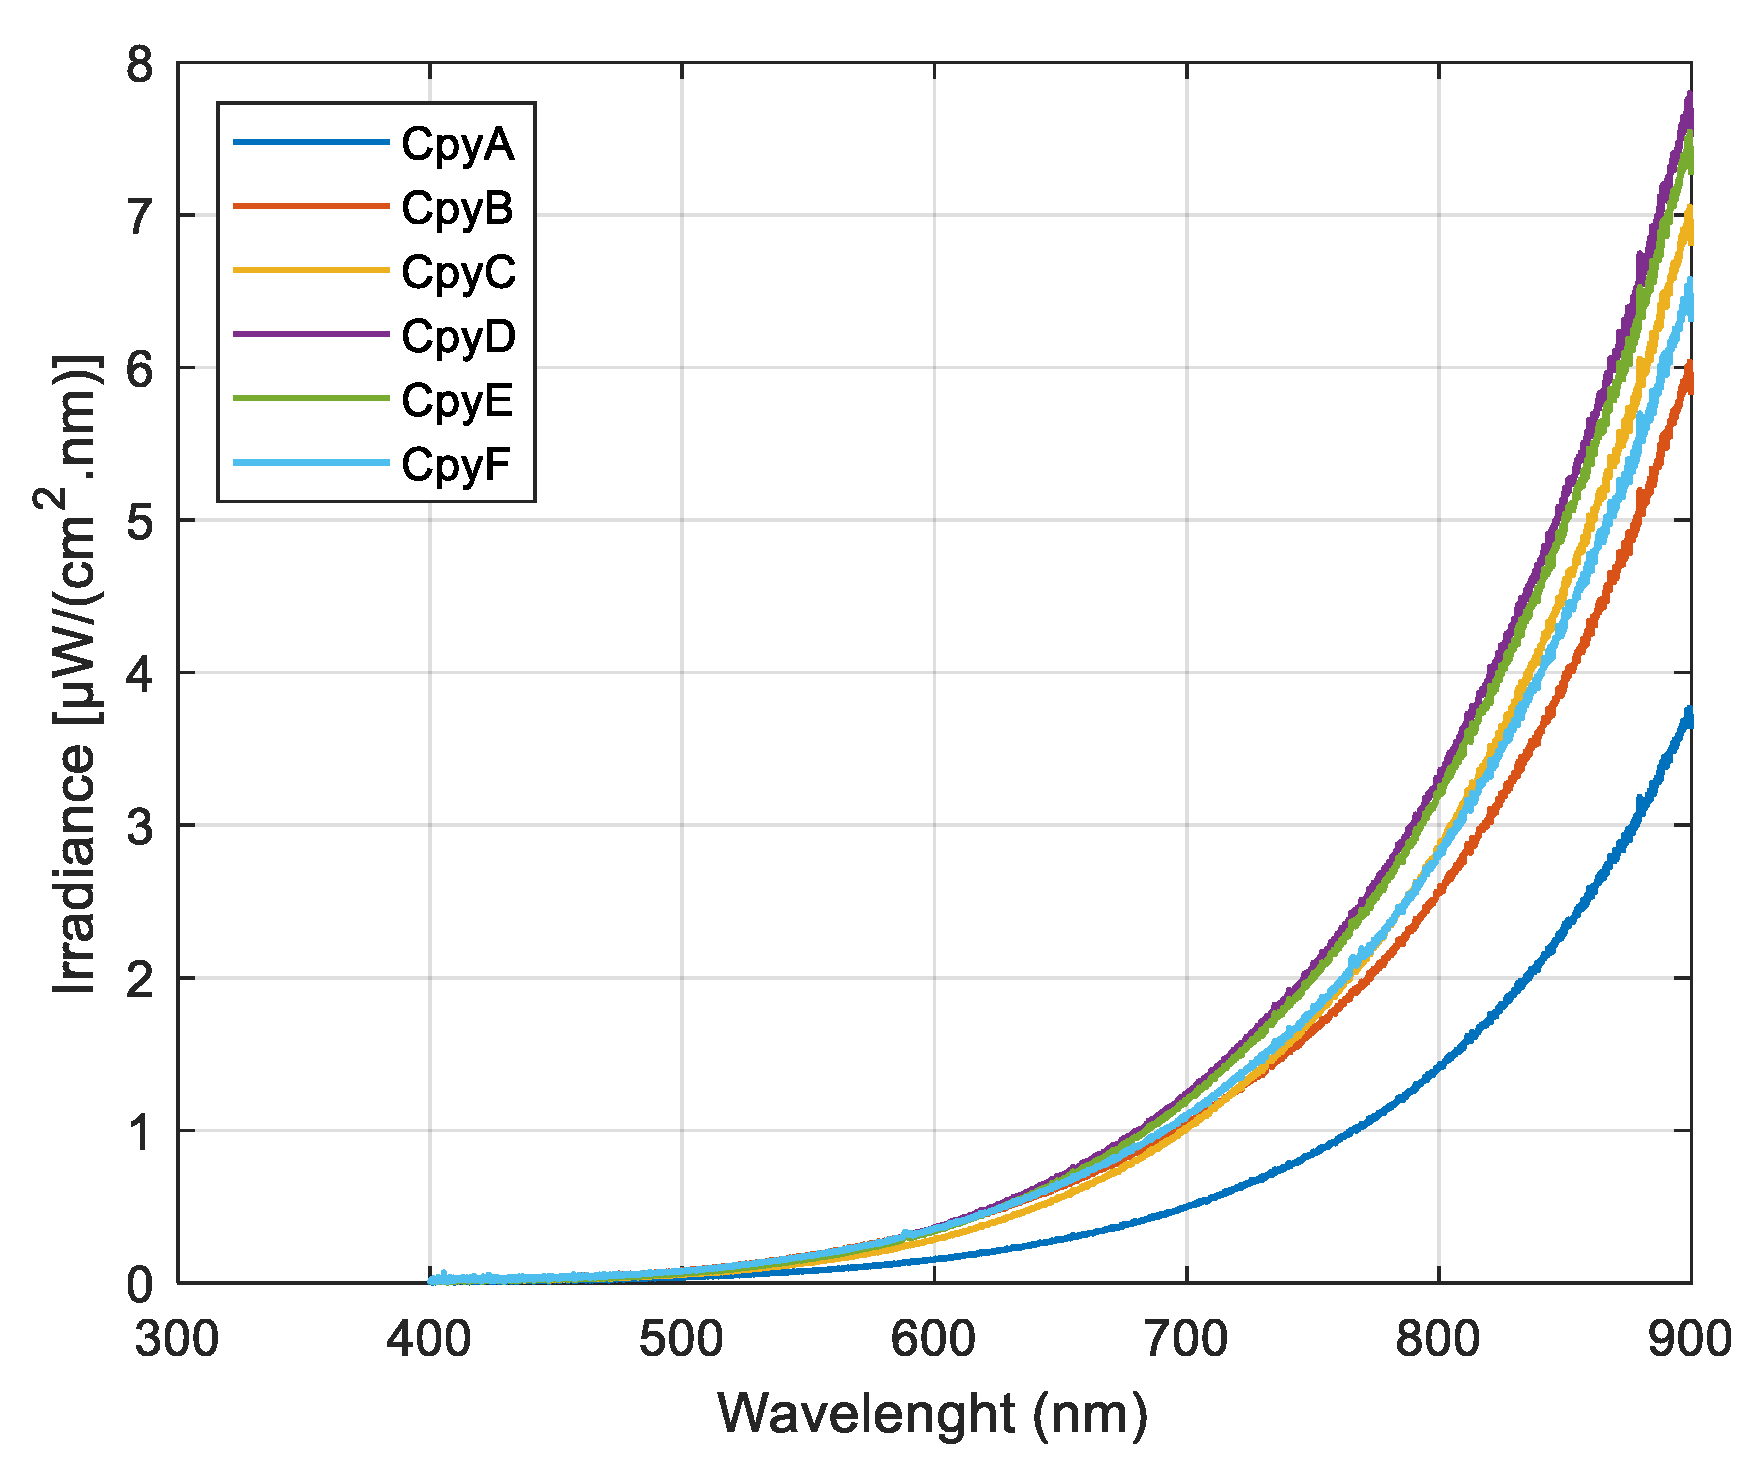
The first step was to calculate the average spectra obtained in each test, which are depicted in Figure 3. The average calibrated spectrum of chalcopyrite combustion for each size is shown in Figure 3. It is observed that the behavior of the spectral irradiance was different for each size of chalcopyrite analyzed. It is possible to observe that for the finer sizes, the intensity of the spectrum is greater; this is because finer particles are completely oxidized, releasing more energy. A cloud of fine particles represents a greater surface area compared to a cloud of “coarse” particles, which also has a higher oxygen consumption which in turn translates into greater heat generation. For their part, the larger particles take time to burn in the reaction zone, resulting in a lower intensity emission spectrum. Even so, this behavior is not possible to observe in the smallest sample size (CpyF), which may be related to an agglomeration problem. The smallest size tends to form clumps in the cloud combustion, increasing its particle size and thus behaving as coarse particles.
It is not possible to observe emission peaks in the chalcopyrite spectra compared to those reported by Toro et al. [16] in their combustion experiments with pyrite. This is likely because chalcopyrite in an oxidizing environment releases less energy than pyrite under the same conditions, which results in a lower temperature combustion flame, making it more difficult to identify discontinuities. Some of the reactions that occurred during the oxidation of chalcopyrite and pyrite are shown in Table 2, a value of ΔH < 0 indicates that the reaction is exothermic (releases thermal energy), while a value of ΔH > 0 indicates a reaction is endothermic (absorbs thermal energy).
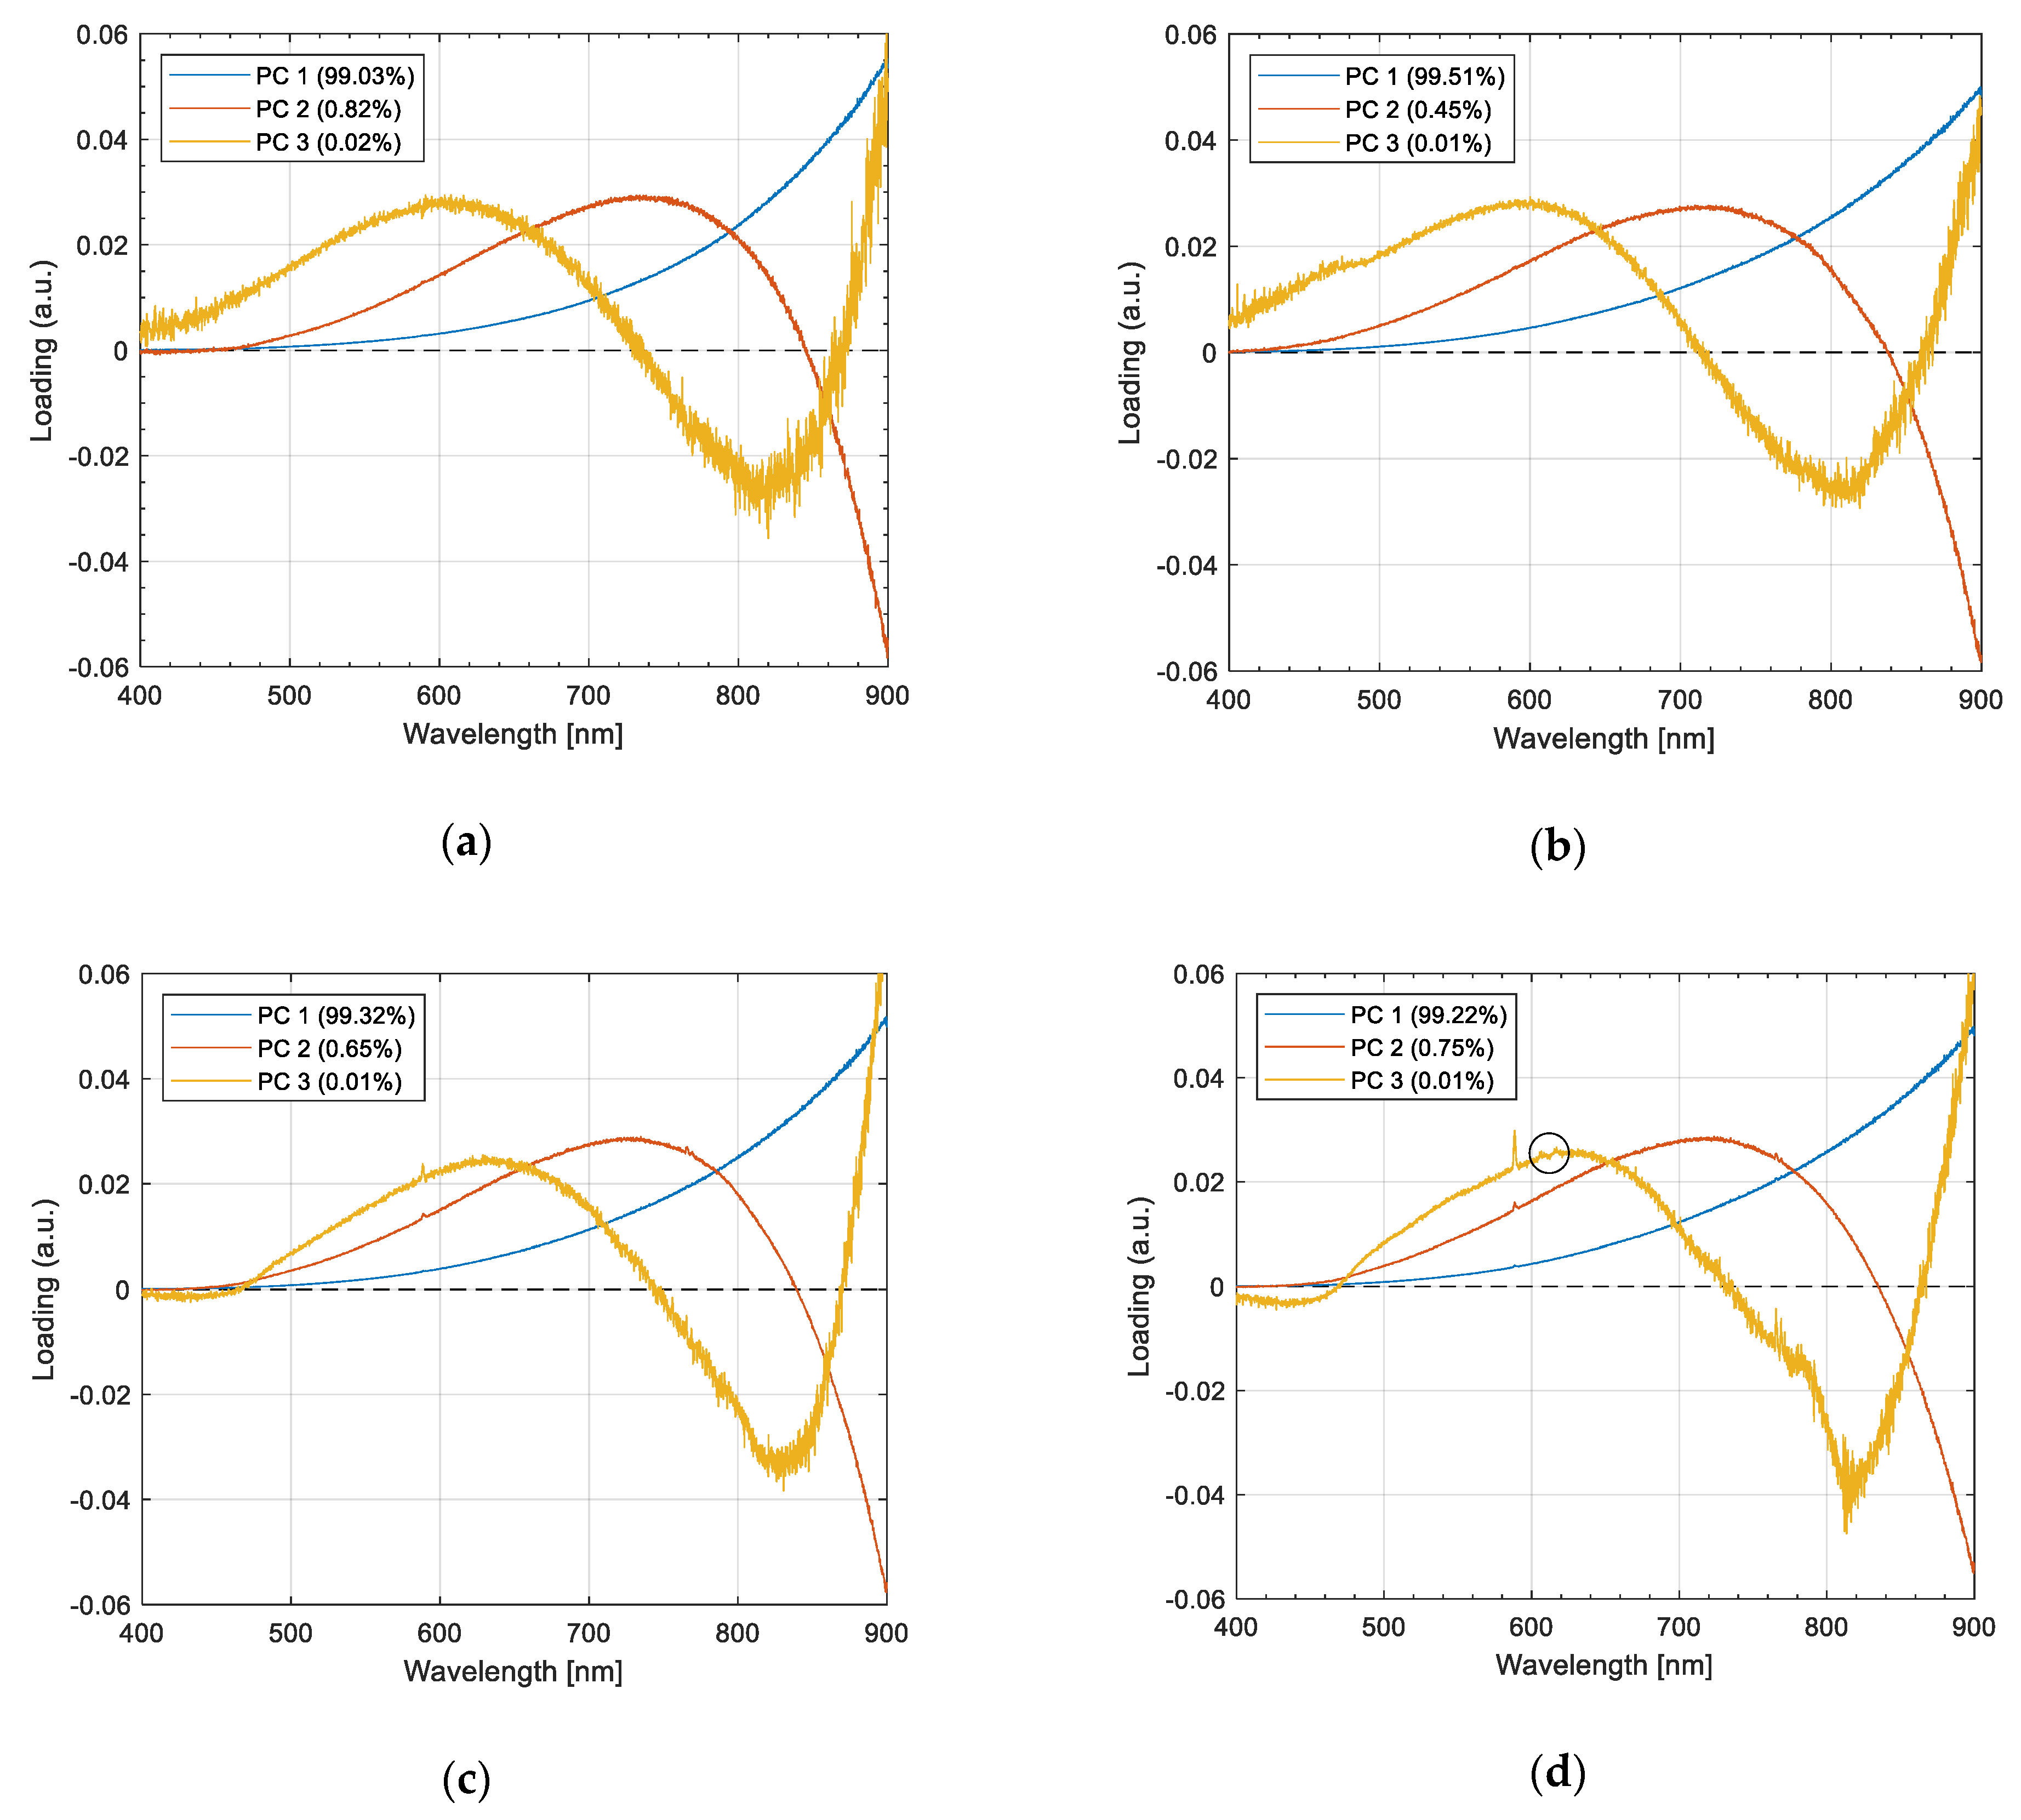
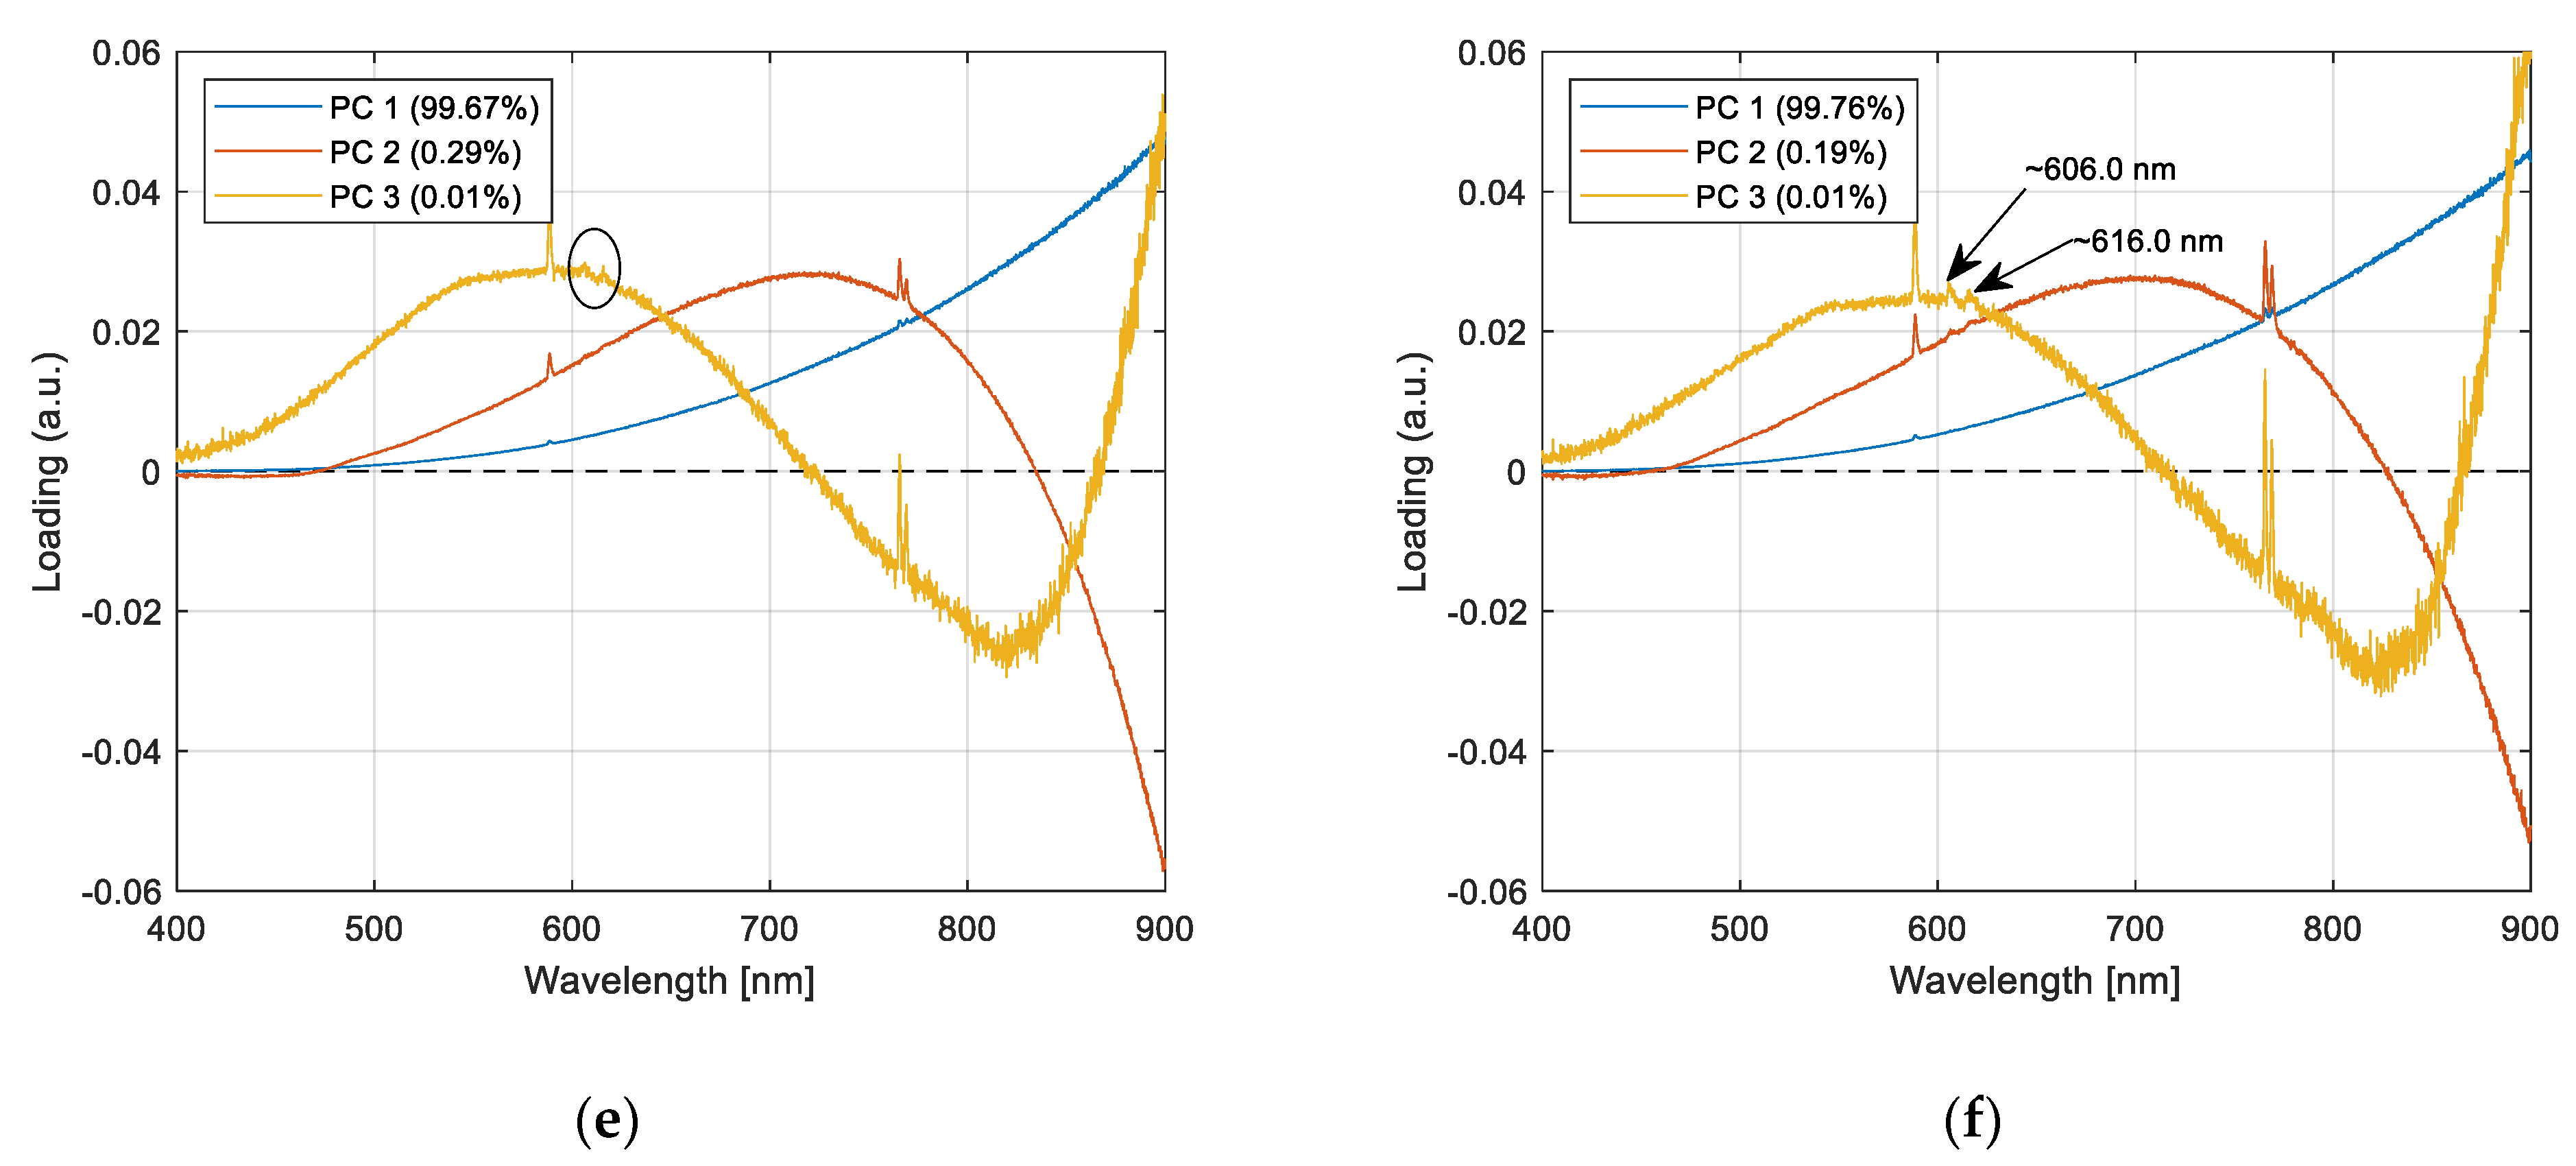
In this work, multivariate techniques were implemented to detect weak spectral emission profiles. The application of PCA and the analysis of loadings of the combustion spectra of chalcopyrite, allowed us to find peaks at 606 and 616 nm, which are associated with copper oxides [19,20]. These peaks were observed slightly from the loading of the PC3 of the CpyD sample, being more visible in the CpyF sample (Figure 4d–f). Moreover, the peaks associated with Na and K emissions were observed, around 589 and 767 nm, respectively.
4.2. Spectral Measurement from Copper Concentrates
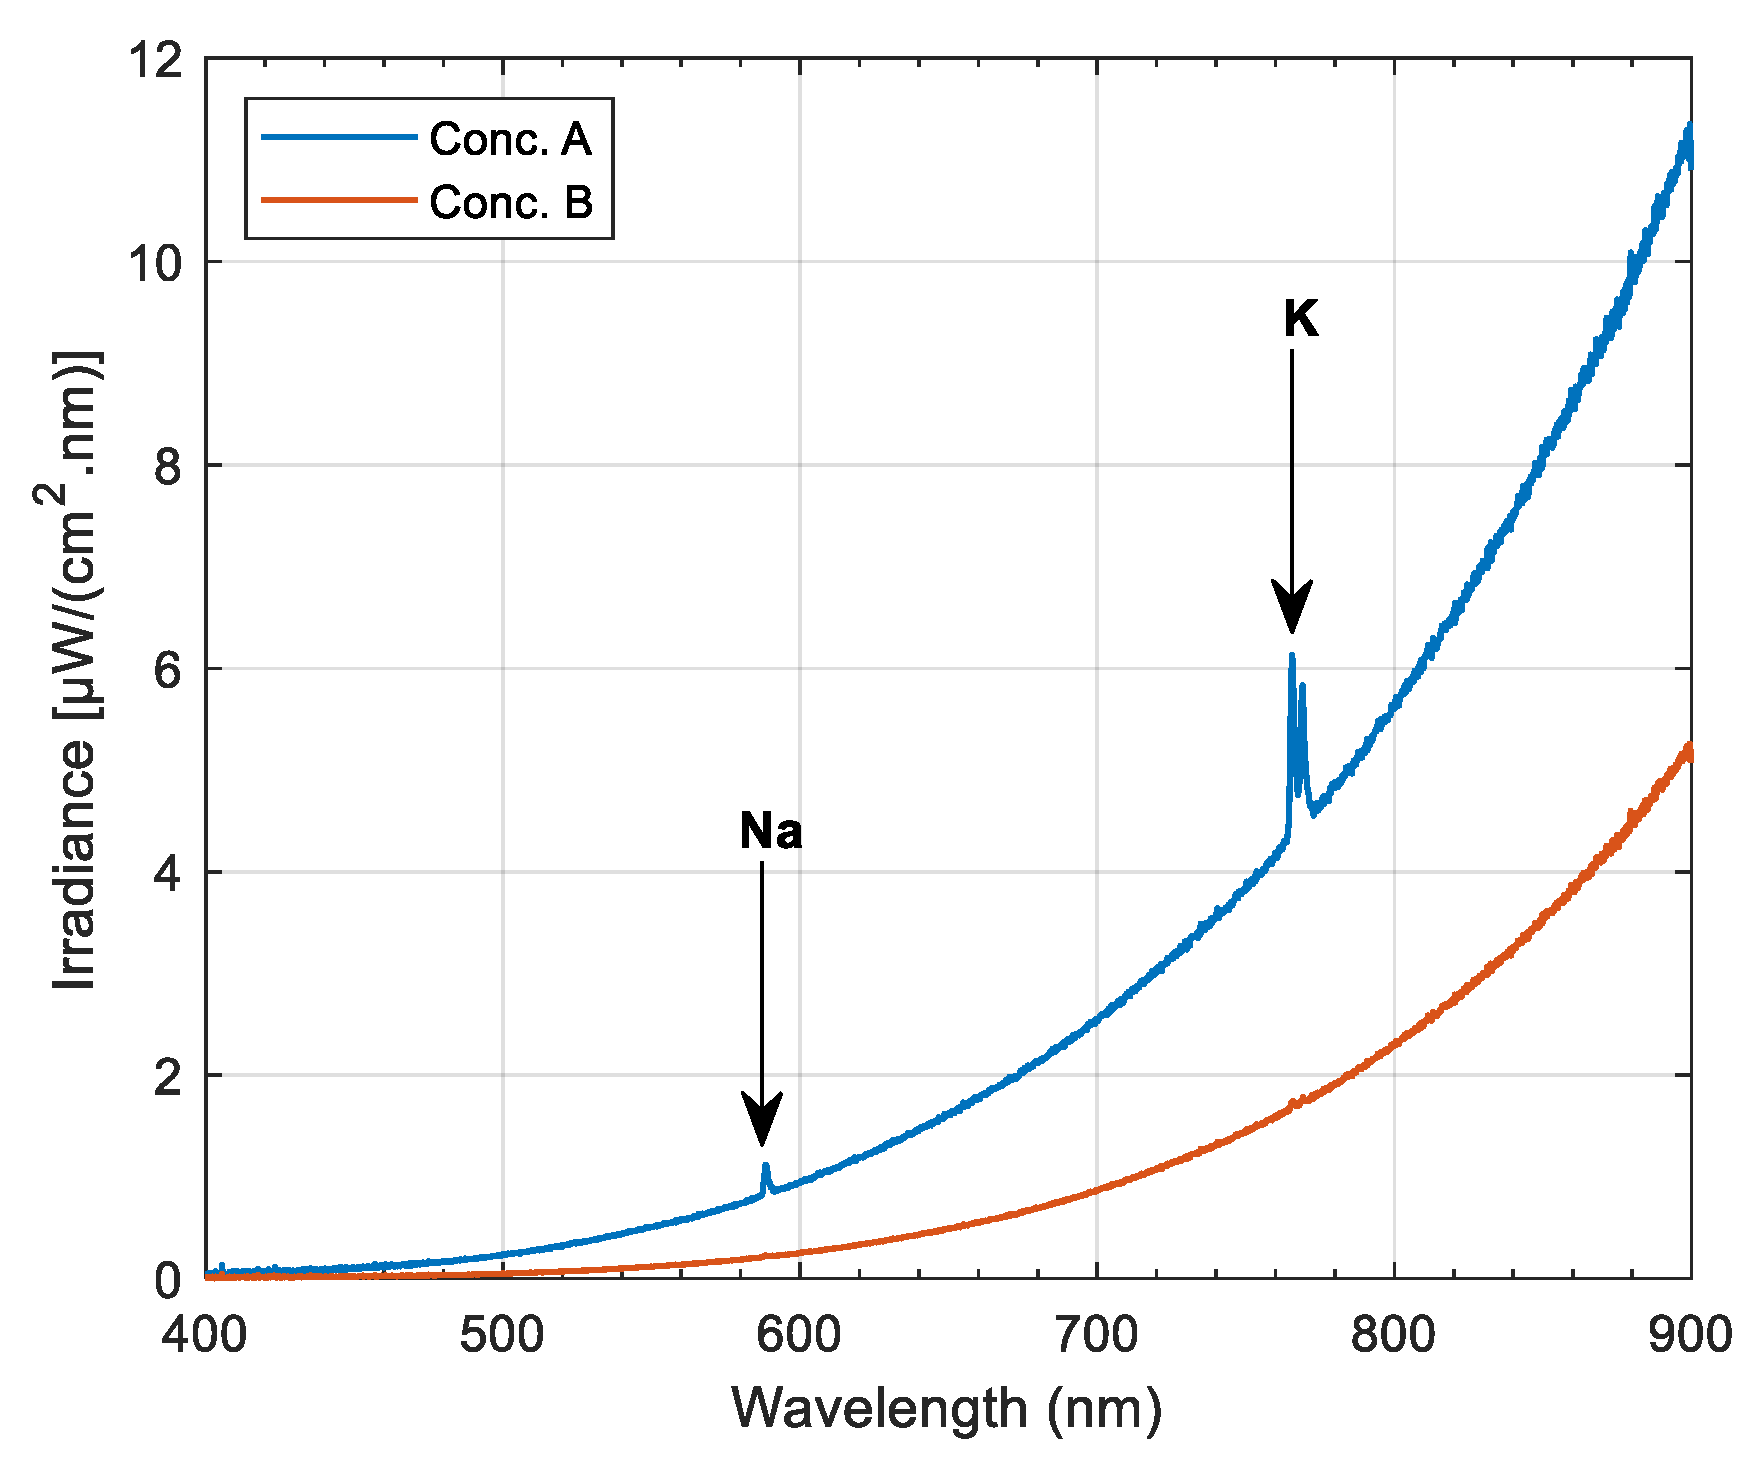
In Figure 5, the average spectral signals of the combustion of copper concentrates are represented. It can be noted that the signal associated with the sample Conc. A presents greater intensity of irradiance compared to the spectral signals of the samples of chalcopyrite and Conc. B. In addition, the spectral lines of emission of Na and K are presented with greater intensity.
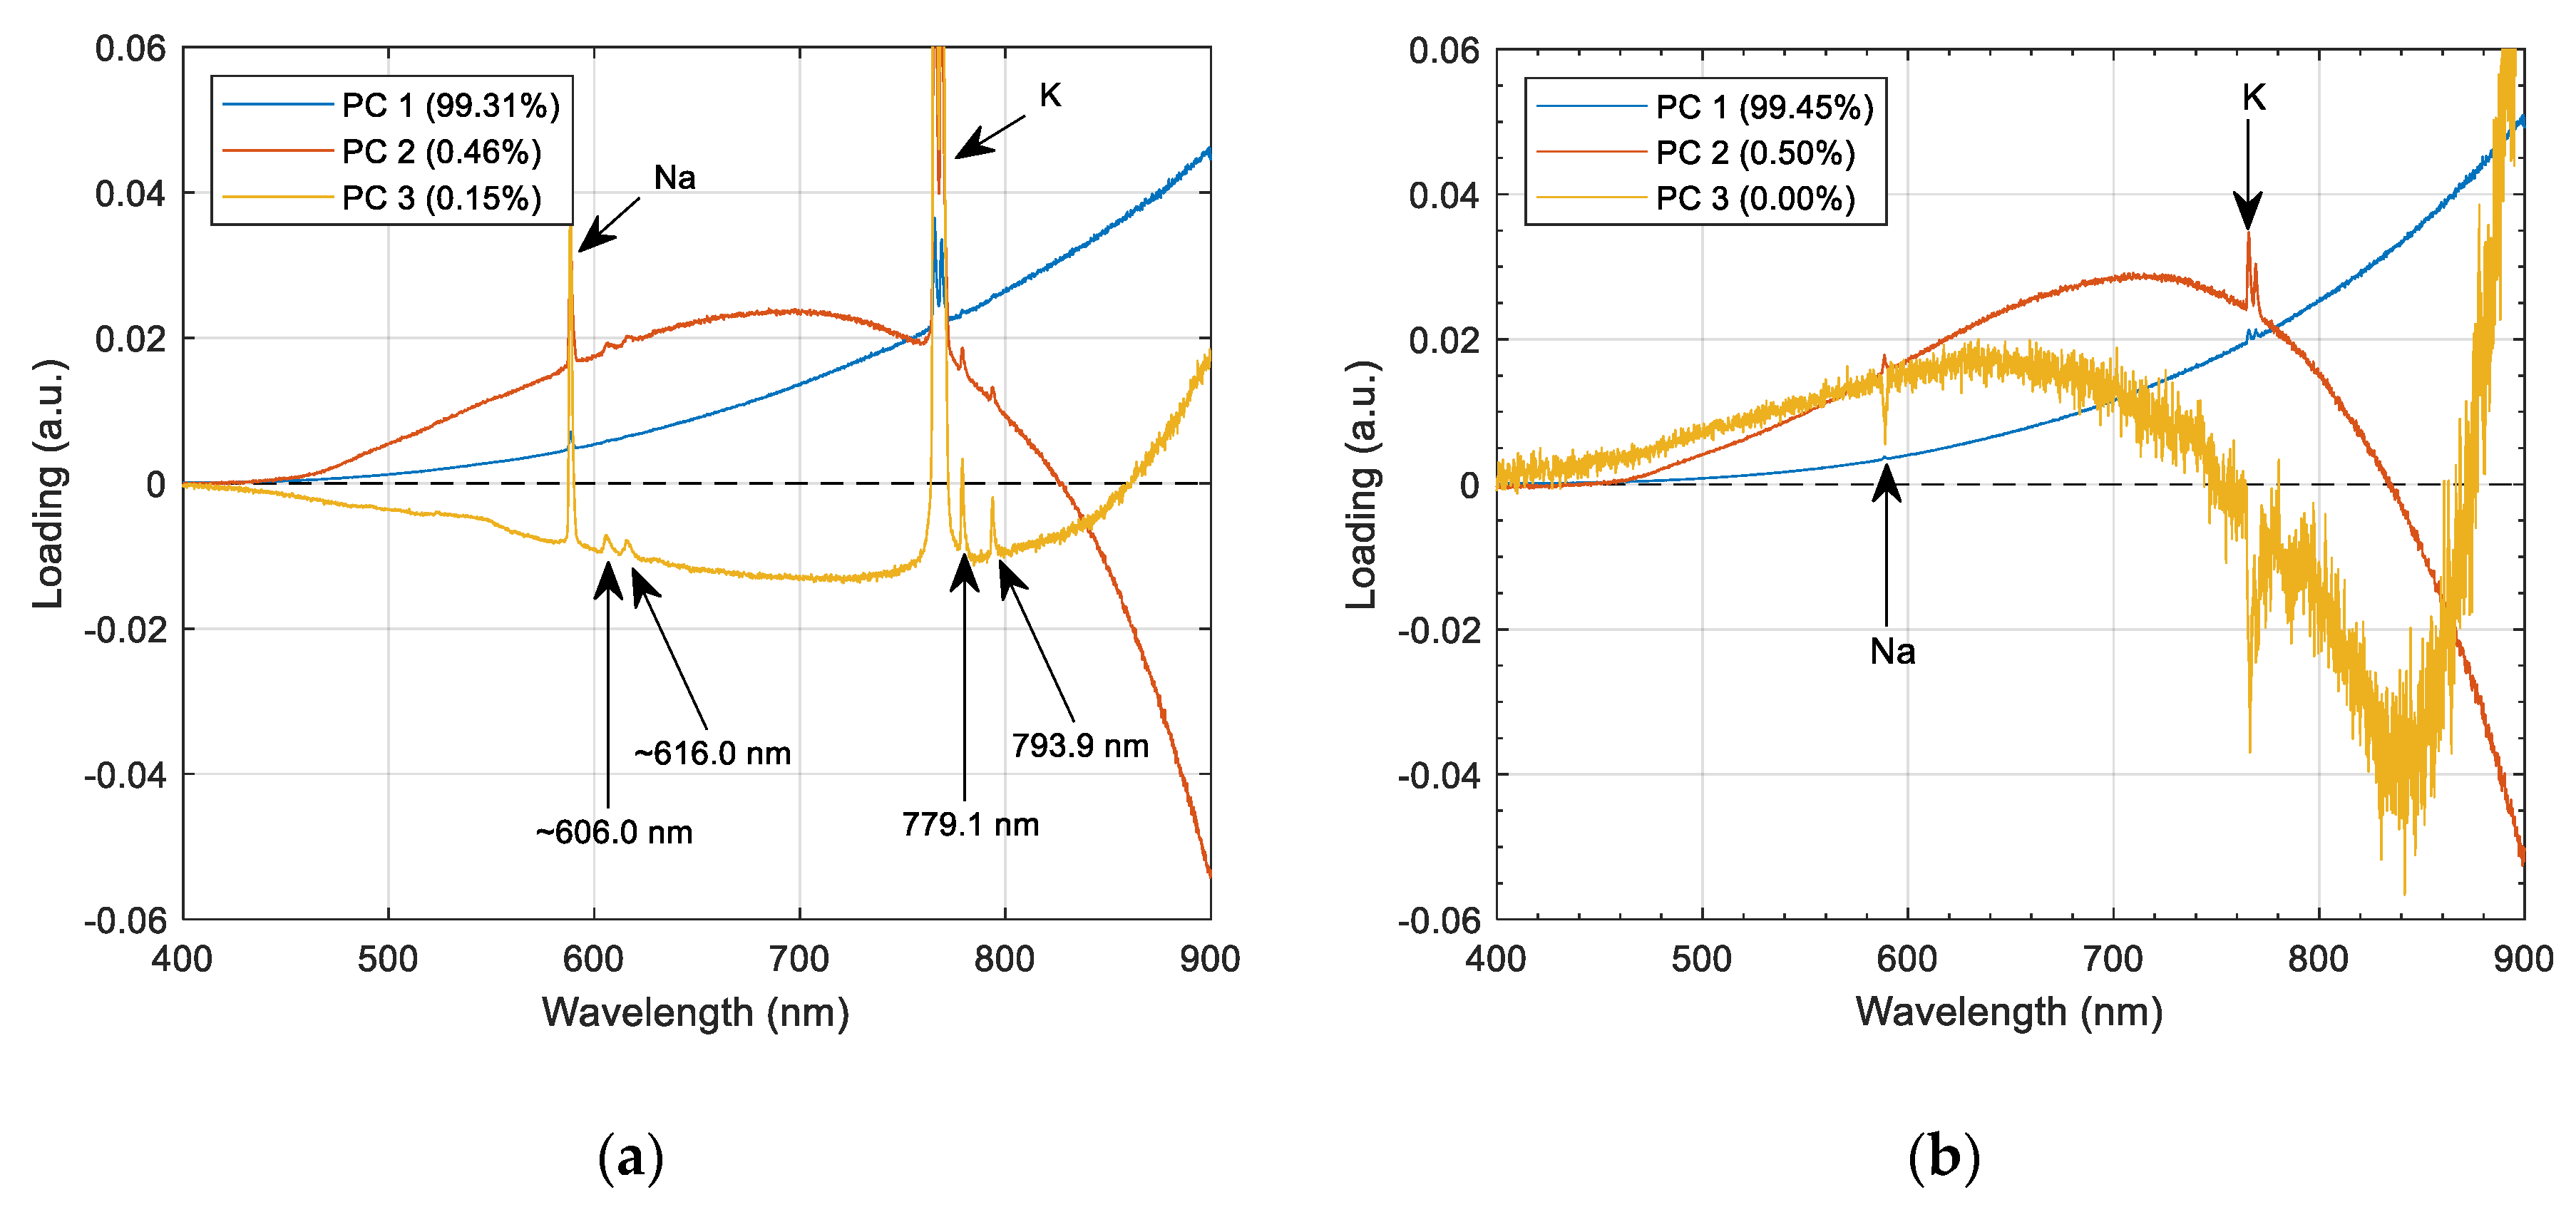
Through exploratory analysis with PCA to each set of spectral data of the concentrates and the subsequent graphic representation of the first three loadings (Figure 6a,b), it is revealed that the emission spectral lines of Conc. A are more intense than those of Conc. B and, in addition, there are certain characteristics at ~606 and ~616 nm that are associated with copper oxides, while close to the potassium emission, two spectral emissions appear at 779.1 and 793.9 nm, the same ones that appear in the pyrite combustion spectral signals reported by Toro et al. [16].
4.3. MCR-ALS Application
From the PCA analysis of the spectral data of chalcopyrite and copper concentrates, the spectral data of CpyF and Conc. A were selected, which have discontinuous sections in which the spectral characteristics are related to copper oxides. The intensity of these spectral characteristics is the result of the temperature reached by the combustion cloud of each sample. Table 3 indicates the average combustion temperatures estimated by two-color pyrometry, and according to [23], a good selection of the sampling wavelengths to apply this method are 650 and 750 nm.
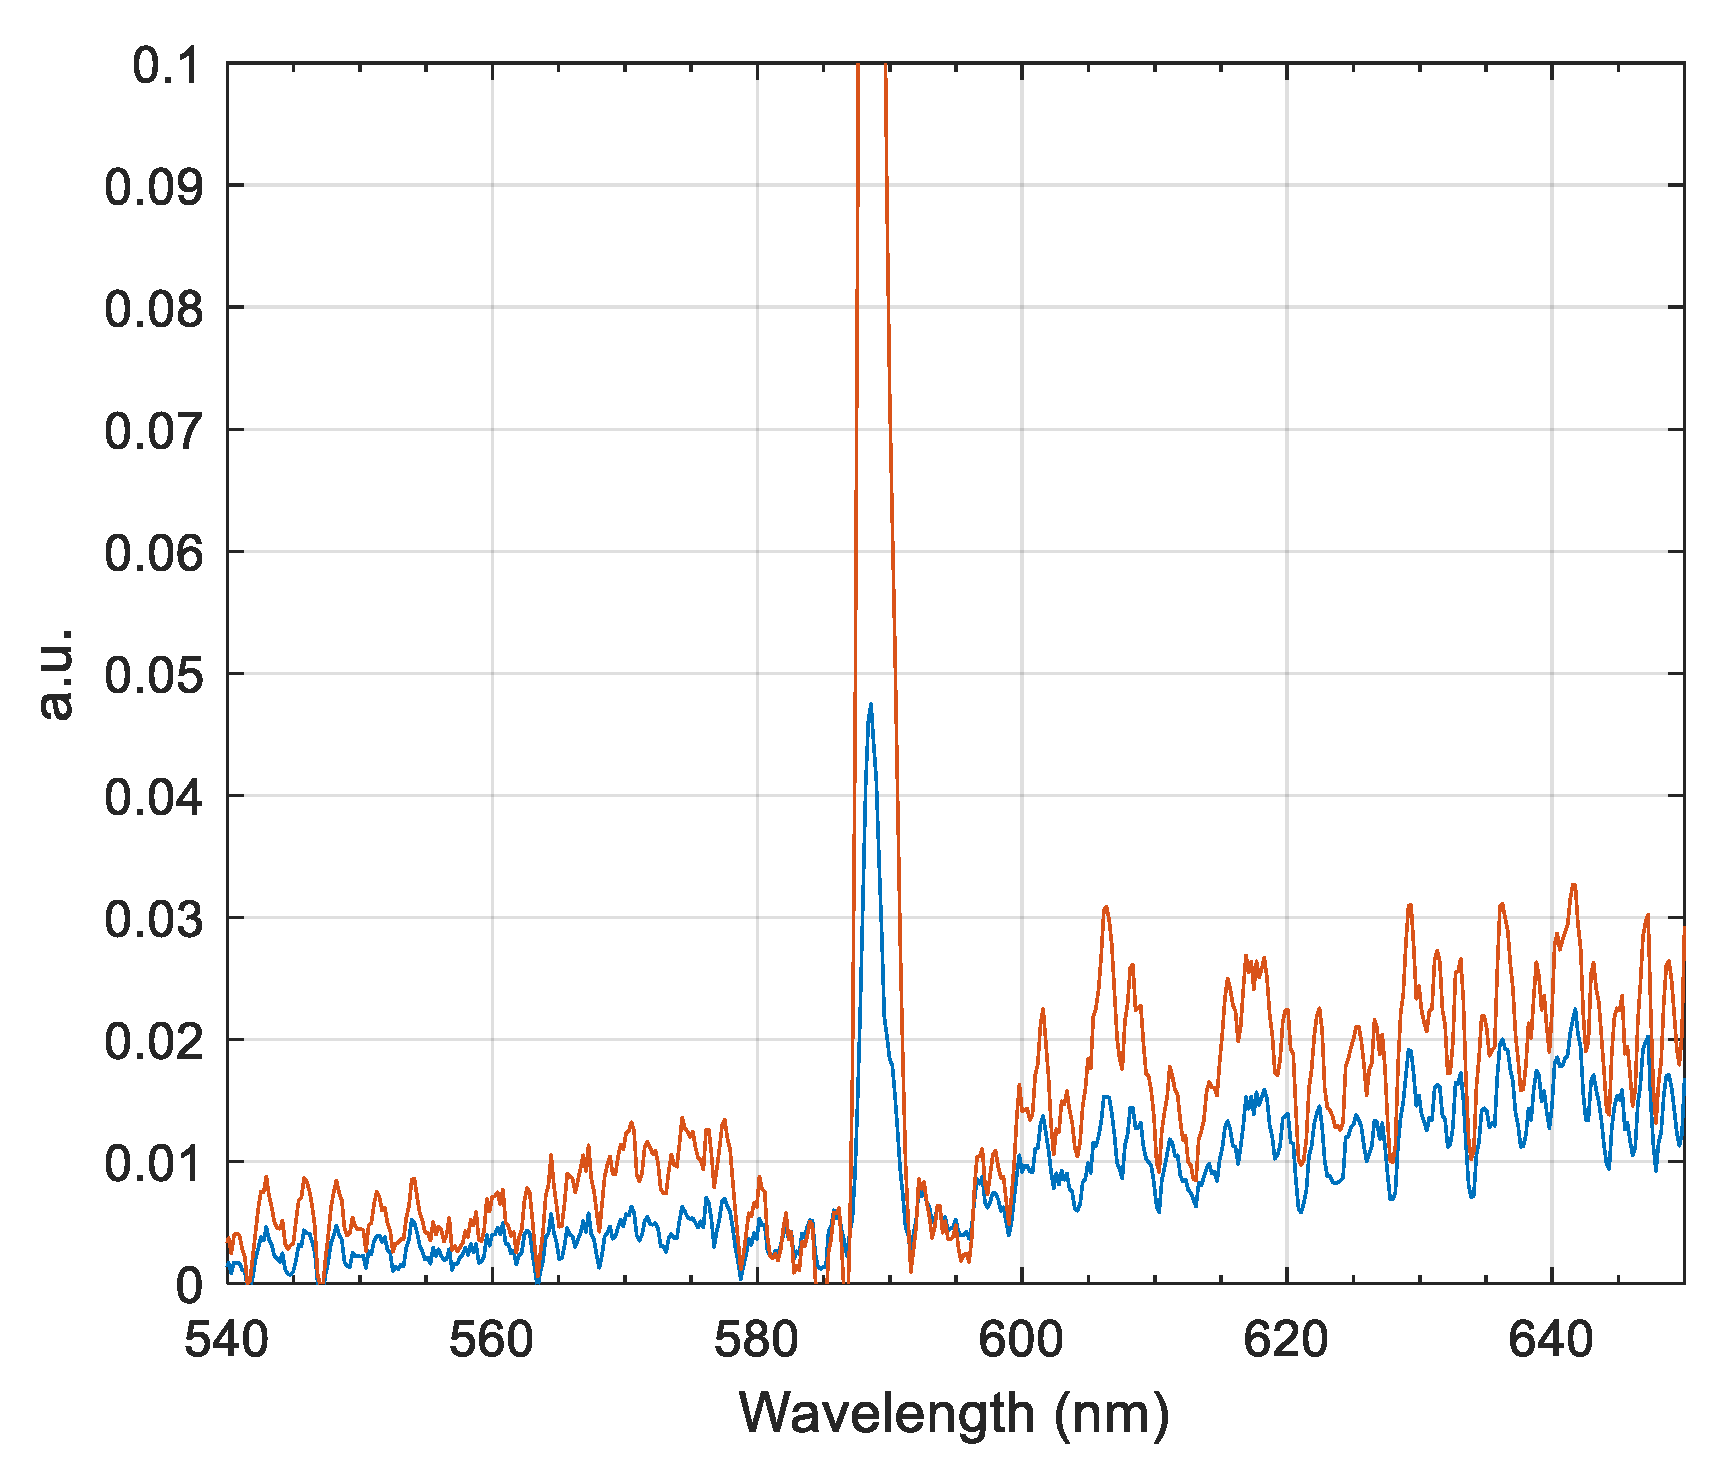
Continuing with the analysis, the airPLS baseline extraction algorithm was applied to the two selected datasets, thereby separating the dataset to extract the continuous and discontinuous emissions. Since the spectral evidence of copper presence is associated with wavelengths of ~606 and ~616 nm, we proceeded to limit the discontinuous section in the spectral range between 540 and 650 nm, while the noise was reduced through the algorithm of Savitzky–Golay (SG) [24]. Figure 7 summarizes the discontinuities profile of CpyF and Conc. A.
Thus, to obtain a spectral profile associated with copper oxides, the spectra of the sample Conc. A were selected because they present greater irradiance intensity.
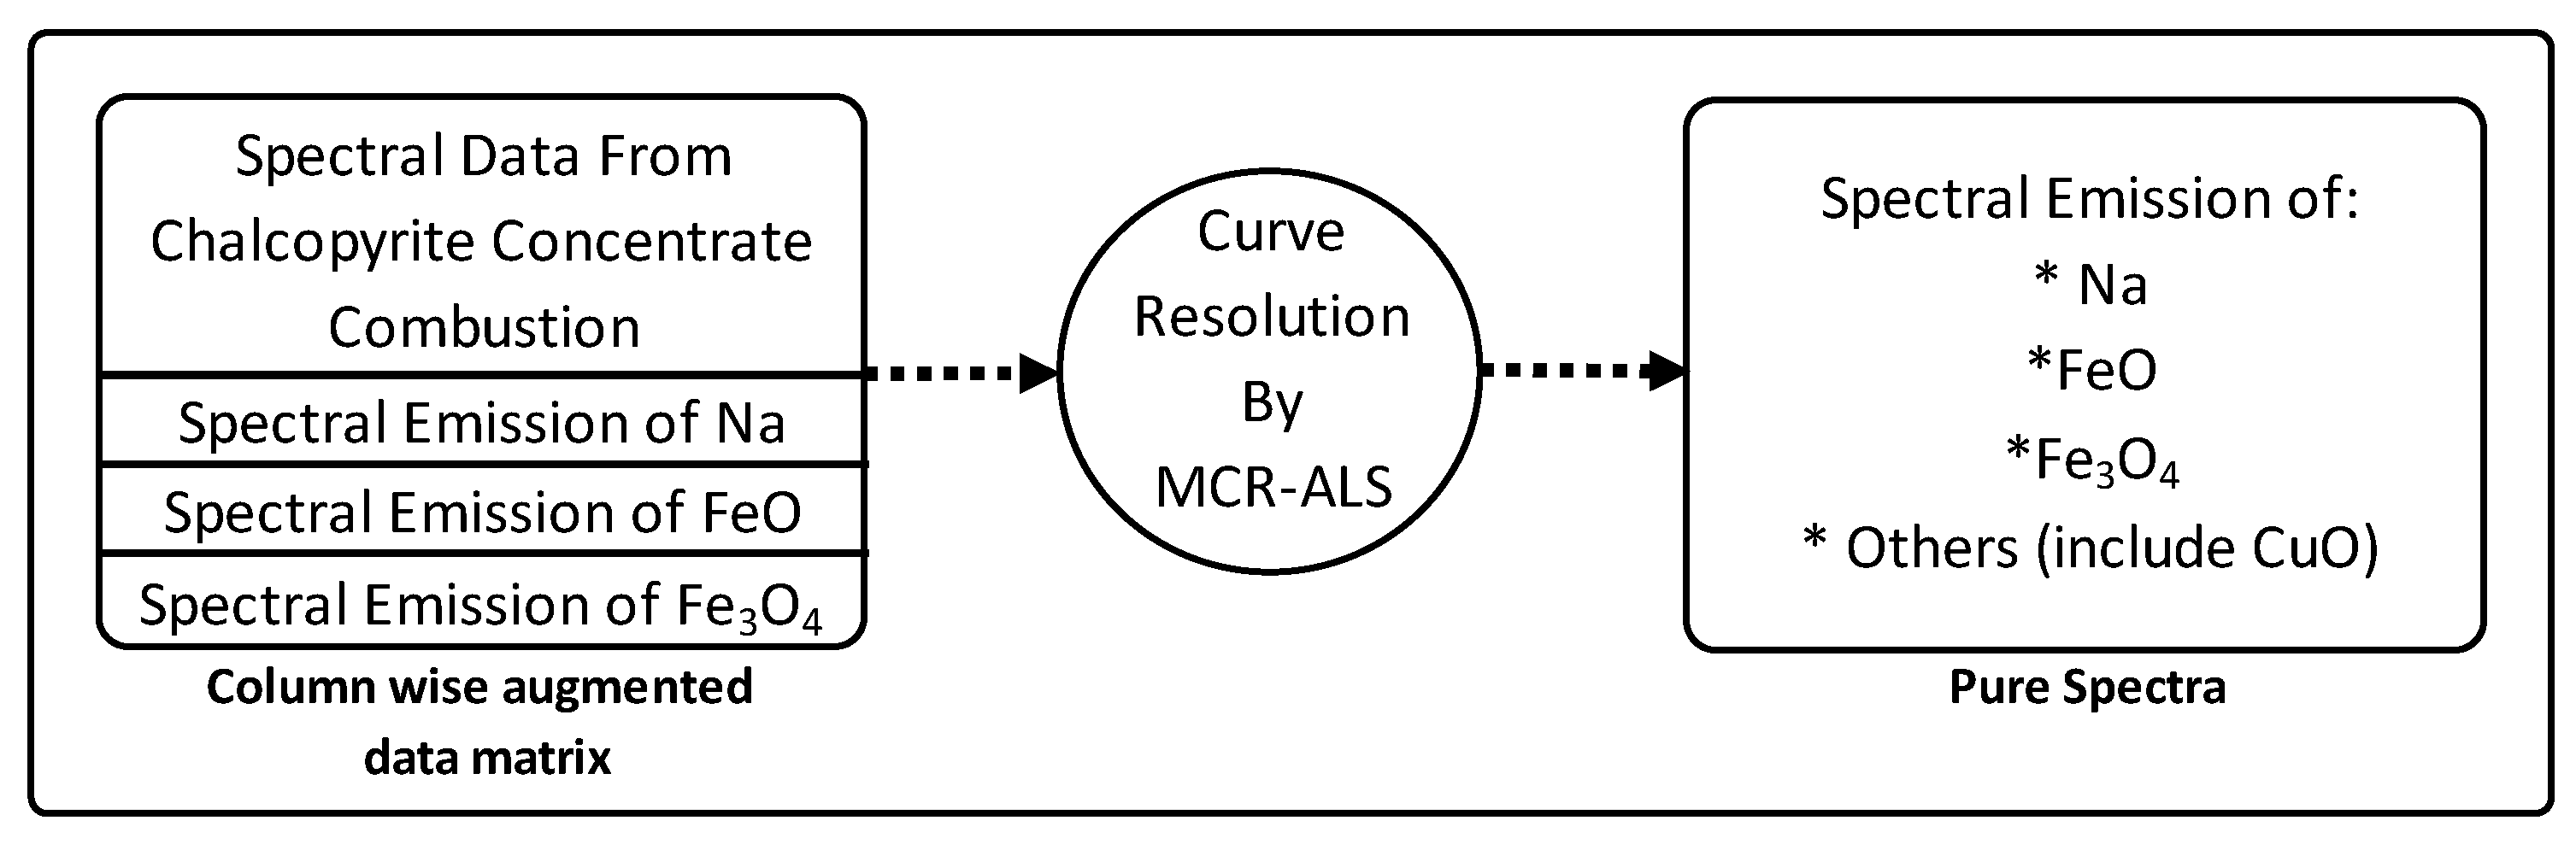
MCR-ALS can perform multiset analysis of data organized in a single matrix [25] and, therefore, for this study, we proceeded to create a matrix in the range of 540 to 650 nm that contains the discontinuous samples of the Conc. A sample and the spectral signals of sodium (Na), FeO, and Fe3O4 were those obtained by Toro et al. [16] (Figure 8). The aim of this was to make the MCR-ALS algorithm separate the signals of the known species (FeO, Fe3O4, and sodium) from those that are not, including the copper oxide profile.
The MCR-ALS method was applied to the new matrix, as detailed in Figure 9, with 10 components and a “non-negativity” restriction on spectral profiles and concentrations.
With these settings on the MCR-ALS GUI, 92.5244% of the data variance and an error of fit (PCA) of 3.0201% were achieved with 70 iterations [25]. As expected, within the 10 obtained profiles were those associated with emissions of sodium (Na), FeO, and Fe3O4, in addition to a profile whose characteristics resemble the profile reported by Knapp, as seen in Figure 10.
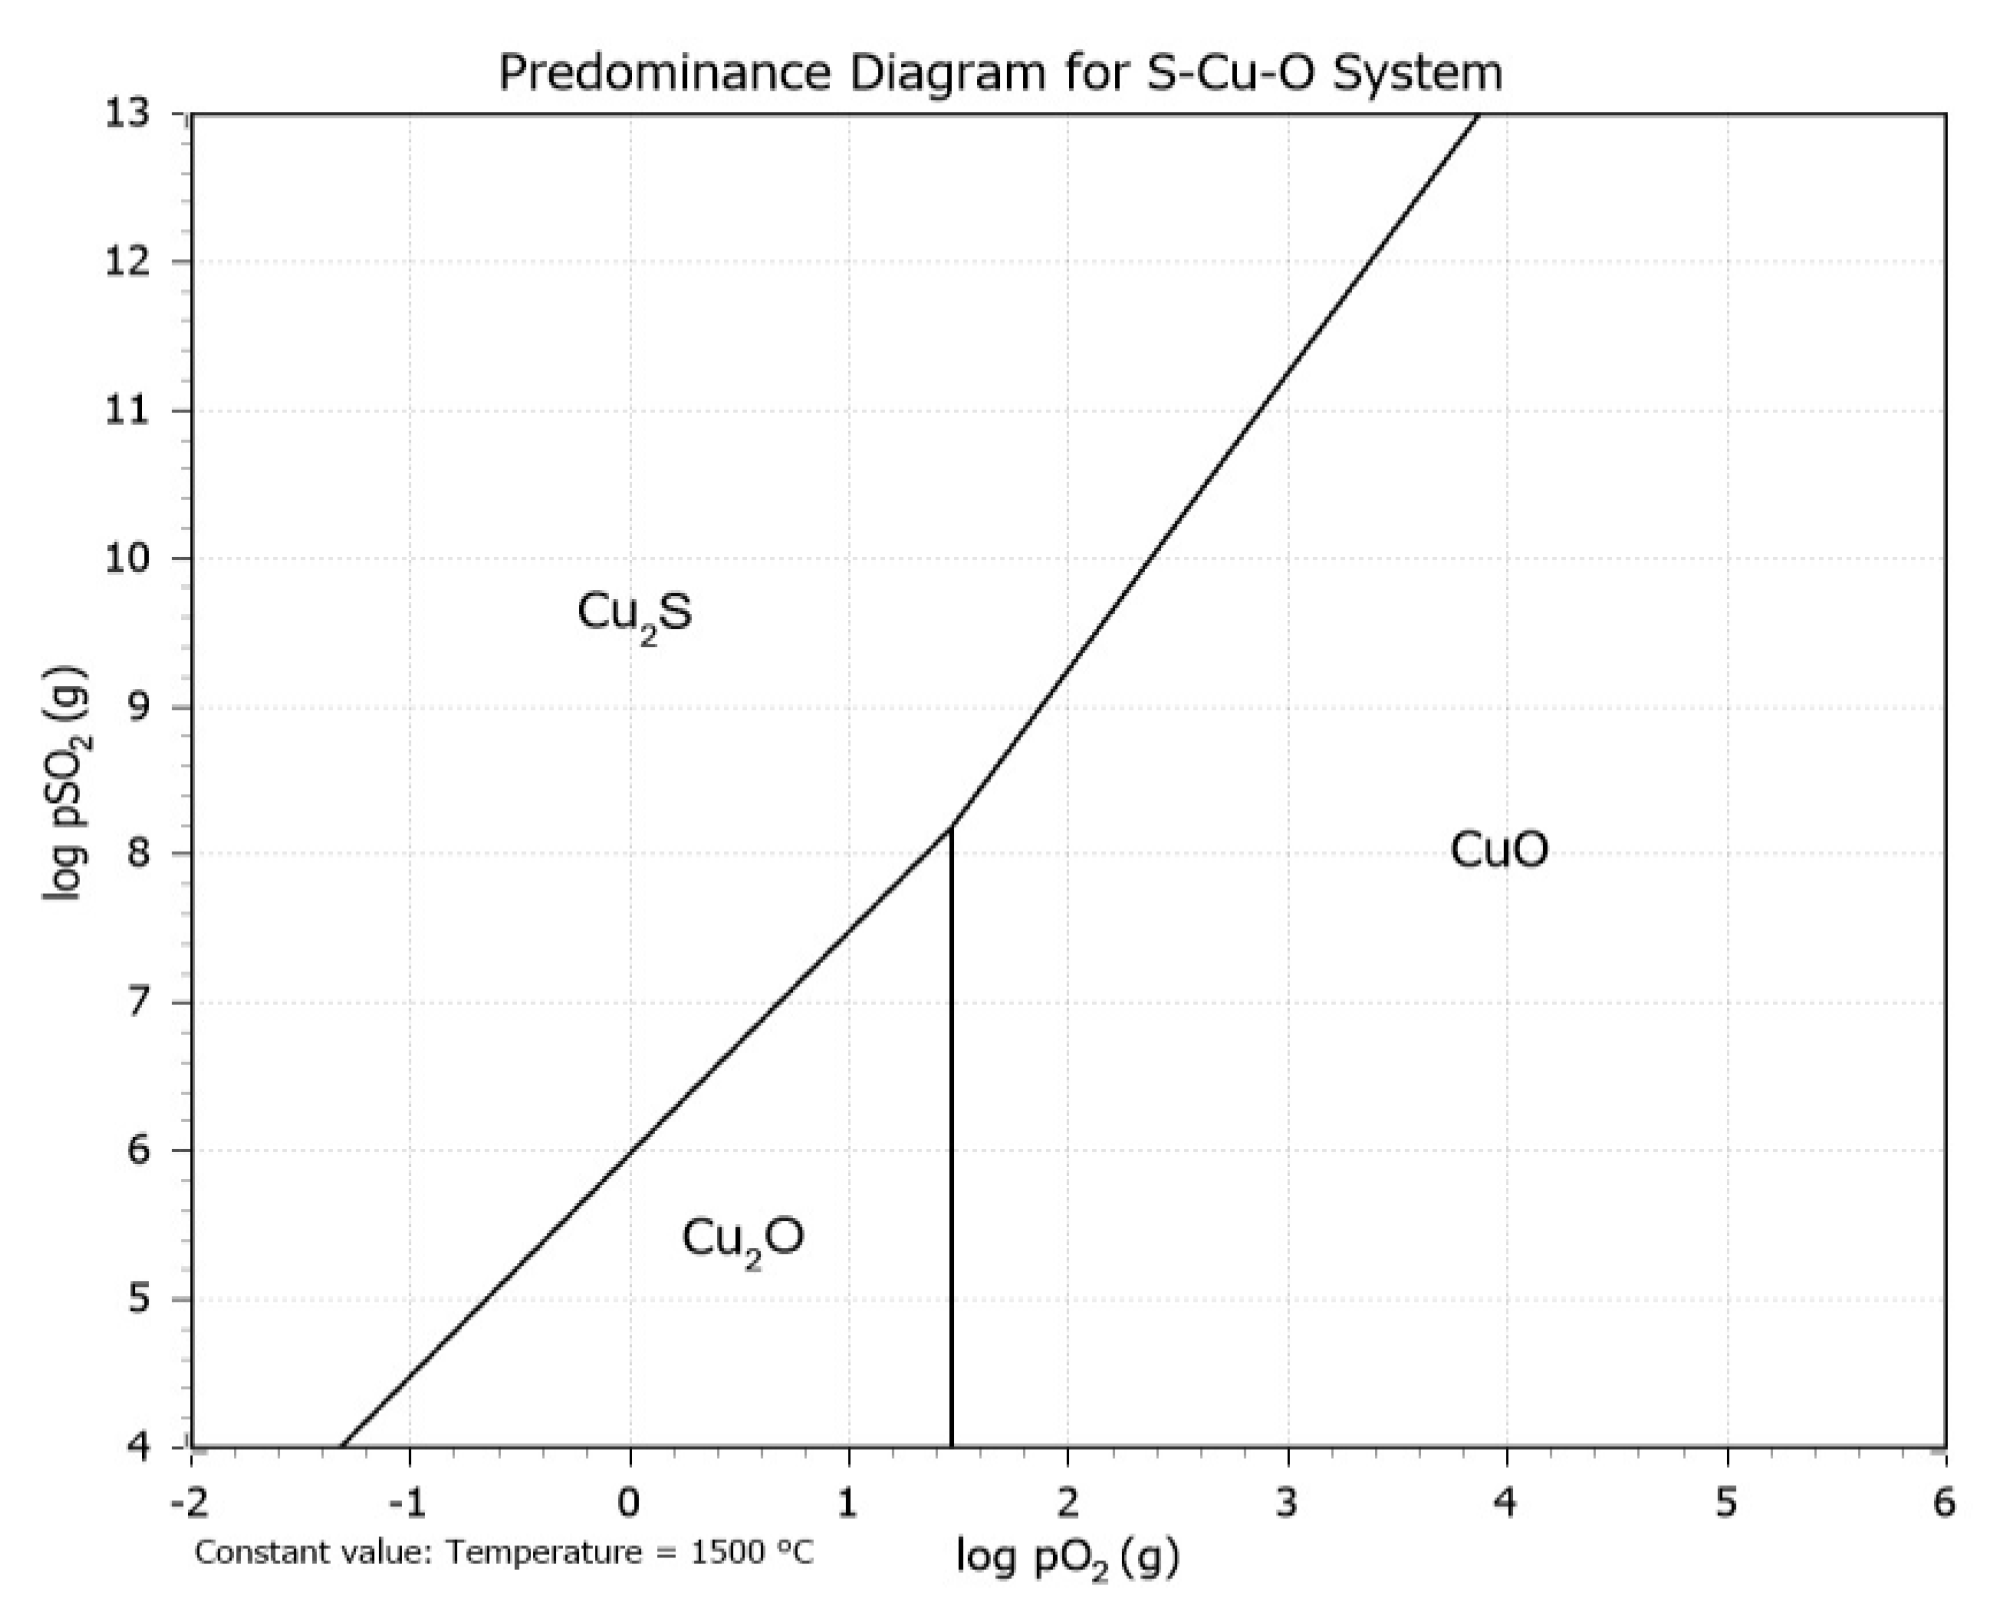
On the other hand, the phase analysis of the calcine of the sample Conc. A is presented in Table 4, a majority composition of Fe and Cu oxides was observed according to what was expected, which was a product of the working conditions. The mineralogical composition of the Conc. A calcine was determined using an integrated automated mineralogy solution, QEMSCAN system (quantitative evaluation of minerals by scanning electron microscopy), produced by the Fei Company (Hillsboro, OR, USA). The Cu2S generated by the decomposition of species such as bornite or chalcopyrite can be oxidized to form CuO or Cu2O. The formation of these copper oxides in the flame follows the following transition Cu2S → Cu2O → CuO, this can be corroborated with the analysis of the stability diagram Cu-S-O in Figure 11.
This small thermodynamic analysis ensures the formation of CuO within the working conditions, so the depicted CuOx emission profile in the combustion spectra of a copper concentrate is effectively the emission profile of copper oxides. The detection of these oxides in the process is important because it will allow having control over copper oxidation in the flame, allowing the operator to adjust process variables preventively. This would avoid greater copper losses in the slag.
5. Conclusions
In this work, a series of multivariate analysis techniques were applied to spectral data obtained during the combustion of chalcopyrite and copper concentrates. The results show that the intensity of the combustion and the spectral characteristics present in the signal depend on the temperature reached by the combustion cloud. The copper concentrates, according to their pyrite content, can reach an intensity such that it allows visualizing some spectral lines, such as those associated with sodium and potassium in the visible range and, even so, the spectral data of all the combustion tests required an exploratory analysis to reveal the presence of spectral lines that are not visible in the average spectrum. The sample that provided the most information on the possible oxidized phases that were generated in the combustion cloud was a high pyrite concentrate sample. The spectral information provided was not only limited to copper oxide emission lines at ~606 and ~616 nm but, instead, there are two emission lines at 779.1 and 793.9 nm that may be associated with iron species, according to some authors. Finally, the application of the MCR-ALS method to a spectral dataset measured from the combustion of a high pyrite concentrate and previous knowledge of spectral bands of Na, FeO, and Fe3O4 patterns allowed us to find a spectral profile associated with copper oxides in the range of 540 and 650 nm.
This research shows that the use of spectral measurement techniques is a powerful tool to relate the spectral emission with physicochemical processes in a combustion flame of copper concentrates. The online and real-time identification of copper oxide formation in a flash furnace flame could be a great advance for the non-ferrous mineral in the pyrometallurgical industry, improving process control by measuring a few process variables such as copper content in mate or slag.
Author Contributions
Conceptualization, W.D., G.R. and C.T.; methodology, W.D., G.R., and C.T.; software, C.T.; validation, W.D., C.T.; formal analysis, W.D., G.R., C.T., and S.T.; investigation, W.D. and G.R.; resources, R.P., E.B. and S.T.; data curation, W.D.; writing—original draft preparation, W.D. and G.R.; writing—review and editing, C.T. and A.V.; visualization, W.D.; supervision, C.T., S.T., E.B. and R.P.; project administration, E.B.; funding acquisition, E.B. All authors have read and agreed to the published version of the manuscript.
Funding
This research was funded by the CONICYT, Anillo Minería ACM170008, and by Fondef IT under Grant Number 16M10029.
Institutional Review Board Statement
Not Applicable.
Informed Consent Statement
Not Applicable.
Data Availability Statement
Data is contained within the article.
Acknowledgments
We thank the Metallurgical Engineering Department at the University of Concepción for giving us access to their facilities, allowing us to conduct the experiments reported in this work.
Conflicts of Interest
The authors declare no conflict of interest. The funders had no role in the design of the study; in the collection, analyses, or interpretation of data; in the writing of the manuscript; n\or in the decision to publish the results.
References
- Bacedoni, M.; Moreno-Ventas, I.; Ríos, G. Copper Flash Smelting Process Balance Modeling. Metals 2020, 10, 1229. [Google Scholar] [CrossRef]
- Sarkikoski, T. A Flash of Knowledge How an Outokumpu Innovation Became a Culture, 1st ed.; Outokumpu Oyj: Espoo, Finland, 1999; ISBN 978-952-9507-07-8. [Google Scholar]
- Jiang, K.; Li, L.; Feng, Y. The Development of China’s Copper Primary Smelting Technology. In T.T. Chen Honorary Symposium on Hydrometallurgy, Electrometallurgy and Materials Characterization; John Wiley & Sons, Inc.: Hoboken, NJ, USA, 2012; pp. 165–176. [Google Scholar]
- Coursol, P.; Mackey, P.J.; Kapusta, J.P.T. Energy Consumption in Copper Smelting: A New Asian Horse in the Race. JOM 2015, 67, 1066–1074. [Google Scholar] [CrossRef]
- Jorgensen, F.R.A. Combustion of Pyrite Concentrate under Simulated Flash-Smelting Conditions. Trans. Inst. Min. Metall. 1981, 90, C1–C9. [Google Scholar]
- Tuffrey, N.E.; Richards, G.G.; Brimacombe, J.K. Two-Wavelength Pyrometry Study of the Combustion of Sulfide Minerals: Part I. Apparatus and General Observations. Metall. Mater. Trans. B 1995, 26, 929–942. [Google Scholar] [CrossRef]
- Morgan, G.J.; Brimacombe, J.K. Kinetics of the Flash Converting of MK (Chalcocite) Concentrate. Met. Materi Trans B 1996, 27, 163–175. [Google Scholar] [CrossRef]
- Vaarno, J.; Järvi, J.; Ahokainen, T.; Laurila, T.; Taskinen, P. Development of a Mathematical Model of Flash Smelting and Converting Processes. In Proceedings of the Third Internatianal Conference on CFD in the Minerals and Process Industries, Melbourne, Australia, 10–12 December 2003. [Google Scholar]
- Laurila, T.; Hernberg, R.; Oikari, R.; Joutsenoja, T.; Mikkola, P.; Ranki-Kilpinen, T.; Taskinen, P. Pyrometric Temperature and Size Measurements of Chalcopyrite Particles during Flash Oxidation in a Laminar Flow Reactor. Met. Materi Trans B 2005, 36, 201–208. [Google Scholar] [CrossRef]
- Wilkomirsky, I.; Otero, A.; Balladares, E. Kinetics and Reaction Mechanisms of High-Temperature Flash Oxidation of Molybdenite. Metall. Mater. Trans. B 2010, 41B, 63–73. [Google Scholar] [CrossRef]
- Parra-Figueroa, R.A.; Parra-Sanchez, V.R.; Balladares-Varela, E.R.; Loeza-Arqueros, C.A.; Villagrán-Flores, C.M.; Pérez, M.; Torres, S.N.; Arias, L.E.; Sbárbaro, D. Online Temperature Measurements during Copper Concentrate Flash Combustion at Laboratory Scale by a Spectral Technique. In Proceedings of the Copper 2016, Kobe, Japan, 13–16 November 2016; p. 12. [Google Scholar]
- Arias, L.; Torres, S.; Toro, C.; Balladares, E.; Parra, R.; Loeza, C.; Villagrán, C.; Coelho, P. Flash Smelting Copper Concentrates Spectral Emission Measurements. Sensors 2018, 18, 2009. [Google Scholar] [CrossRef] [PubMed] [Green Version]
- Sun, Y.; Lou, C.; Zhou, H. A Simple Judgment Method of Gray Property of Flames Based on Spectral Analysis and the Two-Color Method for Measurements of Temperatures and Emissivity. Proc. Combust. Inst. 2011, 33, 735–741. [Google Scholar] [CrossRef]
- Marín, M.; Toro, C.; Arias, L.; Balladares, E. Estimation of Spectral Emissivity and S/Cu Ratio From Emissions of Copper Concentrates at the Flash Smelting Process. IEEE Access 2019, 7, 103346–103353. [Google Scholar] [CrossRef]
- Díaz, W.; Toro, C.; Balladares, E.; Parra, V.; Coelho, P.; Reyes, G.; Parra, R. Spectral Characterization of Copper and Iron Sulfide Combustion: A Multivariate Data Analysis Approach for Mineral Identification on the Blend. Metals 2019, 9, 1017. [Google Scholar] [CrossRef] [Green Version]
- Toro, C.; Torres, S.; Parra, V.; Fuentes, R.; Castillo, R.; Díaz, W.; Reyes, G.; Balladares, E.; Parra, R. On the Detection of Spectral Emissions of Iron Oxides in Combustion Experiments of Pyrite Concentrates. Sensors 2020, 20, 1284. [Google Scholar] [CrossRef] [Green Version]
- West, J.B.; Broida, H.P. Chemiluminescence and Photoluminescence of Diatomic Iron Oxide. J. Chem. Phys. 1975, 62, 2566–2574. [Google Scholar] [CrossRef]
- Lynch, P.; Krier, H.; Glumac, N. Emissivity of Aluminum-Oxide Particle Clouds: Application to Pyrometry of Explosive Fireballs. J. Thermophys. Heat Transf. 2010, 24, 301–308. [Google Scholar] [CrossRef]
- Gole, J.L. Toward the Modeling of the Oxidation of Small Metal and Metalloid Molecules. In Gas Phase Metal Reactions; Elsevier: Amsterdam, The Netherlands, 1992; pp. 573–604. ISBN 978-0-444-89070-2. [Google Scholar]
- Knapp, S.; Kelzenberg, S.; Raab, A.; Roth, E.; Weiser, V. Emission Spectroscopy of the Combustion Flame of Aluminium/Copper Oxide Thermite. Propellants Explos. Pyrotech. 2019, 44, 9–17. [Google Scholar] [CrossRef] [Green Version]
- Holst, G.C. CCD Arrays, Cameras, and Displays; JCD Pub; SPIE Optical Engineering: Winter Park, FL, USA; Bellingham, DC, USA, 1998; ISBN 978-0-9640000-4-9. [Google Scholar]
- Zhang, Z.-M.; Chen, S.; Liang, Y.-Z. Baseline Correction Using Adaptive Iteratively Reweighted Penalized Least Squares. Analyst 2010, 135, 1138–1146. [Google Scholar] [CrossRef] [PubMed]
- Toro, C.; Arias, L.; Torres, S.; Sbarbaro, D. Flame Spectra-Temperature Estimation Based on a Color Imaging Camera and a Spectral Reconstruction Technique. Appl. Opt. 2014, 53, 6351–6361. [Google Scholar] [CrossRef] [PubMed]
- Rinnan, Å.; van den Berg, F.; Engelsen, S.B. Review of the Most Common Pre-Processing Techniques for near-Infrared Spectra. TrAC Trends Anal. Chem. 2009, 28, 1201–1222. [Google Scholar] [CrossRef]
- Jaumot, J.; de Juan, A.; Tauler, R. MCR-ALS GUI 2.0: New Features and Applications. Chemom. Intell. Lab. Syst. 2015, 140, 1–12. [Google Scholar] [CrossRef]
Figure 1.
(a) Experimental setup [15] and (b) schematic diagram.
Figure 1.
(a) Experimental setup [15] and (b) schematic diagram.

Figure 2.
Data acquisition and analysis pipeline. (a) Spectral data acquisition and preprocessing. (b) Principal component analysis (PCA) features extraction. (c) Multivariate curve resolution method alternate least squares (MCR-ALS) application for separation of pure spectral signals. Note that the depicted combustion image is only for visualization purposes, and the optical fiber is located at the central centered position.

Figure 3.
Average emission spectrum of chalcopyrite combustion at different sizes.

Figure 4.
PCA analysis on the combustion spectrum of chalcopyrite of different sizes. (a) CpyA, (b) CpyB, (c) CpyC, (d) CpyD, (e) CpyE, (f) CpyF.
Figure 4.
PCA analysis on the combustion spectrum of chalcopyrite of different sizes. (a) CpyA, (b) CpyB, (c) CpyC, (d) CpyD, (e) CpyE, (f) CpyF.


Figure 5.
Average emission spectrum from the combustion of copper concentrates.

Figure 6.
PCA loadings of the (a) Conc. A and (b) Conc. B average emission spectrum.

Figure 7.
Discontinuities profile of Conc. A (orange) and CpyF (blue).

Figure 8.
Spectral profiles (a) associated with sodium and (b) associated with FeO and Fe3O4 [16].
Figure 8.
Spectral profiles (a) associated with sodium and (b) associated with FeO and Fe3O4 [16].

Figure 9.
Data processing schemes using MCR-ALS.

Figure 10.
Spectral emission measurements obtained via MCR-ALS and reference spectral characteristics.
Figure 10.
Spectral emission measurements obtained via MCR-ALS and reference spectral characteristics.

Figure 11.
Cu-O-S stability diagram at 1500 °C constructed with HSC® software.


Table 1.
Copper concentrate mineralogical composition.
| Mineral | Conc. A (wt %) | Conc. B (wt %) |
|---|---|---|
| CuFeS2 | 32.71 | 66.7 |
| FeS2 | 45.52 | 16.52 |
| Cu5FeS4 | 3.23 | 8.35 |
| CuS | 0.85 | 0.45 |
| Others | 17.69 | 7.98 |
Table 2.
Typical reactions during chalcopyrite and pyrite combustion 1.
| Reactions | |
|---|---|
| 12.19 | |
| 34.79 | |
| −26.36 | |
| −136.46 | |
| −40.82 | |
| −172.52 |
1 Values are calculated with HSC Chemistry®.
Table 3.
Average estimated temperatures of the combustion flames.
| Sample | Temperature (°C) |
|---|---|
| CpyA | 1002.5 |
| CpyB | 1047.2 |
| CpyC | 1061.5 |
| CpyD | 1109.5 |
| CpyE | 1160.2 |
| CpyF | 1310.9 |
| Conc. A | 1485.2 |
| Conc. B | 1316.8 |
Table 4.
Calcine of the sample Conc. A mineralogical composition.
| Minerals | wt % |
|---|---|
| Fe2O3/Fe3O4 | 29.87 |
| FeS2 | 1.09 |
| CuS | 0.84 |
| CuO/Cu2O | 39.30 |
| CuFeS2 | 0.11 |
| FeS | 0.79 |
| Cu2S | 2.30 |
| Cu5FeS4 | 0.95 |
| SiO2 | 4.32 |
| FeO | 6.96 |
Publisher’s Note: MDPI stays neutral with regard to jurisdictional claims in published maps and institutional affiliations. |
© 2021 by the authors. Licensee MDPI, Basel, Switzerland. This article is an open access article distributed under the terms and conditions of the Creative Commons Attribution (CC BY) license (http://creativecommons.org/licenses/by/4.0/).
Share and Cite
MDPI and ACS Style
Reyes, G.; Diaz, W.; Toro, C.; Balladares, E.; Torres, S.; Parra, R.; Vásquez, A. Copper Oxide Spectral Emission Detection in Chalcopyrite and Copper Concentrate Combustion. Processes 2021, 9, 188. https://doi.org/10.3390/pr9020188
AMA Style
Reyes G, Diaz W, Toro C, Balladares E, Torres S, Parra R, Vásquez A. Copper Oxide Spectral Emission Detection in Chalcopyrite and Copper Concentrate Combustion. Processes. 2021; 9(2):188. https://doi.org/10.3390/pr9020188
Chicago/Turabian StyleReyes, Gonzalo, Walter Diaz, Carlos Toro, Eduardo Balladares, Sergio Torres, Roberto Parra, and Alejandro Vásquez. 2021. "Copper Oxide Spectral Emission Detection in Chalcopyrite and Copper Concentrate Combustion" Processes 9, no. 2: 188. https://doi.org/10.3390/pr9020188
Note that from the first issue of 2016, this journal uses article numbers instead of page numbers. See further details here.