Mesophilic Anaerobic Digestion of Hydrothermally Pretreated Lignocellulosic Biomass (Norway Spruce (Picea abies))


Department of Process, Energy and Environmental Technology, University of South-Eastern Norway, Kjølnes Ring 56, N-3918 Porsgrunn, Norway
*
Author to whom correspondence should be addressed.
†
The author passed away.
Processes 2021, 9(2), 190; https://doi.org/10.3390/pr9020190
Submission received: 21 December 2020
/
Revised: 15 January 2021
/
Accepted: 15 January 2021
/
Published: 20 January 2021
(This article belongs to the Special Issue Upstream and Downstream Processing of Biogas: From Production Technology to Performance Assessment)
Abstract
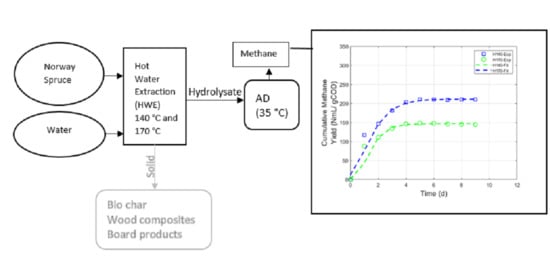
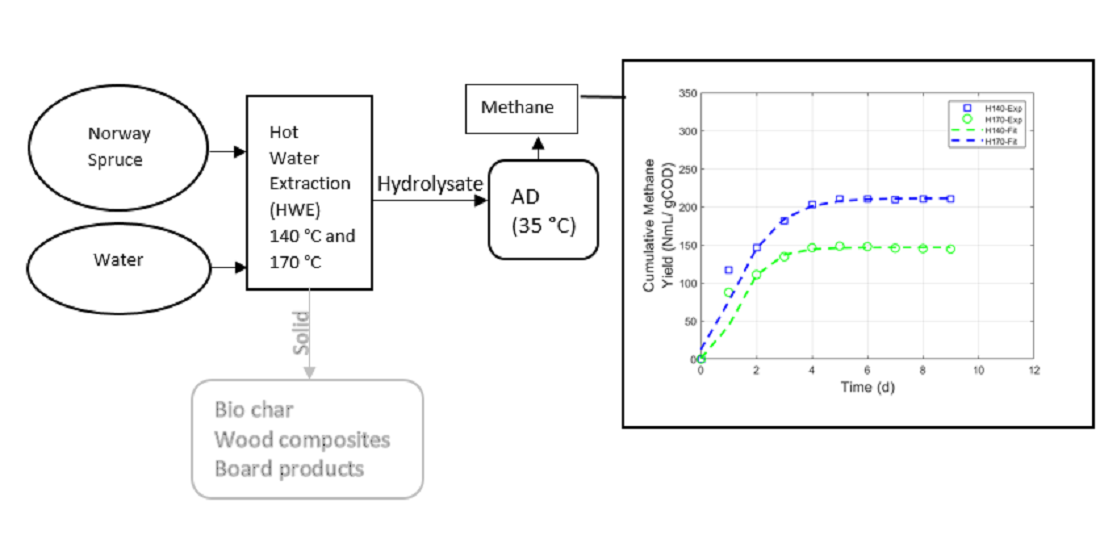
:Hot water extraction (HWE) removes hemicellulose from woody biomass to give improved end products while producing a sugar-rich by-product stream, which requires proper treatment before disposal. Hot water extracted Norway spruce (Picea abies) at two different pretreatment conditions (140 °C for 300 min (H140) and 170 °C for 90 min (H170)) generated hydrolysate as a by-product, which was used in mesophilic anaerobic digestion (AD) as substrate. H140 gave a higher methane yield (210 NmL/g COD—chemical oxygen demand) than H170 (148 NmL/g COD) despite having a lower concentration of sugars, suggesting that different levels of inhibitors (furans and soluble lignin) and recalcitrant compounds (soluble lignin) affected the methane yield significantly. Organic loads (OLs) had a negative effect on the methane yield, as observed during AD of H170, while such an effect was not observed in the case of H140. This suggests that the decrease in methane yield (32%) of H170 compared to H140 is primarily due to inhibitors, while the decrease in methane yield (19%) of H140 compared to the synthetic hydrolysate is primarily due to recalcitrant substances. Therefore, both OL and pretreatment conditions must be considered for efficient anaerobic digestion from hydrolysate for enhanced methane production.
1. Introduction
Lignocellulosic woody biomass is used for various products, such as wood composites, board products, and biochar [1,2]. Different pretreatment methods, such as mechanical, chemical, biological, physiochemical, and hydrothermal, are in use to make woody biomass more suitable for end products [1]. Among these methods, HWE is a common hydrothermal pretreatment carried out in the temperature range 120–230 °C and pressure conditions at which water is kept in subcritical condition [3]. As it is a chemical-free and environmental-friendly process, its use in lignocellulosic pretreatment is increasing [4], mainly to extract hemicellulose. During HWE, water molecules penetrate the lignocellulose network to solubilize hemicellulose sugars, such as xylose, glucose, mannose, arabinose, and galactose, and slightly remove lignin [5,6]. Removing the hemicellulose makes the wood rich in cellulose and lignin, which has several positive effects important for wood composites and various board products [1]. Pyrolysis of the wood after HWE also gives better bio-oil yield, reduces the content of ketones, acids, and water in the bio-oil leading to higher heating value and significant improvement of levoglucosan content [7], improving the quality of the bio-oil produced by pyrolysis [8,9,10]. The hemicellulosic stream is the by-product sugar-rich liquid, commonly called hydrolysate, and requires proper treatment before discarding to avoid environmental deterioration. Since the hydrolysate is rich in pentose sugar, it is not considered suitable for bioethanol production, due to the requirement of genetically modified microorganisms to degrade pentose, and these are highly sensitive to furan inhibitors like furfural and hydroxyl methyl furfural (5-HMF) present in the hydrolysate [11,12]. It has also been considered for the production of hydrogen through dark fermentation, but without promising results [13,14].
A suitable alternative for utilizing the hydrolysate can be anaerobic digestion (AD), a robust and mature technology consisting of a consortia of naturally occurring microorganisms that can adapt to synergistically break down various complex, recalcitrant, and even inhibitory compounds to methane [15]. A wide range of organic materials can, therefore, be used as feedstock in AD to produce biogas after proper pretreatment [16]. Moreover, liquefaction of lignocellulosic biomass overcomes several obstacles, such as acidification, low methane yield, poor biodegradation, and long retention time, which are inherent in traditional solid-state (SS) or semi-SS AD [17]. Biogas, a renewable and clean biofuel, is produced by AD of organic substances and is the most abundant gaseous biofuel. Feeding proportion can also influence the AD rate. Organic loads (OLs, or feed to microorganism ratio F/M) influences AD efficiency and needs to be optimized for industrial application [18]. Higher organic loading rates (OLR) can lead to the accumulation of volatile fatty acids (VFA), inhibiting AD [19]. Lower OLRs are also not beneficial for efficient industrial applications.
As co-production of biochar and bio-oil has increased in recent years to replace fossil-based fuels [20], hydrolysate formed as a by-product during pretreatment needs to be handled well to enhance the carbon recovery. Various lignocellulosic hydrolysate of agricultural by-products and energy crops, such as sugarcane bagasse, wheat, Napier grass, rice straw, etc., have been considered for AD [5,21,22]. Although hydrolysate of woody biomass, such as Norway spruce, has been used recently in thermophilic AD conditions for methane production [23], its use in mesophilic AD is yet to be exploited.
The goal of this research is to study the effects of pretreatment severities on the mesophilic AD methane yield of the hot water extracted hydrolysates of Norway spruce. Effects of hydrolysate inhibitors and recalcitrant substances on yield are investigated by testing corresponding synthetic hydrolysates, without inhibitors from the pretreatment, and the effects of OL in AD. The automatic methane potential testing system (AMPTS II) and syringe methods are used as batch AD.
2. Materials and Methods
2.1. Hot Water Extraction (HWE) Producing Hydrolysates
Norway spruce wood chips, with a dry matter content of 44.5%, were received from a Norwegian pulp and paper mill (Norske Skog Saugbrugs AS, Halden, Norway). They were pre-dried (93.9% DM—dry matter) and fractionated to a size between 13 mm and 5 mm, and mixed with distilled water in a 5:1 weight ratio. The mixture was loaded into a preheated Mini-Mill Laboratory Digester (MMLD, M/K Systems Inc., Williamstown, MA, USA) at 110 °C for HWE of wood chips and treated for 20 min at this temperature before the target temperature of 140 °C or 170 °C was reached over the course of 20 or 30 min, respectively. The target temperatures were kept for 300 min or 90 min, respectively [23]. The hydrolysates were collected and analyzed after HWE before testing for AD.
A severity factor (Equation (1)) [24] describing the effect of pretreatment time and temperature combined is calculated for each hydrolysate. Chosen temperatures and retention time values were from available references [25,26] to maximize hemicellulose extraction from the wood chips, while reducing AD inhibitor concentrations in the hydrolysate. Pretreatment at 140 °C for 300 min (H140) and 170 °C for 90 min (H170) gives moderate severity factors (log(R0)) of 3.65 and 4.02, respectively, producing hydrolysates with relatively low concentration degradation products inhibiting the AD process [26].
where, t (min) is the reaction time, and T (°C) is the pretreatment temperature.
2.2. Synthetic Hydrolysate
The real hydrolysates H140 and H170 were closely simulated by preparing synthetic hydrolysates H140syn and H170syn, respectively, based on the sugars and acetic acid concentrations, while excluding the inhibitors, such as furfural, 5-HMF, and soluble lignin (Table 1), resulting in soluble chemical oxygen demand (COD) values for H140syn and H170syn of 12.6 and 20.7 g CODs/L, respectively.
2.3. AD Batch Reactors Feeding
Both Norway spruce hydrolysates and the synthetic hydrolysates were tested for methane production in the AMPTS II at one OL, while both real hydrolysates were tested during AD in syringe batch reactors at different OLs.
All hydrolysates, also the synthetic, were added micro- and macronutrients [23] where a minimum COD:N:P ratio of 350:5:1 [27] was maintained.
The inoculum used in the experiments was mesophilic granular sludge originally obtained from a reactor treating paper mill effluent with a density of 1.0 to 1.09 kg/m3 and a diameter of 0.6 to 2.7 mm. The inoculum had total and volatile solid concentrations of 181 and 119 g/L, respectively. Possible gas production from the inoculum was reduced by degassing at 30 °C for >5 days before using in the experiment. The as produced from the blank sample, only containing inoculum and run in triplicates, was subtracted from the gas produced from the reactors to give gas production value only from the hydrolysates.
2.4. Methane Potential Test in AMPTS II
The automatic methane potential test system II (AMPTS II, Bioprocess Control® Sweden AB, Lund, Sweden, 2017), a standardized laboratory set-up, was used for the methane production test. It is used to determine methane production from any biodegradable material. Three parallels were run for each sample (Table 2). The experimental procedures can be found in Ghimire et al. [23]. The methane production values from AMPTS II were recorded as NmL (1 standard atmospheric pressure, 0 °C and zero moisture content) by Bioprocess Control® software. Badshah et al. can be referred for a detailed description of the AMPTS II system [28].
2.5. Methane Potential Test in Syringe
Real hydrolysates were run in triplicates for each OL of 6, 10, 20, and 30 g COD/L (Table 3) in 100 mL plastic medical syringes as batch reactors for methane production [29]. The detailed procedure can be found in Ghimire et al. [23]. Methane volume was adjusted to 1 atm, zero moisture content and 0 °C, and presented as NmL.
2.6. Analytical Methods
VFA concentrations, biogas composition, COD, pH, carbohydrate composition, furfural, and HMF are measured as described in Ghimire, Bakke, and Bergland [23].
2.7. Kinetic Modeling
The observed cumulative methane yield was fitted with the modified Gompertz model (Equation (2)) to determine the maximum methane production potential [30]. Methane yield with a sigmoidal growth curve, and the lag phase is simulated with the model [31].
where, G(t) is the cumulative methane production (NmL CH4/(g COD)) at a given time t, G0 is the maximum methane production potential (NmL CH4/(g COD)), t is time over the digestion period in days (d), λ is the lag phase time in days (d), Rmax is the maximal methane production rate (NmL CH4/(g COD d)), and e equals 2.7183 (Euler’s constant).
2.8. Statistical Analyses
One-way analysis of variance (ANOVA) was used for statistical analyses using MS-Excel 2016 (Microsoft Corporation, Redmond, Washington, DC, USA, 2020). p < 0.05 was denoted as statistical significance.
3. Results
3.1. Characteristics of Hydrolysate
HWE hydrolysate properties were dependent on pretreatment severity. Total and soluble COD values of H170 were higher (31 and 27 g CODt/L, respectively) compared to the values of H140 (22 and 20 g CODs/L, respectively). Similarly, higher acetic acid concentration in H170 (1.0 g/L) than H140 (0.6 g/L) gave a slightly lower pH value of 3.7 compared to 3.8 of H140. Total sugar concentration was also higher in H170 (18.61g/L) than H140 (11.9 g/L). Higher sugar concentration also leads to higher concentrations of furfural (0.9 g/L) and HMF (0.5 g/L) in H170 compared to 0.2 g/L of both furfural and HMF in H140. Detailed analysis of sugars can be found elsewhere [23].
3.2. AMPTS II Test
Maximum cumulative methane yields of 0.60 g COD/g COD (210 NmL/g COD) and 0.41 g COD/g COD (148 NmL/g COD) were observed for H140 and H170, respectively, compared to 0.74 g COD/g COD and 0.72 g COD/g COD of H140syn and H170syn, respectively (Table 4). A long phase of no gas production was observed after initial methane yields of 86 NmL/g COD and 73 NmL/g COD for H140syn and H170syn, respectively. Methane production recovered after 13 days and reached the final methane yield of 260 NmL/g COD (0.74 ± 0.01 g COD/g COD) and 252 NmL/g COD (0.72 ± 0.02 g COD/g COD) for H140syn and H170syn, respectively.
The methane yields of H140 and H170 were 0.19 g COD/g COD and 0.43 g COD/g COD lower (significant, p < 0.05) than the methane yields of their synthetic hydrolysate equivalents. The difference (significant, p < 0.05) between H140 and H170 was 0.32 g COD/g COD. The end pH was higher in synthetic hydrolysates than real hydrolysates, well above initial pH in all the cases, suggesting no overloading conditions in the end.
3.3. Kinetic Modeling
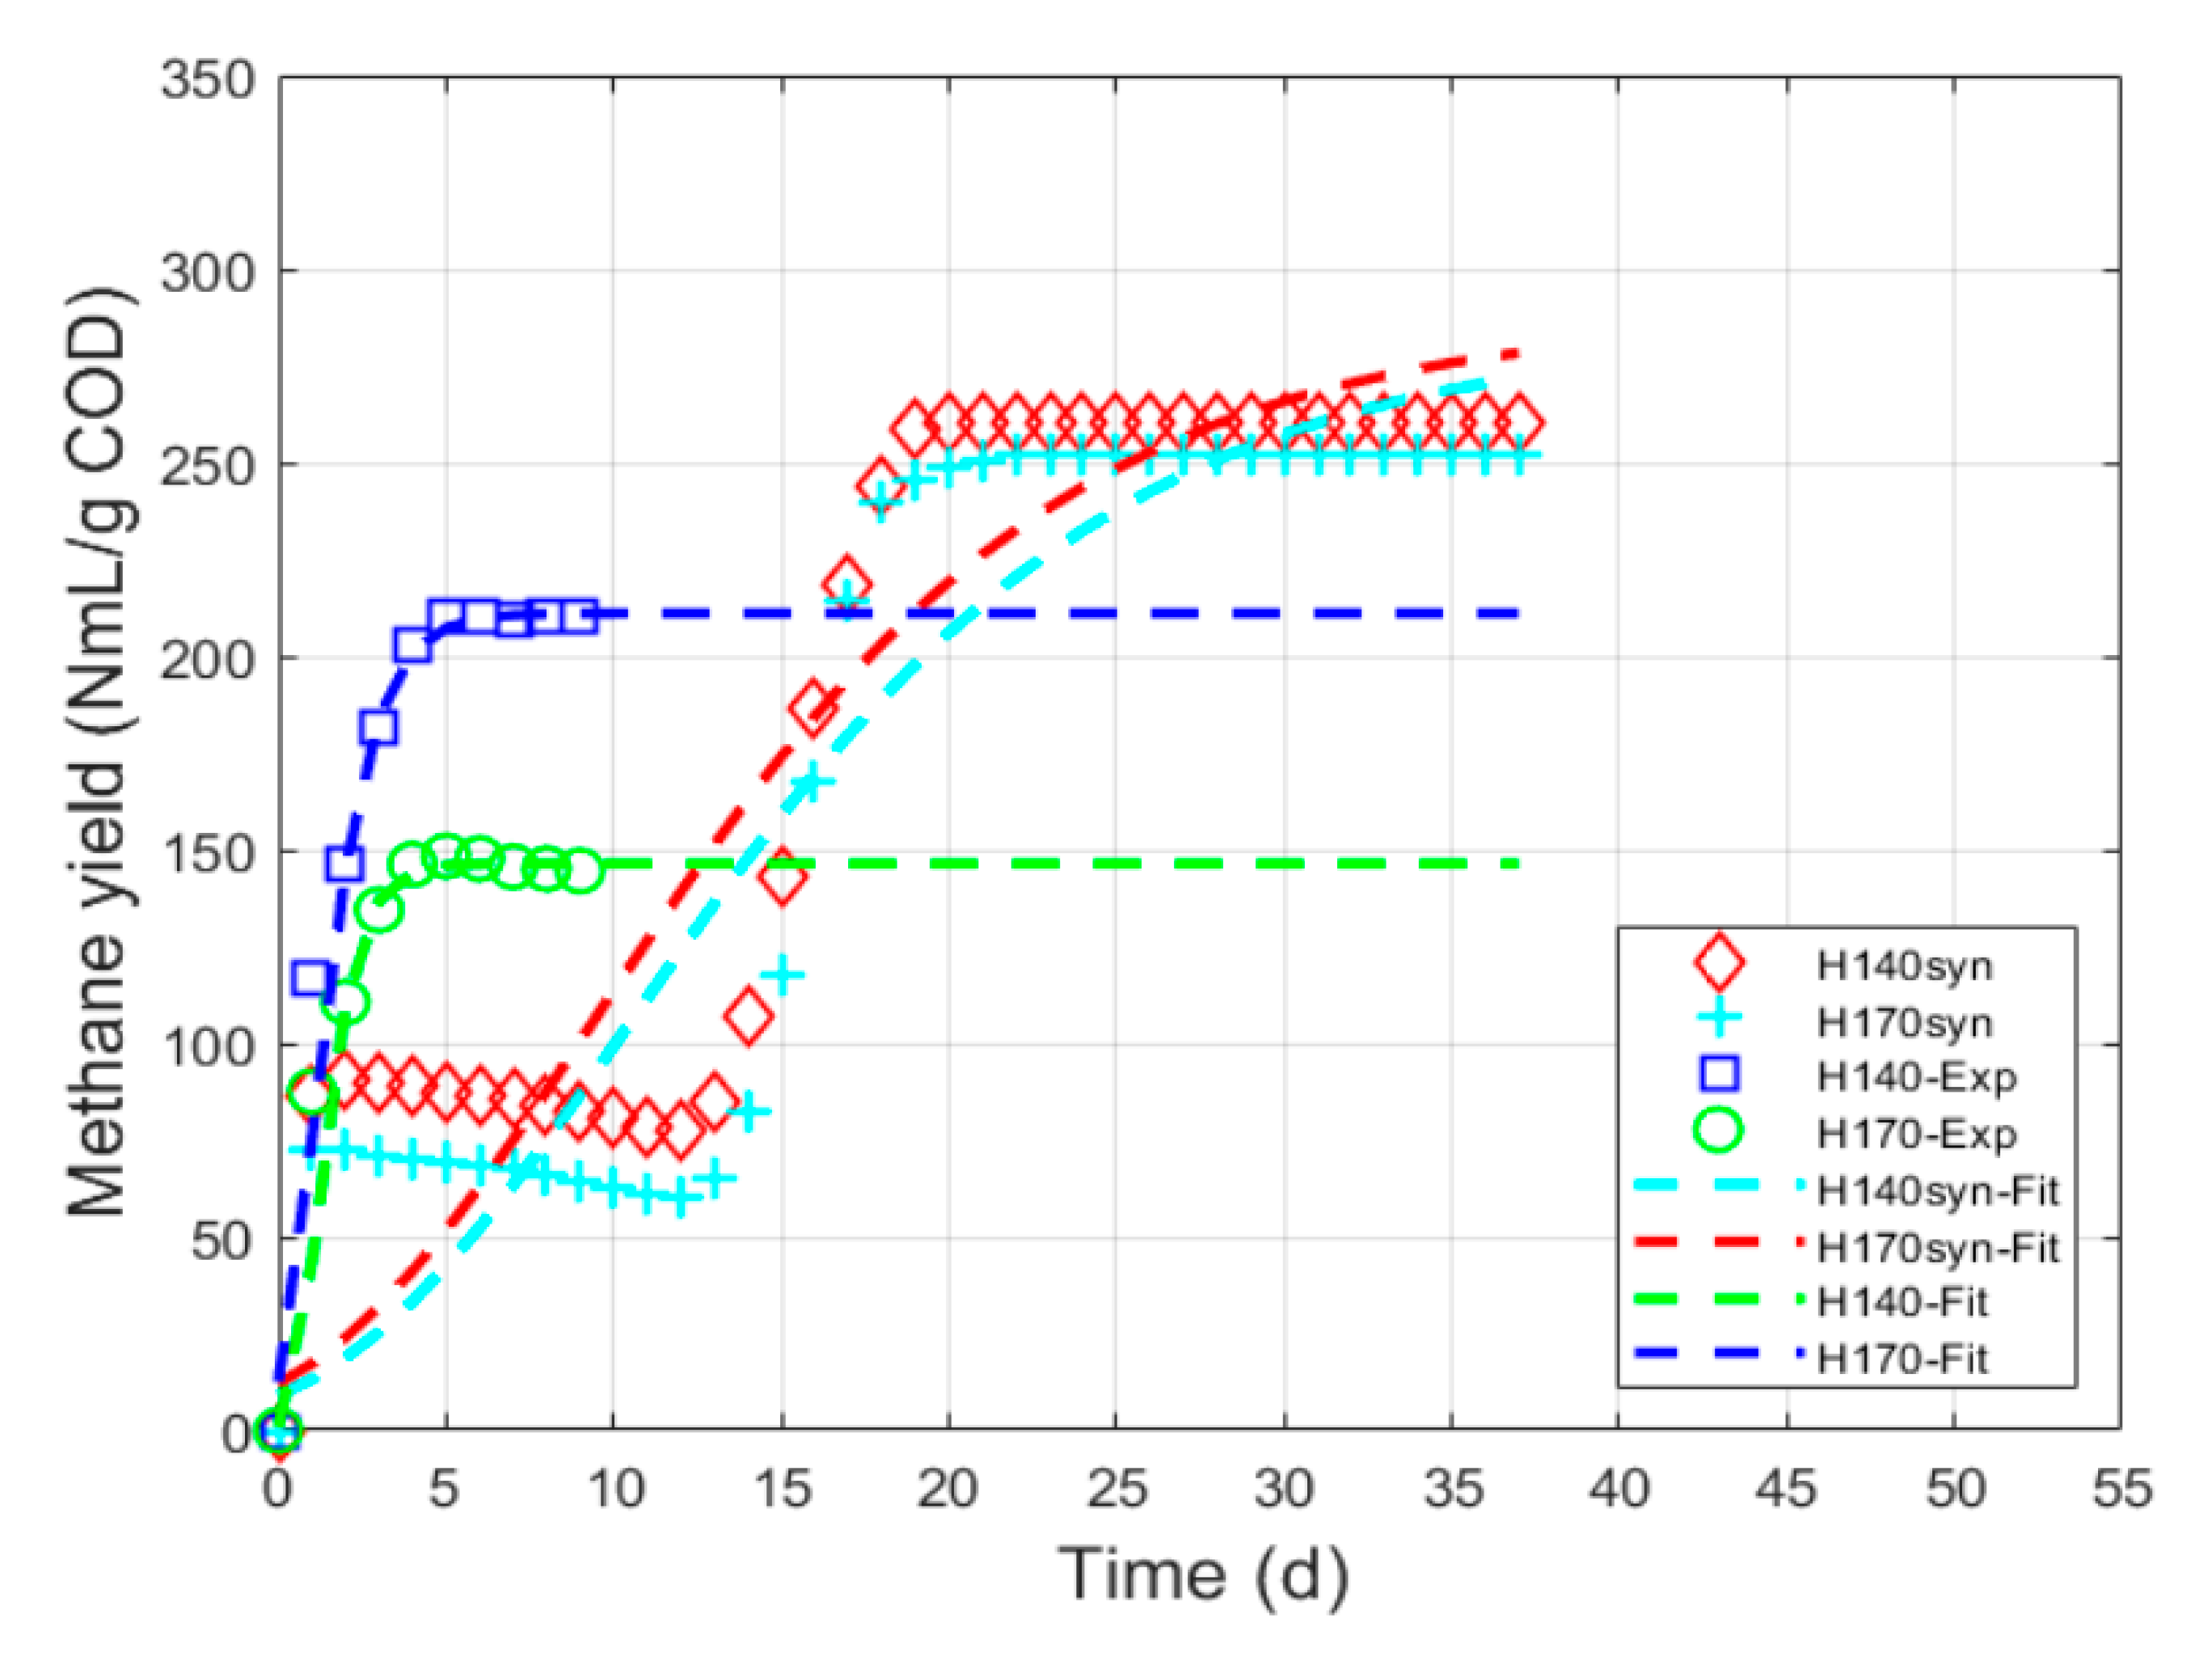
The G0 values predicted by the model are similar to the experimental cumulative methane yield (Figure 1) for the real hydrolysates, while a temporary production stop influenced the synthetic hydrolysate experimental cumulative methane yield curve. The difference between the predicted and the measured methane yield was less than 4% in the case of real hydrolysates, while less than 12% in the case of synthetic hydrolysates.
The lag phase was found to be lowest for H140 (0.04 d) compared to H170 (0.44 d). H140 had similar Rmax (79 NmL CH4/(g COD d)) to H170 (78 NmL CH4/(g COD d)) (Table 5).
H140syn (13 NmL CH4/(g COD d)) and H170syn (12 NmL CH4/(g COD d)) also had equal Rmax. The low rates calculated based on the Gompertz model (Equation (2)) are, however, not very appropriate for such cases where there is a pause instead of a lag phase in gas production. The Rmax measured directly (from data in Figure 1) is similar to the Rmax of the real hydrolysates.
3.4. Syringe Tests
3.4.1. OL Influence on AD of Hydrolysate
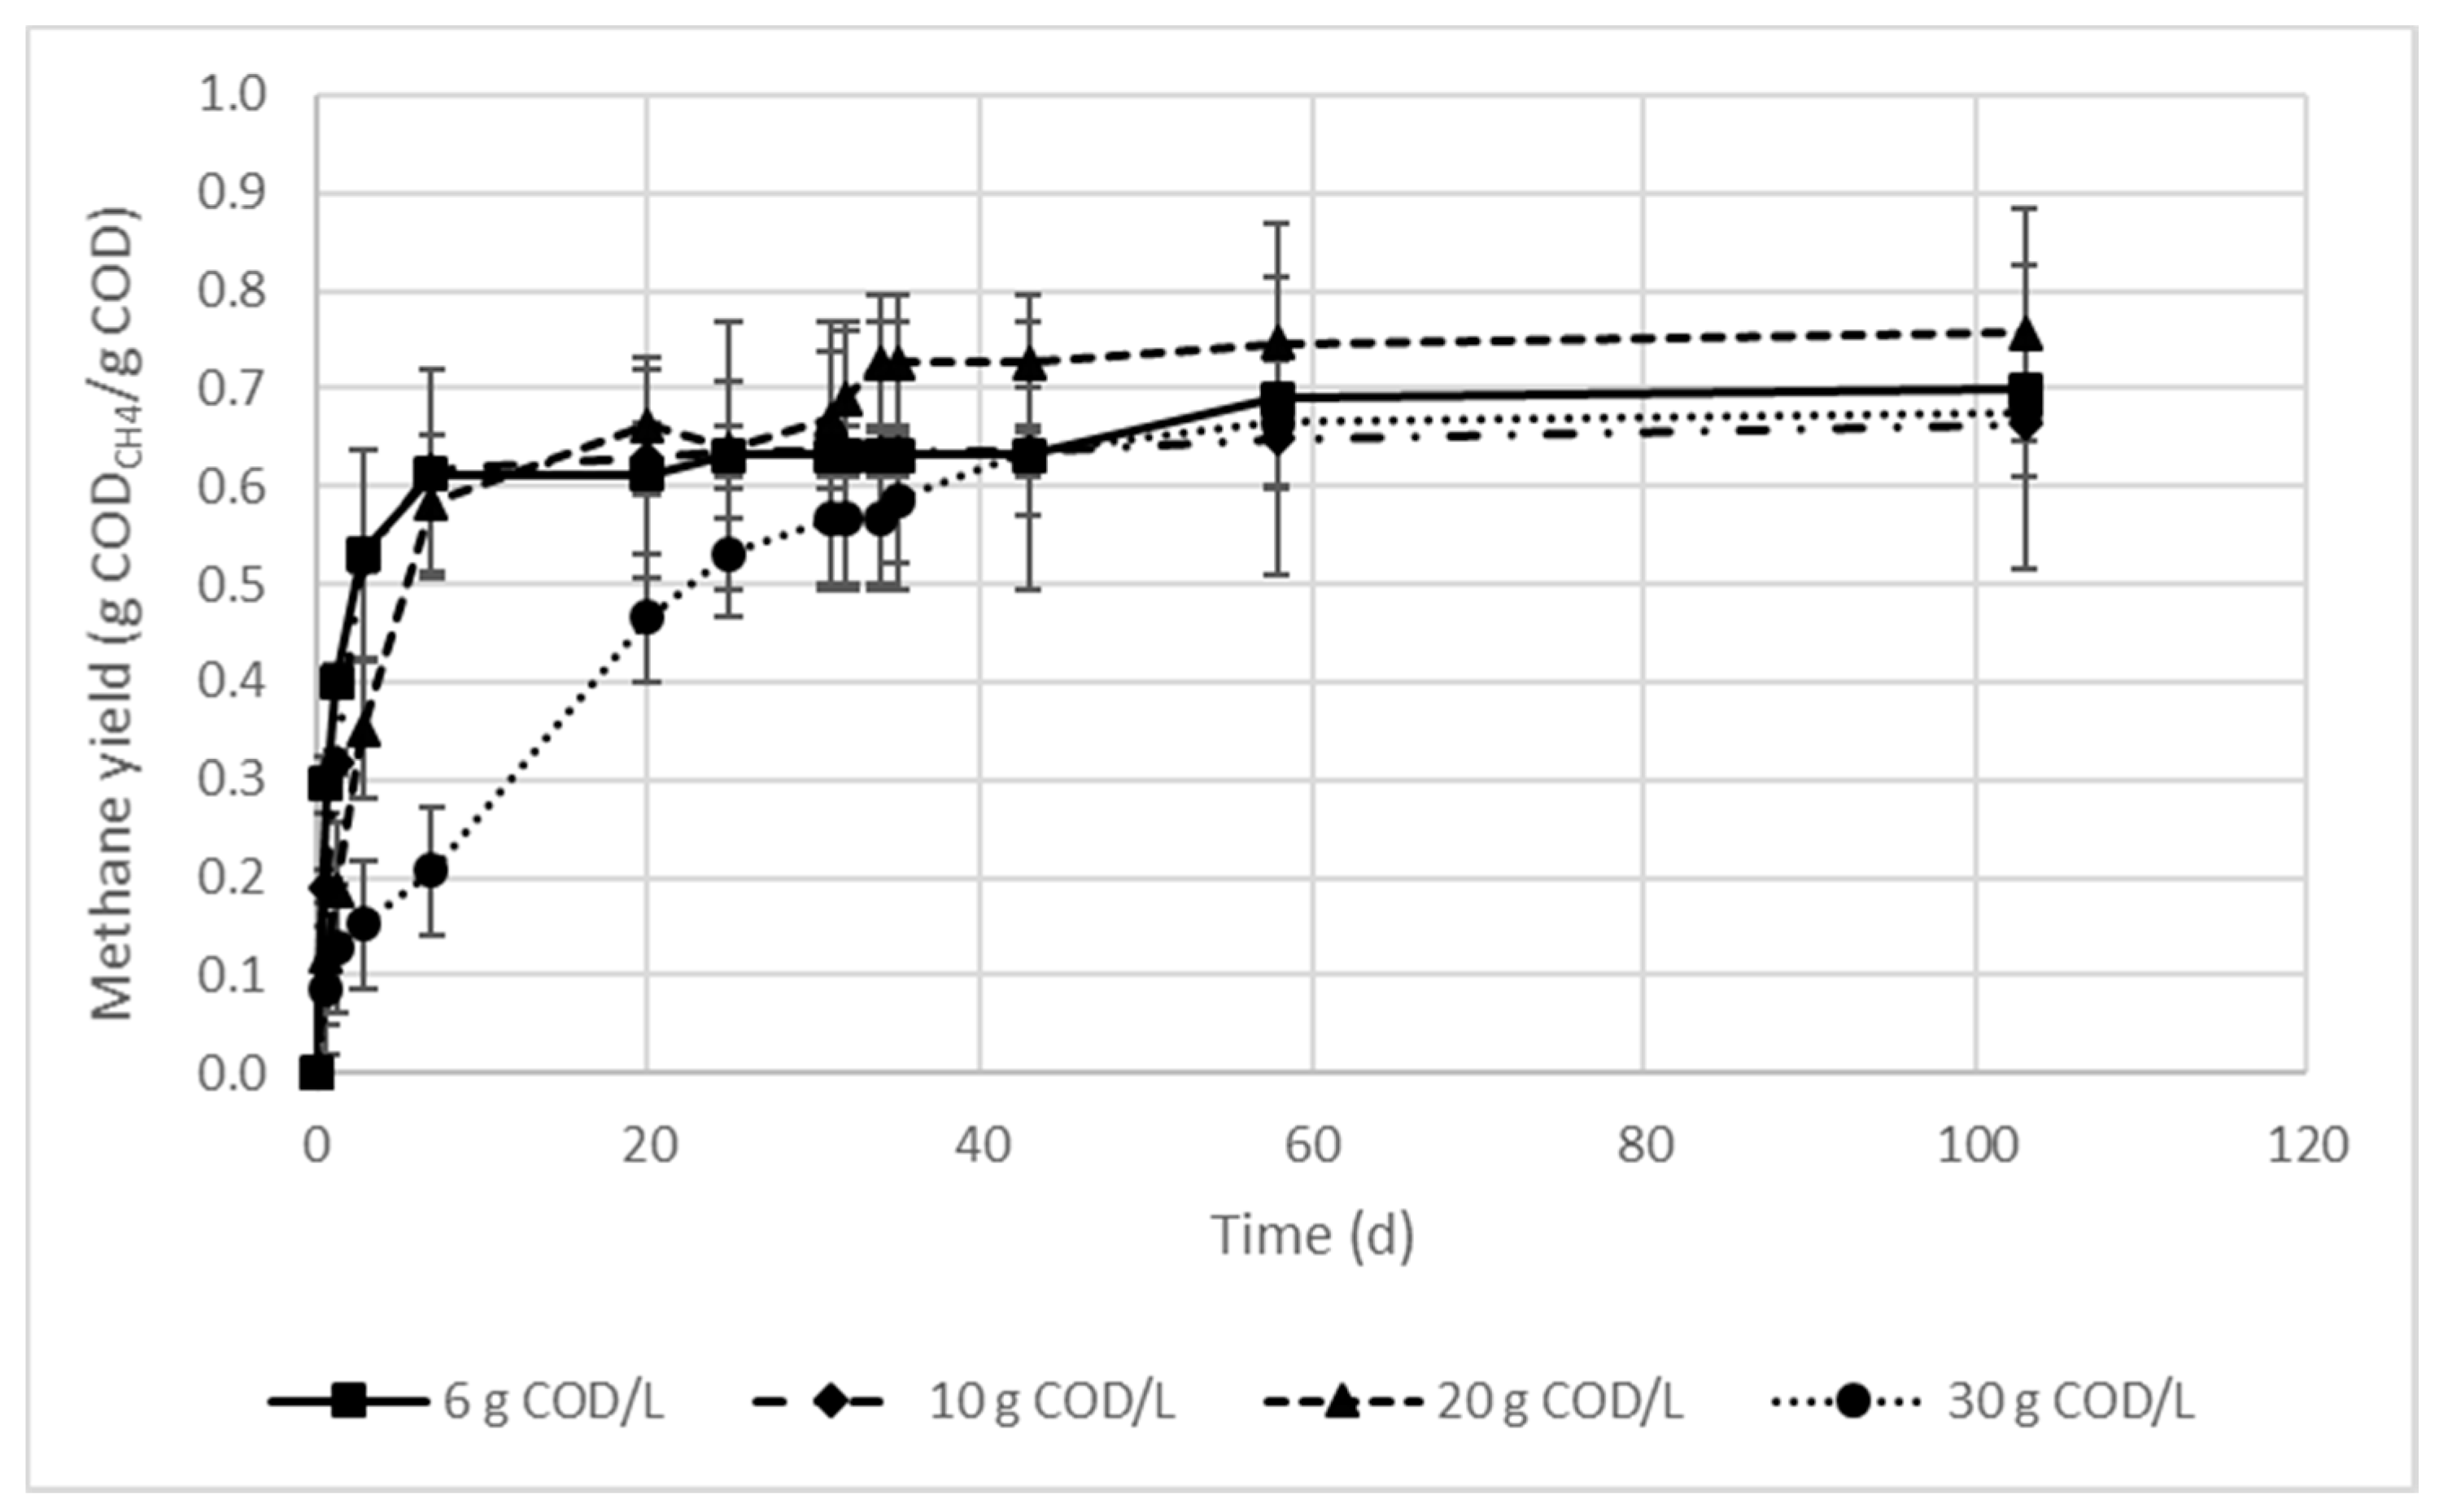
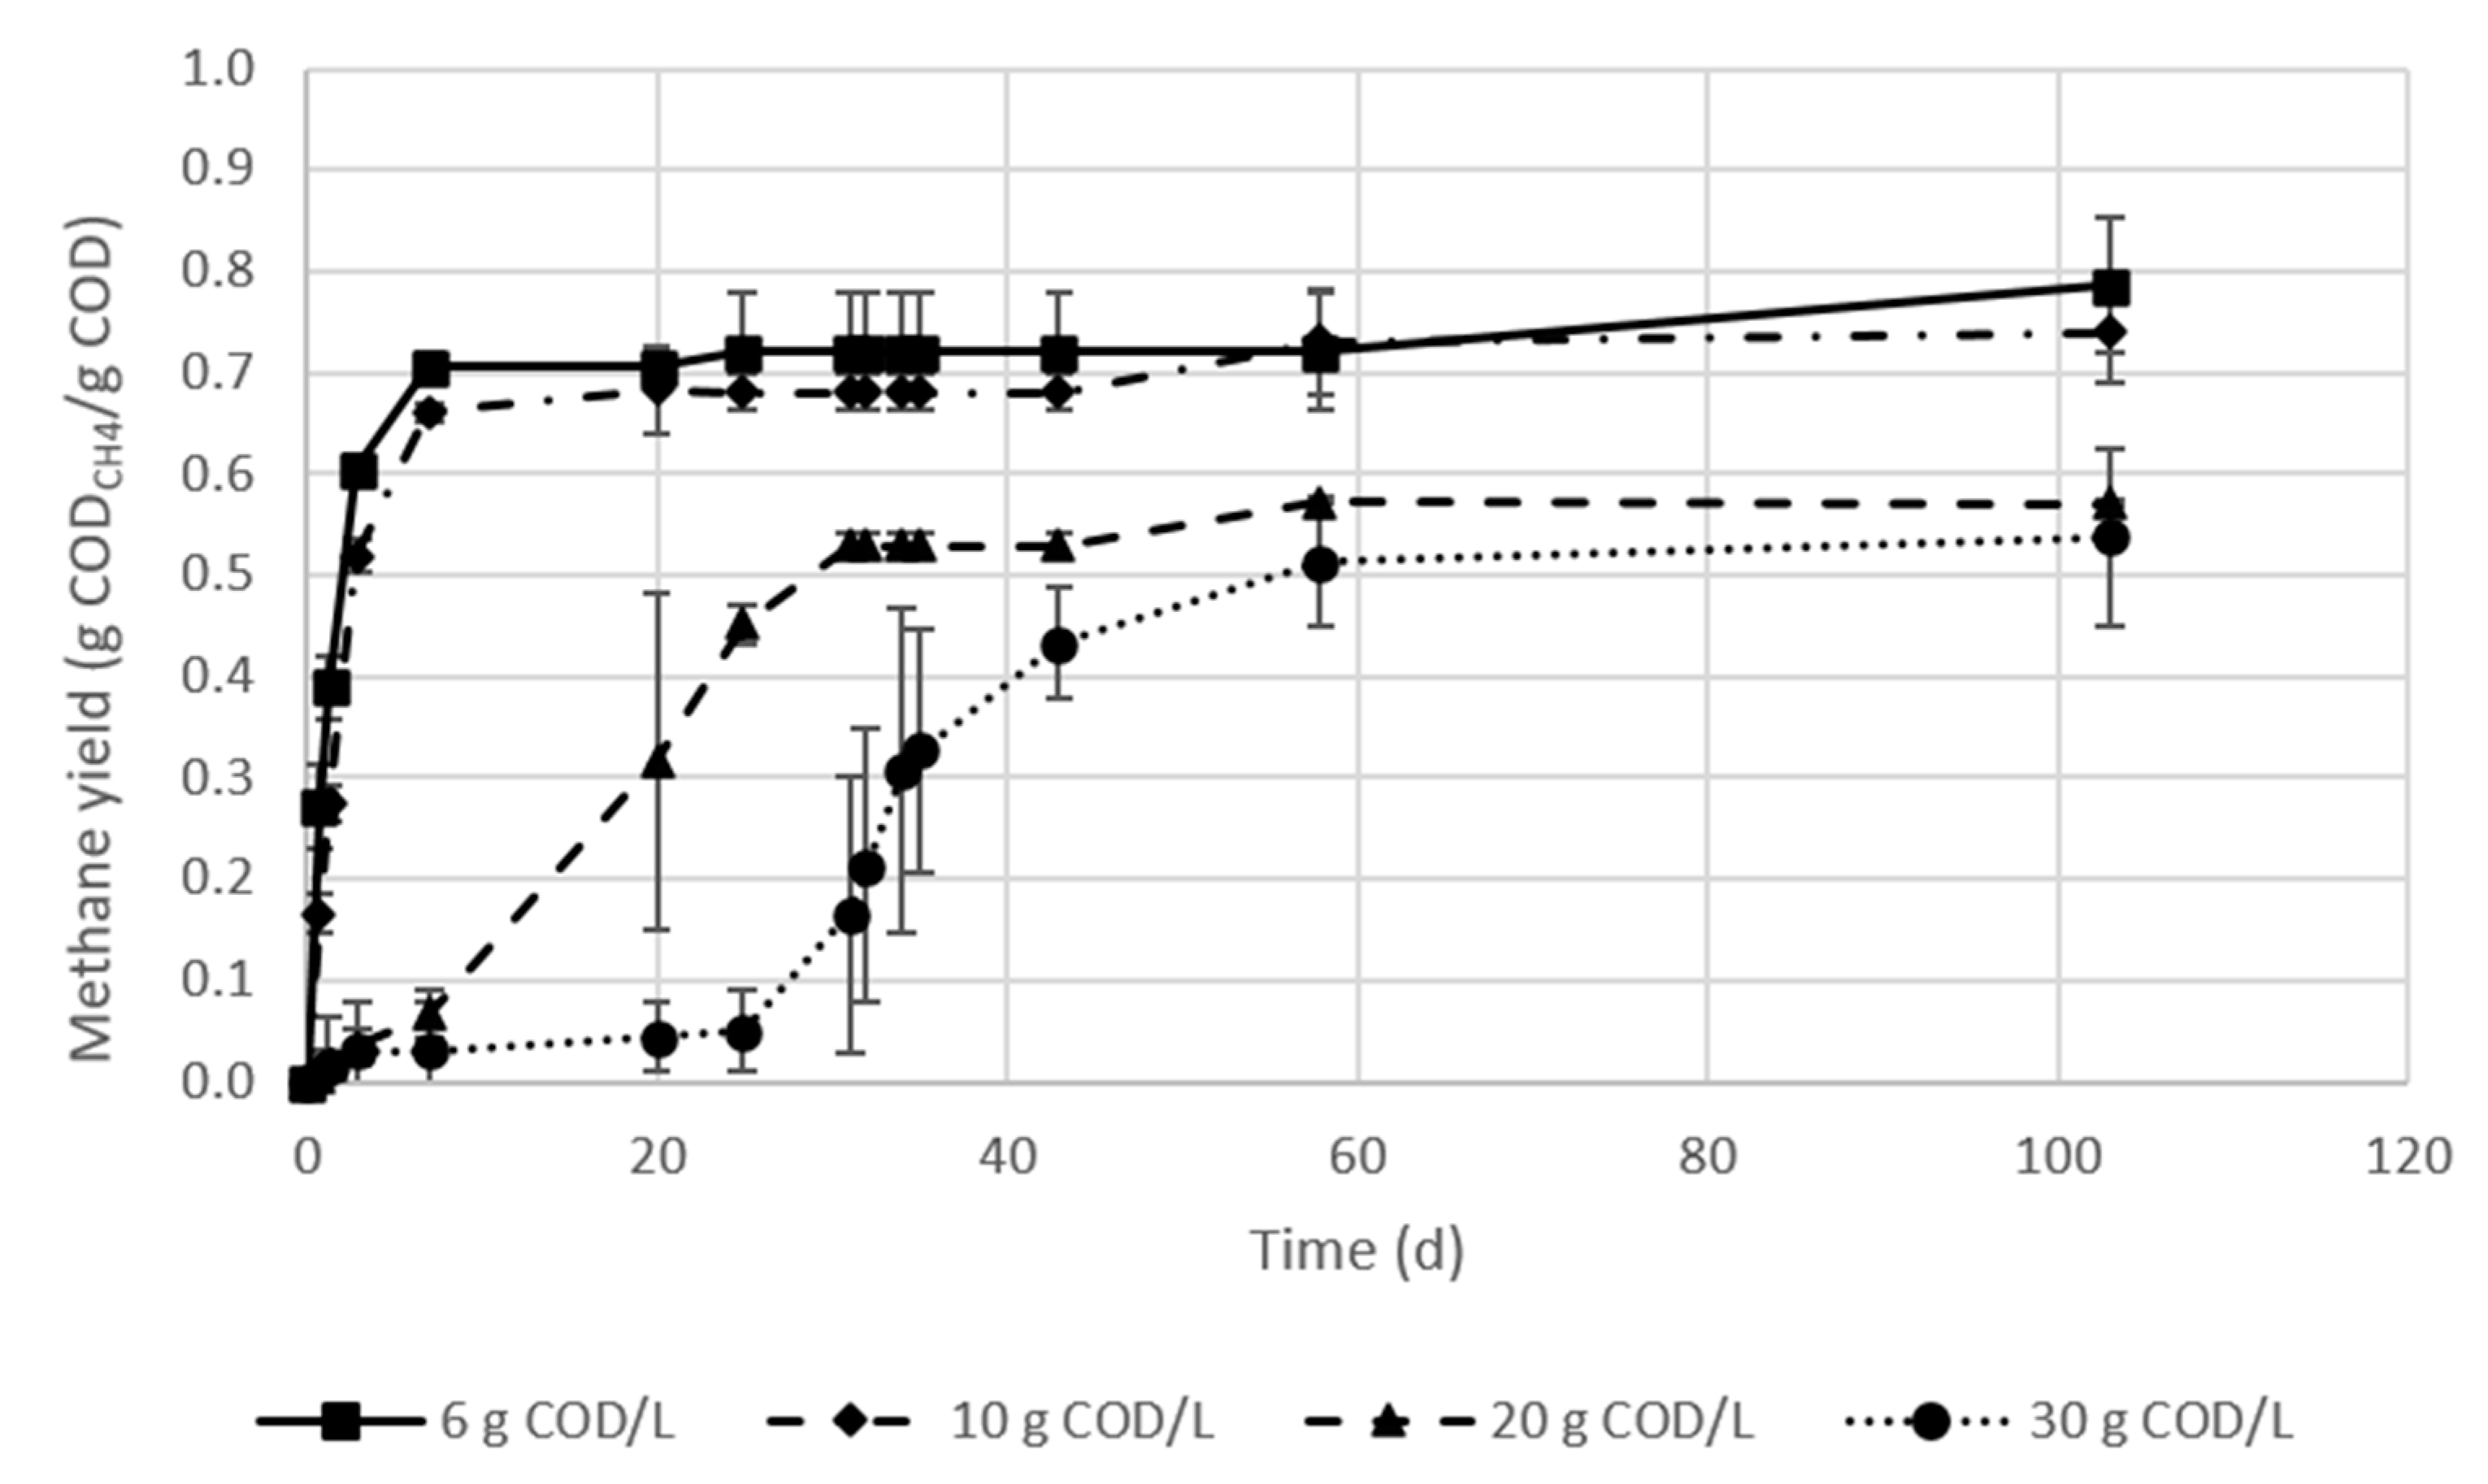
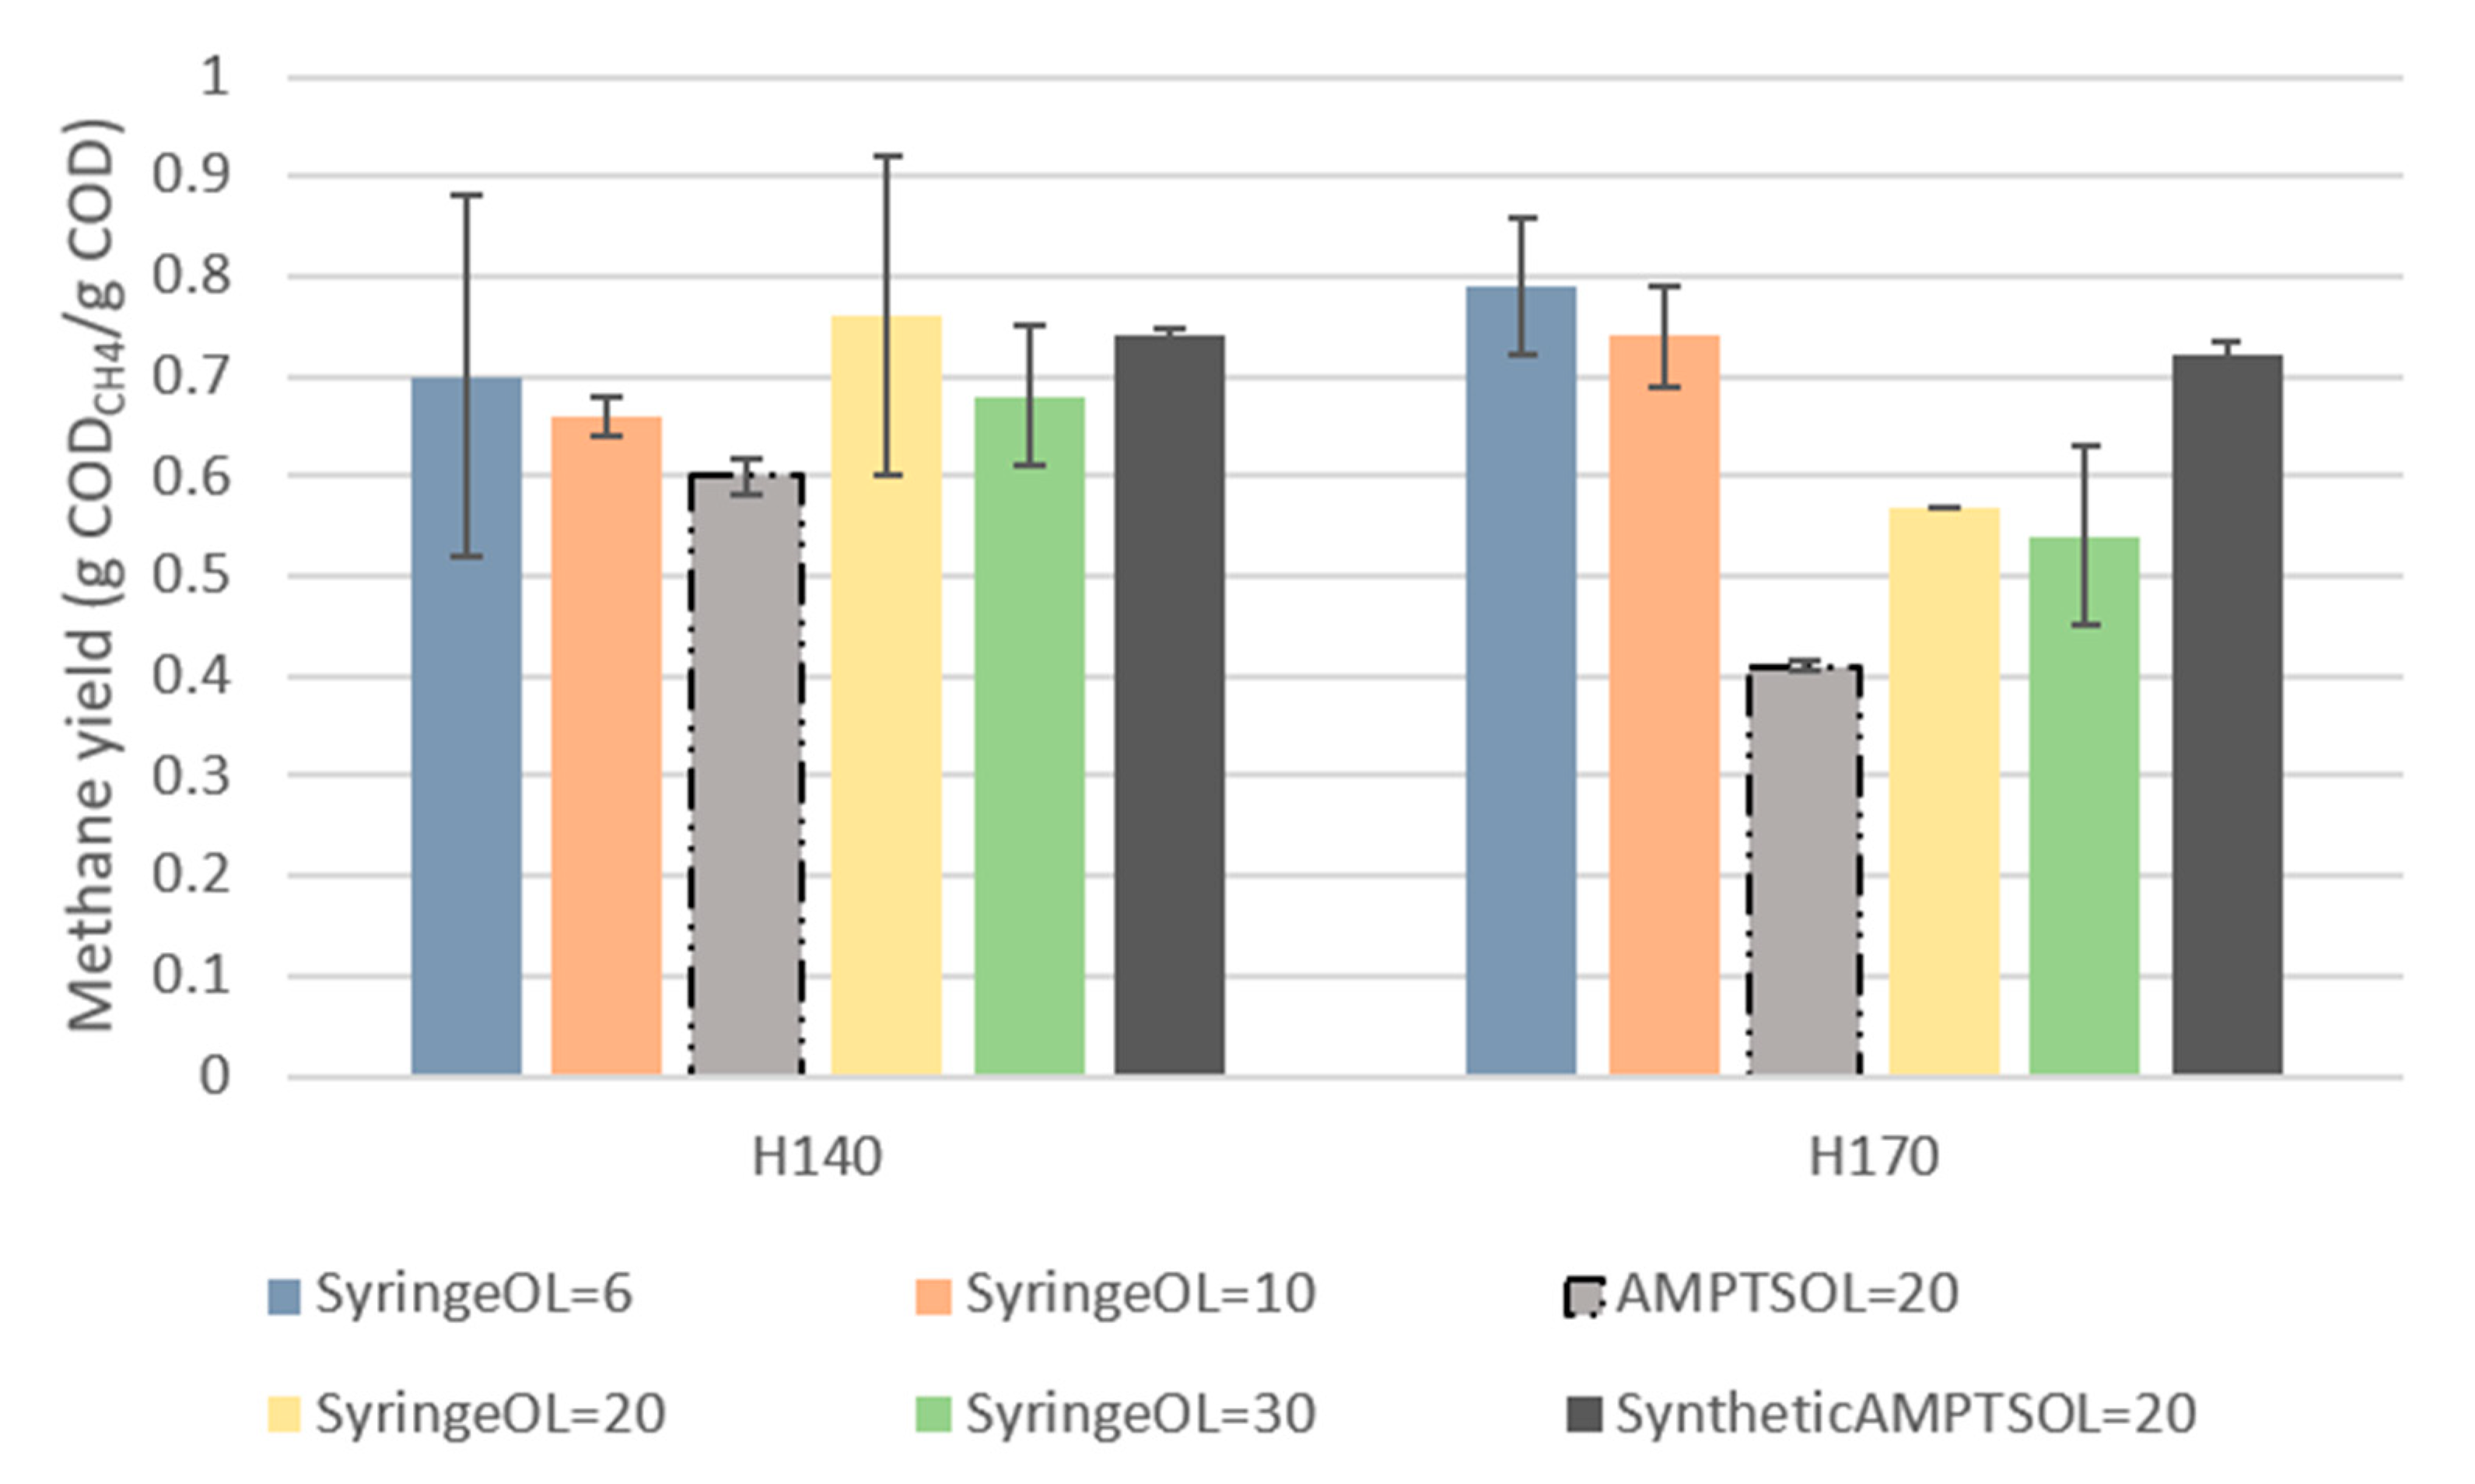
The batch experiments in syringes fed H140 and H170 at different OLs were run for 103 days (Figure 2, Figure 3 and Figure 4). The biogas production started immediately at the low OLs for both H140 and H170, implying that the culture was ready to digest the sugars and acetic acid present in the hydrolysates. Increasing OL beyond 10 g COD/L had a significant effect on the methane yield of H170, unlike H140 that had a slightly lower methane production rate, but without a compromise in the methane yield. Methane yields of 0.79 g COD/g COD and 0.74 g COD/g COD were obtained at the low OLs of 6 and 10 g COD/L, respectively, for H170, while yield values decreased to 0.57 g COD/g COD and 0.54 g COD/g COD for OLs of 20 and 30 g COD/L, respectively. H140 had methane yield near 0.7 g COD/g COD) for all OL. A long lag phase was observed at the highest load (30 g COD/L) in H170 (25 d), unlike in H140, which had no lag phase, but a slower digestion rate at the highest OL.
3.4.2. Methane Content and pH
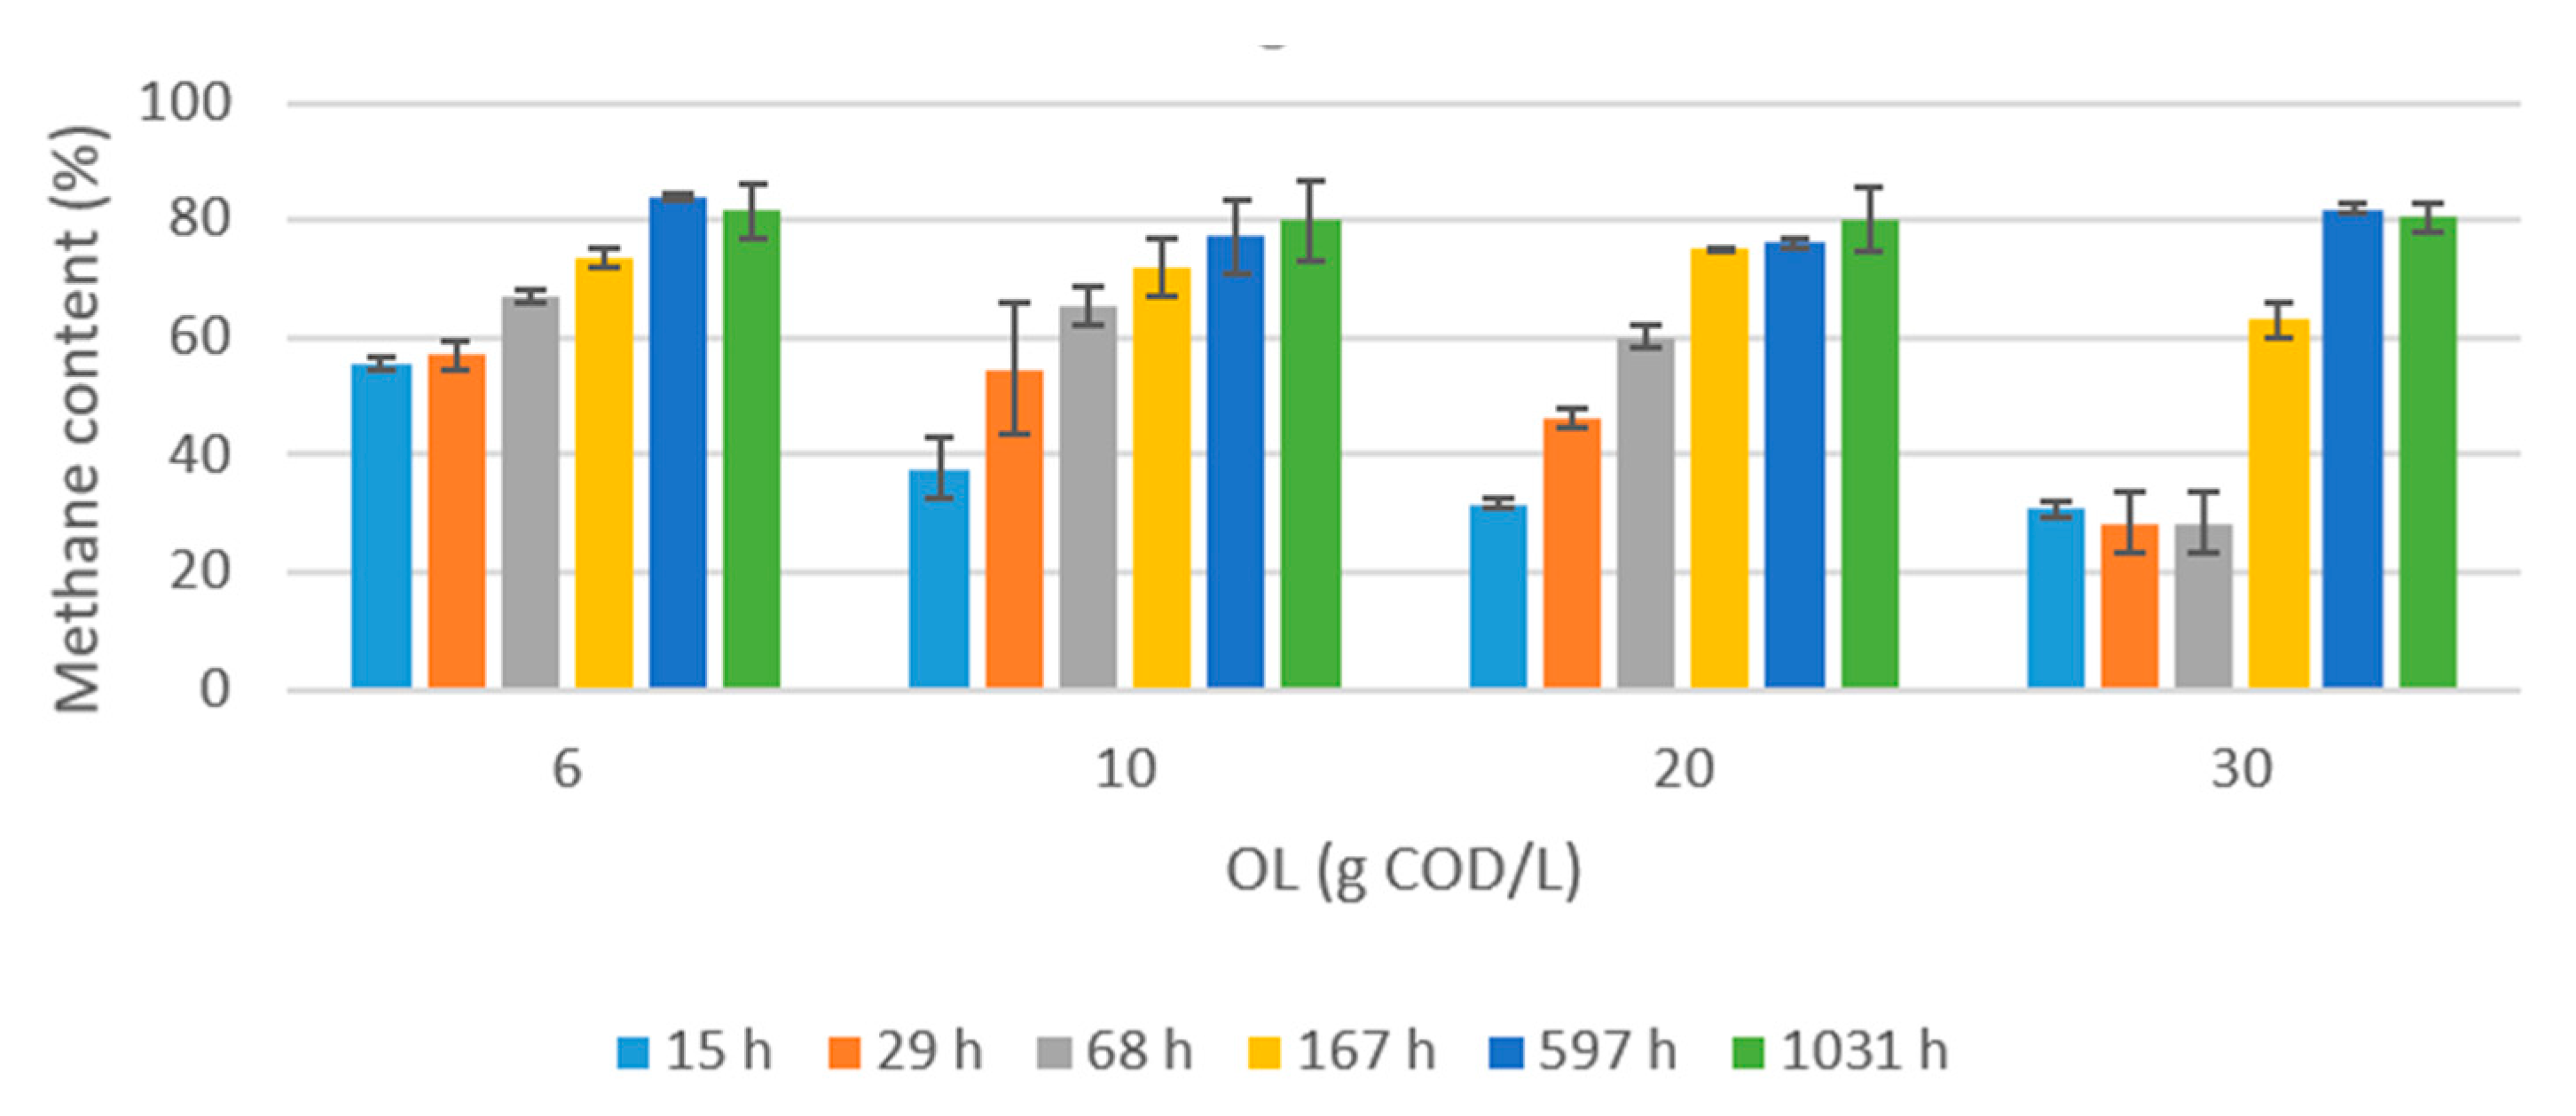
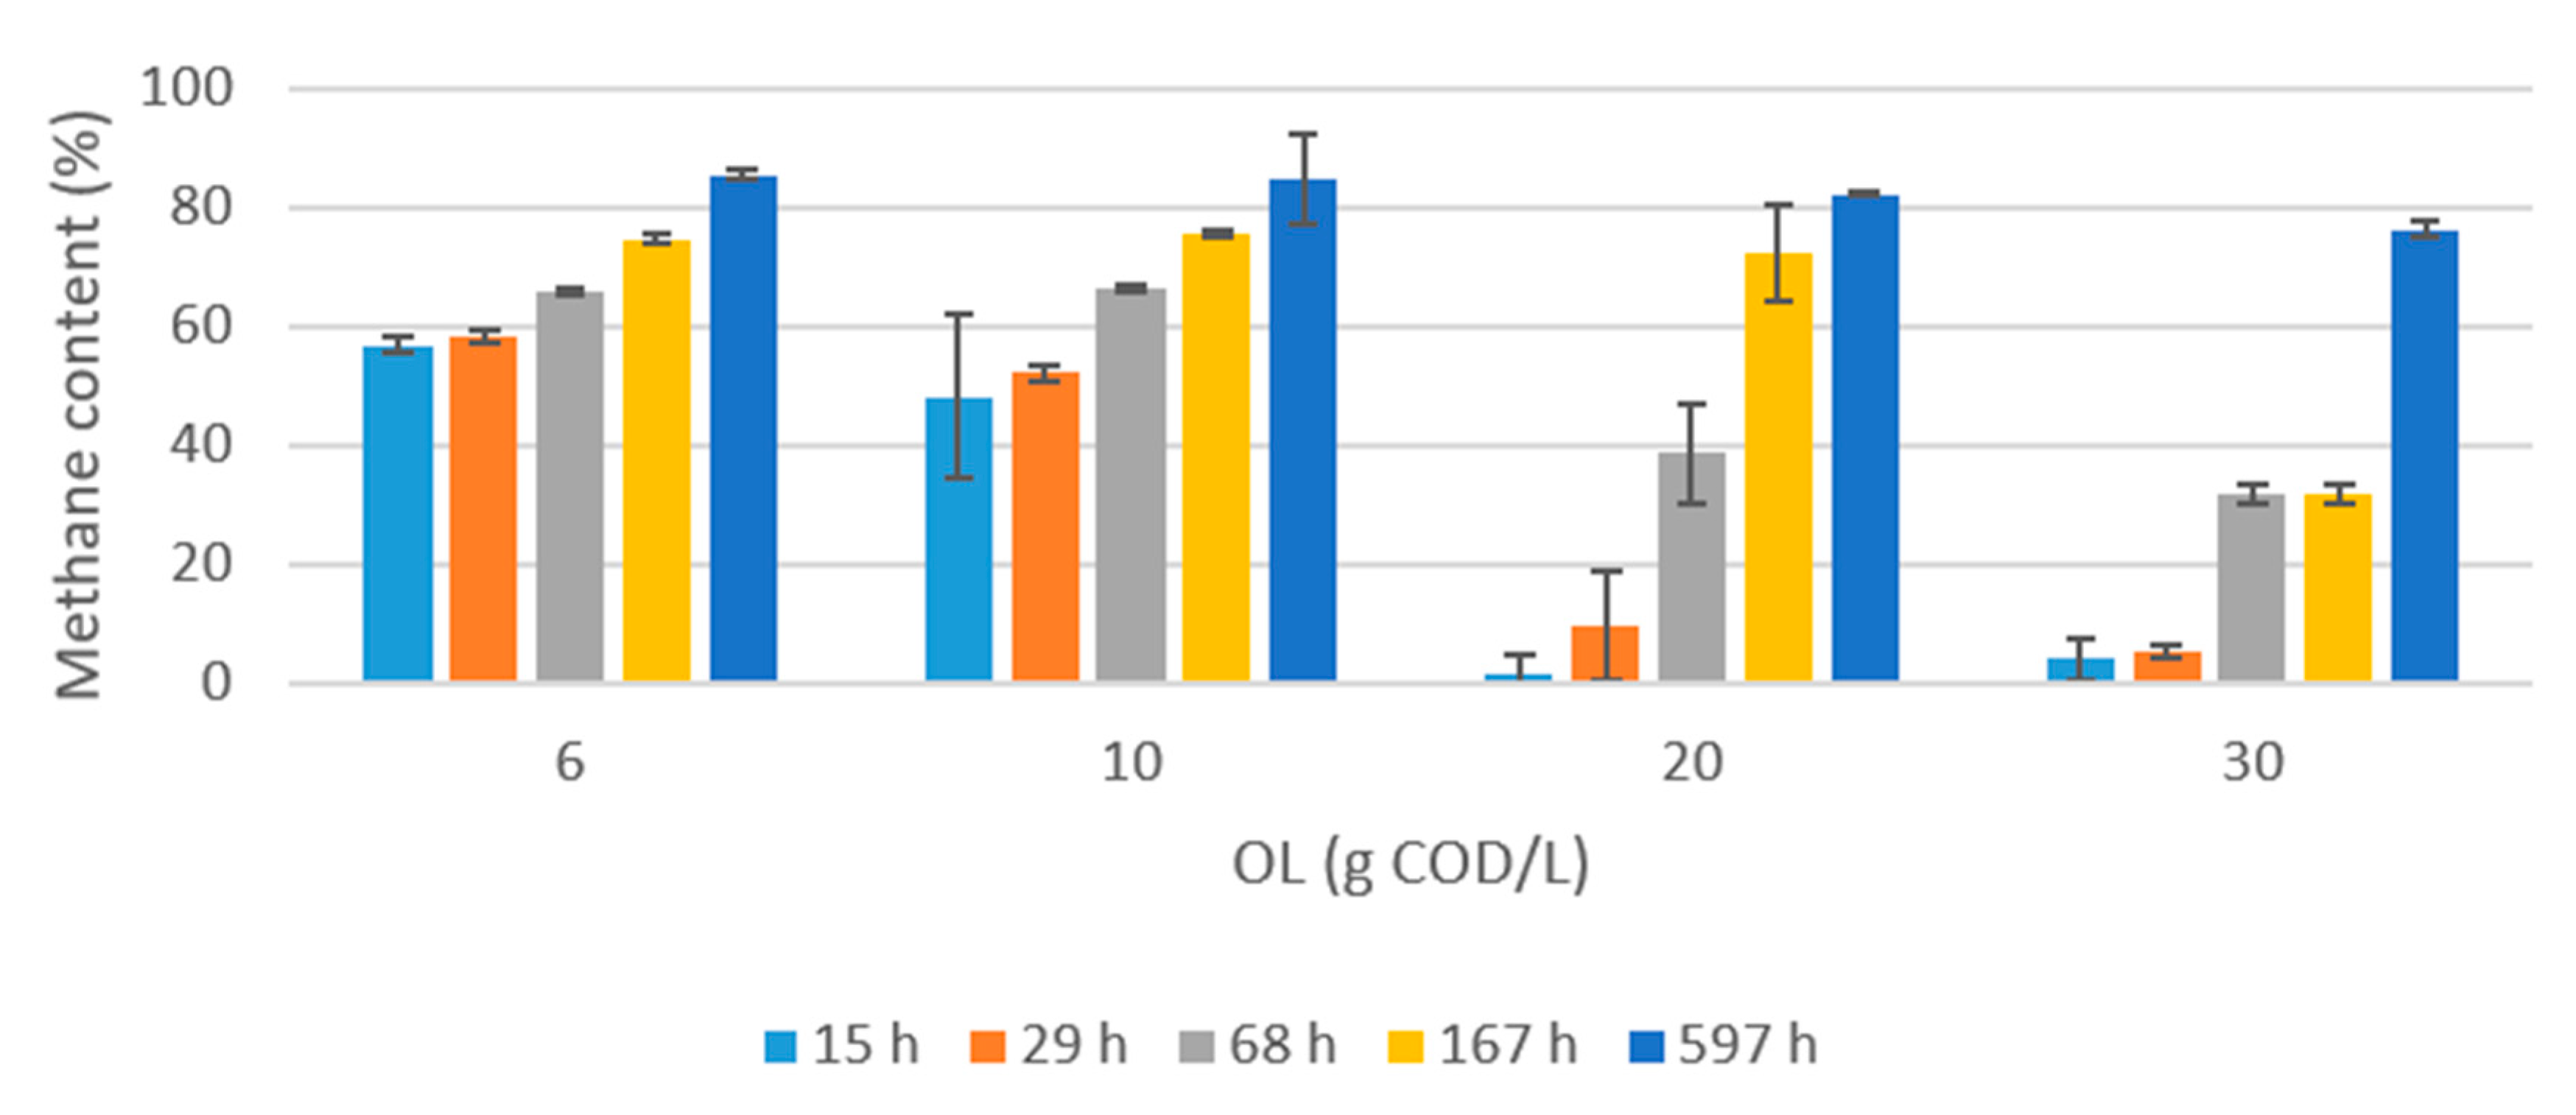
The methane content of both substrates either increased with time or remained constant towards the end at all loads, and the value ranged from 2 to 86% (Figure 5 and Figure 6). The main difference between the substrates was the higher methane content of H140 than H170 during the initial period of higher loads. During the loading of 20 g COD/L, H140 had methane content of 32%, 46%, and 60% compared to only 2%, 10%, and 39% of H170 at 15, 29, and 68 h, respectively. Similarly, during the loading of 30 g COD/L, H140 had methane content of 31%, 28%, and 63% compared to only 4%, 5%, and 32% of H170 at 15, 29, and 167 h, respectively. The difference decreased with time, all ending up with near 80% final methane content (Figure 5 and Figure 6, and Table 6). The weighted average methane contents ranged from 58% to 77% (Table 6). The weighted average methane content increased with an increase in OLs and was higher for H170 compared to H140.
4. Discussion
4.1. Effect of Sugars
The methane yield of hydrolysates from Norway spruce is similar to hydrolysate from agricultural residues, such as sugarcane bagasse and sunflower oil cake [32,33]. Comparing methane yield of hydrolysate from Norway spruce used in this experiment with thermophilic AD condition [23] shows a similar trend with a higher methane yield of H140 than of H170. The methane yields of the synthetic hydrolysates were slightly lower than the observed values under thermophilic conditions [23]. It is not clear why, but a long pause in gas production indicates some overloading conditions where an intermediate product may have inhibited methanogenesis.
Despite having a higher sugar concentration, H170 did not produce more methane than H140, so higher concentrations of COD and sugars do not necessarily lead to higher methane yields [5]. Inhibitory soluble lignin and sugar degradation products in the hydrolysate need to be considered along with sugar content if AD is the main aim [5,34]. The temperature and retention time during HWE can be tuned to enhance hemicellulose solubilization, while limiting the formation of sugar degradation products, lignin, and cellulose extraction and solubilizing, thereby obtaining more solid residues for biochar production, more bio-oil production, and hydrolysate suitable for methane production.
4.2. Effect of Sugar Degradation Products
Concentrations of AD inhibiting sugar degradation products, such as HMF and furfural, increase with higher pretreatment severity [35], and H170 had a higher concentration of inhibitors than H140. Since the concentration of sugar degradation products are less than the threshold values (0.8 mg/L for HMF and 2 g/L for furfural) that AD can tolerate, the lower methane yield of H170 can be attributed to the synergistic effect of both inhibitors, hampering microbial activities [36]. Inhibition was pronounced at higher OLs for H170, but not so for the H140, consistent with Monlau et al. [35] that inhibitor concentrations increase with temperature. The inhibitors themselves can be degraded during AD, but if HMF is present with furfural, the degradation rates of both decrease significantly, and HMF degradation starts after the complete furfural degradation [37]. However, microorganisms can get adapted to inhibitors over time, and the effects of inhibitors in hydrolysate on AD and adaptation of inoculum microorganisms should be better studied in long-term continuous flow experiments.
4.3. Effect of Soluble Lignin and Its Derivatives
Depending upon the severity index, part of the lignin can be dissolved during HWE along with the hemicellulose [6,38], so H170 is expected to have a higher concentration of lignin than H140, due to higher pretreatment severity [25]. The use of this hemicellulose concentrated hydrolysate as AD substrate is mainly hindered by the presence of the lignin polymers and oligomers [39]. Soluble lignin is inhibitory to different steps in AD, with methane yield decreasing with increased lignin addition during AD of cellulose and hemicellulose [40]. The soluble lignin itself remains undigested or is very slowly degraded in AD [34,41,42]. This is consistent with the observed lower methane yields (Figure 3), despite having a higher concentration of sugars, probably due to higher concentrations of soluble lignin in H170 compared to H140.
Accumulated VFA (acetic acid, propionic acid, and total), pH, and CODs at the end of the experiment had similar values in both the real and the synthetic hydrolysates. However, the methane yield is lower in the case of real hydrolysates compared to synthetic hydrolysate (Table 5), while having similar CODs removal values. This can probably be due to the accumulation of undigested lignin, for instance, by adsorption on the granules [43]. The residual CODs can be attributed to recalcitrant compounds present in the inoculum (blank), which had values of 1753 ± 403 mg/L at the end of the experiment.
Generally, due to the possible formation of phenolic compounds from lignin degradation at temperatures above 200 °C, such is not considered for hydrothermal pretreatment (HTP) in this investigation. Although H170 was a reasonable temperature, a longer retention time increased its severity index to 4.02, which is comparable to pretreatments at 190 °C for 20 min, 200 °C for 10 min, and 210 °C for 5 min. Although phenolic compounds were not quantified in our sample, it can be assumed that such compounds were present and may have enhanced the before mentioned inhibition causing lower methane yields from H170 at higher loads.
4.4. Effect of OL
H140 is better suited for higher loads compared to H170 (Figure 4), which is consistent with results from thermophilic AD [23]. Slower kinetics at higher loads for both hydrolysates can be attributed to inhibition from temporary increased VFA concentrations. The slower kinetics is most pronounced for H170, which is therefore attributed to higher inhibitor concentrations (furans and possible soluble lignin). The methane yield is also lower, but the high methane concentration and low VFA concentration, in the end, suggest that this is not primarily due to an imbalance between VFA production and consumption, but rather the inhibitors present in the feed. Since high load did not compromise methane yields for H140 where the methane content reached high levels faster (Figure 5) and the inhibitor concentrations were low, it suggests that: (1) Lower methane yield (19%) during the AMPTS II AD of H140 compared to the synthetic hydrolysate is primarily due to recalcitrant compounds and not inhibition; (2) while the lower methane yield (32%) of H170 compared to H140 is primarily due to inhibitors.
4.5. Kinetic Modeling
The experimental data curve fitted with modified Gompertz equation shows that the experimental data fitted reasonably with the tested model with a determination coefficient (R2) above 0.93 for both H140 and H170, which implies that the model could explain 93% of the variations in the results of the hydrolysates, a value in agreement with hydrothermal pretreatment of rice straw being utilized for AD [31]. Low values (less than 0.5 d) of lag phase suggest the easy biodegradation of hydrolysates because of a high-sugar content and lack of lipids and proteins. Higher severity index had no significant effect on Rmax, unlike G0.
4.6. Comparison of AD Batch Methods
Compared to syringe tests, AMPTS II gave lower methane yield values (Figure 4) for both H140 and H170, and has also been reported lower than thermophilic syringe tests [23] and German DIN standard method using eudiometers [44]. H170 had 28% lower methane yield in AMPTS II (0.41 g COD/g COD) versus the syringe method (0.57 g COD/g COD), while H140 had 21% lower methane yield in AMPTS II (0.60 g COD/g COD) versus the method (0.76 g COD/g COD). The differences can be attributed to temperature change in the reactor when incubated syringes are removed from the temperature-controlled heat cabinet, due to manual operating that influenced AD microbiology and the headspace gas concentration in syringe [45], and human error due to manual operation [46]. In this study, different feeds compared showed similar relative differences suggesting that both the methods worked well for the comparisons.
5. Conclusions
HWE is an efficient pretreatment method to extract hydrolysate from Norway spruce to use as feed for AD. However, methane production yields and rates are influenced by pretreatment conditions. H140 gave a higher methane yield (210 NmL/g COD, 0.60 g COD/g COD) than H170 (148 NmL/g COD, 0.41 g COD/g COD) despite having a lower concentration of sugars, suggesting that different levels of inhibitors (furans and soluble lignin) and recalcitrant compounds (soluble lignin) had a significant effect on the methane yield.
A negative effect of OLs on methane yield was observed during AD of H170, while such an effect was not observed in the case of H140. This suggests that the decrease in methane yield (32%) of H170 compared to H140 is primarily due to inhibitors, while the decrease in methane yield (19%) of H140 compared to the synthetic hydrolysate is primarily due to recalcitrant substances. Therefore, both OL and pretreatment conditions must be considered for efficient anaerobic digestion of hydrolysate for enhanced methane production.
Author Contributions
Conceptualization, N.G. and W.H.B.; methodology, N.G.; validation, N.G.; formal analysis, N.G. and W.H.B.; investigation, N.G. and W.H.B.; data curation, N.G.; writing—original draft preparation, N.G.; writing—review and editing, N.G., W.H.B. and R.B.; supervision, W.H.B. and R.B.; funding acquisition, R.B. All authors have read and agreed to the published version of the manuscript.
Funding
This research is done as a part of Norske Skog Saugbrugs innovation project Pyrogas co-funded by The Norwegian research council (EnergyX programme; Project number: 269322).
Institutional Review Board Statement
Not applicable.
Informed Consent Statement
Not applicable.
Data Availability Statement
The data presented in this study are available on request from the corresponding author. The data are not publicly available due to confidentiality of the project as patent application is pending.
Acknowledgments
The authors would like to thank RISE PFI AS, Trondheim for the hydrolysates preparation and sugars, furfural and HMF content analysis. The authors like to thank Jitendra Sah for the help on carrying out the experiments.
Conflicts of Interest
The authors declare no conflict of interest.
Abbreviations
| AD | Anaerobic Digestion |
| AMPTS | Automatic Methane Potential Testing System |
| COD | Chemical Oxygen Demand |
| DM | Dry Matter |
| F/M | Feed to Microorganism Ratio |
| H140 | Hydrolysate Pretreated at 140 °C |
| H140syn | Synthetic feed simulating H140 |
| H170 | Hydrolysate Pretreated at 170 °C |
| H170syn | Synthetic feed simulating H170 |
| HMF | Hydroxymethyl Furfural |
| HWE | Hot Water Extraction |
| MMLD | Mini-Mill Laboratory Digester |
| OL | Organic Load |
| OLR | Organic Loading Rate |
| SS AD | Solid-State Anaerobic Digestion |
| VFA | Volatile Fatty Acid |
References
- Pelaez-Samaniego, M.R.; Yadama, V.; Lowell, E.; Espinoza-Herrera, R. A review of wood thermal pretreatments to improve wood composite properties. Wood Sci. Technol. 2013, 47, 1285–1319. [Google Scholar] [CrossRef]
- Liu, Z.; Han, G. Production of solid fuel biochar from waste biomass by low temperature pyrolysis. Fuel 2015, 158, 159–165. [Google Scholar] [CrossRef]
- Nitsos, C.K.; Matis, K.A.; Triantafyllidis, K.S. Optimization of hydrothermal pretreatment of lignocellulosic biomass in the bioethanol production process. ChemSusChem 2013, 6, 110–122. [Google Scholar] [CrossRef] [PubMed]
- Díaz, M.J.; Cara, C.; Ruiz, E.; Pérez-Bonilla, M.; Castro, E. Hydrothermal pre-treatment and enzymatic hydrolysis of sunflower stalks. Fuel 2011, 90, 3225–3229. [Google Scholar] [CrossRef]
- Baeta, B.E.; Lima, D.R.; Adarme, O.F.; Gurgel, L.V.; Aquino, S.F. Optimization of sugarcane bagasse autohydrolysis for methane production from hemicellulose hydrolyzates in a biorefinery concept. Bioresour. Technol. 2016, 200, 137–146. [Google Scholar] [CrossRef]
- Mosier, N.; Wyman, C.; Dale, B.; Elander, R.; Lee, Y.Y.; Holtzapple, M.; Ladisch, M. Features of promising technologies for pretreatment of lignocellulosic biomass. Bioresour. Technol. 2005, 96, 673–686. [Google Scholar] [CrossRef]
- Chang, S.; Zhao, Z.; Zheng, A.; Li, X.; Wang, X.; Huang, Z.; He, F.; Li, H. Effect of hydrothermal pretreatment on properties of bio-oil produced from fast pyrolysis of eucalyptus wood in a fluidized bed reactor. Bioresour. Technol. 2013, 138, 321–328. [Google Scholar] [CrossRef]
- Alvarez-Chavez, B.J.; Godbout, S.; Palacios-Rios, J.H.; Le Roux, É.; Raghavan, V. Physical, chemical, thermal and biological pre-treatment technologies in fast pyrolysis to maximize bio-oil quality: A critical review. Biomass Bioenergy 2019, 128. [Google Scholar] [CrossRef]
- Tripathi, M.; Sahu, J.N.; Ganesan, P. Effect of process parameters on production of biochar from biomass waste through pyrolysis: A review. Renew. Sustain. Energy Rev. 2016, 55, 467–481. [Google Scholar] [CrossRef]
- Le Roux, É.; Chaouch, M.; Diouf, P.N.; Stevanovic, T. Impact of a pressurized hot water treatment on the quality of bio-oil produced from aspen. Biomass Bioenergy 2015, 81, 202–209. [Google Scholar] [CrossRef]
- Torry-Smith, M.; Sommer, P.; Ahring, B.K. Purification of bioethanol effluent in an UASB reactor system with simultaneous biogas formation. Biotechnol. Bioeng. 2003, 84, 7–12. [Google Scholar] [CrossRef]
- Kaparaju, P.; Serrano, M.; Thomsen, A.B.; Kongjan, P.; Angelidaki, I. Bioethanol, biohydrogen and biogas production from wheat straw in a biorefinery concept. Bioresour. Technol. 2009, 100, 2562–2568. [Google Scholar] [CrossRef] [PubMed]
- Kongjan, P.; Sompong, O.T.; Kotay, M.; Min, B.; Angelidaki, I. Biohydrogen production from wheat straw hydrolysate by dark fermentation using extreme thermophilic mixed culture. Biotechnol. Bioeng. 2010, 105, 899–908. [Google Scholar] [CrossRef]
- Kádár, Z.; De Vrije, T.; Van Noorden, G.E.; Budde, M.A.; Szengyel, Z.; Réczey, K.; Claassen, P.A. Yields from glucose, xylose, and paper sludge hydrolysate during hydrogen production by the extreme thermophile Caldicellulosiruptor saccharolyticus. In Proceedings of the 25th Symposium on Biotechnology for Fuels and Chemicals, Breckenridge, CO, USA, 4–7 May 2003; pp. 497–508. [Google Scholar]
- Benjamin, M.M.; Woods, S.L.; Ferguson, J.F. Anaerobic toxicity and biodegradability of pulp mill waste constituents. Water Res. 1984, 18, 601–607. [Google Scholar] [CrossRef]
- Divya, D.; Gopinath, L.R.; Merlin Christy, P. A review on current aspects and diverse prospects for enhancing biogas production in sustainable means. Renew. Sustain. Energy Rev. 2015, 42, 690–699. [Google Scholar] [CrossRef]
- Yang, L.; Xu, F.; Ge, X.; Li, Y. Challenges and strategies for solid-state anaerobic digestion of lignocellulosic biomass. Renew. Sustain. Energy Rev. 2015, 44, 824–834. [Google Scholar] [CrossRef]
- Feng, J.; Zhang, J.; Zhang, J.; He, Y.; Zhang, R.; Chen, C.; Liu, G. Enhanced methane production of vinegar residue by response surface methodology (RSM). AMB Express 2017, 7, 89. [Google Scholar] [CrossRef] [Green Version]
- Feng, L.; Li, Y.; Chen, C.; Liu, X.; Xiao, X.; Ma, X.; Zhang, R.; He, Y.; Liu, G. Biochemical methane potential (BMP) of vinegar residue and the influence of feed to inoculum ratios on biogas production. Bioresources 2013, 8, 2487–2498. [Google Scholar] [CrossRef]
- Laird, D.A.; Brown, R.C.; Amonette, J.E.; Lehmann, J. Review of the pyrolysis platform for coproducing bio-oil and biochar. Biofuels Bioprod. Biorefin. 2009, 3, 547–562. [Google Scholar] [CrossRef]
- Costa, A.G.; Pinheiro, G.C.; Pinheiro, F.G.C.; Dos Santos, A.B.; Santaella, S.T.; Leitão, R.C. The use of thermochemical pretreatments to improve the anaerobic biodegradability and biochemical methane potential of the sugarcane bagasse. Chem. Eng. J. 2014, 248, 363–372. [Google Scholar] [CrossRef]
- Phuttaro, C.; Sawatdeenarunat, C.; Surendra, K.C.; Boonsawang, P.; Chaiprapat, S.; Khanal, S.K. Anaerobic digestion of hydrothermally-pretreated lignocellulosic biomass: Influence of pretreatment temperatures, inhibitors and soluble organics on methane yield. Bioresour. Technol. 2019, 284, 128–138. [Google Scholar] [CrossRef] [PubMed]
- Ghimire, N.; Bakke, R.; Bergland, W.H. Thermophilic Methane Production from Hydrothermally Pretreated Norway Spruce (Picea abies). Appl. Sci. 2020, 10, 4989. [Google Scholar] [CrossRef]
- Overend, R.P.; Chornet, E. Fractionation of lignocellulosics by steam-aqueous pretreatments. Philos. Trans. R. Soc. Lond. Ser. A Math. Phys. Sci. 1987, 321, 523–536. [Google Scholar]
- Liu, S. A synergetic pretreatment technology for woody biomass conversion. Appl. Energy 2015, 144, 114–128. [Google Scholar] [CrossRef]
- Nitsos, C.K.; Choli-Papadopoulou, T.; Matis, K.A.; Triantafyllidis, K.S. Optimization of Hydrothermal Pretreatment of Hardwood and Softwood Lignocellulosic Residues for Selective Hemicellulose Recovery and Improved Cellulose Enzymatic Hydrolysis. ACS Sustain. Chem. Eng. 2016, 4, 4529–4544. [Google Scholar] [CrossRef]
- Baeta, B.E.; Luna, H.J.; Sanson, A.L.; Silva, S.Q.; Aquino, S.F. Degradation of a model azo dye in submerged anaerobic membrane bioreactor (SAMBR) operated with powdered activated carbon (PAC). J. Environ. Manag. 2013, 128, 462–470. [Google Scholar] [CrossRef] [Green Version]
- Badshah, M.; Lam, D.M.; Liu, J.; Mattiasson, B. Use of an Automatic Methane Potential Test System for evaluating the biomethane potential of sugarcane bagasse after different treatments. Bioresour. Technol. 2012, 114, 262–269. [Google Scholar] [CrossRef]
- Ostgaard, K.; Kowarz, V.; Shuai, W.; Henry, I.A.; Sposob, M.; Haugen, H.H.; Bakke, R. Syringe test screening of microbial gas production activity: Cases denitrification and biogas formation. J. Microbiol. Methods 2017, 132, 119–124. [Google Scholar] [CrossRef]
- Zwietering, M.H.; Jongenburger, I.; Rombouts, F.M.; van’t Riet, K. Modeling of the bacterial growth curve. Appl. Environ. Microbiol. 1990, 56, 1875–1881. [Google Scholar] [CrossRef] [Green Version]
- He, L.; Huang, H.; Zhang, Z.; Lei, Z.; Lin, B.-L. Energy Recovery from Rice Straw through Hydrothermal Pretreatment and Subsequent Biomethane Production. Energy Fuels 2017, 31, 10850–10857. [Google Scholar] [CrossRef]
- Ribeiro, F.R.; Passos, F.; Gurgel, L.V.A.; Baeta, B.E.L.; de Aquino, S.F. Anaerobic digestion of hemicellulose hydrolysate produced after hydrothermal pretreatment of sugarcane bagasse in UASB reactor. Sci. Total Environ. 2017, 584–585, 1108–1113. [Google Scholar] [CrossRef] [PubMed]
- Fernandez-Cegri, V.; Angeles De la Rubia, M.; Raposo, F.; Borja, R. Effect of hydrothermal pretreatment of sunflower oil cake on biomethane potential focusing on fibre composition. Bioresour. Technol. 2012, 123, 424–429. [Google Scholar] [CrossRef]
- Koyama, M.; Yamamoto, S.; Ishikawa, K.; Ban, S.; Toda, T. Inhibition of anaerobic digestion by dissolved lignin derived from alkaline pre-treatment of an aquatic macrophyte. Chem. Eng. J. 2017, 311, 55–62. [Google Scholar] [CrossRef]
- Monlau, F.; Sambusiti, C.; Barakat, A.; Quemeneur, M.; Trably, E.; Steyer, J.P.; Carrere, H. Do furanic and phenolic compounds of lignocellulosic and algae biomass hydrolyzate inhibit anaerobic mixed cultures? A comprehensive review. Biotechnol. Adv. 2014, 32, 934–951. [Google Scholar] [CrossRef] [PubMed]
- Mussatto, S.I.; Roberto, I.C. Alternatives for detoxification of diluted-acid lignocellulosic hydrolyzates for use in fermentative processes: A review. Bioresour. Technol. 2004, 93, 1–10. [Google Scholar] [CrossRef] [PubMed]
- Taherzadeh, M.J.; Gustafsson, L.; Niklasson, C.; Lidén, G. Conversion of furfural in aerobic and anaerobic batch fermentation of glucose by Saccharomyces cerevisiae. J. Biosci. Bioeng. 1999, 87, 169–174. [Google Scholar] [CrossRef]
- Garrote, G.; Dominguez, H.; Parajo, J.C. Hydrothermal processing of lignocellulosic material. Holz Roh Werkst. 1999, 57, 191–202. [Google Scholar] [CrossRef]
- Barakat, A.; Monlau, F.; Steyer, J.P.; Carrere, H. Effect of lignin-derived and furan compounds found in lignocellulosic hydrolysates on biomethane production. Bioresour. Technol. 2012, 104, 90–99. [Google Scholar] [CrossRef]
- Li, W.; Khalid, H.; Zhu, Z.; Zhang, R.; Liu, G.; Chen, C.; Thorin, E. Methane production through anaerobic digestion: Participation and digestion characteristics of cellulose, hemicellulose and lignin. Appl. Energy 2018, 226, 1219–1228. [Google Scholar] [CrossRef]
- Jimenez, S.; Cartagena, M.C.; Arce, A. Influence of lignin on the methanization of lignocellulosic wastes. Biomass 1990, 21, 43–54. [Google Scholar] [CrossRef]
- Benner, R.; Maccubbin, A.; Hodson, R.E. Anaerobic biodegradation of the lignin and polysaccharide components of lignocellulose and synthetic lignin by sediment microflora. Appl. Environ. Microbiol. 1984, 47, 998–1004. [Google Scholar] [CrossRef] [PubMed] [Green Version]
- Barakat, A.; Gaillard, C.; Steyer, J.-P.; Carrere, H. Anaerobic Biodegradation of Cellulose–Xylan–Lignin Nanocomposites as Model Assemblies of Lignocellulosic Biomass. Waste Biomass Valoriz. 2013, 5, 293–304. [Google Scholar] [CrossRef]
- Kleinheinz, G.; Hernandez, J. Comparison of two laboratory methods for the determination of biomethane potential of organic feedstocks. J. Microbiol. Methods 2016, 130, 54–60. [Google Scholar] [CrossRef] [PubMed]
- Parajuli, P. Biogas Measurement Techniques and the Associated Errors; University of Jyväskylä: Jyväskylä, Finland, 2011. [Google Scholar]
- Koch, K.; Hafner, S.D.; Weinrich, S.; Astals, S. Identification of Critical Problems in Biochemical Methane Potential (BMP) Tests from Methane Production Curves. Front. Environ. Sci. 2019, 7. [Google Scholar] [CrossRef]
Figure 1.
Modified Gompertz model (Equation (2)) fitted with cumulative methane yield of hydrolysates (real and synthetic) from AMPTS II. COD = chemical oxygen demand.
Figure 1.
Modified Gompertz model (Equation (2)) fitted with cumulative methane yield of hydrolysates (real and synthetic) from AMPTS II. COD = chemical oxygen demand.

Figure 2.
Methane yield of H140 at mesophilic conditions under different organic load (OL). COD = chemical oxygen demand.
Figure 2.
Methane yield of H140 at mesophilic conditions under different organic load (OL). COD = chemical oxygen demand.

Figure 3.
Methane yield of H170 at mesophilic conditions under different organic load (OL). COD = chemical oxygen demand.
Figure 3.
Methane yield of H170 at mesophilic conditions under different organic load (OL). COD = chemical oxygen demand.

Figure 4.
Methane yield of H140 and H170 at different organic loads (OLs) in syringes. Yields from AMPTS II is also added for comparison. COD = chemical oxygen demand.
Figure 4.
Methane yield of H140 and H170 at different organic loads (OLs) in syringes. Yields from AMPTS II is also added for comparison. COD = chemical oxygen demand.

Figure 5.
Methane content in biogas produced at different organic loads (OLs) over time in syringes H140. COD = chemical oxygen demand.
Figure 5.
Methane content in biogas produced at different organic loads (OLs) over time in syringes H140. COD = chemical oxygen demand.

Figure 6.
Methane content in biogas produced at varying organic loads (OLs) with time in syringes fed H170. COD = chemical oxygen demand.
Figure 6.
Methane content in biogas produced at varying organic loads (OLs) with time in syringes fed H170. COD = chemical oxygen demand.


Table 1.
Content of synthetic hydrolysate. (chemical oxygen demand) COD, chemical oxygen demand.
| Parameters | H140syn | H170syn |
|---|---|---|
| Soluble COD (g CODs/L) | 12.6 | 20.7 |
| Arabinose (g/L) | 1.63 | 0.81 |
| Galactose (g/L) | 1.67 | 2.17 |
| Glucose (g/L) | 1.55 | 3.00 |
| Xylose (g/L) | 1.95 | 2.24 |
| Mannose (g/L) | 5.11 | 10.39 |
| Acetic acid (g/L) | 0.59 | 1.03 |
| pH | 3.14 | 3.07 |
Table 2.
Organic load (OL) of hydrolysates (real and synthetic) in an automatic methane potential testing system (AMPTS II) test.
Table 2.
Organic load (OL) of hydrolysates (real and synthetic) in an automatic methane potential testing system (AMPTS II) test.
| Sample | Inoculum (mL) | Substrate (mL) | OL (g CODt/L) | Parallels |
|---|---|---|---|---|
| H140 | 200 | 200 | 20 | 3 |
| H170 | 240 | 160 | 20 | 3 |
| H140syn | 160 | 240 | 20 | 3 |
| H170syn | 200 | 200 | 20 | 3 |
| Control (Blank) | 240 | 160 (DW) | - | 3 |
DW, distilled water.
Table 3.
OL of real hydrolysates in batch syringes.
| Sample | Inoculum (mL) | Substrate (mL) | OL (g CODt/L) | Parallels |
|---|---|---|---|---|
| H140 | 15 | 4 | 6 | 3 |
| H140 | 15 | 6.7 | 10 | 3 |
| H140 | 15 | 13.4 | 20 | 3 |
| H140 | 15 | 20 | 30 | 3 |
| H170 | 15 | 3 | 6 | 3 |
| H170 | 15 | 5 | 10 | 3 |
| H170 | 15 | 10 | 20 | 3 |
| H170 | 15 | 15 | 30 | 3 |
| Control (Blank) | 15 | 10 (DW) | - | 3 |
DW, distilled water.
Table 4.
Initial pH values, end AMPTS II liquid characteristics, and methane yield. VFA, volatile fatty acids.
Table 4.
Initial pH values, end AMPTS II liquid characteristics, and methane yield. VFA, volatile fatty acids.
| Samples | Initial pH | End pH | Initial CODs mg/L (Feed Only) | End CODs mg/L (Feed and Inoculum) | End Acetic Acid (mg/L) | End Propionic Acid (mg/L) | End Total VFA (mg/L) | Methane Yield (g COD/g COD) |
|---|---|---|---|---|---|---|---|---|
| H140 | 6.1 | 6.9 ± 0.0 | 20,000 | 1933 ± 63 | ND | ND | ND | 0.60 ± 0.02 |
| H170 | 5.9 | 7.0 ± 0.1 | 20,000 | 1723 ± 62 | ND | ND | ND | 0.41 ± 0.00 |
| H140syn | 6.1 | 7.6 ± 0.1 | 20,000 | 1670 ± 216 | ND | ND | ND | 0.74 ± 0.01 |
| H170syn | 6.0 | 7.7 ± 0.1 | 20,000 | 2313 ± 68 | ND | ND | ND | 0.72 ± 0.02 |
ND, not detected.
Table 5.
Model parameters by the modified Gompertz model from cumulative methane production.
| Samples | G0 (NmL CH4/g COD) | Rmax (NmL CH4/(g COD d)) | λ (d) | R2 | Cumulative Methane Yield (NmL/g COD) |
|---|---|---|---|---|---|
| H140 | 211 | 79 | 0.04 | 0.958 | 210 |
| H170 | 146 | 78 | 0.44 | 0.931 | 148 |
| H140syn | 288 | 13 | 1.27 | 0.860 | 260 |
| H170syn | 284 | 12 | 1.99 | 0.863 | 252 |
Table 6.
Weighted average and final methane content of biogas in syringes.
| OL (g COD/L) | Weighted Average H140 | Final H140 | Weighted Average H170 | Final H170 |
|---|---|---|---|---|
| 6 | 63.6 ± 0.8 | 83.9 ± 0.6 | 64.7 ± 0.5 | 85.4 ± 0.7 |
| 10 | 57.8 ± 5.5 | 80.0 ± 6.9 | 63.8 ± 3.8 | 84.6 ± 7.5 |
| 20 | 64.5 ± 1.1 | 80.1 ± 5.4 | 76.5 ± 1 | 82.2 ± 2.1 |
| 30 | 65.3 ± 1.7 | 80.5 ± 2.4 | 72.9 ± 1.0 | 76.1 ± 2.5 |
Publisher’s Note: MDPI stays neutral with regard to jurisdictional claims in published maps and institutional affiliations. |
© 2021 by the authors. Licensee MDPI, Basel, Switzerland. This article is an open access article distributed under the terms and conditions of the Creative Commons Attribution (CC BY) license (http://creativecommons.org/licenses/by/4.0/).
Share and Cite
MDPI and ACS Style
Ghimire, N.; Bakke, R.; Bergland, W.H. Mesophilic Anaerobic Digestion of Hydrothermally Pretreated Lignocellulosic Biomass (Norway Spruce (Picea abies)). Processes 2021, 9, 190. https://doi.org/10.3390/pr9020190
AMA Style
Ghimire N, Bakke R, Bergland WH. Mesophilic Anaerobic Digestion of Hydrothermally Pretreated Lignocellulosic Biomass (Norway Spruce (Picea abies)). Processes. 2021; 9(2):190. https://doi.org/10.3390/pr9020190
Chicago/Turabian StyleGhimire, Nirmal, Rune Bakke, and Wenche Hennie Bergland. 2021. "Mesophilic Anaerobic Digestion of Hydrothermally Pretreated Lignocellulosic Biomass (Norway Spruce (Picea abies))" Processes 9, no. 2: 190. https://doi.org/10.3390/pr9020190
Note that from the first issue of 2016, this journal uses article numbers instead of page numbers. See further details here.