Article

Correlation between Microstructures and Ductility Parameters of Cold Drawn Hyper-Eutectoid Steel Wires with Different Drawing Strains and Post-Deformation Annealing Conditions

1
School of Advanced Materials Engineering, Kookmin University, Seoul 02707, Korea
2
KISWIRE R&D Center, Pohang 37872, Gyeongbuk, Korea
*
Author to whom correspondence should be addressed.
Metals 2021, 11(2), 178; https://doi.org/10.3390/met11020178
Submission received: 4 December 2020 / Revised: 3 January 2021 / Accepted: 18 January 2021 / Published: 20 January 2021
(This article belongs to the Special Issue Heat Treatment of Steels)

Abstract

:
The relationship between microstructures and ductility parameters, including reduction of area, elongation to failure, occurrence of delamination, and number of turns to failure in torsion, in hypereutectoid pearlitic steel wires was investigated. The transformed steel wires at 620 °C were successively dry-drawn to drawing strains from 0.40 to 2.38. To examine the effects of hot-dip galvanizing conditions, post-deformation annealing was performed on cold drawn steel wires (ε = 0.99, 1.59, and 2.38) with a different heating time of 30–3600 s at 500 °C in a salt bath. In cold drawn wires, elongation to failure dropped due to the formation of dislocation substructures, decreased slowly due to the increase of dislocation density, and saturated with drawing strain. During annealing, elongation to failure increased due to recovery, and saturated with annealing time. The variation of elongation to failure in cold drawn and annealed steel wires would depend on the distribution of dislocations in lamellar ferrite. The orientation of lamellar cementite and the shape of cementite particles would become an effective factor controlling number of turns to failure in torsion of cold drawn and annealed steel wires. The orientation and shape of lamellar cementite would become microstructural features controlling reduction of area of cold drawn and annealed steel wires. The density of dislocations contributed to reduction of area to some extent.

1. Introduction

The increase of the deformation limit in the steel wire industry has an advantage of obtaining a high strength level and eliminating the lead patenting process. The recent improvement of strength in steel wires has achieved a high strength above 5 GPa in steel cords for automobile tires and above 2 GPa in cable wires for suspension bridge. In cold drawn steel wires, high strength has been achieved by the refinement of interlamellar spacing [1,2,3], the increase of drawing strain [4,5,6], the increase of carbon content [7,8,9], and the addition of alloying elements [10,11,12]. However, the increase of strength generally accompanies the deterioration of ductility in cold drawn steel wires. For the development of high strength steel wire, the important subject becomes how to increase the strength of steel wires without a significant loss of ductility. The manufacturing process of wire products includes bending, stranding, stretching, and coiling, etc. Thus, ductility parameters required for steel wire products are the reduction of area, elongation to failure, occurrence of delamination, and number of turns to failure in torsion. Occurrence of delamination acts as an indicator of brittle fracture, splitting longitudinally along the wire axis during torsion. On the other hand, the number of turns to failure reflects the gradual variation of torsional ductility with manufacturing conditions of steel wires [13,14]. Thus, both occurrence of delamination (DEL) and number of turns to failure (NT) could become good parameters to evaluate torsional ductility of steel wire products.
In cold drawn steel wires, the increase of drawing strain decreases elongation to failure (EL) and increases tensile strength (TS) [15,16], while the reduction of area (RA) and number of turns to failure in torsion (NT) show the sequential variation; increasing, showing the maximum peak, and decreasing continuously [17,18]. These mechanical behaviors are closely related to microstructural evolution occurred during wire drawing. The main features of microstructural evolution during wire drawing are a progressive realignment of lamellar cementite along the drawing axis [19,20,21], a reduction of interlamellar spacing, a thinning of lamellar cementite and ferrite, a fracture, and dissolution of lamellar cementite [22,23,24]. Recently, the decomposition of cementite and the subsequent distribution of carbon atoms in heavily drawn wires were directly observed using a high resolution transmission electron microscopy (HRTEM) and an atom probe tomography (APT). While the relationship between microstructural evolution during wire drawing and mechanical properties of TS and RA in cold drawn steel wires has been widely investigated [24,25,26], the main microstructural features controlling other ductility parameters, which are related to the total amount of deformation in the manufacturing process, remain unclear until now.
Meanwhile, the manufacturing process of wire products includes post-deformation annealing, such as bluing for wires for tire bead, hot-dip galvanizing for suspension bridge cables, or stress-relief annealing for coil springs. Since the degree of age hardening or age softening depends on drawing and annealing conditions, post-deformation annealing conditions alter strength, and ductility of steel wire products through microstructural evolution during annealing. Age hardening proceeds with the break-up and decomposition of lamellar cementite, the diffusion of carbon atoms to dislocations, and the pinning of dislocations by carbon atoms in lamellar ferrite [27,28]. The mechanism of age softening is described as the break-up and spheroidization of lamellar cementite, the growth of cementite particles, the reprecipitation of cementite particles, and the recovery or recrystallization of ferrite [28,29,30]. Thus, post-deformation annealing conditions and drawing conditions contribute significantly to strength and ductility of steel wire products. Several works about the evaluations of TS, DEL, and NT with different annealing conditions were reported [31,32,33]. However, those works merely focused on microstructures and mechanical properties with the variations of annealing conditions. Thus, to improve ductility of cold drawn and annealed steel wires, the variations of ductility with drawing strain and annealing conditions need to be explained in terms of microstructural features.
In the present work, the effects of microstructural features on ductility with the variations of drawing strain and annealing time in hypereutectoid steel wires cold drawn and annealed at 500 °C. Particularly, the present work focused on the relationship between microstructural evolution during wire drawing and subsequent annealing processes and ductility parameters of EL, RA, DEL, and NT in hypereutectoid pearlitic steel wires.

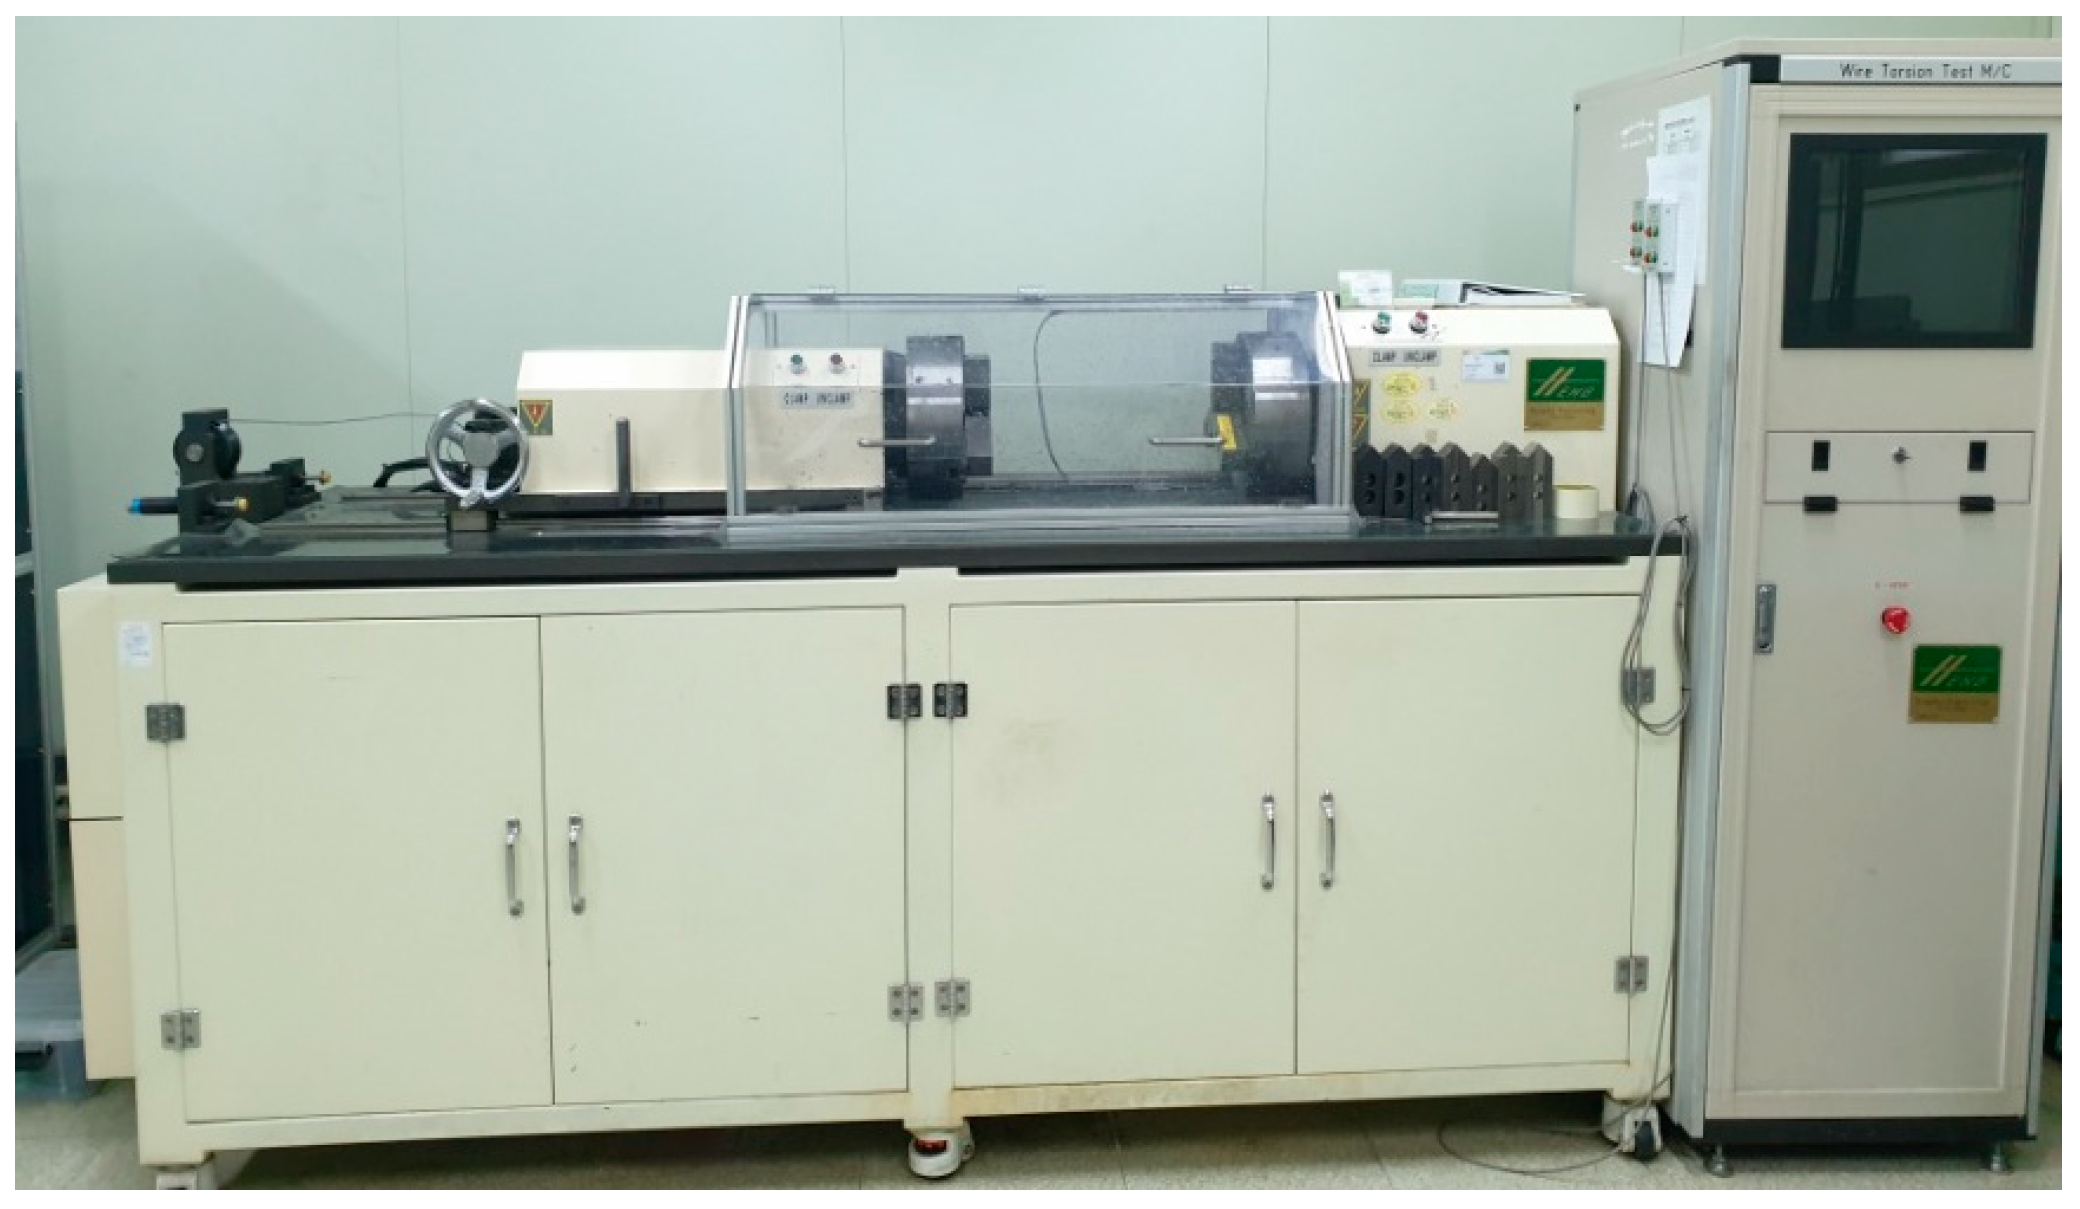
2. Materials and Methods
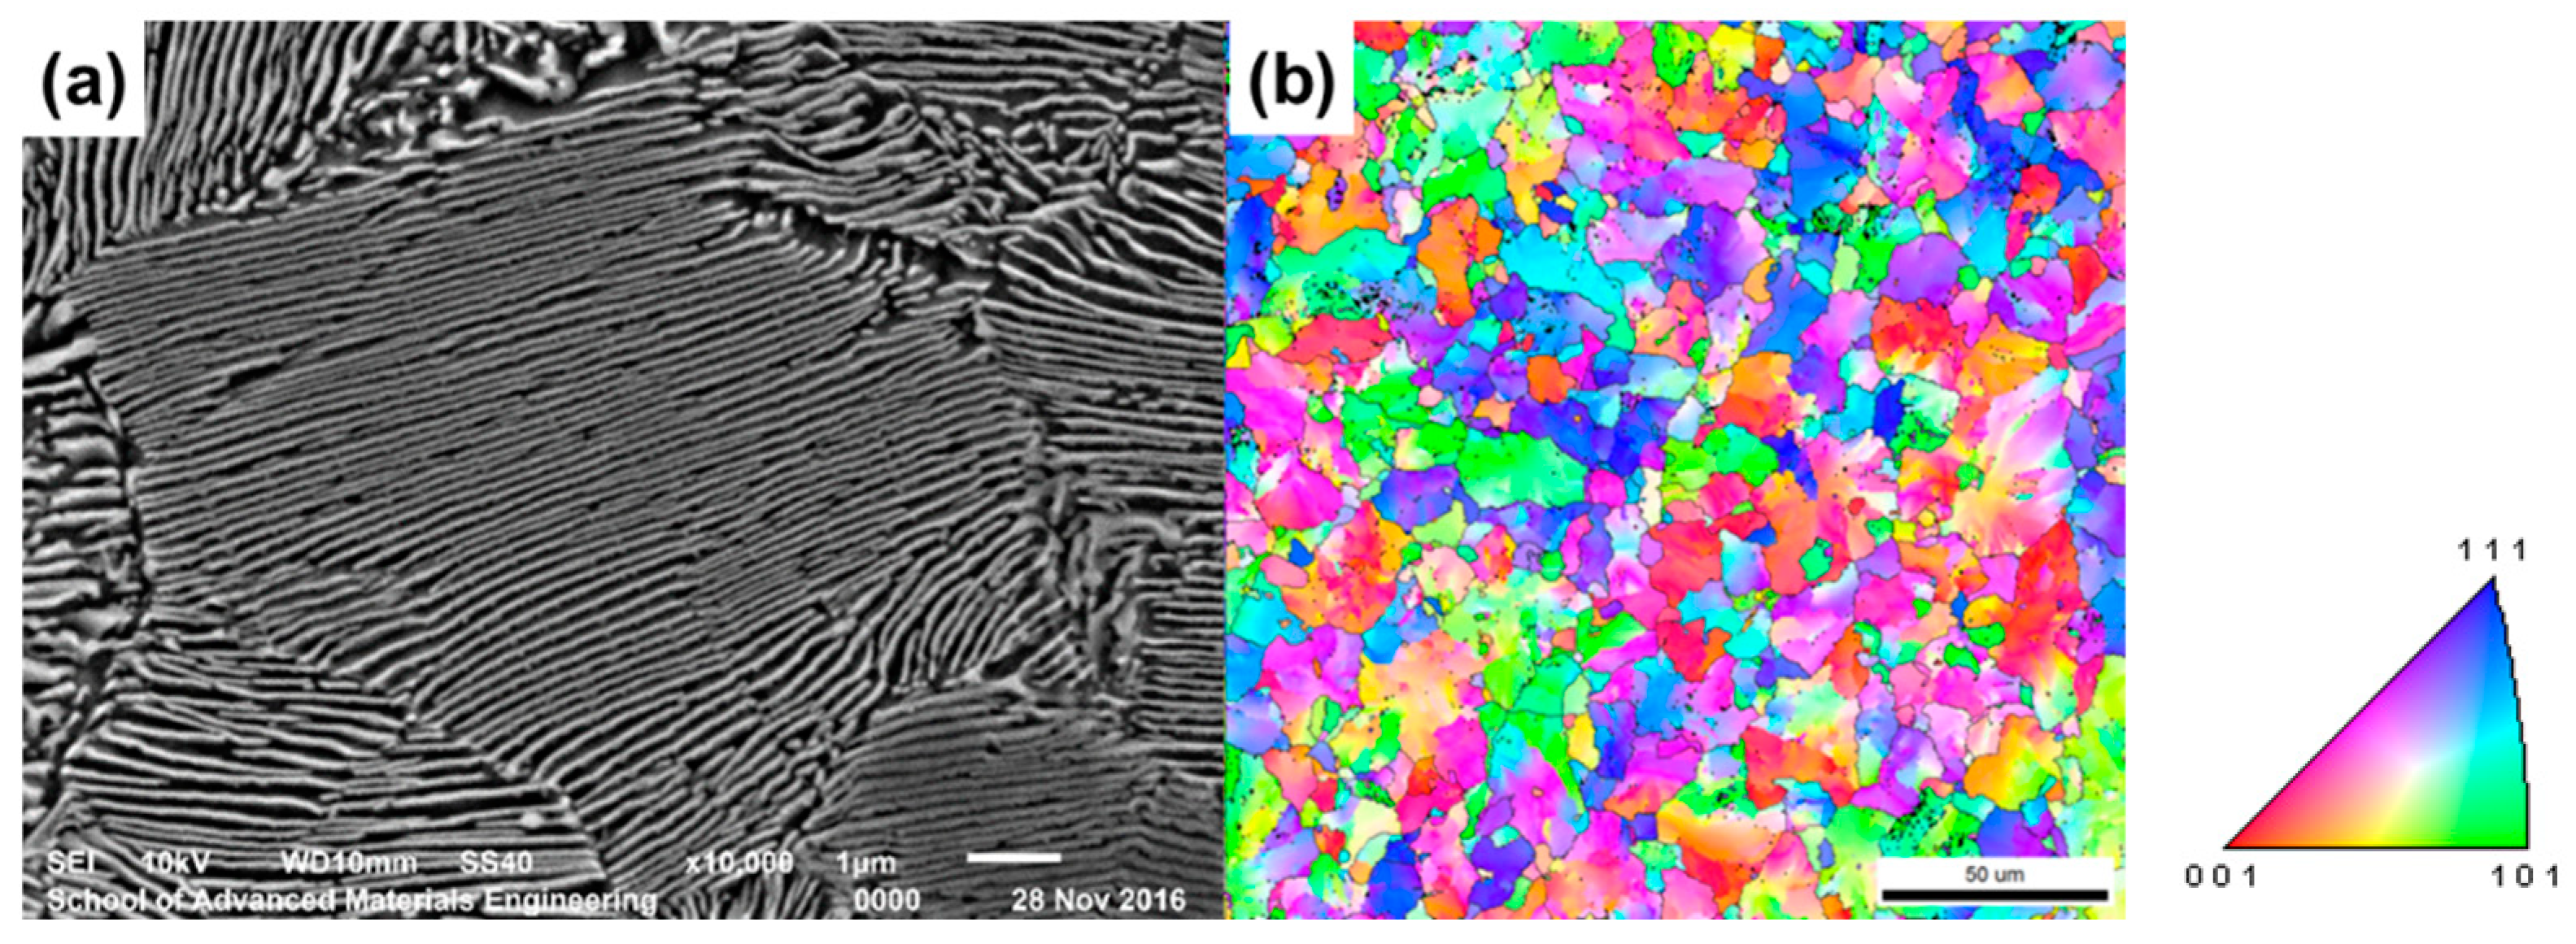
The chemical composition of steel wire rods used in this work is Fe-0.92%C-1.3%Si-0.5%Mn-0.3%Cr (wt %). Hot rolled and Stelmor-cooled wire rods with a diameter of 13 mm were cold-drawn to 4.9 mm in diameter. To investigate the effects of the drawing strain and annealing time on tensile strength and ductility, the 4.9 mm-diameter wires were austenitized at 900 °C for 3 min, followed by quenching in a salt bath at 620 °C for 3 min. The transformed wires were pickled and successively dry-drawn to wires with various final diameters from 4.02 (ε = 0.40) to 1.49 mm (ε = 2.38) as shown in Table 1. Drawing speed was set to 3 m/min to avoid dynamic strain aging, and the average reduction per pass was about 18%. Additionally, to investigate the effects of hot-dip galvanizing conditions on mechanical properties, post-deformation annealing was performed on cold drawn steel wires (ε = 0.99, 1.59, and 2.38) with different heating time of 30 s, 2 min, 20 min, and 1 h at a temperature of 500 °C in a salt bath.
Tensile strength of steel wires was determined by tensile tests at room temperature with a constant speed of 20 mm/min. Elongation to failure was measured with an extensometer.
To examine torsional ductility, torsion tests were carried out as free-end twist tests at a rotational speed of 30 r.p.m. The torsion test machine (Hongduk Eng., Busan, Korea) (Figure 1) equipped with torque sensors. The length of cold drawn steel wires was chosen as 200 mm. Tension was applied to the specimen by using a weight of 1% of the maximum tensile load of the wire. During torsion testing, the occurrence of delamination was evaluated by assessing NT or examining the shape of fracture surfaces.
For detailed understanding of microstructural evolution during annealing, a scanning electron microscope (SEM, JEOL Ltd., Tokyo, Japan), and a transmission electron microscope (TEM, JEOL Ltd., Tokyo, Japan) were used. Thin foils parallel to the longitudinal cross section of the wire were prepared by utilizing a jet polishing technique in a mixture of 90% acetic acid and 10% perchloric acid at room temperature. In order to measure the block size of a steel wire transformed at 620 °C, the longitudinal section of a steel wire was grinded with silicon carbide papers and electropolished. The inverse pole figure (IPF) color maps of steel wires were examined by using electron backscatter diffraction (EBSD, JEOL Ltd., Tokyo, Japan). Microstructure and IPF map of an isothermal transformed steel wire are shown in Figure 2. The average lamellar spacing of pearlite was 72.6 nm, the average size of block, consisting of colonies with the misorientation less than 15°, was 11.6 μm.

3. Results

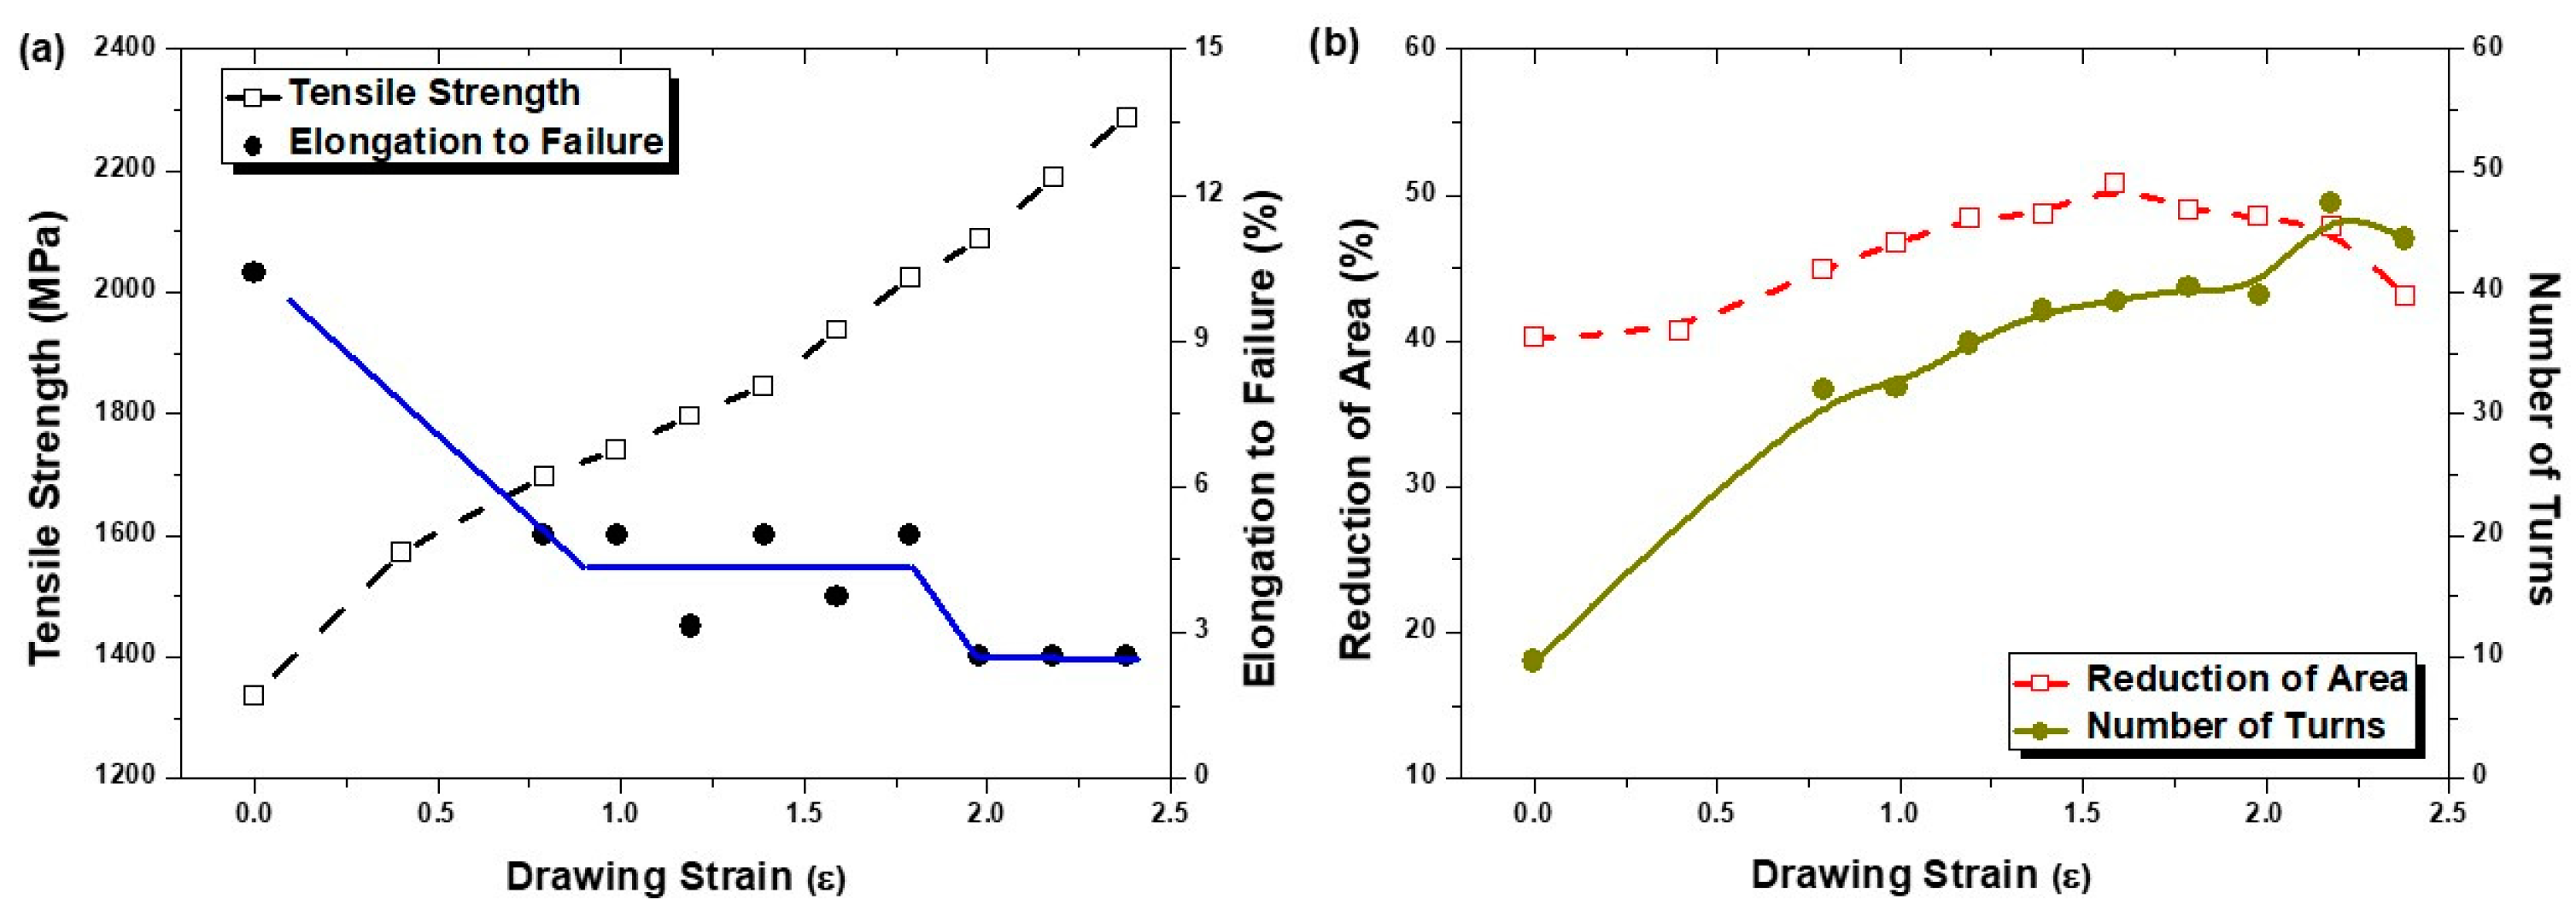
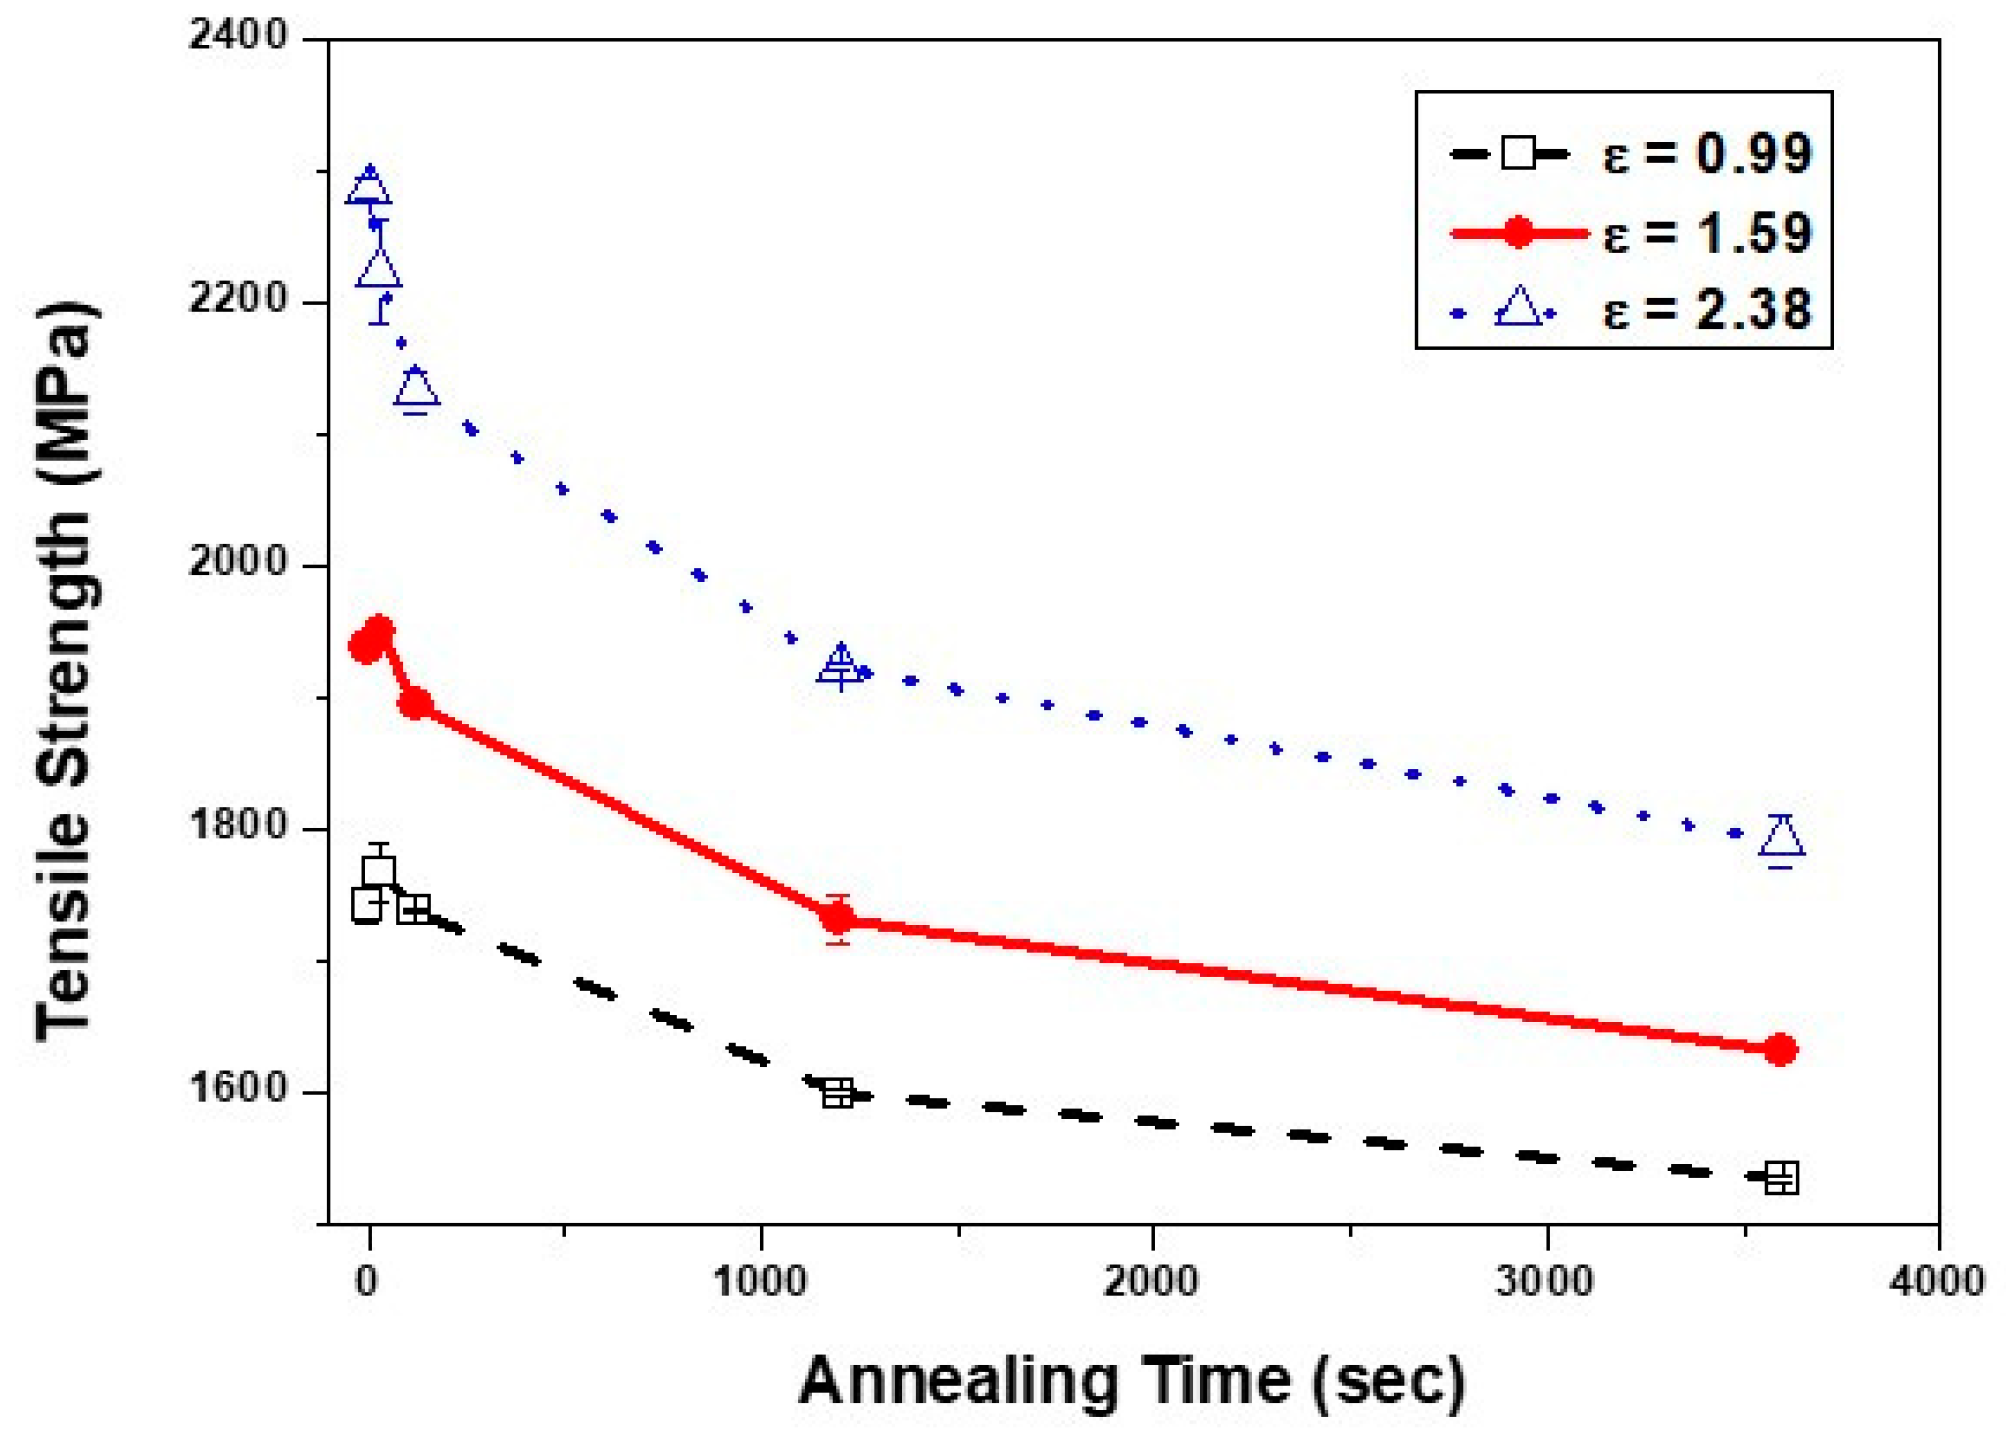
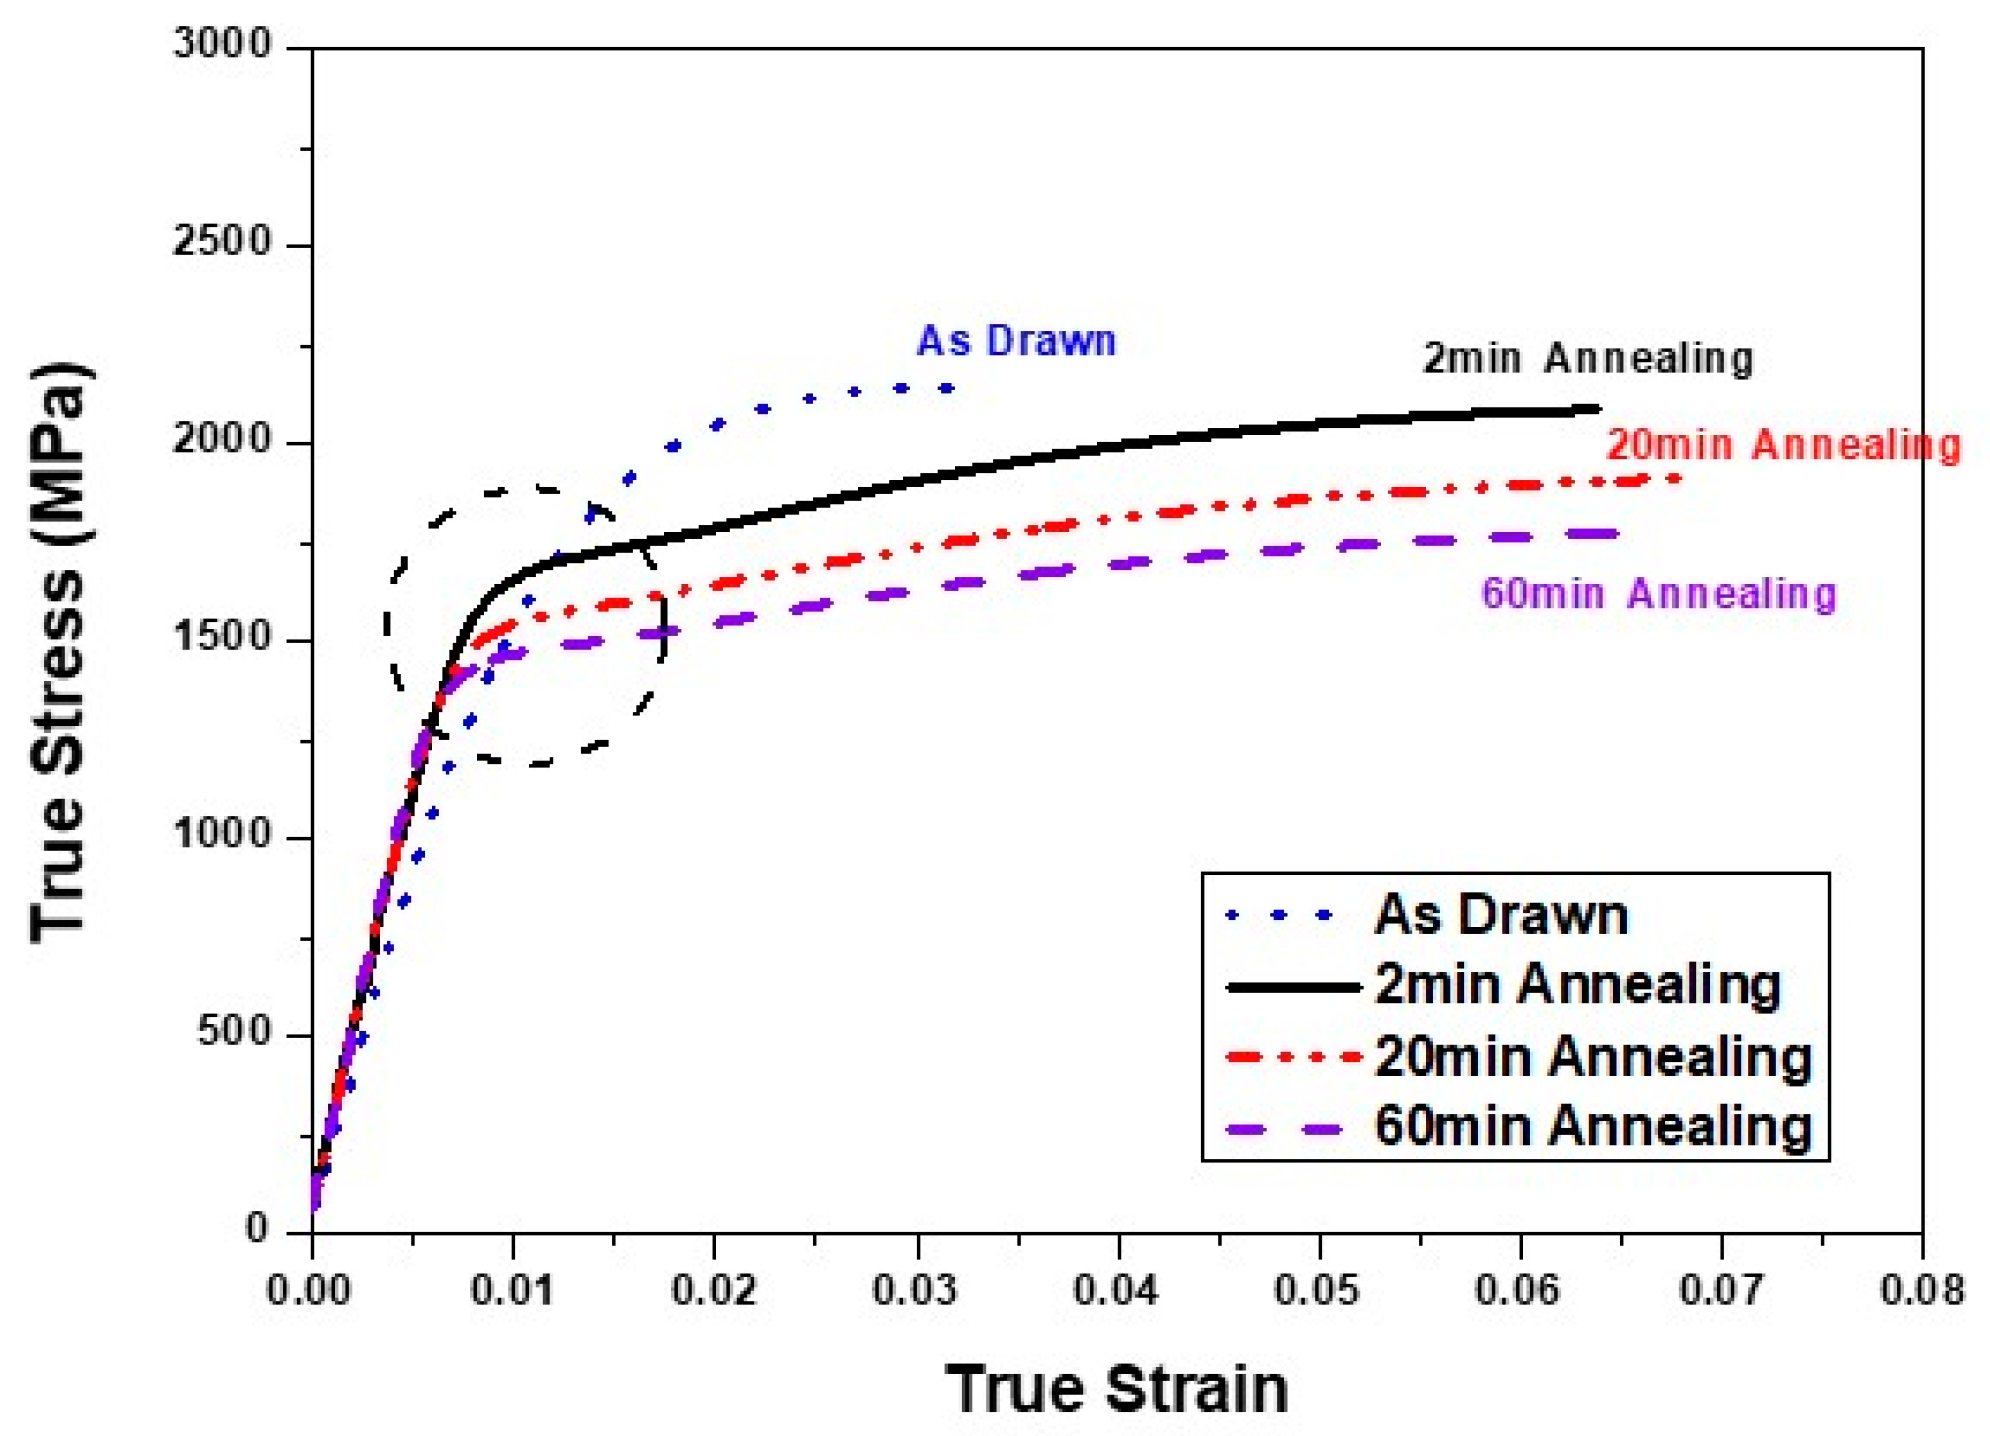
3.1. Tensile Strength

In Figure 3a, a drawing strain of 2.38 increased TS continuously from 1335 (as-transformed) to 2287 MPa, due to work hardening of lamellar ferrite and solid solution hardening of carbon atoms dissolved in lamellar ferrite, which was caused by the occurrence of dynamic strain aging. According to Zhang et al. [34], TS of cold drawn pearlitic steel wires can be expressed with the following strengthening mechanisms: (1) boundary strengthening, which represents the refinement of interlamellar spacing; (2) strain hardening of ferrite; and (3) solid solution hardening due to the increased amount of carbon atoms dissolved in lamellar ferrite. The process of dynamic strain aging consists of the fracture and decomposition of lamellar cementite, and the interaction of dissolved carbon atoms with dislocations in lamellar ferrite during deformation [23,25,27]. The rapid increase of TS above a drawing strain of 1.5 in Figure 3a was attributed to the increased solid solution hardening of carbon atoms at high strain and the efficient work hardening of completely realigned lamellae along the wire axis, compared with the less work hardening during the progressive realignment of randomly oriented lamellae at low strain. The increase of TS during wire drawing was attributed to strain hardening of lamellar ferrite and solid solution hardening of dissolved carbon atoms by dynamic strain aging.
TS of cold drawn and annealed steel wires reflects the degree of age hardening or age softening during post-deformation annealing. While age hardening and age softening occur simultaneously at low annealing temperature or for a short annealing time, the increases of annealing temperature and time make age softening become the main operating mechanism during annealing. Figure 4 shows the effects of drawing strain and annealing time on TS of steel wires cold drawn and annealed at 500 °C. The different drawing strains in cold drawn steel wires provided two different typed TS curves. For steel wires received strains of 0.99 and 1.59, the variation of TS with annealing time showed the sequential behaviors; increasing, showing the peak, and decreasing continuously after the peak. For cold drawn steel wires with ε = 1.59, TS increased from 1938 to 1951 MPa (30 s annealing), and then decreased to 1632 MPa (1 h annealing). The increment of TS for a short annealing time of 30 s was due to age hardening. Age hardening during annealing consists of two stages; the segregation of carbon atoms to dislocations in ferrite and a partial decomposition of lamellar cementite [28]. The partial dissolution of lamellar cementite, the diffusion of carbon atoms into lamellar ferrite and the interaction with dislocations would be responsible to the increase of TS during annealing. Thus, the increase of TS for 30 s annealing (13 MPa) would be attributed to the occurrence of age hardening, which corresponds to the solid solution hardening. Takahashi et al. [9] showed that the occurrence of the maximum TS during aging would be closely related to the decomposition of lamellar cementite in cold drawn hypereutectoid steel wires, using the field ion micrograph (FIM). However, as annealing time increased, lamellar cementite started to spheroidize. Additionally, the occurrence of recovery in ferrite led to the decrease of TS. Accordingly, TS decreased continuously with the increased contribution of age softening with annealing time.
Meanwhile, for steel wires with a drawing strain above 2.38, TS decreased continuously from 2287 (as-drawn) to 1791 MPa (1 h annealing). The continuous decrease of TS with annealing time in Figure 3 indicates that age hardening does not occur during annealing for steel wires cold drawn to ε = 2.38. Li et al. [25] have reported that the carbon concentration in lamellar ferrite saturates at the critical strain and above the critical strain the decomposition of lamellar cementite does not proceed in their work. Thus, it is expected that there exists a limit of the carbon content dissolved in lamellar ferrite, which corresponds to the specific drawing strain or TS that no more age hardening occurs during post-deformation annealing. During annealing, the severe fracture of lamellar cementite and the high concentration of carbon atoms in lamellar ferrite in cold drawn steel wires would encourage the age softening process; spheroidizing and reprecipitation of cementite particles, and recovery of ferrite, rather than age hardening even for a short annealing time.
It is interesting to note that the degree of age softening during annealing in Figure 4 was significantly influenced by the amount of drawing strains in cold drawn steel wires. A steel wire with ε = 2.38 showed the larger decrease of TS, 496 MPa, than that with ε = 0.99, 208 MPa, for 1 h annealing. The more damage and fracture in lamellar cementite and the higher dislocation density in cold drawn steel wires received the higher drawing strain that would accelerate the age softening process during annealing. Thus, annealing of a steel wire that received a high drawing strain showed the larger decrease of TS than that with a low drawing strain.
During post-deformation annealing, TS of steel wires with a high drawing strain decreased continuously with annealing time, since age softening, such as the fracture and spheroidization of lamellar cementite, the growth of cementite particles, and the recovery of lamellar ferrite, became the major process to control TS. Meanwhile, steel wires with low drawing strain showed the sequential variation of TS; increasing, showing the peak, and decreasing continuously with annealing time. The increment of TS for a short annealing time was due to the occurrence of age hardening, which was related to the decomposition of lamellar cementite and the interaction of dislocations with carbon atoms dissolved in lamellar ferrite.

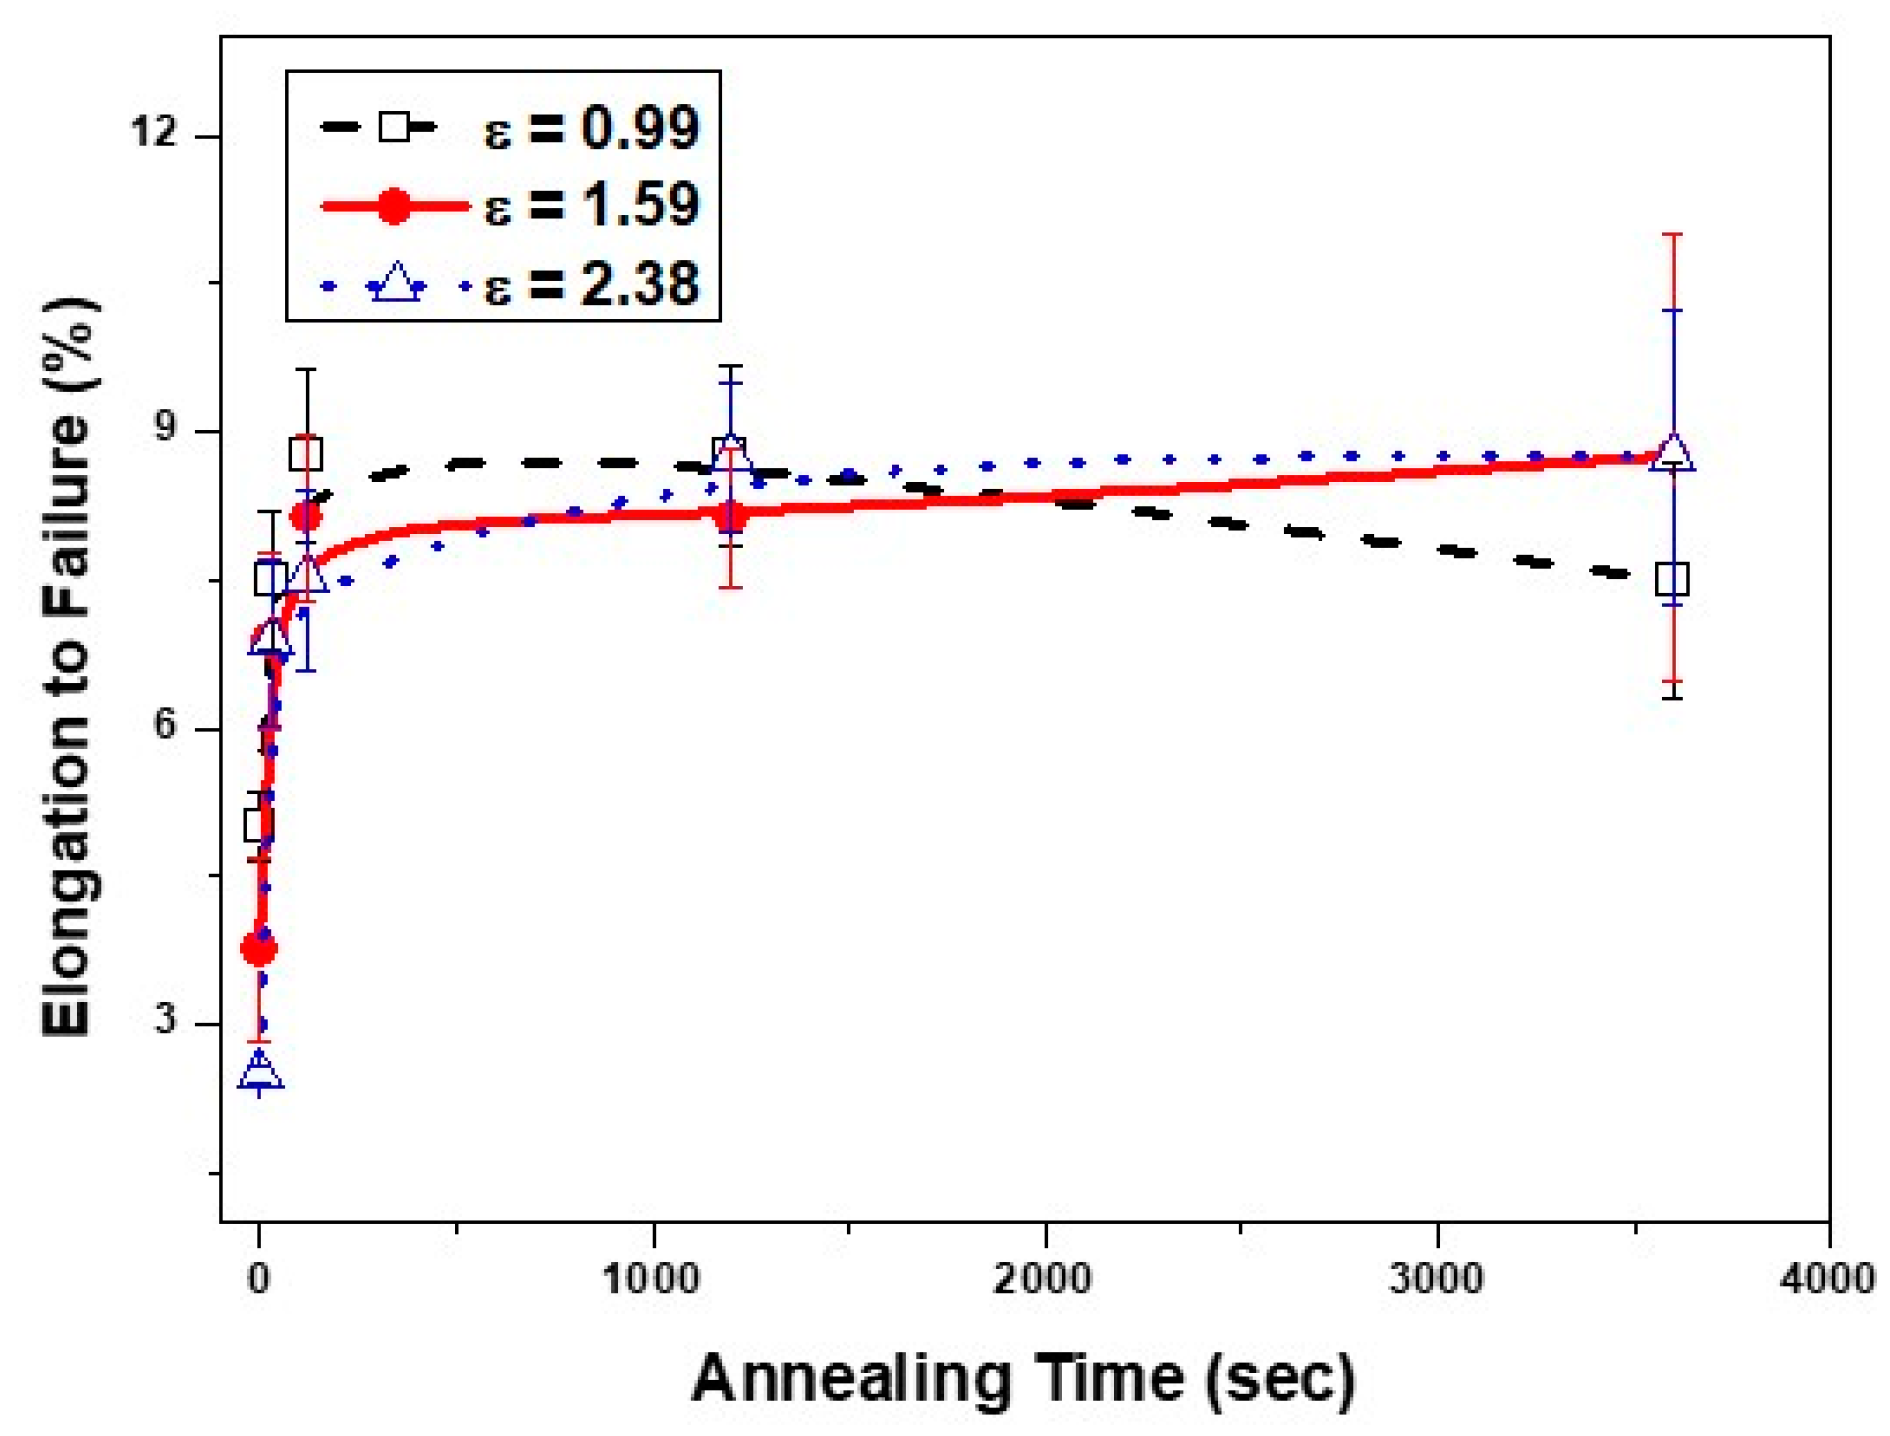
3.2. Elongation to Failure

In Figure 3a, EL (10.4%) of a transformed steel wire dropped to 5.6% at a drawing strain of 0.79, decreased gradually with drawing strain, and reached a saturation value of 2.5% for a drawing strain above 2.0 [17,35]. It is interesting to note that the rapid drop of EL occurs even at a low strain of 0.79. According to Zhang et al. [34,36], the dislocation structure in lamellar ferrite transformed from threading dislocations, tangles at low and medium strains, to dislocation cells at high strain. In pearlitic steels, the bundle of dislocations ending at ferrite/cementite boundaries act like dislocation cell boundaries during plastic deformation, due to the existence of lamellar cementite. The presence of dislocation tangles in Figure 5 indicated that the formation of dislocation tangles, i.e., the formation of dislocation substructures, would become one of the main causes for the EL drop at low strain. He et al [37] reported that the formation of dislocation tangles was observed at a drawing strain of 0.8 in cold drawn steel wires.
In Figure 6, post-deformation annealing raised EL continuously with annealing time. EL of cold drawn steel wires increased rapidly by 2.5% (ε = 0.99) and 3.1% (ε = 1.59) for a short annealing time of 30 s, although TS increased due to age hardening at the same condition. This implies that the effect of age softening, such as the recovery of ferrite and the spheroidization of lamellar cementite, would have the stronger effect on EL than the age hardening effect. Meanwhile, the increasing rate of EL slowed down or EL saturated at the 8–9% level for an annealing time above 2 min.
Annealing at a high temperature of 500 °C for 2 min enhanced the spheroidization of lamellar cementite (Figure 7a) and the formation of subgrains (Figure 7b) in cold drawn steel wires with ε = 2.38. Therefore, it is expected that the initial increasing rate of EL at 2 min annealing in Figure 6 would be related to the spheroidization of lamellar cementite or the formation of subgrains as a recovery process. Li et al. [33] reported that the formation of subgrains from dislocation cells was observed during annealing at a low temperature of 250 °C in heavily drawn steel wires.

3.3. Torsional Ductility

Torsional ductility is evaluated as the occurrence of delamination (DEL) or number of turns to failure (NT) in cold drawn and annealed steel wires. NT reflects the gradual variation of torsional ductility with manufacturing conditions of steel wires, while DEL is the qualitative indication of bad torsional ductility [14,34]. The variation of NT with a drawing strain in Figure 3b showed the similar trend to that of RA; increasing, showing the peak, and decreasing continuously, although the peak strain of 2.18 was different from that of 1.59 in RA.
In Figure 8, NT showed the steady decrease with annealing time, except for the drop of NT region. DEL, which is closely related to the interaction of dissolved carbon atoms with dislocations in lamellar ferrite, would cause the drop of NT in torsion. In Figure 8, steel wires with the higher drawing strain showed the larger range of the DEL region and the larger decrease of NT during annealing. The higher drawing strain induced more damage in lamellar cementite during wire drawing. The damaged cementite easily dissolved in ferrite during annealing. The increased amount of dissolved carbon atoms interacted with dislocations more frequently. Thus, the higher drawing strain resulted in the larger drop of NT and more frequent DEL during annealing [11,25]. Additionally, the disappearance of DEL with 2 min annealing at 500 °C in steel wires received a strain of 1.59 indicates that the increase of annealing time would decrease the amount of dissolved carbon atoms, due to the reprecipitation of cementite particles [9]. NT of steel wires drawn with ε = 0.99 decreased continuously from 30.6 turns (as-drawn) to 14.5 turns (1 h annealing) without the occurrence of DEL. Except for DEL, NT of cold drawn steel wires decreased continuously with annealing time at 500 °C.

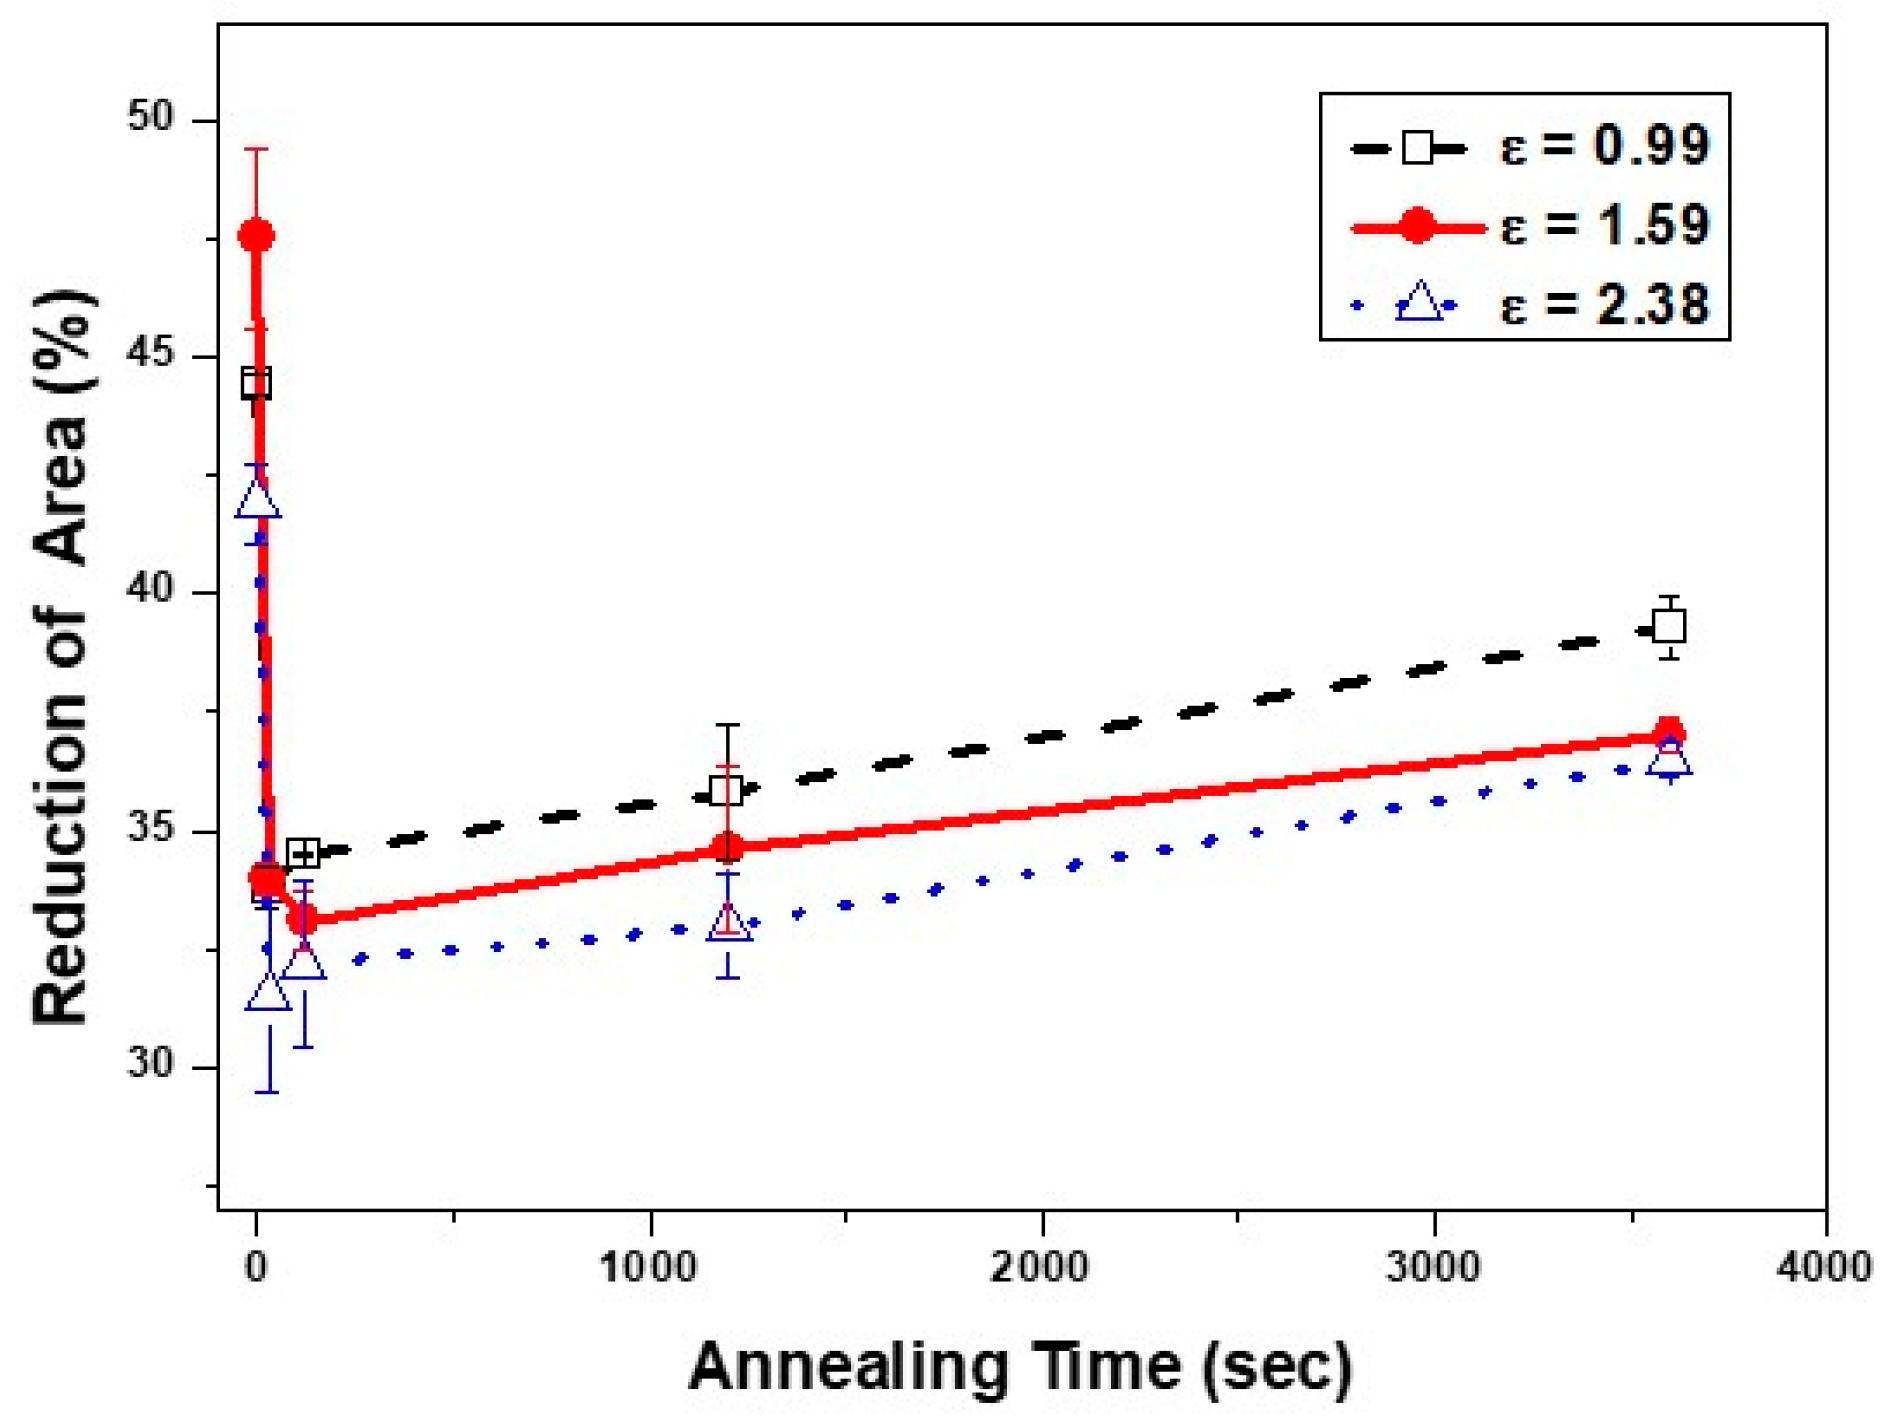
3.4. Reduction of Area

Figure 3b shows the plot of reduction of area (RA) in cold drawn wires as a function of drawing strain. RA of a transformed steel wire (40.2%) increased up to 50.9% (ε = 1.59) and decreased gradually to 41.2% (ε = 2.38) with increasing strain. The initial increase of RA was due to the realignment of randomly oriented lamellar cementite along the wire axis. Thus, the maximum peak of RA at ε = 1.59 corresponded to the completion of realignment of lamellar cementite. The continuous decrease of RA after the peak resulted from work hardening of lamellar ferrite and thinning and/or fragmenting lamellar cementite at high strain.
Generally, annealing of cold deformed steels improves ductility of EL, RA, and torsional ductility at the expense of strength in cold deformed steels, since the occurrence of recovery or recrystallization during annealing encourages the softening of matrix. However, the variations of RA with annealing time in Figure 9 showed the different behavior from that of EL. For a short annealing time of 30 s, RA of cold drawn wires (ε = 1.59), 48%, significantly dropped to 34%. Meanwhile, the increase of annealing time from 30 s to 1 h resulted in only the 3.5% increase of RA.

4. Discussion

Ductility parameters of cold drawn steel wires must reflect the variations of microstructural features during wire drawing. Microstructural evolution during wire drawing includes the reduced thickness of lamellar ferrite and lamellar cementite, the work hardened lamellar ferrite, the progressive reorientation of lamellae along the wire axis, the fracture of lamellar cementite, and the increased content of carbon atoms dissolved in lamellar ferrite. Depending on the post-deformation annealing conditions, the occurrence of age hardening or age softening would alter ductility parameters of steel wires. Microstructural evolution of age hardening consists of the break-up and decomposition of lamellar cementite, the diffusion of carbon atoms to dislocations, and dislocation pinning by carbon atoms. Thus, the occurrence of age hardening is closely related to the amount of carbon atoms dissolved in lamellar ferrite. Meanwhile, age softening occurs through the break-up and spheroidization of lamellar cementite, the reprecipitation of cementite particles, and the occurrence of recovery or recrystallization of lamellar ferrite.

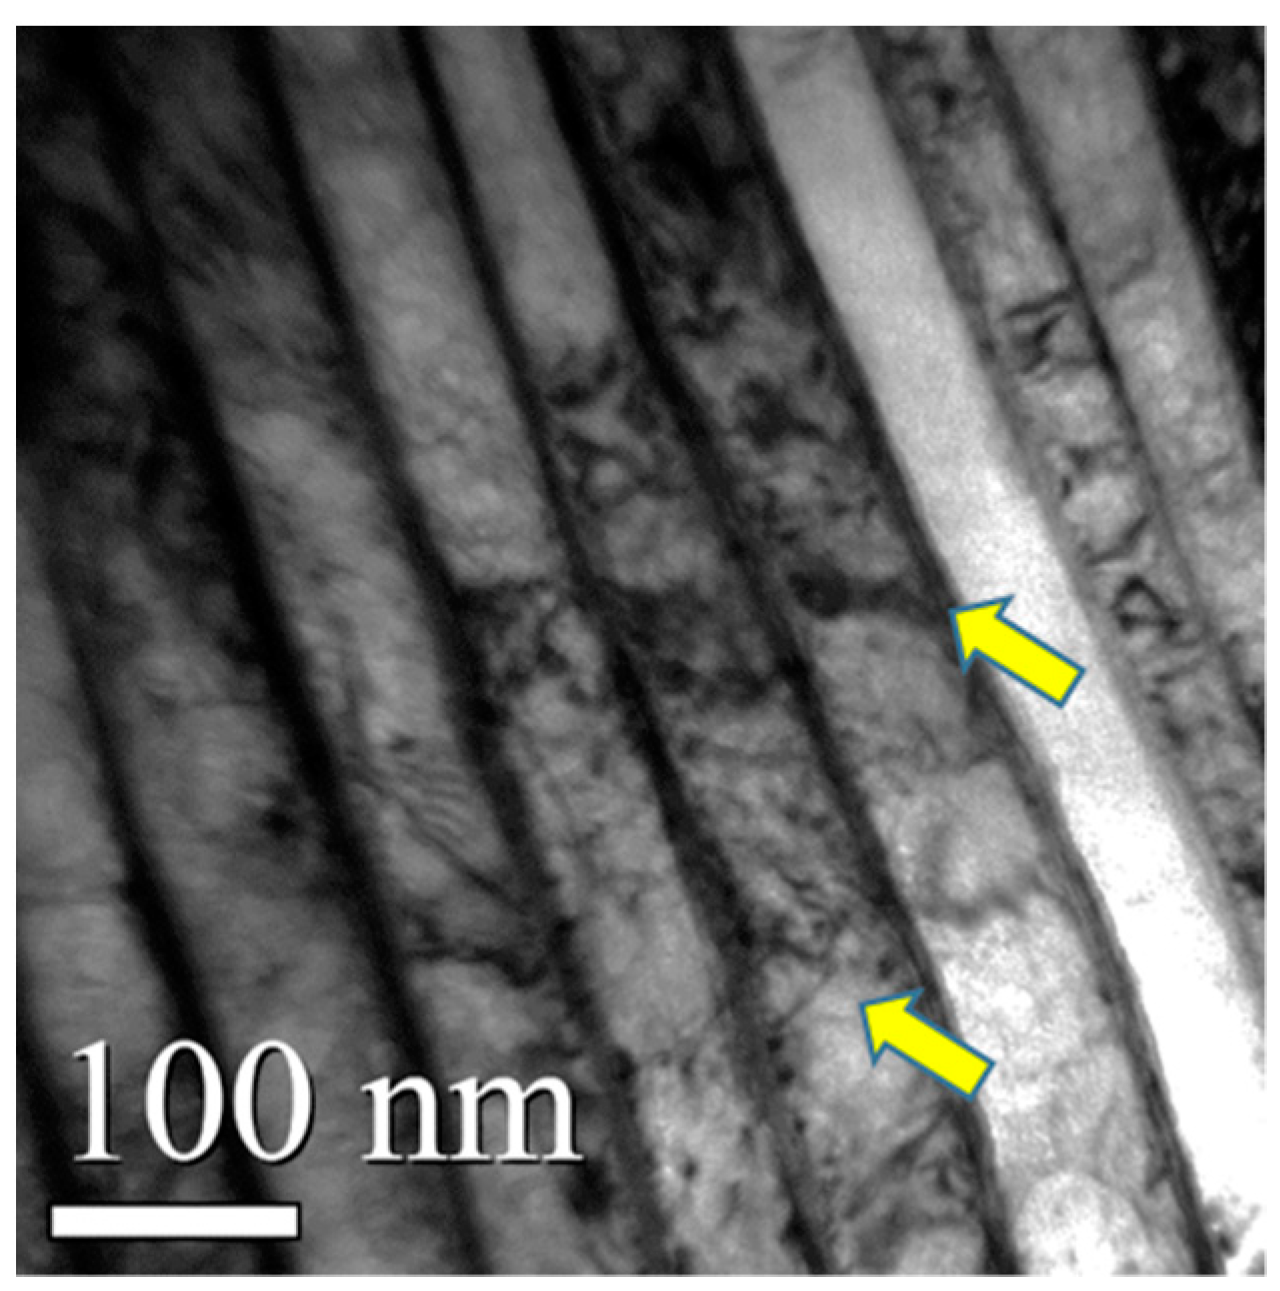
4.1. Elongation to Failure

To find the relationship between EL and microstructural evolution during wire drawing, the effects of microstructural features on EL were examined. The drop of EL at a drawing strain of 0.79 in Figure 3a could not be explained with the reductions of ferrite thickness and cementite thickness, the reorientation of lamellar cementite, and the gradual increase of dislocation density during wire drawing. Meanwhile, the increase of dislocation density accompanies with the formation of dislocation substructures, such as dislocation tangles and dislocation cells. The presence of dislocation tangles in Figure 5 indicated that the formation of dislocation substructures would become one of the main causes for the EL drop at low strain.
The variation of EL in Figure 6 shows which microstructural feature would have an effect on EL of cold drawn and annealed steel wires. The rapid increase of EL for 30 s annealing would be related to the formation of subgrains as the recovery process or the spheroidization of lamellar cementite (Figure 7). Additionally, the presence of yield plateaus in true stress–true strain curves of cold drawn and annealed steel wires (Figure 10) confirmed the occurrence of recovery in lamellar ferrite during annealing at 500 °C for 2 min, while the continuous yielding occurred in cold drawn steel wires.
In Figure 11, an annealing at 500 °C for 1 h induced the fragmentation of cementite particles in most area of cold drawn steel wires with ε = 2.38, while the fragmentation of cementite particles occurred in less than half area of cold drawn steel wires with ε = 0.99. This meant that the severer damage in lamellar cementite accelerated the spheroidization process during annealing. In spite of microstructural difference in Figure 11, both steel wires showed the similar EL as 8% and 9% for an annealing time of 1 h, respectively. This implies that the increased mean free path due to the spheroidization and growth of cementite particles would not have a significant influence on EL.
Additionally, the saturation of EL at 8–9% level for annealing time above 2 min in Figure 6 also indicates that the further progress of recovery during annealing would not change EL. According to Xiang et al, [38], when annealing temperature increased from 250 to 325 °C, EL of cold drawn steel wires (ε = 2.34) increased rapidly, accompanying the slight variation of dislocation density. This indicated that EL did not depend on the dislocation density significantly.
From the above, it was found that EL of cold drawn wires dropped due to the formation of dislocation tangles or cells, decreased slowly due to work hardening, and saturated with the drawing strain. During post-deformation annealing EL initially increased rapidly due to the transformation from dislocation cells to subgrains as a recovery process, and saturated at 8–9% with annealing time.
Thus, the variation of EL in cold drawn and annealed steel wires depends on the formation of dislocation substructures in lamellar ferrite. The formation of dislocation substructures showed the stronger effect on the variation of EL than dislocation density in cold drawn and/or annealed steel wires.

4.2. Torsional Ductility

The similar sequential behaviors between NT and RA with drawing strain (Figure 3b); increasing, showing the maximum peak, and decreasing continuously, suggests that microstructural features affecting RA would possibly control NT of cold drawn steel wires. The initial increase of RA comes from the realignment of randomly oriented lamellar cementite, and the maximum peak of RA at ε = 1.59 corresponds to the completion of the realignment of lamellar cementite along the wire axis. The subsequent decrease of RA, after the maximum peak, results from work hardening of lamellar ferrite and thinning and/or fragmenting lamellar cementite at high strain. From the above, it is obvious that the increase of RA is attributed to the realignment of lamellar cementite at low strain, and the decrease of RA after the peak comes from the break-up of lamellar cementite and work hardened lamellar ferrite.
Meanwhile, the peak strain of 2.18 in NT was different from that of 1.59 in RA. This difference of peak strains between RA and NT implies that microstructural features controlling RA of cold drawn steel wires would not have the similar degree of influence on NT in cold drawn steel wires. From Figure 3b, it is expected that the realignment of lamellar cementite increases NT with drawing strain, and the decrease of NT would depend on the fracturing of lamellar cementite, and dynamic strain aging in cold drawn steel wires [39].
Figure 8 shows the steady decrease of NT with annealing time, except for the NT drop due to DEL. This steady decrease of NT with annealing time would be related to the age softening process, including the decrease of dissolved carbon atoms due to the reprecipitation of cementite particles, the recovery, and the spheroidization and growth of cementite particles. The larger NT for cold drawn steel wires than NT of post-deformation annealed wires in Figure 8, indicates that NT was not significantly affected by dislocation density in ferrite. The reduction of carbon atoms dissolved in ferrite with annealing time also did not change NT significantly. However, it is obvious that DEL, which causes the NT drop during torsion, depends on the amount of carbon atoms in ferrite. Meanwhile, the fracture of lamellar cementite at high drawing strain and the spheroidization and growth of lamellar cementite during annealing decreased NT. This meant that the destruction of lamellar structure, i.e., the increase of mean free path for mobile dislocations, would decrease NT, since lamellar cementite, aligned parallel to the wire axis, blocked the movement of mobile dislocations during torsion [39].
Figure 12 shows a schematic diagram of different mean free path (MPF) due to annealing of cold drawn steel wires. The fracture of lamellar cementite at high drawing strain and the spheroidization and growth of cementite particles increased MPF for the dislocation movement during torsion. Thus, the fragmented cementite particles reduced NT in cold drawn and annealed steel wires.
Thus, the orientation of lamellar cementite and the shape of cementite particles would become a major factor in controlling NT of cold drawn and annealed steel wires. Additionally, the amount of dissolved carbon atoms would have an influence through DEL, which drops NT rapidly during torsion.

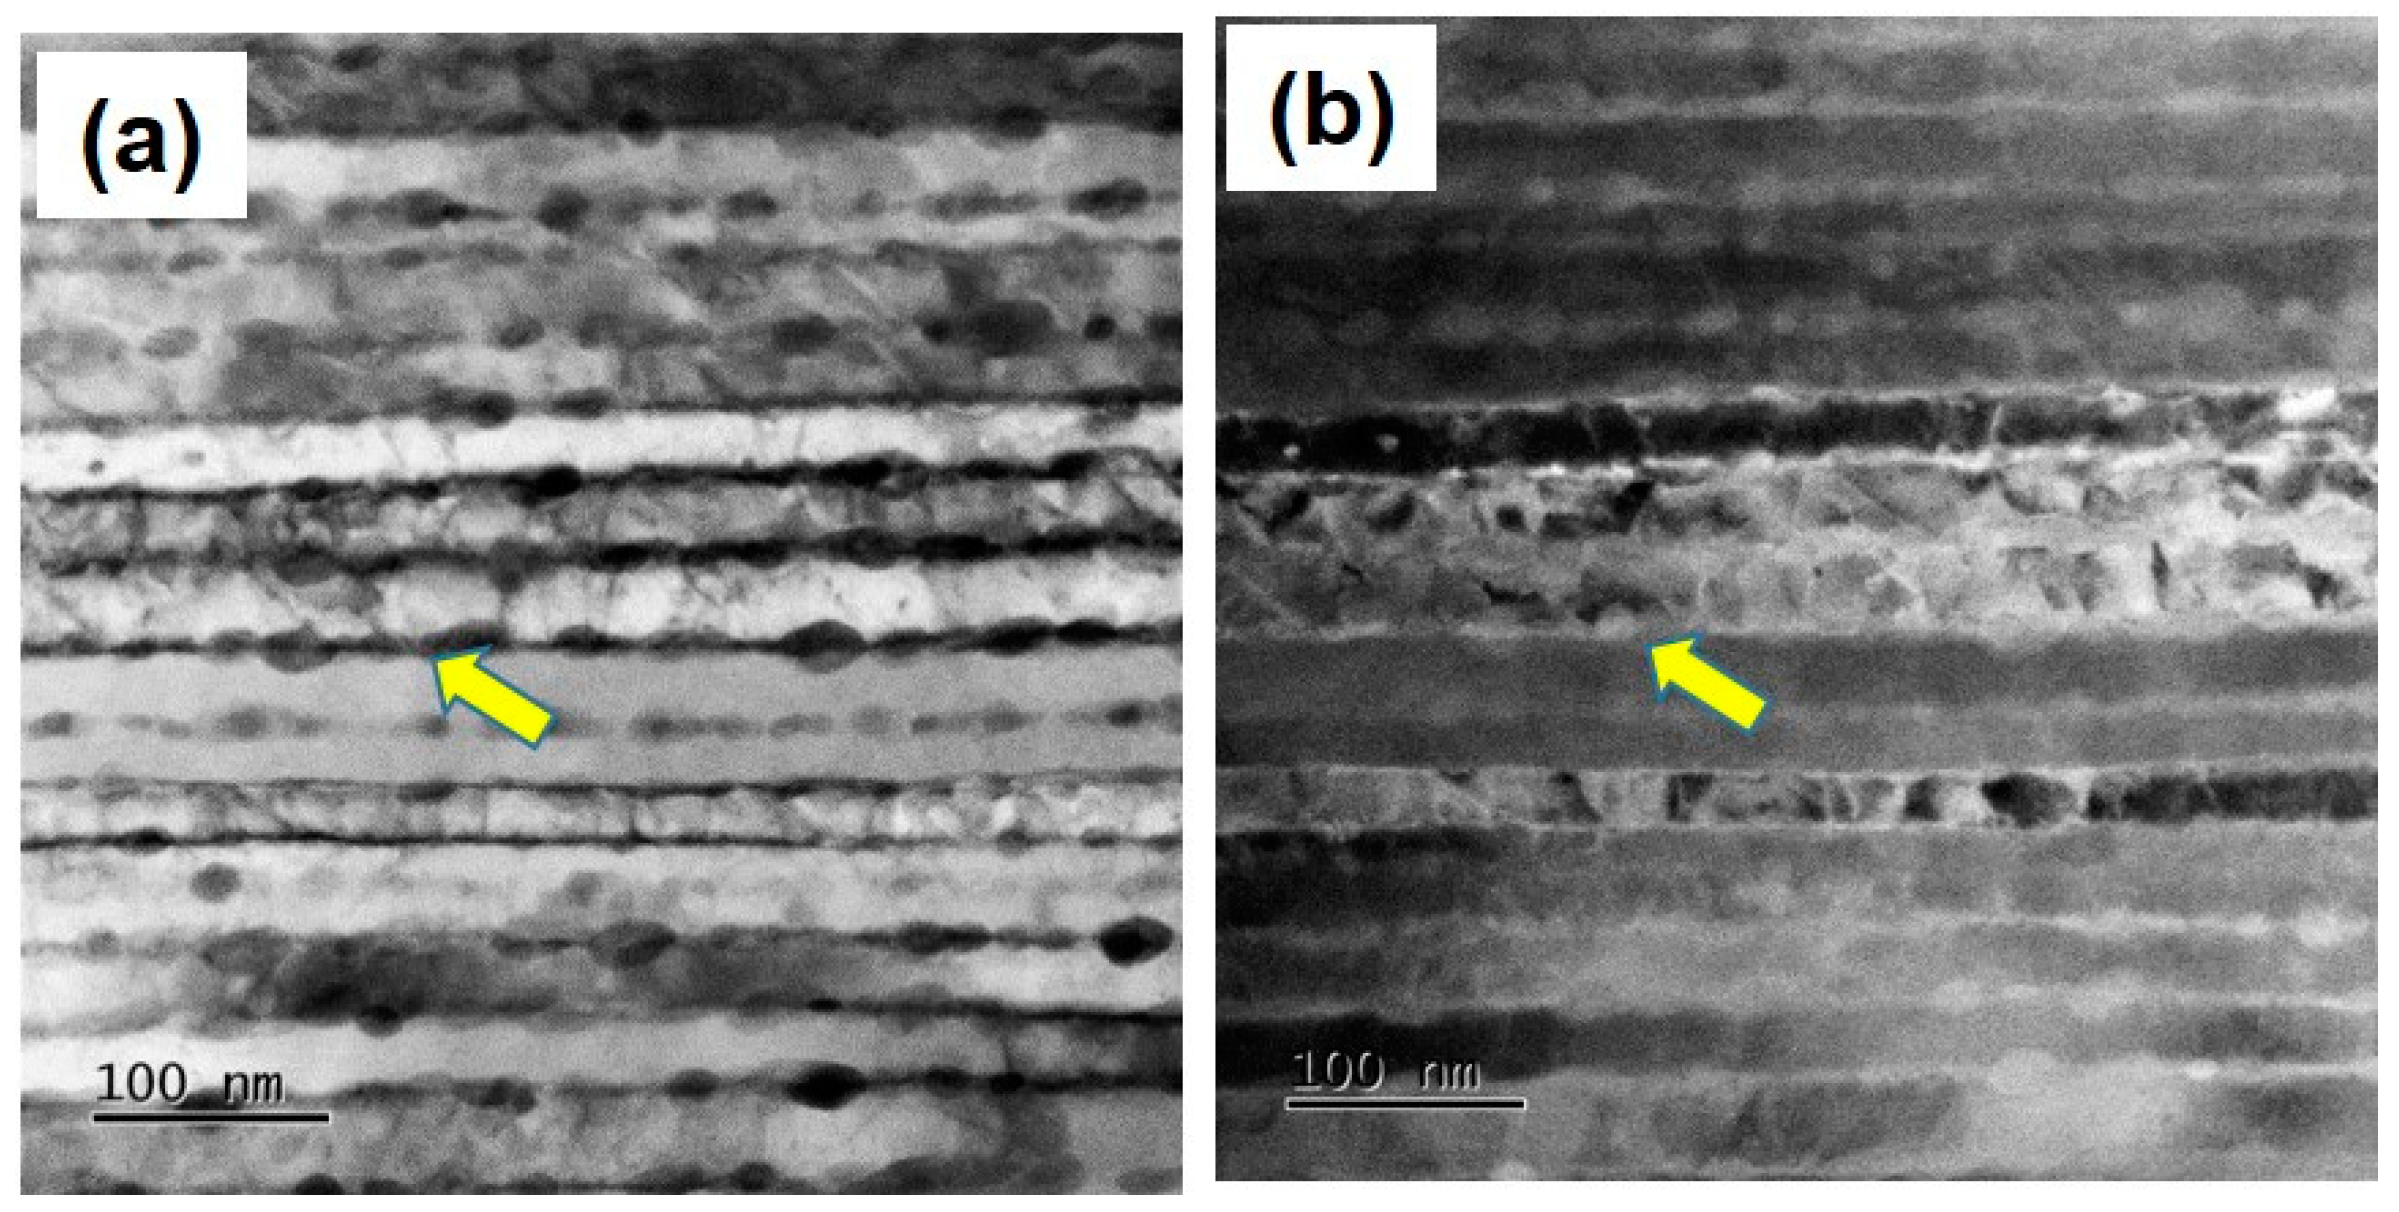
4.3. Reduction of Area

It is well known that RA of cold drawn steel wires increases with the realignment of randomly oriented lamellar cementite parallel to the wire axis, and decreases with the fracture of lamellar cementite and work hardening of lamellar ferrite. However, the variations of RA with annealing time in Figure 9 showed the different behavior from RA with drawing strain (Figure 3b). When the annealing is carried out at low temperature with a short annealing time, both age hardening and age softening occur in cold drawn steel wires. With increasing annealing temperature or time, age softening dominantly controls mechanical properties of cold drawn steel wires. The significant drop of RA was observed in steel wires received 30 s annealing at 500 °C, and then RA increased slowly with increasing annealing time. For 30 s annealing, all cold drawn steel wires showed the significant RA drop, whether cold drawn and annealed steel wires showed DEL during torsion or not in Figure 8. This meant that the occurrence of age hardening (the amount of carbon atoms dissolved in ferrite) did not have any influence on the drop of RA. It is interesting to note that RA of cold drawn steel wires is larger than RA of post-deformation annealed wires in Figure 9. This implies that the occurrence of recovery would not contribute significantly to the increase of RA in cold drawn and annealed steel wires.
Considering the dependence of RA on the orientation of lamellar cementite to the wire axis and the fragmentation of lamellar cementite in cold drawn steel wires, the shape change (the degree of spheroidization) of lamellar cementite could become one of the main causes for the rapid RA drop. Figure 12 shows the gradual spheroidization with annealing time in steel wires cold drawn and annealed at 500 °C. A short annealing time of 2 min was enough to start the fracture of lamellar cementite in steel wires with ε = 2.38 (Figure 7 and Figure 13). For steel wires annealed for 20 min (Figure 13c), most lamellar cementite fractured into cementite particles. As annealing time increased to 1 h, the spheroidization of cementite particles was almost completed and the size of cementite particles varied from 20 to 200 nm, although cementite particles kept the lamellar typed array (Figure 13d) [29].
Meanwhile, the slow increasing rate of RA after the drop in Figure 9 would come from the softening behavior of recovery. Among cold drawn wires, the RA of a steel wire with ε = 1.59 showed the largest RA due to the completion of realignment of lamellar cementite. However, after annealing longer than 2 min RA of a steel wire with ε = 0.99 was larger than that with ε = 2.38. This means that the larger drawing strain would accelerate the spheroidization and growth of cementite particles during annealing and result in the lower RA in steel wires.
Therefore, the orientation and shape of lamellar cementite would become microstructural features controlling RA of cold drawn and annealed steel wires. The occurrence of recovery during annealing caused the slight increase of RA with annealing time.
Mechanical properties of steel wires reflect the variations of microstructural features during wire drawing and annealing. Figure 14 shows a schematic diagram, describing the evolution of pearlitic microstructure during wire drawing and subsequent annealing.

5. Conclusions

The effects of microstructural features on ductility with the variations of drawing strain and annealing time in hypereutectoid steel wires were investigated. Especially, the relationship between microstructural evolution during wire drawing and subsequent annealing and ductility parameters of reduction of area, elongation to failure, occurrence of delamination, and number of turns to failure in torsion in hypereutectoid pearlitic steel wires was discussed.
(1)
The increase of tensile strength (TS) during wire drawing was attributed to work hardening of lamellar ferrite and solid solution hardening of dissolved carbon atoms by dynamic strain aging. During post-deformation annealing, TS of steel wires with high drawing strain decreased continuously with annealing time, since age softening became the major process to control TS. Meanwhile, steel wires with low drawing strain showed the sequential variation of TS; increasing, showing the peak, and decreasing with annealing time. The increment of TS for a short annealing time was due to the occurrence of age hardening.
(2)
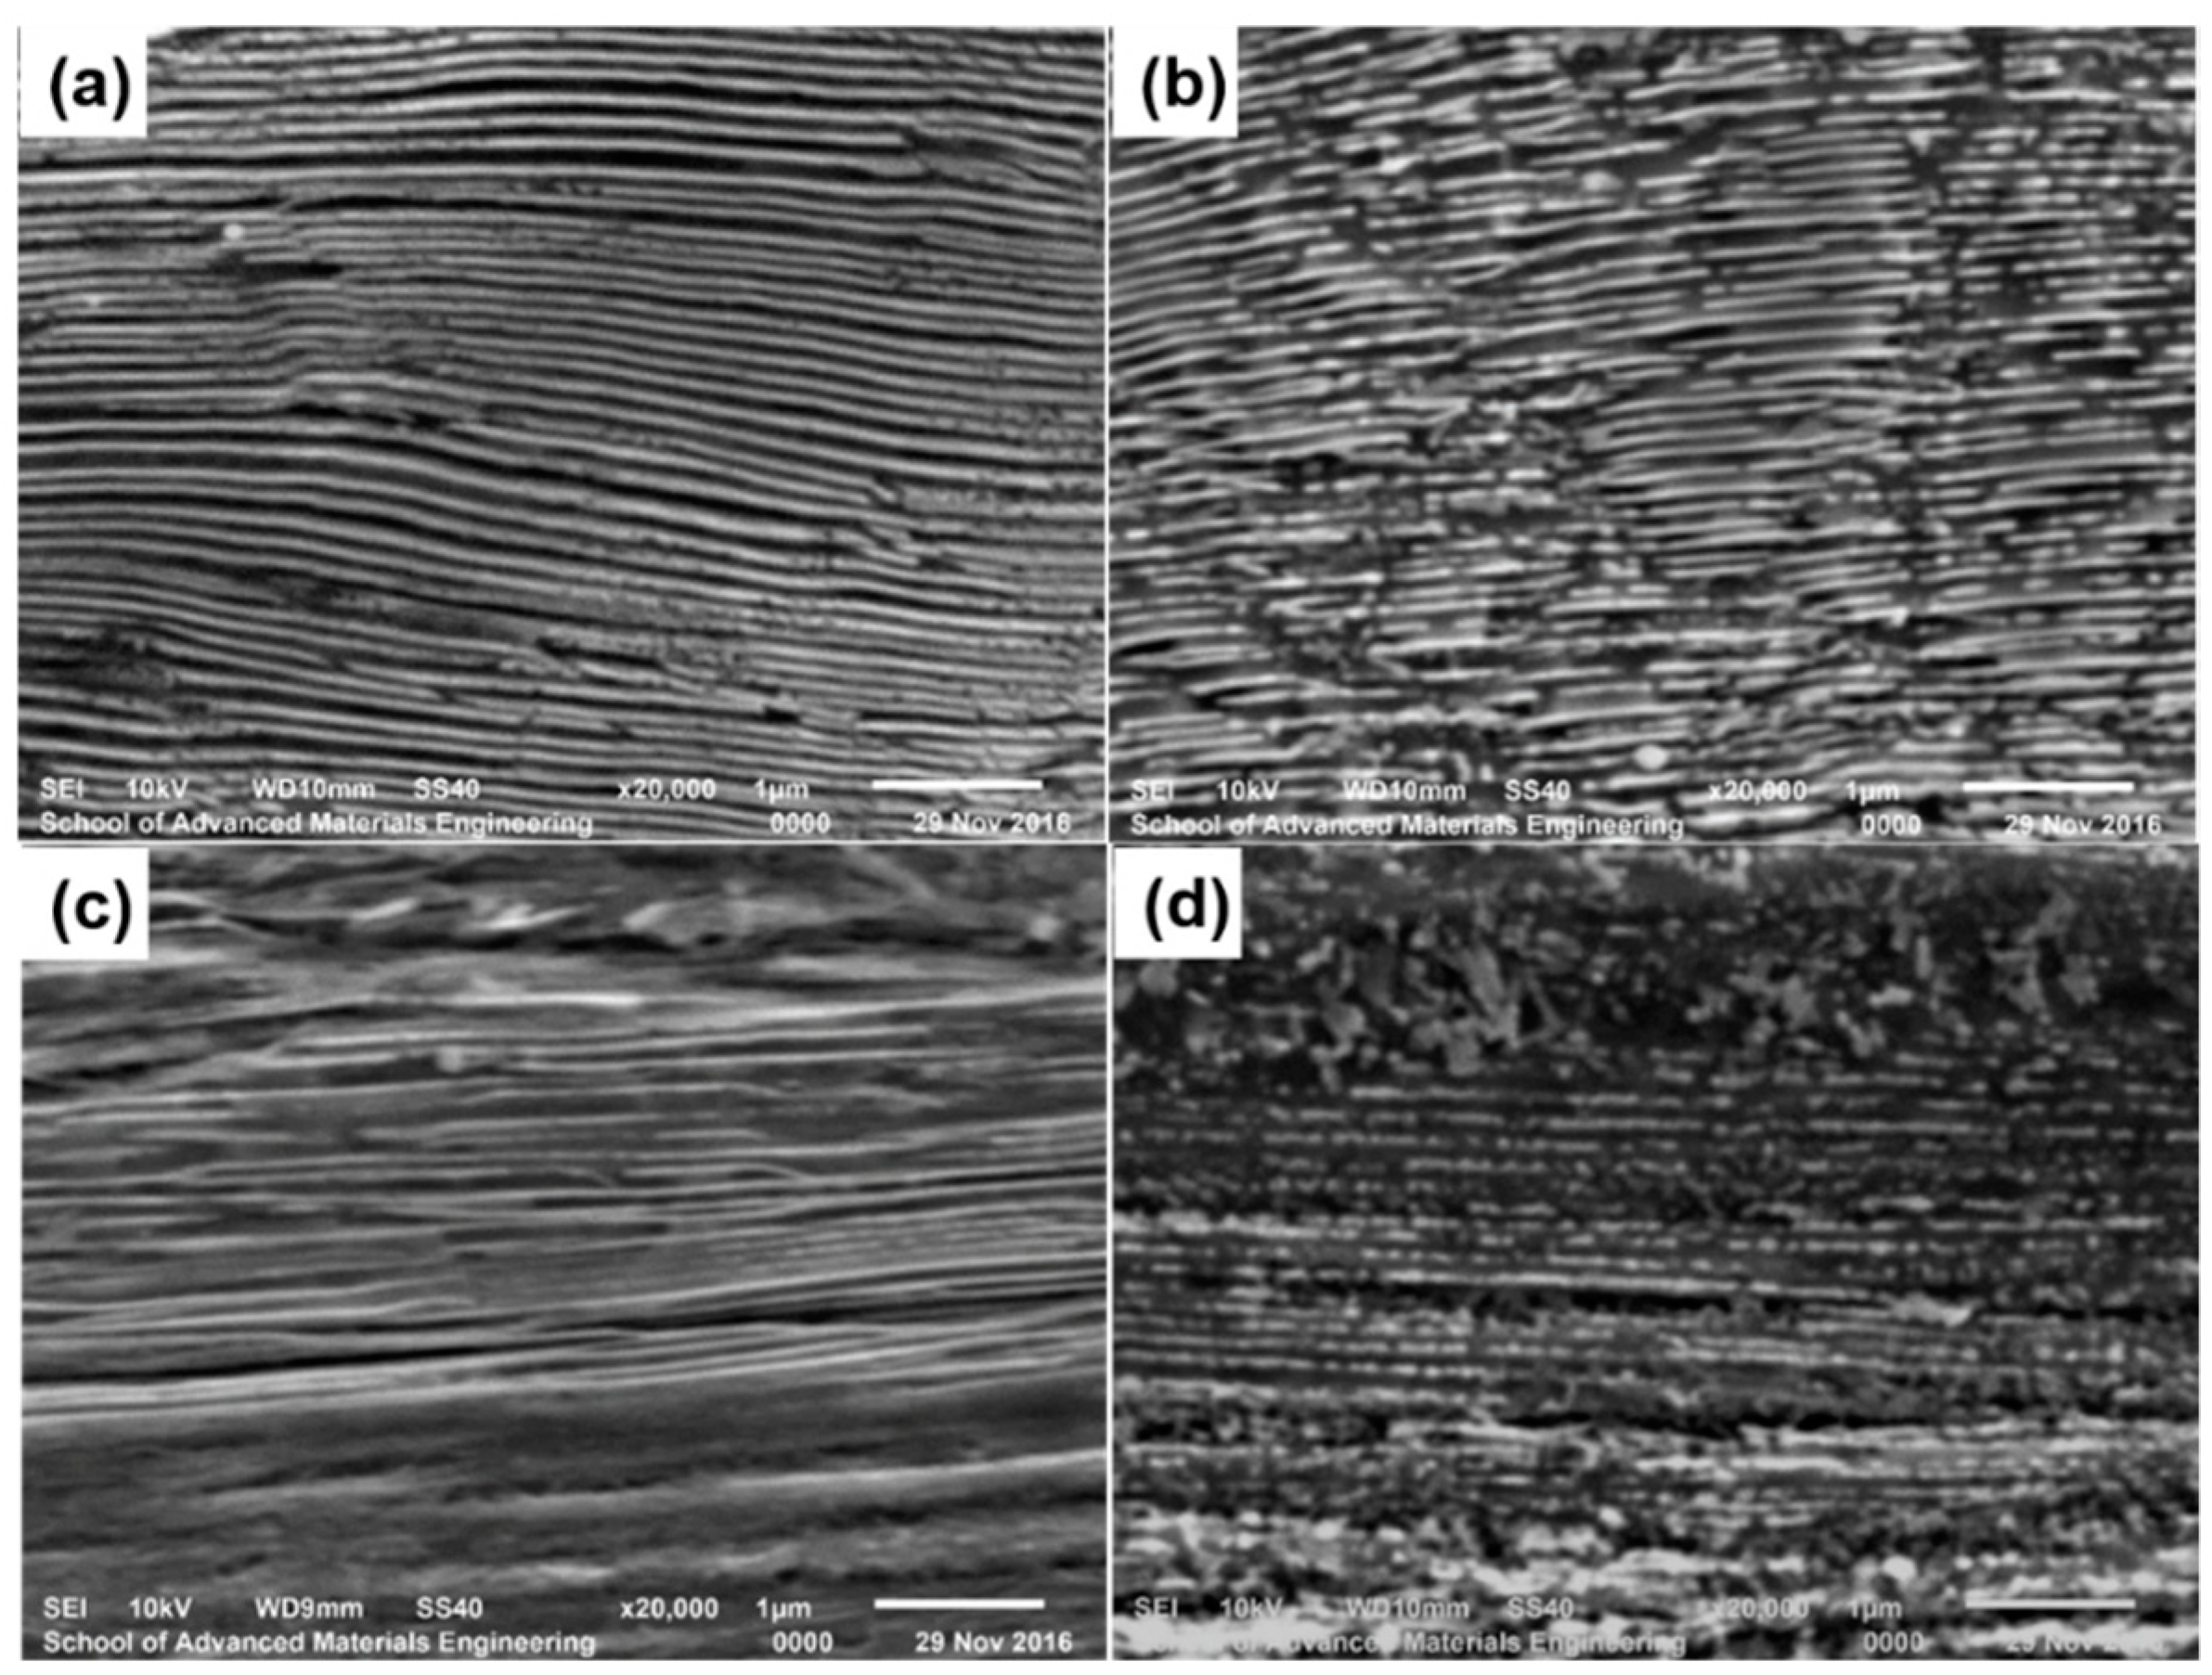
The variation of elongation to failure (EL) in cold drawn and/or annealed steel wires depends on the formation of dislocation substructures in lamellar ferrite. The formation of dislocation tangles or cells would become one of main causes for the EL drop at low strain. The rapid increase of EL during annealing came from the transformation from dislocation cells to subgrains as a recovery process. The formation of dislocation substructures showed the stronger effect on the variation of EL than dislocation density in cold drawn and/or annealed steel wires.
(3)
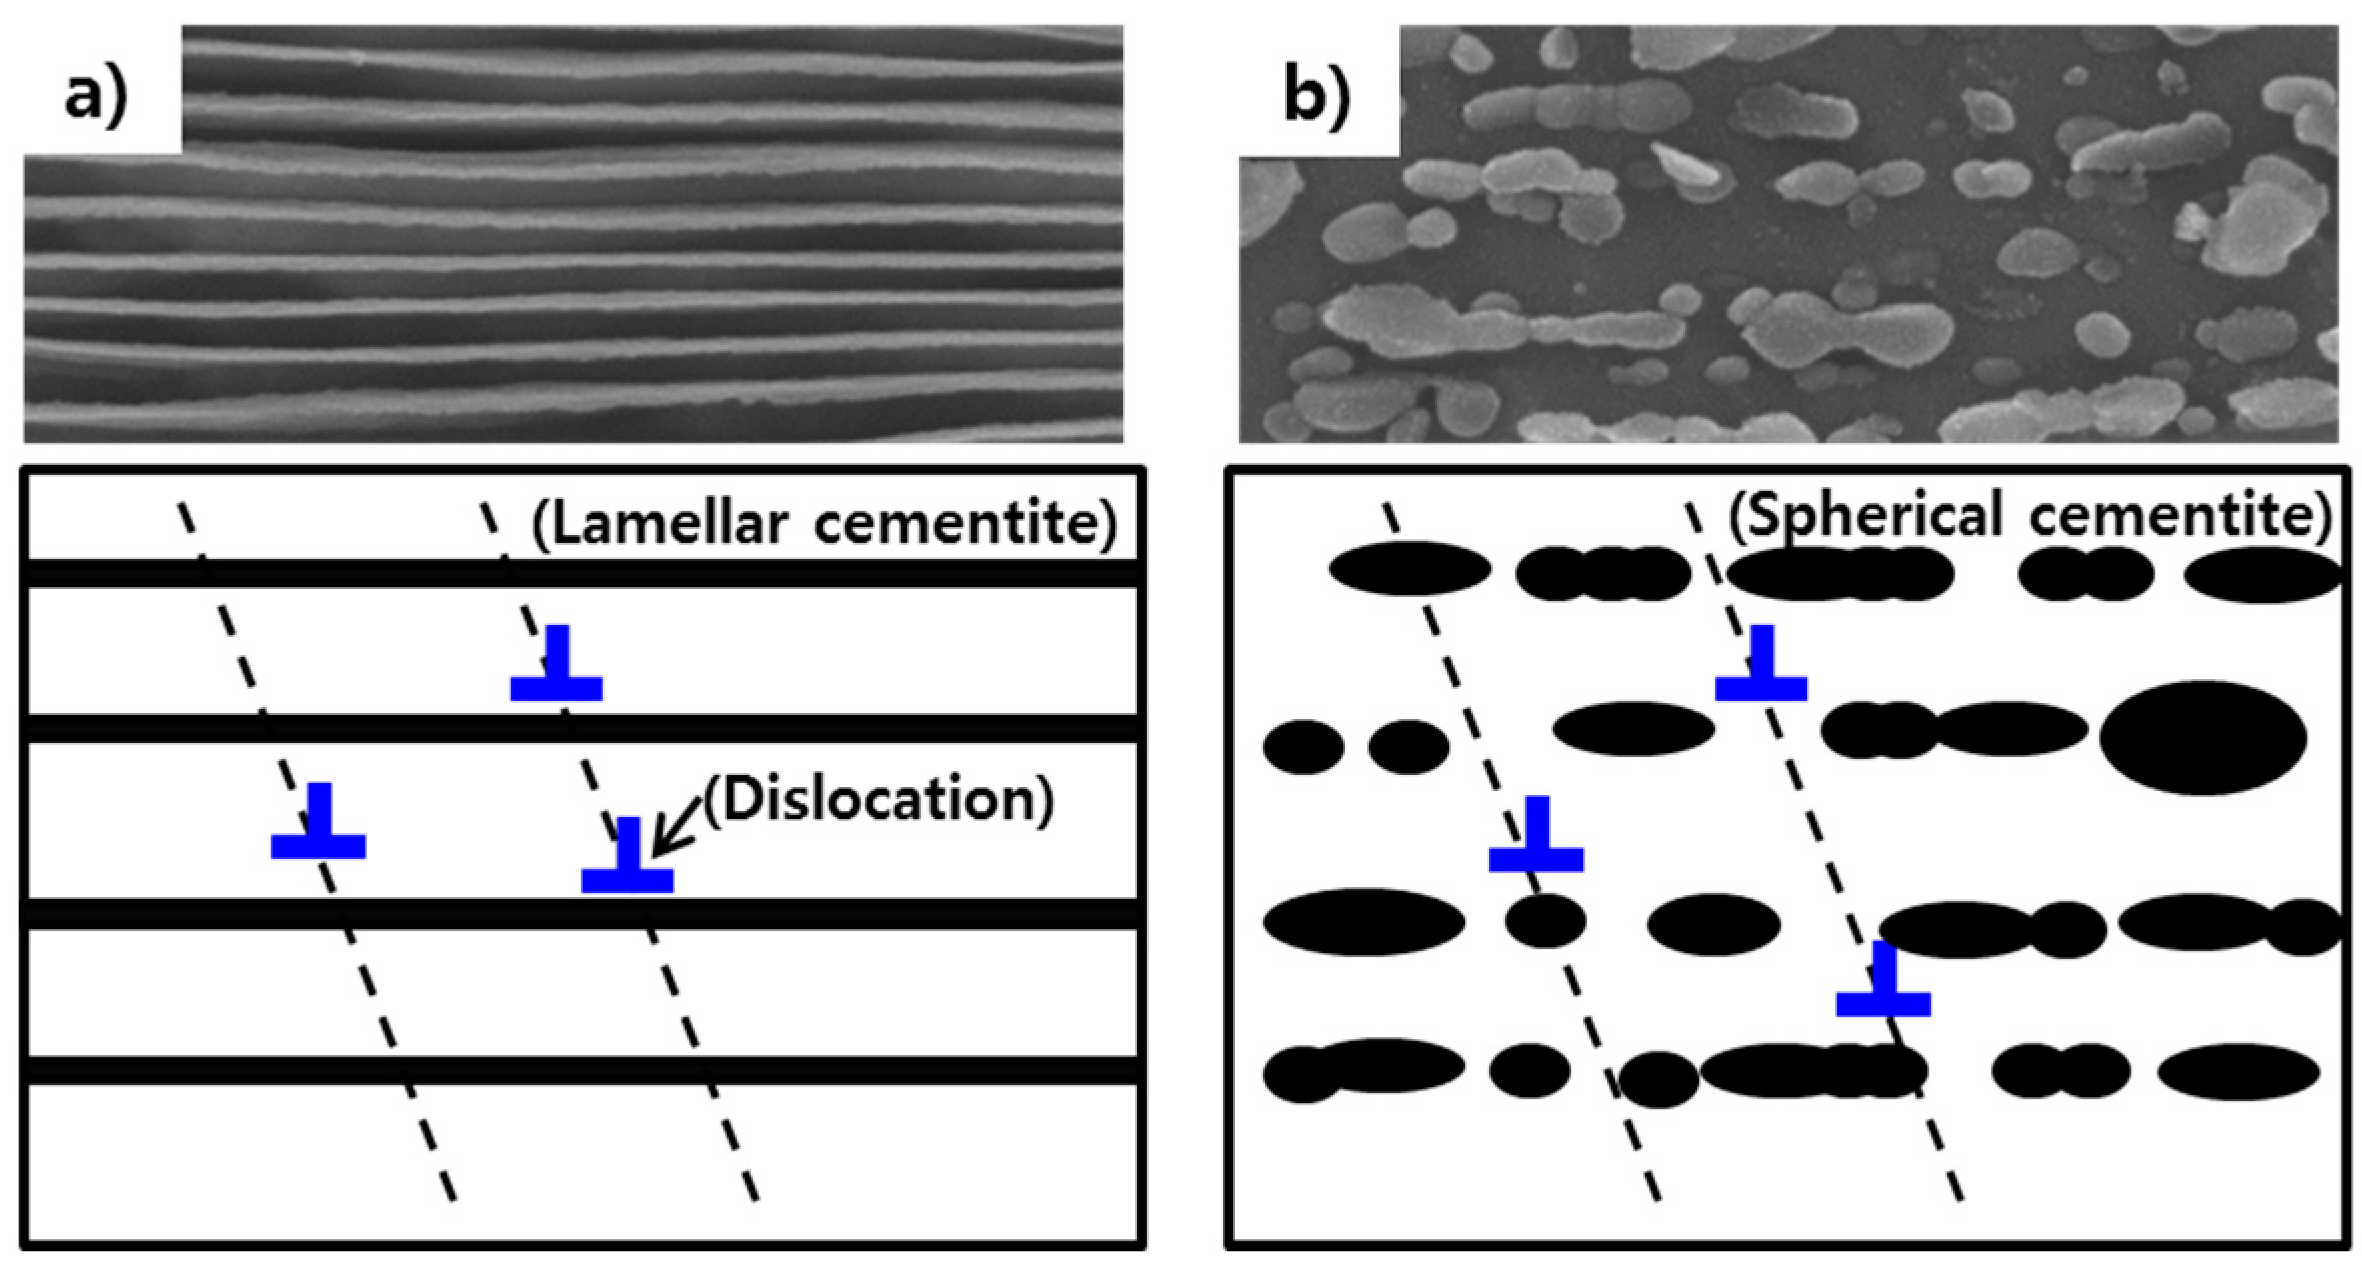
Occurrence of delamination (DEL) caused a significant drop of number of turns to failure in torsion (NT). Since DEL depends on the amount of carbon atoms dissolved in ferrite, steel wires with the higher drawing strains showed the larger range of DEL region and the larger decrease of NT during annealing. The higher drawing strain induced the more damage in lamellar cementite and resulted in the increased amount of dissolved carbon atoms in ferrite during annealing. Thus, the higher drawing strain resulted in the larger drop of NT and more frequent DEL during annealing.
(4)
Number of turns to failure (NT) increased with the realignment of lamellar cementite and decreased with fracturing of lamellar cementite and dynamic strain aging in cold drawn steel wires. During post-deformation annealing, NT of steel wires decreased with annealing time, except for DEL. The orientation of lamellar cementite and the shape of cementite particles would become an effective factor controlling NT of cold drawn and annealed steel wires.
(5)
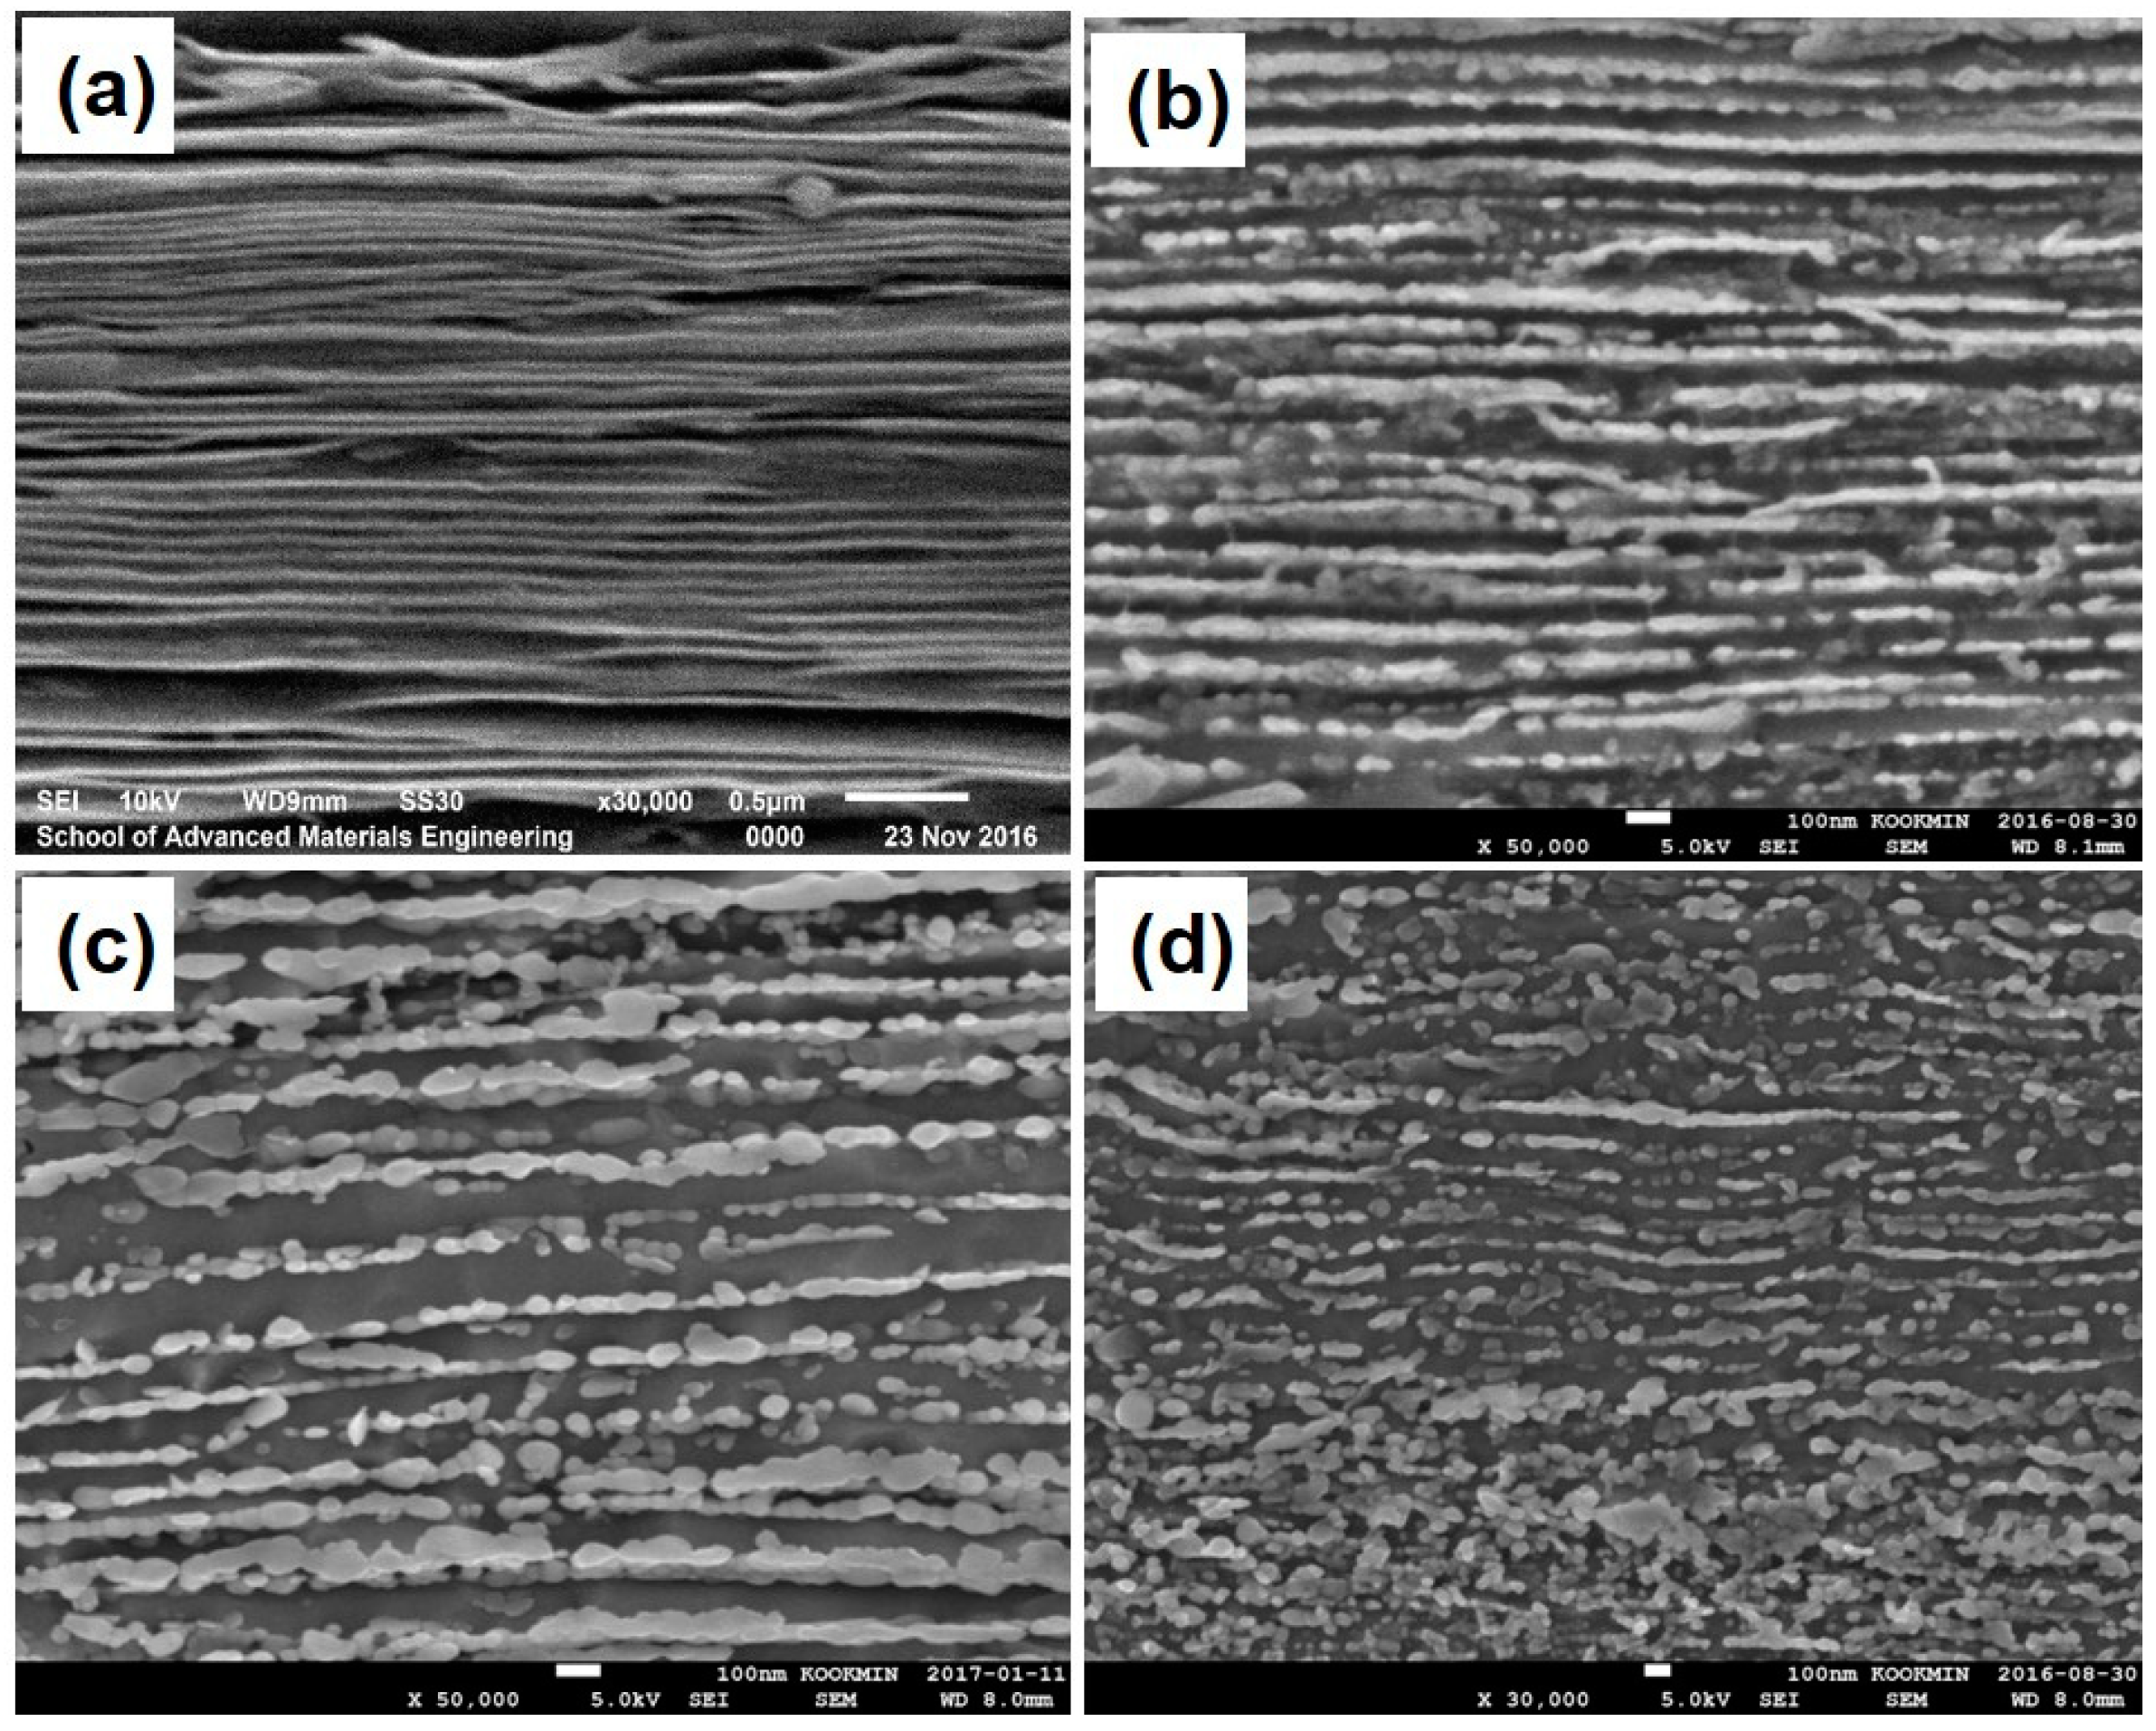
With drawing strain, reduction of area (RA) increased due to the realignment along the wire axis, showed the peak, and decreased gradually due to work hardening of ferrite and fragmenting lamellar cementite at high strain. During post-deformation annealing, RA of cold drawn wires significantly dropped and increased slowly with annealing time. The orientation and shape of lamellar cementite would become a dominant microstructural feature in controlling RA of cold drawn and annealed steel wires. The occurrence of recovery during annealing also contributed to RA to some extent.

Author Contributions

Conceptualization, writing draft, J.Y.J.; investigation, preparation, data interpretation, K.S.A.; supervision, writing review, P.Y.P.; study design, writing review and editing, funding acquisition, W.J.N. All authors have read and agreed to the published version of the manuscript.

Funding

This research was supported by KISWIRE.

Data Availability Statement

Not applicable.

Conflicts of Interest

The authors declare no conflict of interest.

References

  1. Borchers, C.; Kirchheim, R. Cold-drawn Pearlitic Steel Wires. Prog. Mater. Sci. 2016, 82, 405–444. [Google Scholar] [CrossRef]
  2. Nam, W.J.; Bae, C.M.; Oh, S.J.; Kwon, S.J. Effect of Interlamellar Spacing on Cementite Dissolution during Wire Drawing of Pearlitic Steel Wires. Scr. Mater. 2000, 42, 457–463. [Google Scholar] [CrossRef]
  3. Toribio, J.; Ovejero, E. Effect of Cumulative Cold Drawing on the Pearlite Intrlamellar Spacing in Eutectoid Steel. Scr. Mater. 1998, 39, 323–328. [Google Scholar] [CrossRef]
  4. Li, Y.J.; Choi, P.; Goto, S.; Borchers, C.; Raabe, D.; Kirchheim, R. Evolution of Strength and Microstructure during Annealing of Heavily Cold-drawn 6.3 GPa Hypereutectoid Pearlitic Steel Wire. Acta Mater. 2012, 60, 4005–4016. [Google Scholar] [CrossRef]
  5. Lu, X. Correlation between Microstructural Evolution and Mechanical Properties of 2000 MPa Cold-Drawn Pearlitic Steel Wires during Galvanizing Simulated Annealing. Metals 2019, 9, 326. [Google Scholar] [CrossRef] [Green Version]
  6. Tashiro, H.; Tarui, T. State of the Art for High Tensile Strength Steel Cord. Nippon Steel Tech. Rep. 2003, 88, 87–91. [Google Scholar]
  7. Tarui, T.; Maruyama, N.; Takahashi, J.; Nishida, S.; Tashiro, H. Microstructure Control and Strengthening of High-carbon Steel Wires. Nippon Steel Tech. Rep. 2005, 91, 56–61. [Google Scholar]
  8. Sakamoto, M.; Teshima, T.; Nakamura, K. Wire Rod for High Tensile Strength Steel Cords. Nippon Steel Tech. Rep. 2019, 122, 129–136. [Google Scholar]
  9. Takahashi, J.; Kosaka, M.; Kawakami, K.; Tarui, T. Change in Carbon State by Low-temperature aging in Heavily Drawn Pearlitic Steel Wires. Acta Mater. 2012, 60, 387–395. [Google Scholar] [CrossRef]
  10. Song, H.R.; Kang, E.G.; Bae, C.M.; Lee, C.Y.; Lee, D.L.; Nam, W.J. The Effect of a Cr Addition and Transformation Temperature on the Mechanical Properties of Cold Drawn Hyper-Eutectoid Steel Wires. Met. Mater. Int. 2006, 12, 239–243. [Google Scholar] [CrossRef]
  11. Tarui, T.; Takahashi, T.; Ohashi, S.; Uemori, R. Effect of Silicon on the Age Softening of High Carbon Steel. Iron Steel Maker 1994, 21, 25–30. [Google Scholar]
  12. Joung, S.; Nam, W. Effects of Alloying Elements, Si and Cr, on Aging and Delamination Behaviors in Cold-Drawn and Subsequently Annealed Hyper-eutectoid Steel Wires. Met. Mater. Int. 2019, 25, 34–44. [Google Scholar] [CrossRef]
  13. Zhao, T.Z.; Zhang, S.H.; Zhang, G.L.; Song, H.W.; Cheng, M. Hardening and Softening Mechanisms of Pearlitic Steel Wire under Torsion. Mater. Des. 2014, 59, 397–405. [Google Scholar] [CrossRef]
  14. Zhou, L.; Fang, F.; Wang, L.; Hu, X.; Xie, Z.; Jiang, J. Torsion Performance of Pearlitic Steel Wires: Effects of Morphology and Crystallinity of Cementite. Mater. Sci. Eng. A 2019, 743, 425–435. [Google Scholar] [CrossRef]
  15. Toribio, J.; Ayaso, F.J.; González, B.; Matos, J.C.; Vergara, D.; Lorenzo, M. Tensile Fracture behavior of Progressively-Drawn Pearlitic Steels. Metals 2016, 6, 114. [Google Scholar] [CrossRef] [Green Version]
  16. Shiota, Y.; Tomota, Y.; Moriai, A.; Kamiyama, T. Structure and Mechanical Behavior of Heavily Drawn Pearlite and Martensite in a High Carbon Steel. Met. Mater. Int. 2005, 11, 371–376. [Google Scholar] [CrossRef]
  17. Zelin, M. Microstructure Evolution in Pearlitic Steels during Wire Drawing. Acta Mater. 2002, 50, 4431–4447. [Google Scholar] [CrossRef]
  18. Joung, S.W.; Kang, U.G.; Hong, S.P.; Kim, Y.W.; Nam, W.J. Aging Behavior and Delamination in Cold Drawn and Post-deformation Annealed Hyper-eutectoid Steel Wires. Mater. Sci. Eng. A 2013, 586, 171–177. [Google Scholar] [CrossRef]
  19. Nam, W.J.; Bae, C.M. Void Initiation and Microstructural Changes during Wire Drawing of Pearlitic Steels. Mater. Sci. Eng. A 1995, 203, 278–285. [Google Scholar] [CrossRef]
  20. Toribio, J.; Ovejero, E. Microstructure Orientation in a Pearlitic Steel Subjected to Progressive Plastic Deformation. J. Mater. Sci. Lett. 1998, 17, 1045–1048. [Google Scholar] [CrossRef]
  21. Toribio, J.; Ovejero, E. Microstructure Evolution in a Pearlitic Steel Subjected to Progressive Plastic Deformation. Mater. Sci. Eng. A 1997, 234–236, 579–582. [Google Scholar] [CrossRef]
  22. Read, H.G.; Reynolds, W.T., Jr.; Hono, K.; Tarui, T. AFPIM and TEM Studies of Drawn Pearlitic Wire. Scr. Mater. 1997, 37, 1221–1230. [Google Scholar] [CrossRef]
  23. Takahashi, J.; Tarui, T.; Kawakami, K. Three-dimensional Atom Probe Analysis of Heavily Drawn Steel Wires by Probing Perpendicular to the Pearlitic Lamellae. Ultramicroscopy 2009, 109, 193–199. [Google Scholar] [CrossRef] [PubMed]
  24. Li, Y.J.; Choi, P.; Borchers, C.; Chen, Y.Z.; Goto, S.; Raabe, D.; Kirchheim, R. Atom probe tomography characterization of heavily cold drawn pearlitic steel wire. Ultramicroscopy 2011, 111, 628–632. [Google Scholar] [CrossRef] [PubMed]
  25. Li, Y.J.; Choi, P.; Borchers, C.; Westerkamp, S.; Goto, S.; Raabe, D.; Kirchheim, R. Atomic-scale Mechanisms of Deformation-induced Cementite Decomposition in Pearlite. Acta Mater. 2011, 59, 3965–3977. [Google Scholar] [CrossRef]
  26. Maruyama, N.; Tarui, T.; Tashiro, H. Atom Probe Study on the Ductility of Drawn Pearlitic Steels. Scr. Mater. 2002, 46, 599–603. [Google Scholar] [CrossRef]
  27. Hammerle, J.R.; de Almeida, L.H.; Monteiro, S.N. Lower Temperatures Mechanism of Strain Aging in Carbon Steels for Drawn Wires. Scr. Mater. 2004, 50, 1289–1292. [Google Scholar] [CrossRef]
  28. Watte, P.; Humbeeck, J.V.; Aernoudt, E.; Lefever, I. Strain ageing in heavily drawn eutectoid steel wires. Scr. Mater. 1996, 34, 89–95. [Google Scholar] [CrossRef]
  29. Hinchliffe, C.E.; Smith, G.D.W. Strain Aging of Pearlitic Steel Wire during Post-drawing Heat Treatments. Mater. Sci. Technol. 2001, 17, 148–154. [Google Scholar] [CrossRef]
  30. Lee, J.W.; Lee, J.C.; Lee, Y.S.; Park, K.T.; Nam, W.J. Effects of Post-deformation Annealing Conditions on the Behavior of Lamellar Cementite and the Occurrence of Delamination in Cold-drawn Steel Wires. J. Mater. Process. Technol. 2009, 209, 5300–5304. [Google Scholar] [CrossRef]
  31. Fang, F.; Hu, J.; Chen, S.H.; Xie, Z.H.; Jiang, J.Q. Revealing Microstructural and Mechanical Characteristics of Cold-drawn Pearlitic Steel Wires undergoing Simulated Galvanization Treatment. Mater. Sci. Eng. A 2012, 547, 51–54. [Google Scholar] [CrossRef]
  32. Zhou, L.C.; Fang, F.; Wang, L.; Chen, H.Q.; Xie, Z.H.; Jiang, J.Q. Torsion Delamination and Recrystallized Cementite of Heavy Drawing Pearlitic Wires after Low Temperature Annealing. Mater. Sci. Eng. A 2018, 713, 52–60. [Google Scholar] [CrossRef]
  33. Xiang, L.; Liang, L.W.; Wang, Y.J.; Chen, Y.; Wang, H.Y.; Dai, L.H. One-step Annealing Optimizes Strength-ductility Tradeoff in Pearlitic Steel Wires. Mater. Sci. Eng. A 2019, 757, 1–13. [Google Scholar] [CrossRef] [Green Version]
  34. Zhang, X.; Godfrey, A.; Huang, X.; Hansen, N.; Liu, Q. Microstructure and strengthening Mechanisms in cold-drawn pearlitic steel wire. Acta Mater. 2011, 59, 3422–3430. [Google Scholar] [CrossRef]
  35. Gondo, S.; Tanemura, R.; Suzuki, S.; Kajino, S.; Asakawa, M.; Takemoto, K.; Tashima, K. Microstructures and Mechanical Properties of Fiber Textures forming Mesoscale Structure of Drawn Fine High Carbon Steel Wire. Mater. Sci. Eng. A 2019, 747, 255–264. [Google Scholar] [CrossRef]
  36. Zhang, X.; Hansen, N.; Godfrey, A.; Huang, X. Dislocation-based Plasticity and Strengthening Mechanisms in sub-20 nm Lamellar Structures in Pearlitic Steel Wire. Acta Mater. 2016, 114, 176–183. [Google Scholar] [CrossRef] [Green Version]
  37. He, Y.; Xiang, S.; Shi, W.; Liu, J.; Ji, X.; Yu, W. Effect of Microstructure Evolution on Anisotropic Fracture Behavior of Cold Drawing Pearlitic Steels. Mater. Sci. Eng. A 2017, 683, 153–163. [Google Scholar] [CrossRef]
  38. Li, Y.J.; Kosta, A.; Choi, P.; Goto, S.; Ponge, D.; Kirchheim, R.; Raabe, D. Mechanisms of Subgrain Coarsening and Its Effect on the Mechanical Properties of Carbon-supersaturated Nanocrystalline Hypereutectoid Steel. Acta Mater. 2015, 84, 110–123. [Google Scholar] [CrossRef]
  39. Jung, J.Y.; An, K.S.; Park, P.Y.; Nam, W.J. Effects of Wire Drawing and Annealing Conditions on Torsional Ductility of Cold Drawn and Annealed Hyper-Eutectoid Steel Wires. Metals 2020, 10, 1043. [Google Scholar] [CrossRef]
Figure 1. Torsion test equipment.
Metals 11 00178 g001
Figure 2. SEM micrograph (a) and inverse pole figure (IPF) map (b) of a hypereutectoid steel wire transformed at 620 °C.
Metals 11 00178 g002
Figure 3. The variations of (a) tensile strength (TS) and elongation to failure (EL), and (b) reduction of area (RA) and numbers of turns to failure in torsion (NT) with a drawing strain in cold drawn steel wires.
Metals 11 00178 g003
Figure 4. The variation of TS with annealing time at 500 °C in cold drawn steel wires received different drawing strains.
Metals 11 00178 g004
Figure 5. TEM micrographs, showing dislocation tangles in a steel wire drawn with ε = 1.13.
Metals 11 00178 g005
Figure 6. The plot of EL as a function of annealing time at 500 °C in cold drawn steel wires received different drawing strains.
Metals 11 00178 g006
Figure 7. TEM micrographs, showing (a) the presence of subgrains in a steel wire drawn with ε = 2.38 and annealed at 500 °C for 2 min, and (b) the dark field image of (b).
Metals 11 00178 g007
Figure 8. The plot of NT as a function of annealing time at 500 °C in hypereutectoid steel wires received different drawing strains.
Metals 11 00178 g008
Figure 9. The variation of RA with an annealing time at 500 °C in hypereutectoid steel wires received different drawing strains.
Metals 11 00178 g009
Figure 10. True stress–true strain curves of steel wires drawn with a strain of 1.59 and annealed at 500 °C for 2 min to 1 h.
Metals 11 00178 g010
Figure 11. SEM micrographs of steel wires received strains of (a) 0.99 and (b) annealed at 500 °C for 1 h, (c) received strains of 2.38, (d) and annealed at 500 °C for 1 h.
Metals 11 00178 g011
Figure 12. A schematic diagram of mean free path (MPF) difference due to annealing of cold drawn steel wires; (a) as-drawn with a strain of 1.95 and (b) annealed at 500 °C for 1 h [39].
Metals 11 00178 g012
Figure 13. SEM micrographs, showing the microstructural evolution, (a) as-drawn with ε = 2.38, and annealed at 500 °C for annealing time of (b) 2 min, (c) 20 min, and (d) 1 h.
Metals 11 00178 g013
Figure 14. A schematic diagram, describing the evolution of pearlitic microstructure during wire drawing and subsequent annealing.
Metals 11 00178 g014
Table 1. Diameter and drawing strain of a cold drawn steel wire for each drawing step.
Drawing step0123456789101112
Diameter (mm)4.94.444.023.643.292.982.702.452.212.011.821.651.49
Total reduction (%)-17.932.744.854.963.069.675.079.783.286.288.790.8
Drawing strain (ε)-0.200.400.590.800.991.191.391.591.781.982.182.38
Publisher’s Note: MDPI stays neutral with regard to jurisdictional claims in published maps and institutional affiliations.

