Article

Effect of Low-Temperature Annealing on Creep Properties of AlSi10Mg Alloy Produced by Additive Manufacturing: Experiments and Modeling

1
Dipartimento di Ingegneria Industriale e Scienze Matematiche (DIISM), Università Politecnica delle Marche, Via Brecce Bianche, 60131 Ancona, Italy
2
Dipartimento di Ingegneria e Architettura (DIA), Università di Parma, V.le G. Usberti 181/A, 43124 Parma, Italy
*
Author to whom correspondence should be addressed.
Metals 2021, 11(2), 179; https://doi.org/10.3390/met11020179
Submission received: 1 December 2020 / Revised: 14 January 2021 / Accepted: 18 January 2021 / Published: 20 January 2021
(This article belongs to the Special Issue High-Temperature Behavior of Metals)

Abstract

:
The effects of postprocessing annealing at 225 °C for 2 h on the creep properties of AlSi10Mg alloy were investigated through constant load experiments carried out at 150 °C, 175 °C and 225 °C. In the range of the experimental conditions here considered, the annealing treatment resulted in an increase in minimum creep rate for a given stress. The reduction in creep strength was higher at the lowest temperature, while the effect progressively vanished as temperature increased and/or applied stress decreased. The minimum creep rate dependence on applied stress was modeled using a physically-based model which took into account the ripening of Si particles at high temperature and which had been previously applied to the as-deposited alloy. The model was successfully validated, since it gave an excellent description of the experimental data.

1. Introduction

1.1. AlSi10Mg Alloy Produced by Additive Manufacturing: Main Structural Features

AlSi10Mg is an aluminum alloy which is extensively used in the production of parts by additive manufacturing (AM). Specifically, laser powder bed fusion (LPBF) is the most widespread AM technique for the production of components made of this alloy [1,2,3]. Starting from computer aided design (CAD) models, LPBF builds up new parts layer-upon-layer. Each layer is formed by small portions of powder (melt pools), which are selectively melted by the laser. The resulting very high cooling rates (~106 °C/s) and the sequence of passes, each of which acts as a thermal treatment on the lower and already solidified layers, produce an extremely fine structure with interesting mechanical properties [4,5,6]. The complex structure typical of AlSi10Mg AM products can be schematically described as follows:
i.
at a macroscopic level (100 μm–1 mm), the most noteworthy features are: (a) the high surface roughness resulting from the presence of melt pools; (b) the possible presence of porosities [7];
ii.
at a mesoscopic level (1–100 μm), the melt pool substructure is formed by columnar grains with diameters of several microns, which are subdivided into smaller long cells with diameters of a few hundreds of nm, separated by Si–Mg-rich eutectic regions [7,8,9];
iii.
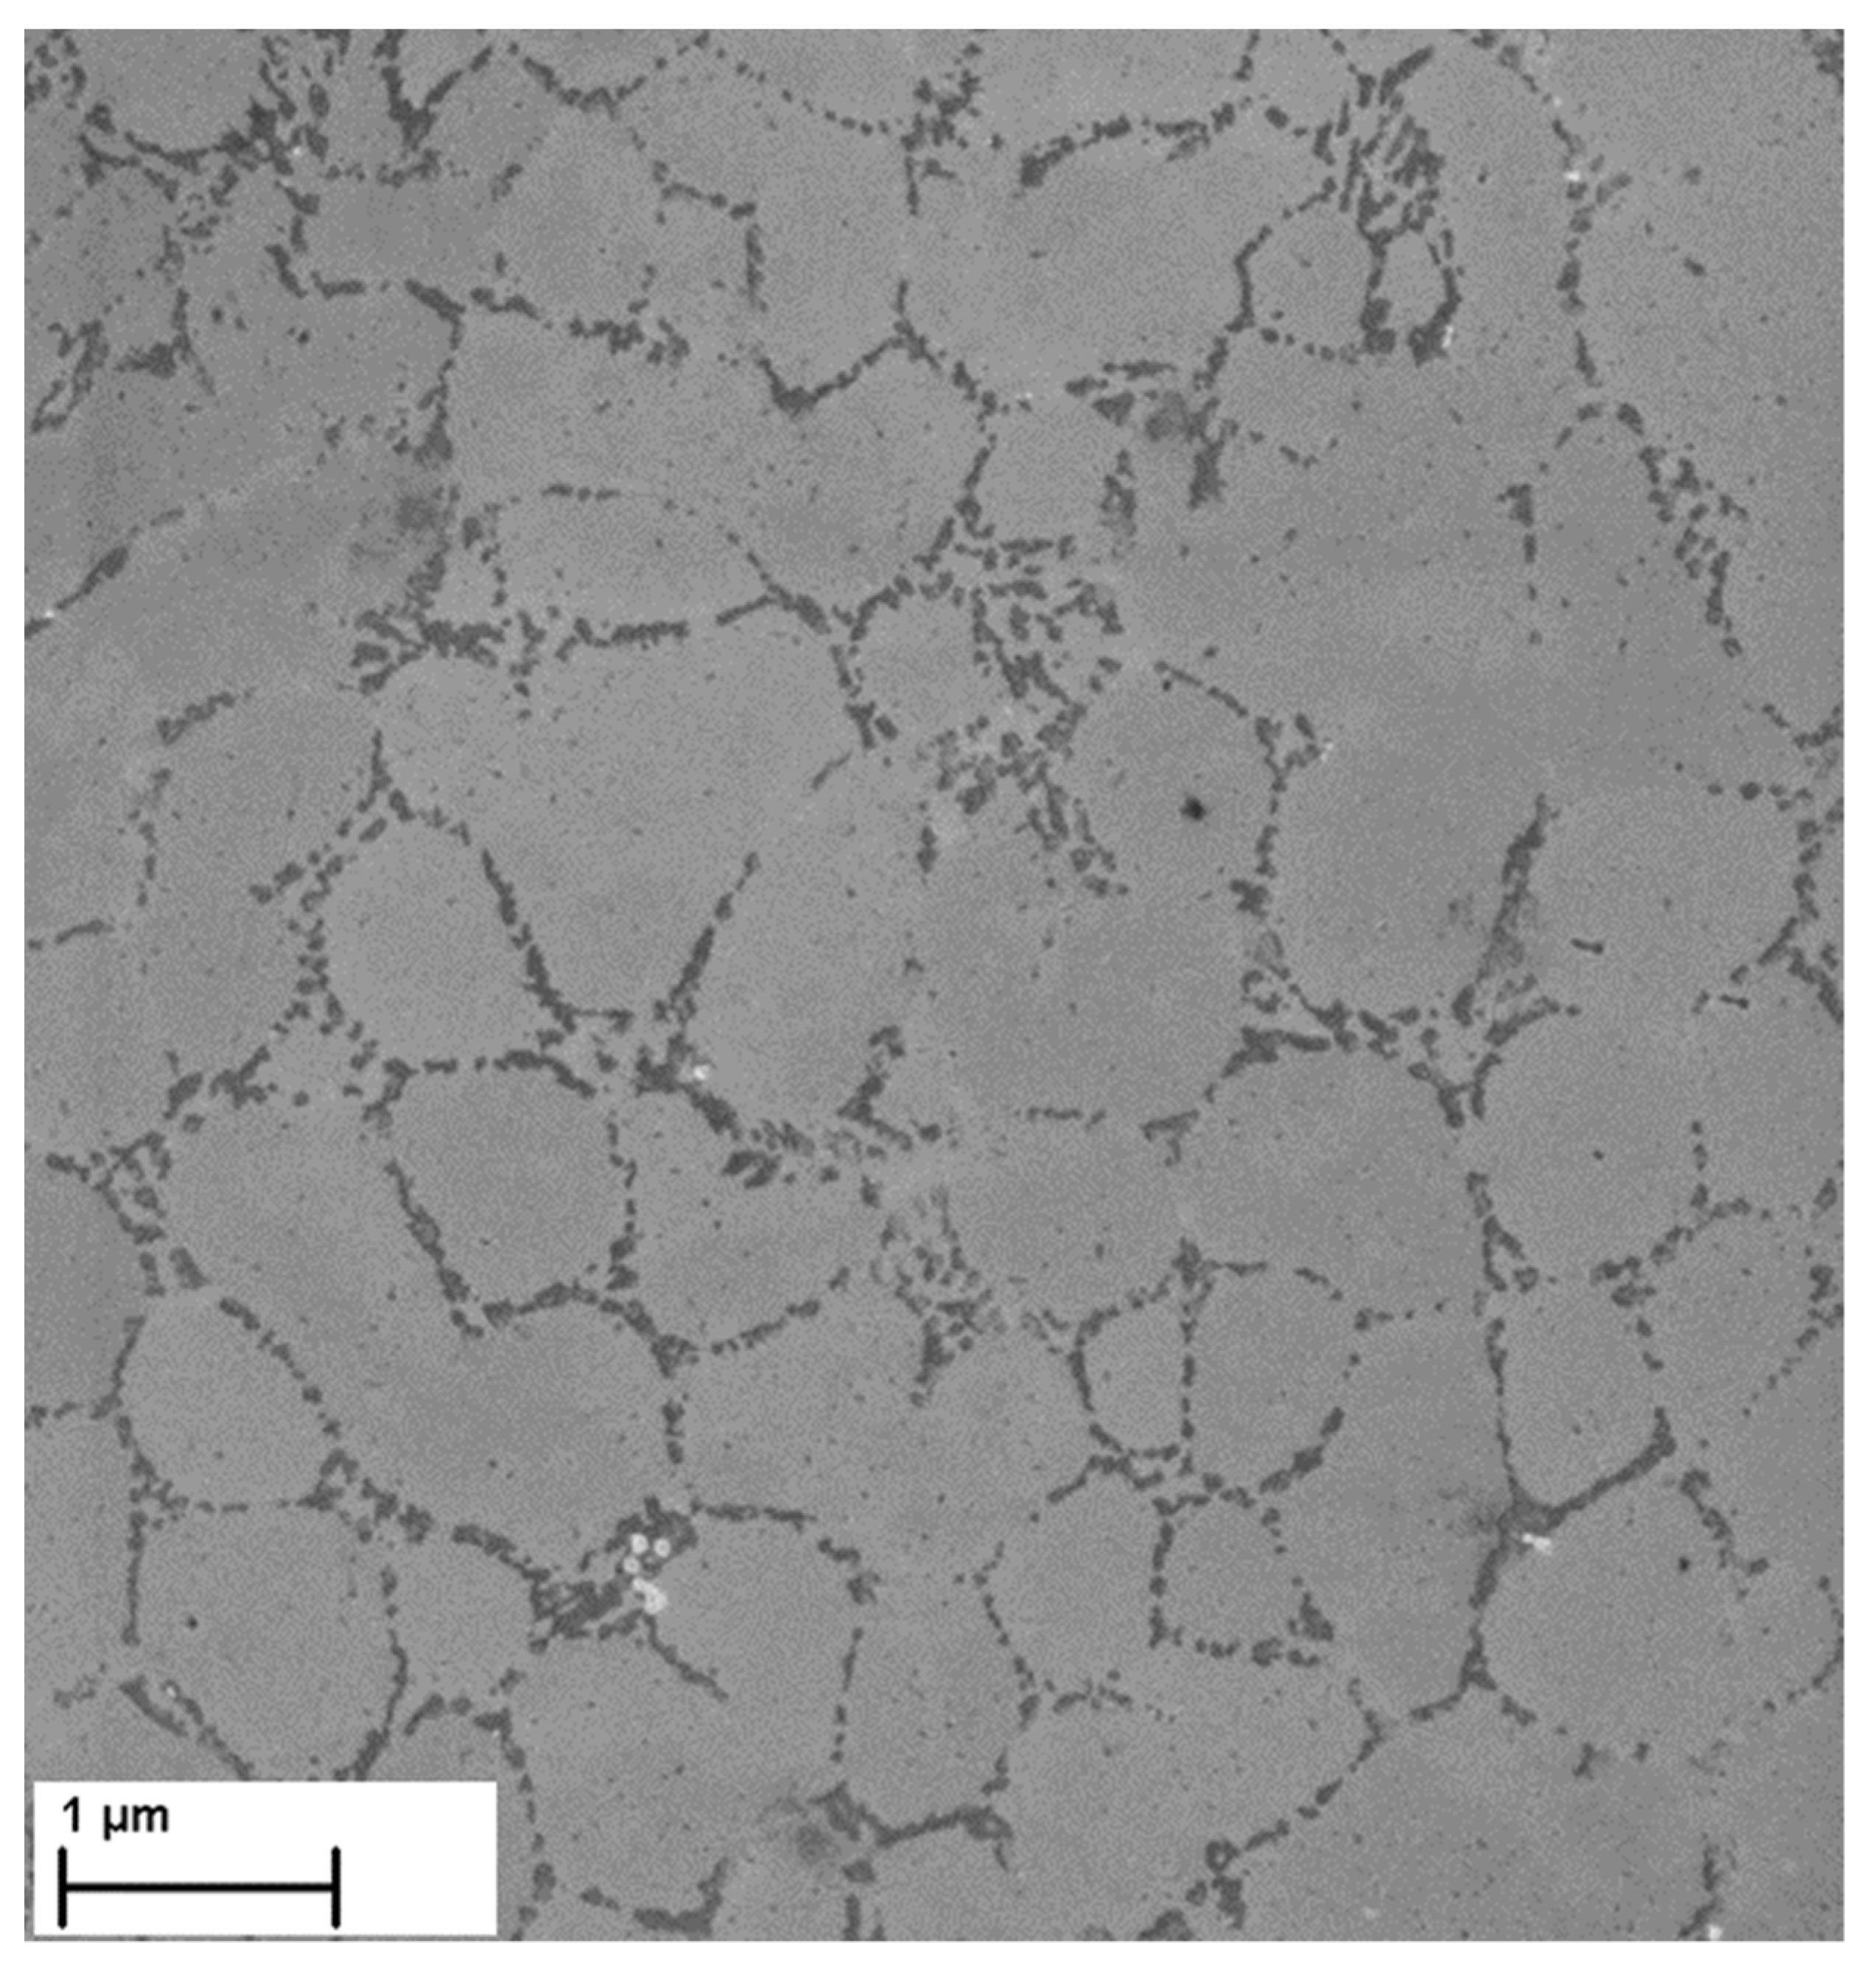
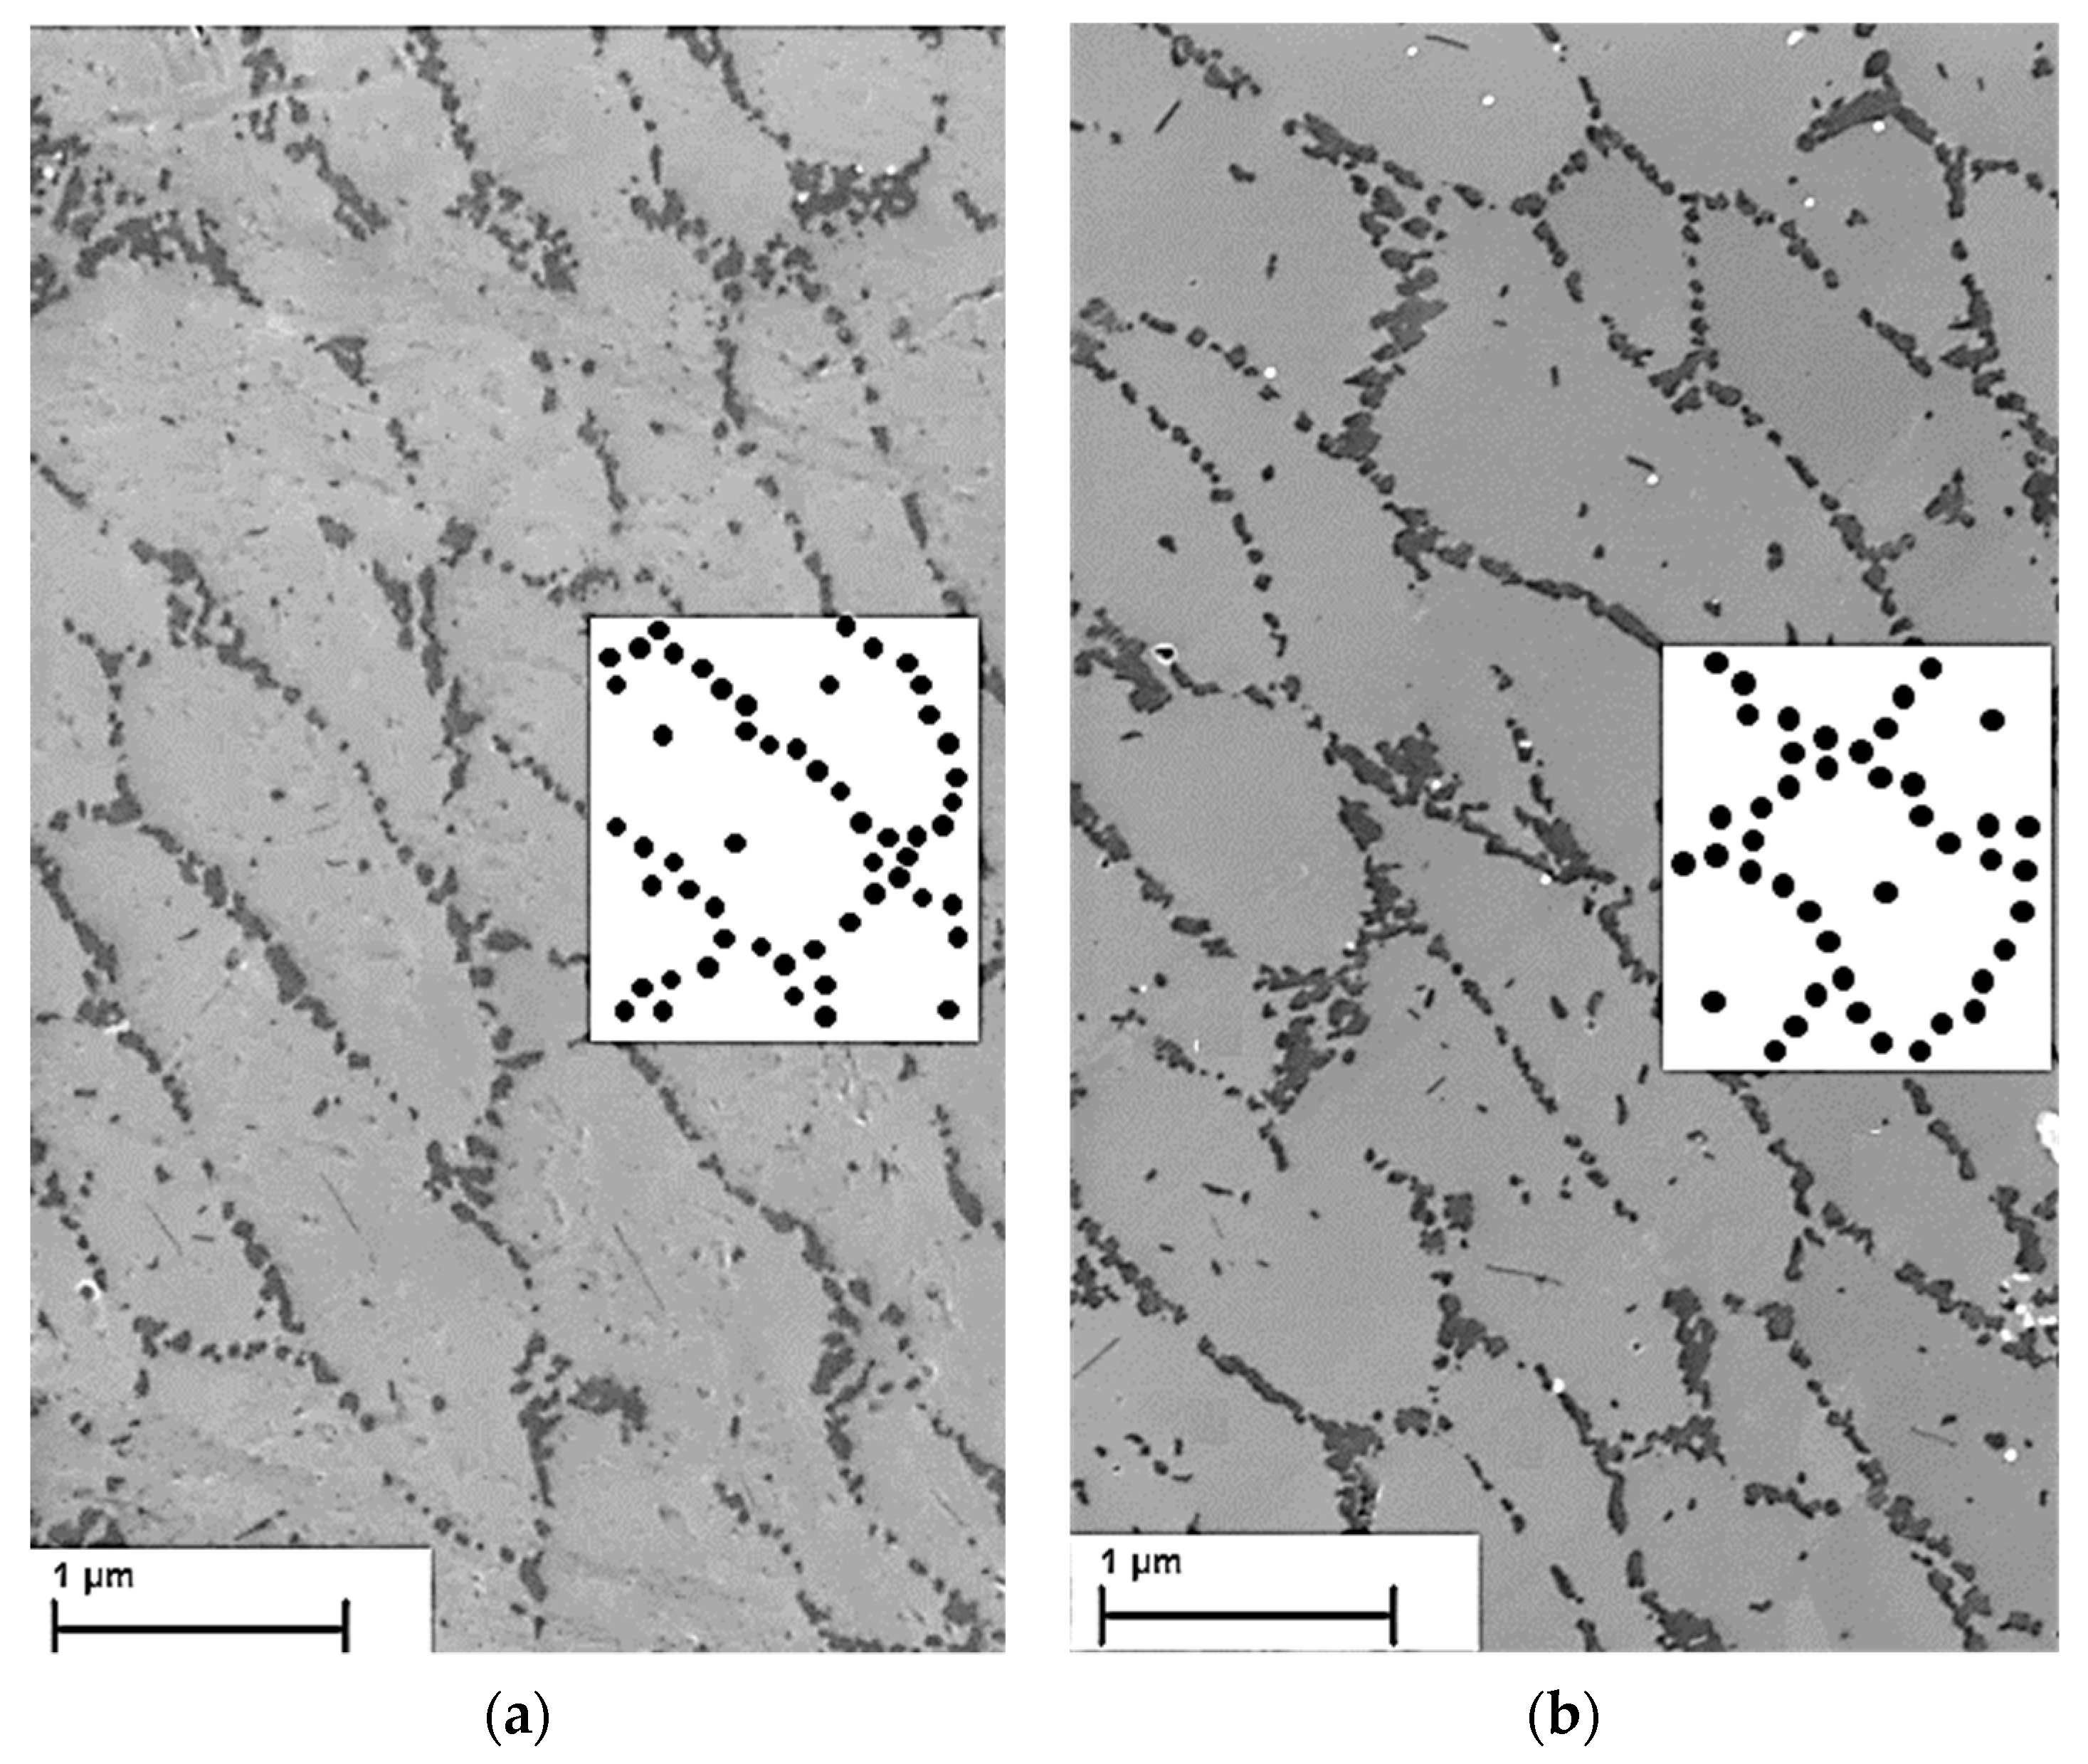
at a microscopic level (10 nm–1 μm), the long cells are subdivided into equiaxed subcells, again with diameters of a few hundreds of nm, separated by a network of Si-rich eutectic regions. The eutectic regions are richer in Si [10] and contain densely spaced Si particles, the size and distribution of which can vary as a function of process parameters [7,8] or part size [9].

1.2. AlSi10Mg Alloy Produced by Additive Manufacturing: Effect of Stress Relieving/Low Temperature Annealing

As mentioned above, the mechanical properties of as-formed AM parts are indeed peculiar. The extreme thinness of the substructure gives the alloy very high yield and ultimate tensile strengths, which are roughly comparable with those typical of the T6 state, although at the expense of low ductility. Residual stresses and the presence of porosity can further decrease ductility and toughness. For this reason, postprocessing usually includes a stress-relieving or annealing treatment, which increases ductility but significantly reduces the tensile properties of the alloy. An example of the variation in tensile yield stress with annealing temperature for a fixed duration of 2 h is reported in Figure 1 (data from [5,10,11,12,13]). The figure includes only the data for the low-temperature treatments, since at higher temperatures (400–550 °C) the meso- and microstructures undergo extensive variations that drastically change their very nature, which progressively approaches that of die-cast alloys.
The first obvious evidence from Figure 1 is the high variability in the mechanical properties of the alloy in the as-deposited state. This variation can be attributed to the differences in deposition conditions reflected in the different morphologies of the meso- and microstructures.
A point to be addressed is whether the complex trend of the yield strength can be somehow quantitatively described by a physically-based model. A simplified modeling approach [14] assumes that the mechanical properties of the alloy are mainly controlled by its microstructure, i.e., by the interaction between dislocations and obstacles at a submicron scale. The microstructural analysis carried out in [14] confirmed that, in the as-deposited state, the microstructure of the alloy consists of 500 nm-wide cells, surrounded by a network of fine Si particles (Appendix A shows a representative micrograph of the microstructure). The interior of the observed cells, by contrast, contains few remote fine particles. This structure can be modeled as a combination of soft zones surrounded by hard regions. The cell interior can thus be seen as a soft zone which dislocations can easily pass through, while the eutectic region is a hard region which becomes a strong obstacle to dislocation motion. The resulting material model (MM) can be therefore used to attempt a description of the softening phenomena illustrated in Figure 1.
If hard (eutectic) and soft (cells) zones deform under similar strain rates, the strength of the “composite” material can be calculated as
σ = f H   σ H + ( 1 f H ) σ S
where σH and σS are the stresses acting on the hard and soft zones, respectively, and fH is the volume fraction of the hard regions [15,16,17].
The yield stress of the alloy can then be estimated by assuming that the initial dislocation density is very low, thus showing that dislocation hardening does not significantly contribute to yielding. The stress necessary to start dislocation motion (yielding) in the hard and soft zones can therefore be tentatively calculated as
σ y i = σ a + σ O r i
where σa is the yield stress of an alloy containing 0.5% Mg (60 MPa), which includes the solute hardening contribution of this alloying element, and σOri is the Orowan stress in the i-region (soft or hard). The Orowan stress, in turn, can be estimated by its simplest formulation [18], namely
σ O r = 084 m G b L
where m = 3.05, G is the shear modulus, b is the Burgers vector and L is the surface-to-surface interparticle spacing. Following [14], it can be assumed that each cell has a size of 500 nm [8] and that the volume fraction of the eutectic portions is fH = 0.25. Both cells and eutectic regions contain fine Si particles of initial size d0. The initial surface-to-surface interparticle distance is assumed to be equivalent to d0 in the hard zones and to 200 nm in cell interiors.
Once precipitation to the equilibrium volume fraction is complete, particle size evolves during annealing due to coarsening/ripening. Details about the equations used for the calculation of particle size (dcalc) and interparticle distance after annealing are presented in Appendix A. The calculated variations in yield stress Equations (2) and (3) obtained for MM with different d0 values are presented in Figure 1. An analysis of the figure suggests that, in general terms, the combination of MM with the equations describing the Ostwald ripening phenomena of Si particles gives a reasonable description of the yield stress reduction after annealing. Nevertheless, at a closer look, some specific features emerge, namely:
i.
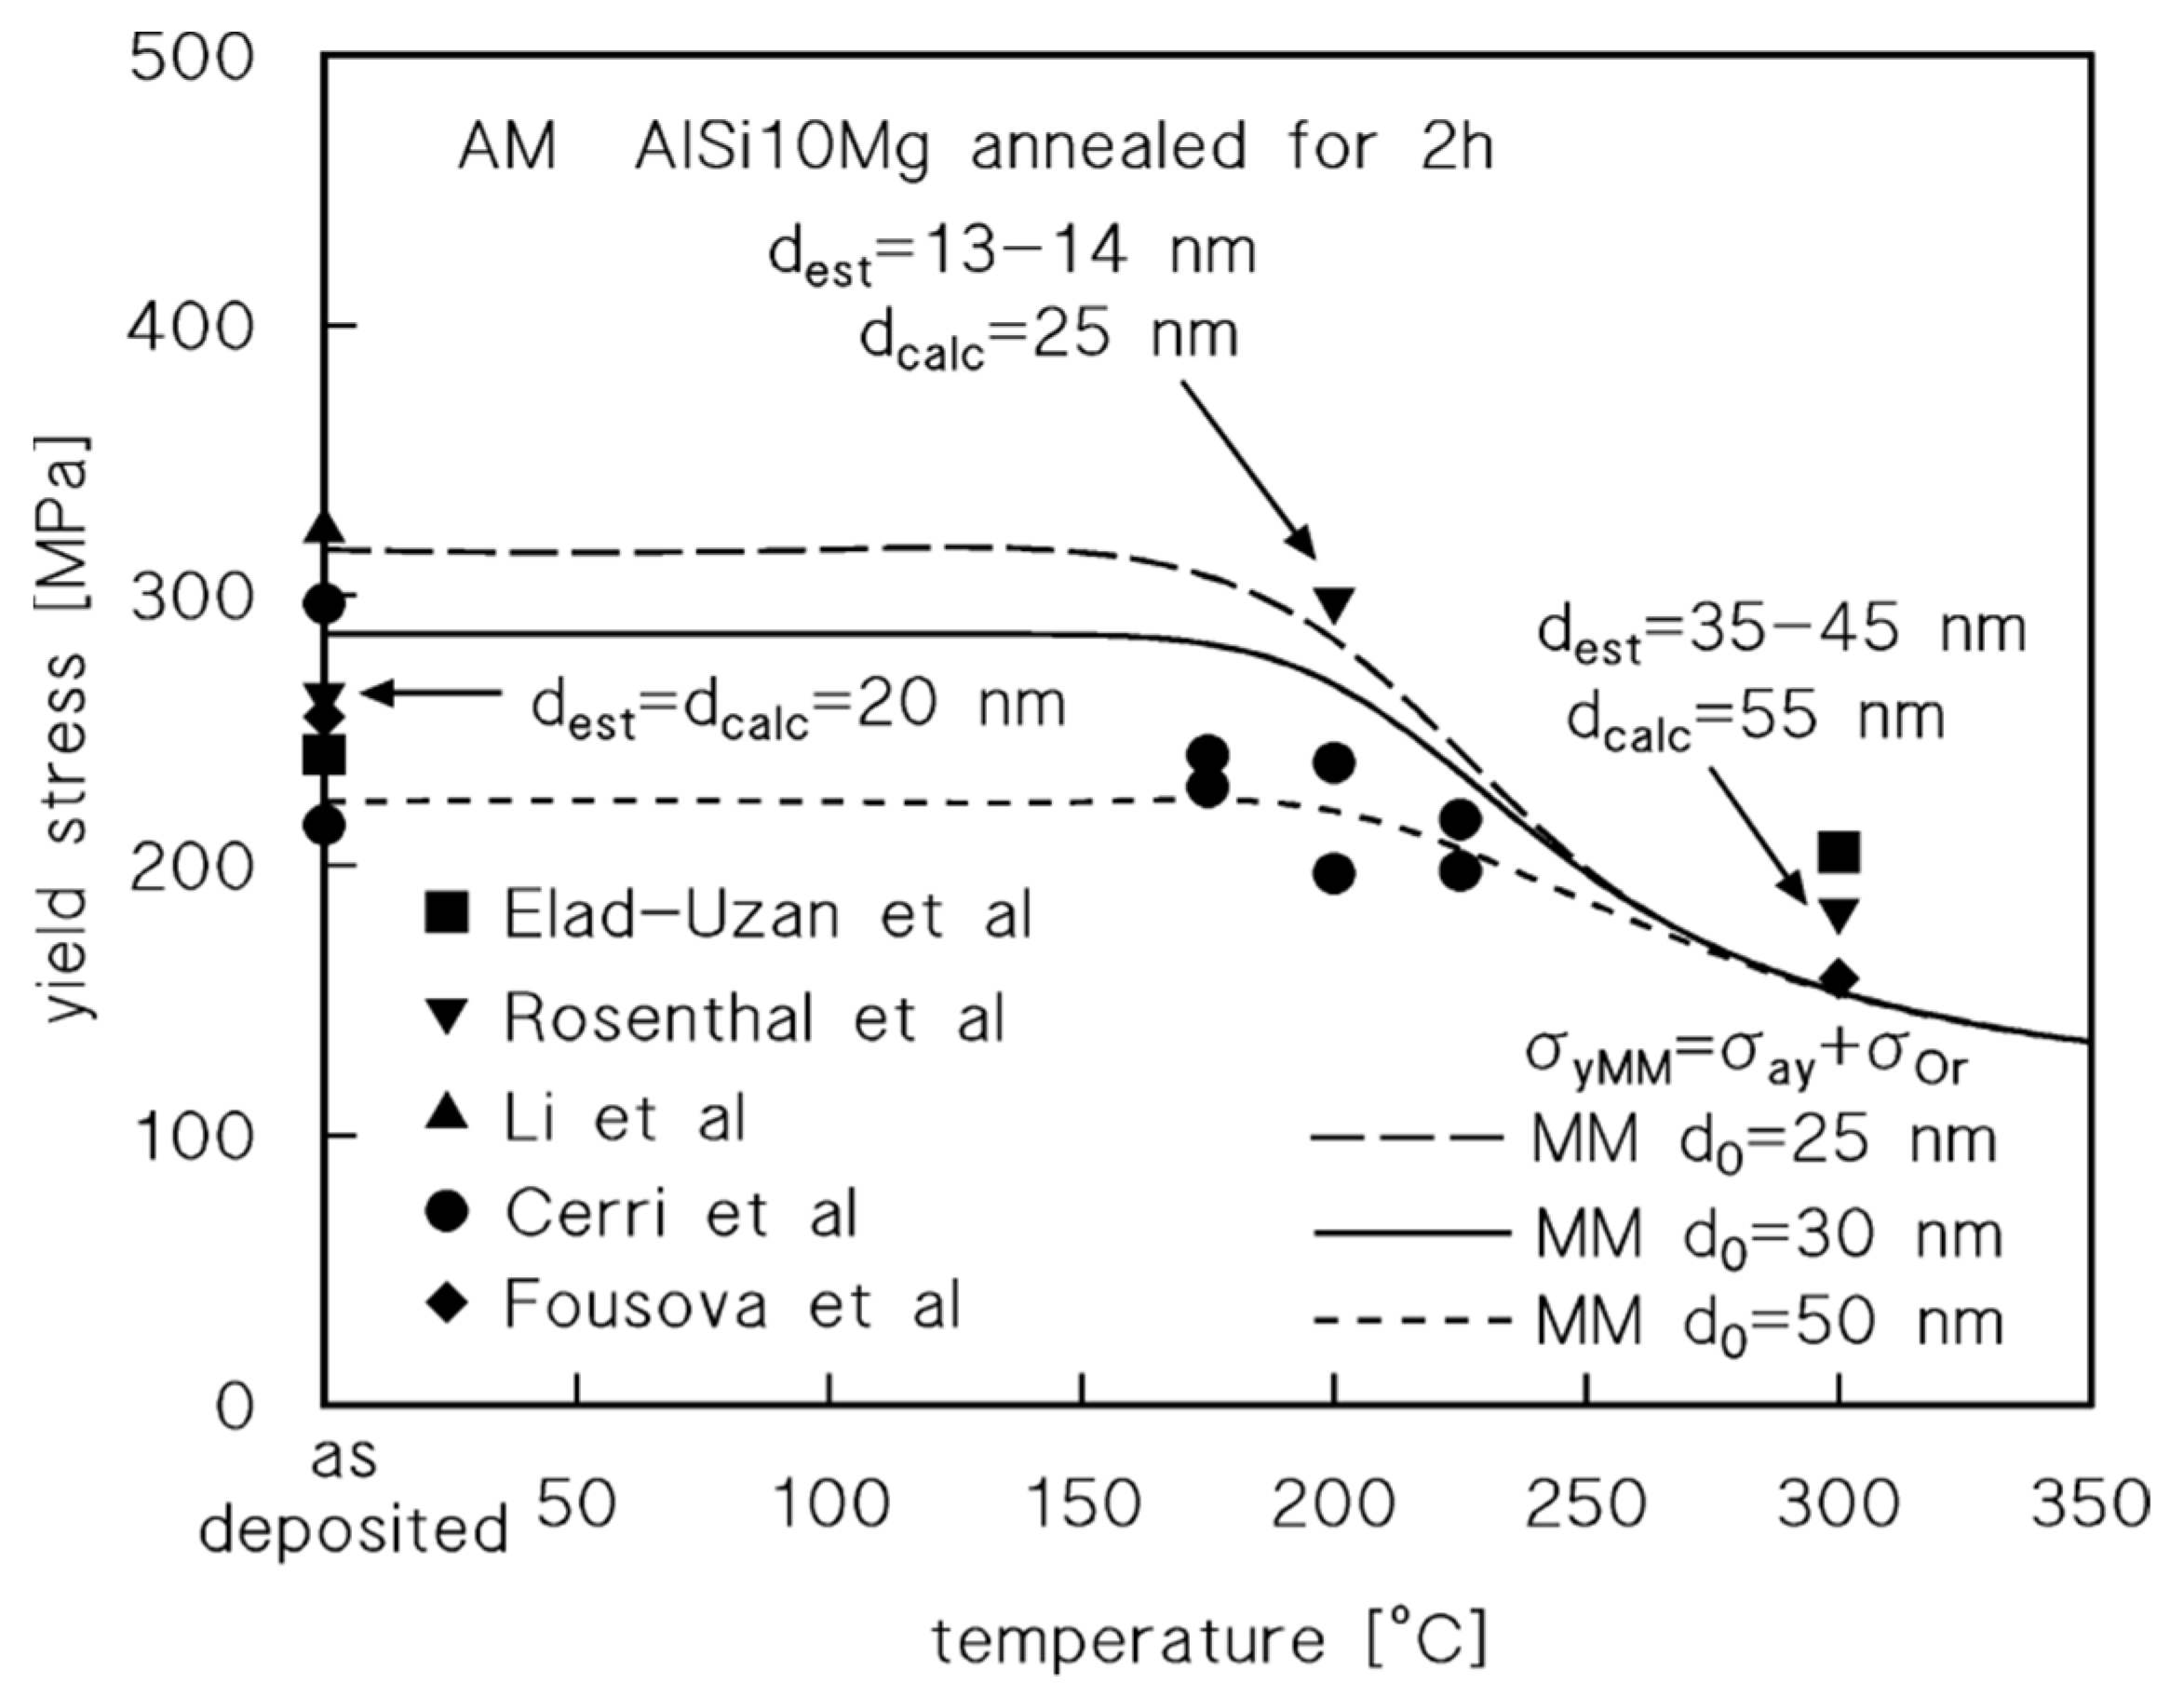
in some cases (see, for example data from [13]), the yield stress monotonically decreases with increasing annealing temperature. The phenomenon is quite correctly described by the model curves;
ii.
in other cases (see data from [5] and evidence presented in [10]), precipitation of Si is not completed during the AM process. Thus, in the early stages of low-temperature annealing, an additional precipitation of fine Si particles results in an increase in yield stress. This secondary precipitation is not accounted for by the equations presented in Appendix A, since the model assumes that ripening starts immediately upon annealing. This fact is easily confirmed when comparing the estimated value of the Si crystallites (dest) [5] and the calculated value of Si particle size (Figure 1). The secondary precipitation results in a finer particle size than the one predicted by the ripening equations.
The analysis above indicates that, also during stress relieving/low temperature annealing, AM AlSi10Mg alloy is affected by complex combinations of metallurgical phenomena (secondary precipitation, depletion of elements in solid solution, ripening). These phenomena occur on a microstructure the structural features of which (melt pool size, cell size, particle size, etc.) are strongly dependent upon processing conditions. On the other hand, both the temperature and duration of the postprocessing heat treatment need to be accurately selected in order to reduce brittleness and residual stresses, thus avoiding an excessive softening of the alloy. It is therefore reasonable to select the highest temperature which does not result in a marked decrease in strength (200–300 °C). However, in cases in which Si precipitation only occurs during AM, a marked reduction in strength [10] can be observed for temperatures above 250 °C, presumably due to particle ripening, which is well described by the model curves. On these bases, a temperature of 225 °C/2 h appears to be an interesting candidate for stress relieving/low-temperature annealing treatment.

1.3. AlSi10Mg Alloy Produced by Additive Manufacturing: Creep Response

Although generally exhibiting poor creep resistance, aluminum alloys have attracted considerable attention as case-study materials (see [19,20] for detailed discussions). In addition, Al–Si alloys have been clearly demonstrated to behave as a sort of natural metal matrix composite in which an Al matrix is reinforced by Si particles [21]. In this sense, the creep response of these composites reinforced with nm-sized Si particles is an intriguing matter that deserves detailed investigation.
The creep behavior of AlSi10Mg produced by AM was first investigated in [6,22] and then more extensively addressed in [14], in the latter case by testing the as-deposited material. The experimental data, when described by the well-known phenomenological equation
ε ˙ m = A ( T ) σ n
where A(T) is a temperature dependent parameter, gave a stress exponent n that decreased with increasing temperature from 22 to 15. Such high values of the stress exponent are indeed frequently attributed to the strengthening effect of particle–dislocation [17,18]. On these bases, the MM described in Section 1.2 was successfully used in combination with the set of constitutive equations introduced in [19,20], namely:
σ = σ 0 + σ p = σ 0 + α m G b ρ
ε ˙ m = 2 M c g τ l b L m ( σ ρ α m G b ) 4
M c g D 0 L b k T e x p ( σ ρ b 3 k T ) e x p { Q L R T [ 1 ( σ ρ R m a x ) 2 ] } e x p ( U s s R T )
R m a x = 1.5 ( R U T S   a + σ O r ) G T G R T
The meanings of the different symbols are illustrated in Table 1, while the derivation of the model is reported in Appendix B. For a given value of the minimum strain rate, each of Equations (5)–(8) was applied in the hard and soft zones. The particle strengthening term σ0 was assumed to be equivalent to the Orowan stress and the particle size at the time corresponding to the minimum in creep rate was calculated using the equations in Appendix A, by assuming d0 = 50 nm. The stress corresponding to the given strain rate was then expressed by Equation (1). The resulting model curves are presented in Figure 2.
The remarkable accuracy of the curves demonstrated that the basic assumption (creep response is mainly controlled by microstructure, i.e., by particle–dislocation interaction at a submicron scale, while, in this context, the mesostructure plays a minor role) was substantially correct.
The study presented here originated from the findings reported in the previous sections. As mentioned above, the creep response of Al10SiMg alloy has been dealt with by only a few studies and the subject is worth of deeper investigation. In addition, it has been recognized that annealing produces a softening of the microstructure but no quantitative models for this effect have been proposed. The aim of the study was thus twofold: i. to investigate the effect of low-temperature annealing (225 °C/2 h) on the creep response of heat-treated AM AlSi10Mg and compare the results with the as-deposited behavior; ii. to validate the quantitative predictions of the constitutive model that had already been successfully used for the as-deposited alloy.

2. Materials and Methods

Dogbone creep samples made of Al-9.6%Si-0.38% Mg alloy with a gauge length of 25 mm and a square section of 3 mm × 3 mm were produced by an SML500 machine (SLM Solutions, Lubecca, Germany) with the following deposition parameters: substrate temperature 150 °C, laser power 350 W, spot size 80 μm, scan speed 1.15 m/s, hatch spacing 170 μm, layer thickness 50 μm. The growth direction was parallel to the sample axis (loading direction). Stress relieving/low-temperature annealing at 225 °C for a duration of 2 h was applied to the as-built samples.
Constant load tensile creep experiments were carried out in air on the as-deposited samples at 150 °C, 175 °C and 225 °C. The samples were mostly strained up to rupture, although longer tests were interrupted after the end of the primary stage. The samples were heated in a three-zone furnace and both elongation, measured by LVDT, and temperature were continuously recorded during the test. Temperature was measured by four K-type thermocouples.

3. Results

After annealing, the microstructure of the alloy remained substantially similar to that shown in Figure A1 due the short annealing time, which, at maximum, could lead to an increase of a few nm in Si particle size.
Figure 3a shows typical examples of the strain vs. time creep curves. Figure 3b shows representative creep strain rate vs. strain curves. The alloy exhibited the conventional three-stage behavior, with a well-defined primary region, a minimum creep rate range and a tertiary stage.
Figure 4 plots the minimum creep rate dependence on applied stress for the annealed alloy. The figure also plots the same data of Figure 2, obtained in [14], by testing the same material in the as-deposited condition. As in the case of the untreated alloy, the annealed material also exhibited high values for the stress exponent (n = 23, 29 and 17 at 150 °C, 175 °C and 225 °C respectively). The creep rates of the heat- treated alloy were higher than those of the as-deposited material, although the difference became smaller as the temperature and/or duration of the test increased. Within the range of experimental conditions investigated, the datasets for the as-deposited and the heat-treated materials align on almost parallel curves, i.e., indicating that the stress exponent was roughly equivalent, only at 150 °C. These findings indicate that, while at low temperatures the two materials behaved quite differently and heat treatment resulted in a marked worsening of the creep response, in the high temperature regime, in particular for long tests, i.e., low stresses, this effect progressively vanished and creep response became more and more similar.
Figure 5 plots the time to minimum creep rate (tm) as a function of the minimum creep rate. The data align on a single line of slope −1. The fact that the experimental data conform to the simple equation
ε ˙ m t m = c m
implies that the same time-dependent mechanisms operate within the range of experimental conditions investigated.

4. Discussion

4.1. Analysis of the Effect of Low-Temperature Annealing on Creep Response

Section 3 (Figure 4) unambiguously shows that even a low-temperature annealing at 225 °C for 2 h results in a marked decrease in creep properties, at least as long as the testing temperature does not exceed 150 °C. At higher temperatures, the reduction in creep response is more limited, because the as-deposited alloy also undergoes extensive softening during high-temperature exposure. In order to quantify the loss in creep resistance, the data in Figure 4 were used to calculate Δσ, expressed as
Δ σ = σ a d σ h t
where σad and σht are the stresses applied to obtain a given value of the minimum strain rate in as-deposited and heat-treated alloys, respectively (Figure 6). Figure 6 only includes data for 150 and 175 °C, since at the higher temperature the experimental results for heat-treated and as-deposited alloys substantially overlap.
Figure 6 shows that the as-deposited alloy creep tested at 150 °C maintained a 50 MPa advantage in strength until the minimum creep rate decreased below 10−6 s−1. By contrast, at 175 °C, Δσ monotonically decreased from 47 to 7 MPa with decreasing minimum creep rate. The softening obviously originates from the microstructural evolution during high-temperature exposure. Postprocessing annealing results in ripening/coarsening of the Si particles, which are the major sources of strengthening at high temperatures. At low testing temperatures, where ripening is a sluggish phenomenon, the advantage in creep strength is maintained until the time of exposure becomes so long that particles start to coarsen even in the as-deposited material. At 175 °C ripening is more rapid and the initial advantage of the as-deposited state, i.e., the presence of smaller particles in the microstructure, is rapidly lost and the two materials progressively become more and more similar. Although reasonable, this qualitative explanation needs to be supported by a more quantitative analysis of the relationship between creep response (the minimum creep rate) and the microstructural features (Si particle size and interparticle distance), which will be dealt with in the following section.

4.2. Modeling the Effect of Low-Temperature Annealing on Creep Response

Section 4.1 provides useful indications about the effect of annealing on creep response. Nevertheless, the combination of the constitutive equations illustrated in Appendixes A and B with the MM and Equation (1) provides a useful tool for modeling creep response. All the parameters of the different equations are available, since the model was already successfully used to describe the as-deposited creep response (Figure 2). The only missing term is the time corresponding to the minimum creep rate, which, however, can be easily obtained from Figure 5. The annealing time was sufficiently short to not cause major variations in the microstructure, although a barely discernible increase in size was nevertheless expected. Thus, Equation (A6) in Appendix A can be used to estimate particle size after annealing. By taking d0 = 50 nm, as in [14], after 2 h at 225 °C a particle size close to 59 nm can be obtained. Equation (A6) and Equation (9) can then be combined and used to estimate the size of the particles at tm for a given value of the minimum strain rate. Since the surface-to-surface interparticle spacing can be expressed as
L = d ( 0.5 6 f / π 2 3 )
where f is the volume fraction of the particles (here assumed not to vary during the test, both in hard and soft zones), one obtains
L = L 0 d d 0
For the particles inside the cells only, particle distance was assumed to increase with time, due to ripening, until it reached half of the cell size (250 nm) and then to remain constant for longer durations. This assumption implies that, even for long times of exposure, at least one single particle remains in the cell interior. Once L has been determined, the equations in Appendix B can be used to calculate the model curves for the heat-treated material shown in Figure 7.
If one considers that all the parameters except the cm constant, which was, in fact, the only experimental value obtained from Figure 4, were calculated for the as-deposited alloy, the accuracy of the description is remarkable. The model significantly overestimates the material strength only in the very high strain rate region.
Figure 8a plots a comparison between the model curves obtained for the as-deposited and the heat-treated alloy; Figure 8b shows the experimental data available at 225 °C for the as-deposited alloy [14] and for the alloy annealed for 2 h at 225 °C (this study) and at 300 °C [22].
An interesting feature, which is qualitatively described in the previous subsection and well documented by Figure 8b, is the progressive convergence between the curves obtained for the different initial states as the strain rate decreases, i.e., the time of exposure increases. In addition, the advantage in creep response of the as-deposited alloy decreases as temperature increases (Figure 8a).
Both Figure 7 and Figure 8 validate the prediction of the model proposed in [14], which is sufficiently accurate to constitute a valid tool for the prediction of the creep response of the alloy investigated in different initial states.
The appropriateness of the basic assumption of the model, i.e., that the key factors controlling the creep response are the size and distribution of second-phase particles, has thus been confirmed. Any annealing treatment causes ripening of the Si particles and, as a consequence, a reduction of the creep resistance of the alloy. The accuracy of the description implies that the model is a valid tool for the prediction of the creep response of Al–Si alloys, provided that sufficient data on the microstructural analysis and some information on the shape of the creep curve (the correlation between minimum creep rate and the time at which it is measured) are available. Ingot or rheo/thixo-casting products actually exhibit microstructures which, after solution treatment, largely repeat the same morphology as that shown in Appendix A but at a larger scale, i.e., with much larger “cells” (the grains of Al) surrounded by a network of very coarse Si particles (see, for example, [23,24]). In this regard, the model presented here could in principle also be used for the analysis of the creep response of these conventionally produced materials.

5. Conclusions

The effect of low-temperature annealing at 225 °C on creep response was investigated by constant load experiments carried out at 150 °C, 175 °C and 225 °C. A comparison with the experimental data obtained by testing the as-deposited alloy demonstrated that annealing results in a loss of creep resistance that is more pronounced at lower temperatures. In general, the creep response of the as-deposited and of the heat-treated alloys became more and more similar as temperature increased and/or applied stress decreased. The alloy response was then compared with the prediction obtained from a physically-based model which took into account the effect of Si particle ripening. In order to apply the constitutive equations previously developed to describe pure aluminum and simpler Al alloys, the complex microstructure of AM AlSi10Mg was assimilated to that of a composite formed by soft zones (cell interiors) and hard zones (Si-rich eutectic regions). The constitutive equations were then used on the resulting simplified material model described by the rule of mixture. Since the values of all the parameters had been identified by studying the as-deposited material, only one datum was required for the physically-based model to work, namely the relationship between the time to minimum creep rate and minimum creep rate. The resulting description of the annealed material was excellent, as in the case of the as-deposited alloy, and the model was successfully validated. The straightforward conclusion is that the key factors which determine the creep response of the investigated material are the size and distribution of the second-phase particles. Annealing causes an increase in particle size and a parallel decrease in creep resistance that can be easily quantified by the proposed model.

Author Contributions

Conceptualization, S.S.; methodology, S.S., M.C.; software, C.P.; validation, C.P., S.S.; formal analysis, C.P., S.S.; investigation, C.P., E.S., E.C., E.G., S.S.; resources, E.C., S.S.; data curation, C.P.; writing—original draft preparation, C.P.; writing—review and editing, S.S.; supervision, S.S.; funding acquisition, E.C., S.S. All authors have read and agreed to the published version of the manuscript.

Funding

This research was funded by the Grant of Excellence Departments, MIUR-Italy (ART. 1, 314-337 LEGGE 232/2016).

Institutional Review Board Statement

Not applicable.

Informed Consent Statement

Not applicable.

Data Availability Statement

The data presented in this study are available on request from the corresponding author.

Conflicts of Interest

The authors declare no conflict of interest.

Appendix A

Figure A1 shows the microstructure of the alloy in the as-deposited state, with the cells surrounded by the fine Si particles.
During high-temperature exposure, once the precipitation process ends and the equilibrium volume fraction of the secondary phase (Si) is reached, the particles are thought to evolve by Ostwald ripening, which is described by an equation in the form
d 3 = d 0 3 + 64 γ C V m 2 9 R T D e f f t
where d0 is the initial particle size, d the particle size at time t, γ the interfacial energy, C the equilibrium concentration of the species that form the particles and Vm the molar volume of the particle.
Figure A1. Microstructure of the alloy in the as-deposited state.
Metals 11 00179 g0a1
The effective diffusion coefficient can be written as
D e f f D L s + A p 2 ρ m D p s
where DLs = D0Ls exp(−QLs/RT) is the lattice diffusion coefficient of the element forming the particle, Dps = D0ps exp(−Qps/RT) the corresponding pipe diffusion coefficient and ρm the mobile dislocation density. Ap2 is the effective sectional area for diffusion which takes into account the scavenging effect of solute atoms by moving dislocations. The mobile dislocation density can be obtained with the Orowan equation
ε ˙ = b m ρ m v m
where vm is the dislocation velocity. Combined with Equation (A1), Equation (A2) gives
D e f f = D L s + A p 2 m b v m ε ˙ D p s
If Ap2 is indeed supposed to be proportional to the dislocation velocity vm, then
D e f f = D L s ( 1 + B ε ˙ D p s D L s ) = D L s [ 1 + B ε ˙ e x p ( Q L s Q p s R T ) ]
where B = B’D0ps/D0Ls is a constant. Equation (A5) is formally analogous to a similar equation proposed by Cohen [25]. The Ostwald ripening equation thus becomes
d 3 = d 0 3 + K g D L s t + K g D L s B e x p ( Q L s Q p s R T ) ε t ˙
with
K g = 64 γ C V m 2 9 R T
Since in the temperature range considered in this study the equilibrium solid solubility of Si in Al can be considered to be almost constant, the weak temperature dependence of Kg was neglected. The activation energies in Equation (A6) were considered to be QLs = 124 kJ mol−1 and Qps = 0.6 QLs; the calculation in [14] gave D0Ls Kg = 2 × 10¹⁷ nm3 h−1 and B = 10 s−1.
In order to verify the accuracy of the model in predicting the effect of high-temperature exposure on particle size, the diameter of the Si particles after 30 h annealing (initial size 50 nm) was estimated and compared with the real microstructure in Figure A2. At first glance, the model overestimates the size of the single particles; however, in the real microstructure, several agglomerates of these smaller Si precipitates can be observed. These agglomerates obviously behave as single larger particles. As a result, one can safely conclude that, although oversimplified, the description of the real microstructure of the alloy provided by the model is accurate.
Equation (A6) was used to calculate the size of the particles in two conditions: i. after annealing, under the assumption that the precipitation process was completed during AM and ripening started just at the beginning of the postprocessing heat treatment; ii. during creep experiments, at the time corresponding to the minimum creep rate. In the latter case, since during primary creep the samples had experienced strain rates much higher than the minimum value, the value 10   ε ˙ m was used for ε ˙ in Equation (A6).
Figure A2. Comparison between the calculated particle size (the black circles in the insert, which qualitatively show the microstructure of the model material) and the real structure after annealing for 30 h. The diameter of the black circles in the inserts corresponds to the calculated particle size at the given magnification. (a) 175 °C, calculated size of Si particles = 53 nm; (b) 200 °C, calculated size of the particles = 63 nm.
Metals 11 00179 g0a2

Appendix B

The constitutive model was developed for Cu by Sandström [26,27,28] and was later modified to describe Al and its alloys [19,20]. The starting point is the well-known Taylor equation, here considered in a simplified form:
σ = σ 0 + σ p = σ 0 + α m G b ρ
where ρ is the dislocation density and σρ = αmGbρ1/2 is the dislocation hardening term. The stress σ0 represents the strengthening contribution due to the interaction between fine particles and dislocations. This formulation of the Taylor equation does not take into account the stress required to move the dislocation in the absence of other dislocations nor the viscous drag stress due to solute atoms, since both these quantities, in a dilute solid solution reinforced by a fine dispersion of particles, are usually negligible when compared to the strengthening term due to particle–dislocation interaction.
The evolution of dislocation density during straining can be expressed as [26,27,28]
d ρ d ε = m b L * ω ρ 2 ε ˙ M c g τ l ρ 2
where ω is a constant, τl is the dislocation line tension (τl = 0.5Gb2), Mcg is the dislocation mobility and L* is the dislocation mean free path. At high temperatures, the equation can be simplified to
d ρ d ε = m b L * 2 ε ˙ M c g τ l ρ 2
The dislocation mean free path represents the distance traveled by a dislocation before it undergoes a reaction. In the presence of fine particles obstructing dislocation mobility, with L interparticle spacing, the dislocation mean free path can be expressed in the form [20]
1 L * = ρ C L + 1 L
For alloys with densely spaced particles, Equation (A11) becomes
1 L * 1 L
At steady state, the combination of Equations (A8), (A10) and (A11) gives
ε ˙ m = 2 M c g τ l b L m ( σ ρ α m G b ) 4
Dislocation mobility in dilute Al–X solid solutions (where X is either Si or Mg) is [26,27,28]:
M c g D 0 L b k T e x p ( σ ρ b 3 k T ) e x p { Q L R T [ 1 ( σ ρ R m a x ) 2 ] } e x p ( U s s R T )
where Rmax is the maximum strength of the alloy, tentatively quantified at room temperature as 1.5 times the ultimate tensile strength (RUTS) of the alloy. The Uss term describing the energy necessary for solute atoms to jump in and out of the clouds formed around dislocations has the form [27]
U s s = 1 3 π   1 + ν   1 ν   G Ω δ R k
where ν is Poisson’s ratio (=0.3 in Al), Ω is the average Al atomic volume and δ is the volume atomic misfit.

References

  1. Aboulkhair, N.T.; Simonelli, M.; Parry, L.; Ashcroft, I.; Tuck, C.; Hague, R. 3D printing of Aluminium alloys: Additive Manufacturing of Aluminium alloys using selective laser melting. Prog. Mater. Sci. 2019, 106, 100578. [Google Scholar] [CrossRef]
  2. Herzog, D.; Seyda, V.; Wycisk, E.; Emmelmann, C. Additive manufacturing of metals. Acta Mater. 2016, 117, 371–392. [Google Scholar] [CrossRef]
  3. Hebert, R.J. Viewpoint: Metallurgical aspects of powder bed metal additive manufacturing. J. Mater. Sci. 2016, 51, 1165–1175. [Google Scholar] [CrossRef]
  4. DebRoy, T.; Wei, H.L.; Zuback, J.S.; Mukherjee, T.; Elmer, J.W.; Milewski, J.O.; Beese, A.M.; Wilson-Heid, A.; De, A.; Zhang, W. Additive manufacturing of metallic components—Process, structure and properties. Prog. Mater. Sci. 2018, 92, 112–224. [Google Scholar] [CrossRef]
  5. Rosenthal, I.; Shneck, R.; Stern, A. Heat treatment effect on the mechanical properties and fracture mechanism in AlSi10Mg fabricated by additive manufacturing selective laser melting process. Mater. Sci. Eng. A 2018, 729, 310–322. [Google Scholar] [CrossRef]
  6. Read, N.; Wang, W.; Essa, K.; Attallah, M.M. Selective laser melting of AlSi10Mg alloy: Process optimisation and mechanical properties development. Mater. Des. 2015, 65, 417–424. [Google Scholar] [CrossRef] [Green Version]
  7. Trevisan, F.; Calignano, F.; Lorusso, M.; Pakkanen, J.; Aversa, A.; Ambrosio, E.P.; Lombardi, M.; Fino, P.; Manfredi, D. On the selective laser melting (SLM) of the AlSi10Mg alloy: Process, microstructure, and mechanical properties. Materials 2017, 10, 76. [Google Scholar] [CrossRef] [Green Version]
  8. Wu, J.; Wang, X.Q.; Wang, W.; Attallah, M.M.; Loretto, M.H. Microstructure and strength of selectively laser melted AlSi10Mg. Acta Mater. 2016, 117, 311–320. [Google Scholar] [CrossRef] [Green Version]
  9. Takata, N.; Kodaira, H.; Suzuki, A.; Kobashi, M. Size dependence of microstructure of AlSi10Mg alloy fabricated by selective laser melting. Mater. Charact. 2018, 143, 18–26. [Google Scholar] [CrossRef]
  10. Fousová, M.; Dvorský, D.; Michalcová, A.; Vojtěch, D. Changes in the microstructure and mechanical properties of additively manufactured AlSi10Mg alloy after exposure to elevated temperatures. Mater. Charact. 2018, 137, 119–126. [Google Scholar] [CrossRef]
  11. Li, W.; Li, S.; Liu, J.; Zhang, A.; Zhou, Y.; Wei, Q.; Yan, C.; Shi, Y. Effect of heat treatment on AlSi10Mg alloy fabricated by selective laser melting: Microstructure evolution, mechanical properties and fracture mechanism. Mater. Sci. Eng. A 2016, 663, 116–125. [Google Scholar] [CrossRef]
  12. Uzan, N.E.; Shneck, R.; Yeheskel, O.; Frage, N. Fatigue of AlSi10Mg specimens fabricated by additive manufacturing selective laser melting (AM-SLM). Mater. Sci. Eng. A 2017, 704, 229–237. [Google Scholar] [CrossRef]
  13. Cerri, E.; Ghio, E. AlSi10Mg alloy produced by Selective Laser Melting: Relationships between Vickers microhardness, Rockwell hardness and mechanical properties. Metall. Ital. 2020, 7–8, 5–17. [Google Scholar]
  14. Paoletti, C.; Santecchia, E.; Cabibbo, M.; Cerri, E.; Spigarelli, S. Modelling the creep behavior of an AlSi10Mg alloy produced by additive manufacturing. Mater. Sci. Eng. A 2021, 140138. [Google Scholar] [CrossRef]
  15. Nix, W.D.; Ilschner, B. Mechanisms Controlling Creep of Single Phase Metals and Alloys; Haasen, P., Gerold, V., Kostorz, G., Eds.; Pergamon: Aachen, Germany, 1979; Volume 3, pp. 1503–1530. ISBN 978-1-4832-8412-5. [Google Scholar]
  16. Meier, M.; Blum, W. Modelling high temperature creep of academic and industrial materials using the composite model. Mater. Sci. Eng. A 1993, 164, 290–294. [Google Scholar] [CrossRef]
  17. Spigarelli, S. Constitutive equations in creep of Mg-Al alloys. Mater. Sci. Eng. A 2008, 492, 153–160. [Google Scholar] [CrossRef]
  18. Orowan, E. Dislocations in Metals; Cohen, M., Ed.; The Institute of Metals Division, the American Institute of Mining and Metallurgical Engineers: New York, NY, USA, 1954. [Google Scholar]
  19. Spigarelli, S.; Sandström, R. Basic creep modelling of Aluminium. Mater. Sci. Eng. A 2018, 711, 343–349. [Google Scholar] [CrossRef]
  20. Paoletti, C.; Regev, M.; Spigarelli, S. Modelling of creep in alloys strengthened by rod-shaped particles: Al-Cu-Mg age-hardenable alloys. Metals 2018, 8, 930. [Google Scholar] [CrossRef] [Green Version]
  21. Spigarelli, S.; Evangelista, E.; Cucchieri, S. Analysis of the creep response of an Al-17Si-4Cu-0.55Mg alloy. Mater. Sci. Eng. A 2004, 387–389, 702–705. [Google Scholar] [CrossRef]
  22. Uzan, N.E.; Shneck, R.; Yeheskel, O.; Frage, N. High-temperature mechanical properties of AlSi10Mg specimens fabricated by additive manufacturing using selective laser melting technologies (AM-SLM). Addit. Manuf. 2018, 24, 257–263. [Google Scholar] [CrossRef]
  23. Toschi, S. Optimization of a354 Al-Si-Cu-Mg alloy heat treatment: Effect on microstructure, hardness, and tensile properties of peak aged and overaged alloy. Metals 2018, 8, 961. [Google Scholar] [CrossRef] [Green Version]
  24. Salleh, M.S.; Omar, M.Z.; Syarif, J.; Alhawari, K.S.; Mohammed, M.N. Microstructure and mechanical properties of thixoformed A319 aluminium alloy. Mater. Des. 2014, 64, 142. [Google Scholar] [CrossRef]
  25. Buffington, F.S.; Cohen, M. Self-Diffusion in Alpha Iron Under Uniaxial Compressive Stress. JOM 1952, 4, 859–860. [Google Scholar] [CrossRef]
  26. Sandström, R. Basic model for primary and secondary creep in copper. Acta Mater. 2012, 60, 314–322. [Google Scholar] [CrossRef]
  27. Sandström, R. Influence of phosphorus on the tensile stress strain curves in copper. J. Nucl. Mater. 2016, 470, 290–296. [Google Scholar] [CrossRef]
  28. Sandström, R. The role of cell structure during creep of cold worked copper. Mater. Sci. Eng. A 2016, 674, 318–327. [Google Scholar] [CrossRef]
Figure 1. Effect of a 2-h postprocessing heat treatment on yield strength (on the left, the values for the as-deposited alloys) [5,10,11,12,13]. The figure also plots the roughly estimated value of the yield stress calculated by taking into account the effects of the Ostwald ripening of Si particles of different initial size (see Appendix A for details on the calculation of the Si particle size dcalc, and Table 1 for the meanings of symbols). In addition, data on the observed crystallite size, dest, are reported [5].
Metals 11 00179 g001
Figure 2. Experimental values of the minimum creep rate in as-deposited additive manufacturing (AM) AlSi10Mg and material model (MM) curves (see Appendixes A and B for the constitutive equations used in combination with the composite model, Equation (1), with d0 = 50 nm) [14].
Metals 11 00179 g002
Figure 3. Experimental creep curves: (a) example of strain vs. time curve; (b) strain rate vs. strain curves at different experimental conditions.
Metals 11 00179 g003
Figure 4. Minimum creep rate dependence on applied stress for the annealed and as-deposited [14] alloy.
Metals 11 00179 g004
Figure 5. Time to minimum creep rate as a function of minimum creep rate for the annealed alloy.
Metals 11 00179 g005
Figure 6. Δσ as a function of the minimum creep rate for 150 °C and 175 °C.
Metals 11 00179 g006
Figure 7. Model curves calculated for the material heat treated at 225 °C for 2 h. The only experimental datum used to calculate the curves is the relationship shown in Figure 4.
Metals 11 00179 g007
Figure 8. (a) Model curves calculated for the as-deposited and the heat-treated (225 °C for 2 h) alloy; (b) minimum creep rate obtained at 225 °C for the as-deposited alloy [14] and for the alloy annealed for 2 h at 225 °C (this study) and at 300 °C [22]; (b) also includes the model curves calculated by combining the MM and the equations reported in Appendixes A and B.
Metals 11 00179 g008
Table 1. List of constitutive model parameters.
SymbolMeaning
σTrue applied stress (MPa)
ε ˙ m Minimum creep rate (s−1)
σ0Particle strengthening term (Orowan stress) (MPa)
αConstant: 0.3
mTaylor factor: 3.06
RGas constant: 8.314 (J mol−1K−1)
GShear modulus: 30,220–16 T (MPa)
bBurgers vector: 2.47 × 10⁻¹⁰ (m)
ρDislocation density (m−2)
σρDislocation hardening term: =αmGbρ1/2 (MPa)
τlDislocation line tension: =0.5Gb2 (N)
RmaxMaximum strength at the testing temperature [MPa)
kBoltzmann constant = 1.38 × 10⁻²³ (J K−1)
D0LPre-exponential factor in the Arrhenius equation describing the temperature dependence of the vacancy diffusion coefficient: 8.3 × 10⁻⁶ (m2s−1) [19]
QLActivation energy in the Arrhenius equation describing the temperature dependence of the vacancy diffusion coefficient: 122 (kJ mol−1) [19]
UssEnergy necessary for Si (and Mg) atoms still in solid solution to jump in and out of the atmospheres that spontaneously form around dislocations; previous calculations gave values close to 10–15 kJ mol−1 for Mg [20]. For the sake of simplicity, here Uss is assumed to be 10 (kJ mol−1)
RUTSaRoom temperature tensile strength of an alloy with the same impurity level, similar content of elements in solid solution and coarse intergranular intermetallics, in the absence of fine Si particles, here roughly estimated to be 115 (MPa)
LSurface-to-surface interparticle spacing (m)
GT, GRTShear modulus at the testing temperature and at 25 °C, respectively (MPa)
McgTemperature dependent dislocation mobility
d0Initial dimension of Si particles
destExperimental estimate of the size of Si particles at time t
dcalcCalculated value of the size of Si particles at time t
σyiYield stress
σaYield stress of an alloy containing 0.5% Mg but no Si particles
σOriOrowan stress in the i-region (i = H,S)
Publisher’s Note: MDPI stays neutral with regard to jurisdictional claims in published maps and institutional affiliations.

