Prediction of Microstructure Constituents’ Hardness after the Isothermal Decomposition of Austenite


1
Faculty of Engineering, University of Rijeka, Vukovarska 58, 51000 Rijeka, Croatia
2
University Center Koprivnica, University North, Trg dr. Žarka Dolinara 1, 48000 Koprivnica, Croatia
*
Author to whom correspondence should be addressed.
Metals 2021, 11(2), 180; https://doi.org/10.3390/met11020180
Submission received: 9 December 2020
/
Revised: 17 January 2021
/
Accepted: 18 January 2021
/
Published: 20 January 2021
(This article belongs to the Special Issue Heat Treatment and Mechanical Properties of Metals and Alloys)
Abstract
:An increase in technical requirements related to the prediction of mechanical properties of steel engineering components requires a deep understanding of relations which exist between microstructure, chemical composition and mechanical properties. This paper is dedicated to the research of the relation between steel hardness with the microstructure, chemical composition and temperature of isothermal decomposition of austenite. When setting the equations for predicting the hardness of microstructure constituents, it was assumed that: (1) The pearlite hardness depends on the carbon content in a steel and on the undercooling below the critical temperature, (2) the martensite hardness depends primarily on its carbon content, (3) the hardness of bainite can be between that of untempered martensite and pearlite in the same steel. The equations for estimation of microstructure constituents’ hardness after the isothermal decomposition of austenite have been proposed. By the comparison of predicted hardness using a mathematical model with experimental results, it can be concluded that hardness of considered low-alloy steels could be successfully predicted by the proposed model.
1. Introduction
The process of steel quenching is one of the physically most complicated engineering processes which involves many physical processes, such as microstructure transformations, heat exchange, heat transfer and heat conduction, generation of distortion and residual stresses and crack formation [1,2,3,4,5,6,7,8,9,10].
Increasing technical requirements relating to the quality of mechanical properties of the engineering components require a deep understanding of relations which exist between microstructure, chemical composition and mechanical properties.
On the quenching processes, mechanical properties of steel are responsible for its mechanical behaviour during quenching, such as resistance to fracture and distortions. Therefore, predicting the relevant mechanical properties is the first step in predicting the mechanical behaviour of a steel during quenching [2,11,12].
Mechanical properties of steel mostly depend on both microstructure constituents and temperature. Quenching of steel causes the microstructure transformations and thus a change in the phase compositions. Consequently, during cooling from the austenitizing temperature, the values of mechanical properties are constantly changing as well. Additionally, in the relationship between the microstructure and mechanical properties of a steel, other factors that can affect the mechanical properties should be considered. These factors are alloying elements, grain size refinement, internal stresses, microstructure heterogeneity and crystal imperfections [13,14,15,16].
During a slow cooling of steel from the austenitic range, austenite decomposes into secondary phases, which can be reduced to two basic ones: the α-phase (ferrite) and iron carbide (cementite). During the quenching, austenite usually transforms into α’-phase (martensite). Regardless of whether cementite is in the composition of pearlite or bainite, its chemical composition does not change, but the shape and size of cementite particles, on which its mechanical properties depend, change. Unlike cementite, depending on the temperature of the formation of pearlite or bainite, α-phase (ferrite, bainitic ferrite) changes the carbon content and the shape and size of plates. Properties of the martensite depend primarily on its carbon content, which is usually equal to the carbon content of a steel.
The main driving force of phase transformations is the change of thermodynamic instability caused by temperature change. With undercooling of steel below the critical temperature, the thermodynamic stability of a primary microstructure is disrupted, resulting in austenite decomposition. The transformation rate depends on the temperature and the cooling rate.
Unlike other products of austenite decomposition, the martensite is formed instantaneously with a rate of 5000 ms−1, at temperatures lower than the martensite start temperature, Ms. The martensite transformation completely ends when the temperature during cooling reaches martensite finish temperature, Mf. The way in which martensitic transformation occurs is a complex process. There are classic and modern explanations of the martensitic transformation mechanism. Contemporary explanations of nucleation and growth of martensite are based on mechanisms which deal with dislocations [17,18,19,20].
The diffusionless mechanism of martensite transformation consists of the shearing process. Atoms in the austenite lattice move along characteristic directions to occupy positions which corresponding to the further martensite lattice. In steel, the austenite with face-centred cubic (FCC) lattice transforms into highly strained body-centred tetragonal (BCT) martensite which is supersaturated with carbon. Distances of collective movement of atoms are typically smaller than one nearest-neighbour spacing. The resulting shear strain produces a large number of dislocations. The lens-shaped grains of martensites are coherent with the surrounding austenite. Martensites are characteristically found in lath and plate appearances. Transformation of austenite into martensite is often accompanied by an evident increase in strength and hardness and decrease in ductility of steel.
Since martensitic transformations are diffusionless, the local composition does not change during the transformation. It is only the crystal structure that changes. The carbon concentration in martensite is equal to the carbon concentration in primary austenite.
Bainite forms by the decomposition of austenite at a temperature which is above Ms but below that at which fine pearlite forms. Bainite start temperature, Bs, is an upper limit above which there is no reaction [21]. Bainite is a fine dispersed mixture of ferrite and cementite. Diffusion of interstitial carbon atoms has mostly the relevant influence on the rate of austenite decomposition to bainite.
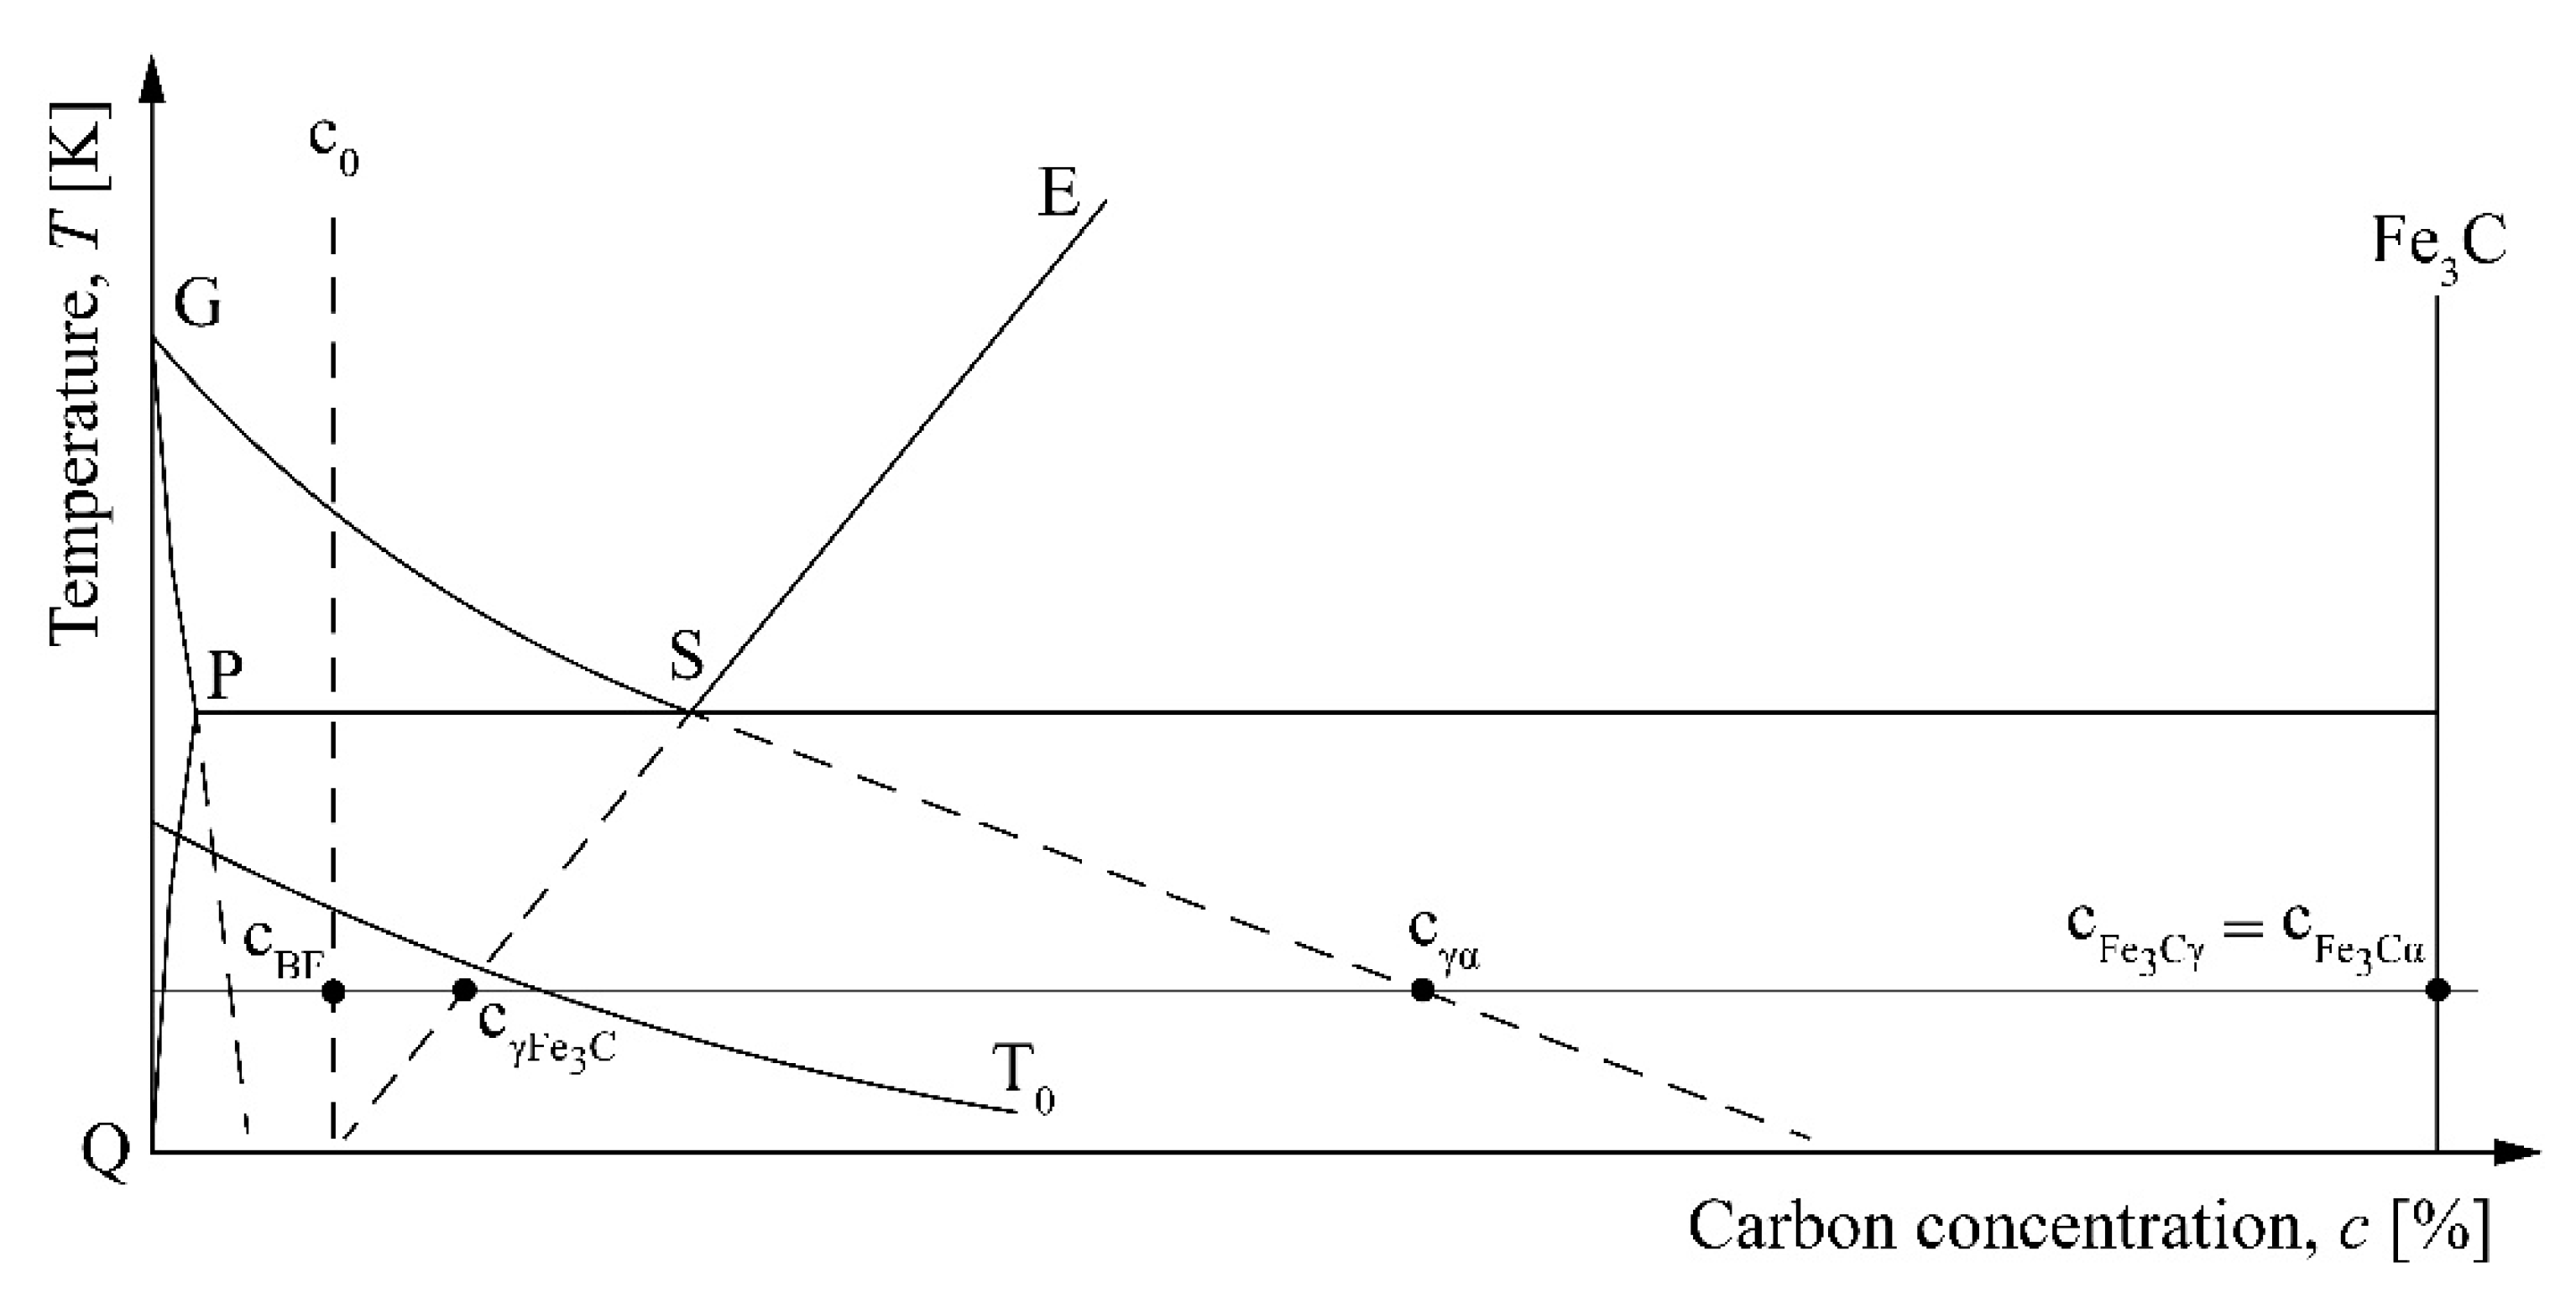
Figure 1 shows characteristic phase concentrations during the bainite transformation of hypoeutectoid steel. Transformation of austenite to bainite can only occur in regions of austenite where cγ ≤ cT0, where cγ = c0 is the carbon concentration in austenite and cT0 is the carbon concentration corresponding to the T0 curve. T0 is frequently used in martensite theory for the temperature at which austenite and martensite have the same free energy. Bainite formation in steels begins by displacive transformation of supersaturated bainitic ferrite with carbon content of cBF = c0. Bainitic ferrite plates form by a shear mechanism in the similar way as the growth of martensite plates. As a subunit of bainitic ferrite forms, it partitions its excess carbon into the retained austenite or precipitates within bainitic ferrite in the form of carbides. Concentration of carbon in bainitic ferrite can slightly decrease. The cementite plate grows by diffusion of carbon from both the ferrite and the adjacent enriched austenitic areas [21].
In Figure 1, the concentration of ferrite is read along the extrapolated G–P line, the concentration of supersaturated ferrite is read along the T0 curve, while the concentration of austenite at the boundary with cementite, cγFe3C, and ferrite, cγα, is read along the extrapolated E–S and G–S lines, respectively. cFe3Cγ and cFe3Cα are the concentrations of cementite at the boundary with austenite and ferrite, respectively.
By decreasing of the temperature, the incubation time of the bainite transformation becomes shorter due to higher thermodynamic instability. On the other hand, at lower temperature the carbon diffusion decreases, and consequentially the incubation time for bainite transformation is increased.
An important characteristic of bainite transformation is that it usually does not go to its end. The bainite transformation begins at a temperature Bs which is lower than the temperature of metastable equilibrium of austenite and ferrite, T0. Since austenite is enriched with carbon during the bainite transformation, the value of the T0 temperature drops down. When the concentration of austenite reaches the value for which Bs is equal to T0, the bainite transformation will be stopped and austenite decomposition leads to pearlite transformation. Therefore, it can be concluded that the amount of bainite transformation depends mainly on temperature. At the higher transformation temperature, less bainite will be produced and more austenite remains, which after a longer time of holding at constant temperature could be decomposed into pearlite.
Hardness could be considered as one of fundamental mechanical properties. It can also be referred to as the resistance of a material to local plastic deformation. Other relevant mechanical properties in the quenching process are modulus of elasticity, yield strength, strength coefficient and strain-hardening exponent, transformation plasticity coefficient and elastic energy release rate. These properties are also the basic indicators of resistance to deformation and brittle fracture that can occur during quenching [22,23,24,25,26].
Ferrite has the lowest hardness of all microstructure constituents. Hardness of pearlite depends on the proportions in quantity of ferrite and cementite and on the shape and size of cementite particles. Due to the separation of cementite and reduction of carbon concentration in the ferrite during bainite transformation, the hardness of bainite microstructure is less dependent on the carbon content than the hardness of martensite.
Cementite has a significant influence on the mechanical properties of bainite. The hardness of bainite depends on the shape and dispersion of cementite. These characteristics of cementite depend on transformation temperature. The lower bainite has a more homogeneous microstructure than the upper bainite, in which a greater possibility of ferrite or cementite separation exists. The impact toughness of upper bainite deteriorates as its strength increases. Lower bainite has much finer carbides than upper bainite has, and its impact toughness is superior to that of upper bainite at the same strength level [21,27].
Martensites invoke several strengthening mechanisms. The high strength and hardness of martensite implies that there are many strong barriers to dislocation motion in this structure [28].
The important contribution to the strength of martensite comes from the carbon atoms. On rapidly transforming from austenite into martensite in the quench, the solubility of carbon in iron is greatly reduced. The carbon atoms strain the body-centred cubic (BCC) lattice to the BCT lattice and this strain can be relieved by redistribution of carbon atoms by diffusion at room temperature. One result of redistribution of carbon atoms is that a strong binding is set up between dislocations and carbon atoms. Another result of redistribution of carbon atoms is the formation of carbon atom clusters on {100} planes [28].
There are two structures in martensite. The conventional martensite has a plate structure with a unique habit plane and an internal structure of parallel twins each about 0.1 μm thick within the plates. The other type of martensite structure is a block martensite containing a high dislocation density of 10¹¹ to 10¹² dislocations per square centimetre. Thus, part of the high strength of martensite arises from the effective barriers to slip provided by the fine twin structure or the high dislocation density [28]. Martensite with a high carbon content is extremely hard and brittle, which is why steels with the martensitic microstructure are necessarily tempered after quenching.
If the microstructure of steel consists of several microstructure constituents and if their hardness and volume fractions are known, a large number of studies have shown that the total hardness of steel at a given temperature can be determined based on the rule of mixture [29]. Unlike hardness, when predicting other mechanical properties of a steel, interactive action of individual microstructure constituents must be considered. In these cases, the rule of mixture is not applicable.
With the purpose of a more accurate estimation of hardness of isothermal hardened carbon and low alloyed steels, this paper is dedicated to the research of the relation between steel hardness and the microstructure, chemical composition and temperature. Furthermore, the equations for estimation of microstructure constituents’ hardness after the isothermal decomposition of austenite have been proposed.
Nowadays many attempts are focused on the development of new high alloyed steels and special heat treatment processes to produce steels with a good combination of mechanical properties and microstructure, which is a mixture of ferrite and high carbon enriched austenite. For example, high alloyed austempered steels are attractive grades for their particular combination of mechanical properties and ausfererritic microstructure [30]. It is necessary in further works to expand the study of mathematical modelling of mechanical properties on this type of steels.
2. Materials and Methods
2.1. Methods for Estimation of Hardness of Microstructure Constituents
When setting the equation for predicting the hardness of pearlite, it was assumed that the hardness of pearlite depends on the hardness of ferrite and on the secondary phase (cementite) contribution to hardness.
The hardness of pearlite increases in proportion to the second root of the dimension of pearlite lamellae. Assuming that the pearlite lamella decreases in proportion to the undercooling below the equilibrium temperature Ae1 [20], it can be assumed that the change in hardness due to the refining of the pearlite lamella is proportional to the second root of the undercooling for austenite to pearlite transformation. Additionally, with undercooling there is a change in the carbon concentration in pearlite.
Based on the above text, it can be written that the hardness of pearlite is a function of the carbon content in a steel and undercooling:
where c0 is the mass fraction of carbon in the steel, and a0P, a1P and a2P are constants. The value a0P presents hypothetical minimum pearlite hardness without contribution of hardness due to undercooling and carbon content in a steel.
With the application of the rule of mixture, the total hardness of the ferrite-pearlite microstructure can be written as follows:
where XF and HVF are the volume fraction and the hardness of ferrite, respectively. Dependency of ferrite hardness on the temperature of ferrite formation was neglected. The hardness of ferrite can be expressed as:
where aF is constant. The hardness of the ferrite-pearlite microstructure can be written as:
The hardness value of the martensitic microstructure is the maximum possible for steels of a certain chemical composition. To determine the hardness of martensite, the most used terms in the literature are those in which the hardness of martensite depends only on the carbon content in a steel [22]. Therefore, when setting the equation for predicting the hardness of martensite, it is assumed that the hardness of martensite arises with carbon content in martensite. It can be written that hardness of martensite is equal to:
where a0M and a1M are constants.
The strength of bainite can in principle be factorized into components consisting of the intrinsic strength of pure annealed iron, substitutional solid solution strengthening contributions, strengthening due to carbon in solid solution and a variety of microstructural components including dislocation strengthening, particle effects and grain size effects [21]. Bainite and pearlite which occur in a similar temperature range of austenite decomposition have similar hardnesses. At the temperature BS the hardness of bainite is approximately equal to:
The same situation is with the hardness of bainite and martensite at temperature range near to austenite decomposition to martensite.
If the linear dependence of the bainite hardness at the temperature of isothermal decomposition of austenite is accepted, the total hardness of bainite can be expressed as:
where a0B, a1B and a2B are constants. Pearlite hardness is defined by Equation (1), while martensite hardness in HRC units is defined by Equation (5). Martensite hardness in HV units is obtained by hardness conversion. The expression describes the influence of intensity of undercooling on the hardness of bainitic ferrite.
The coefficients from Equations (1), (3), (5) and (8) can be determined by regression analysis.
The total hardness of the microstructure during isothermal austenite decomposition can be determined based on the rule of mixture:
where ΔXi is the volume fraction of the i-th microstructure constituent, while HVi is the hardness of the i-th microstructure constituent.
2.2. Materials
Table A1 lists the experimental data used in setting of the equation for predicting the hardness of pearlite and the total hardness of the ferrite-pearlite microstructure of hypoeutectoid, low-alloy steels. Table A2 lists the chemical composition (wt.%) of studied steels [31]. Table A3 lists the experimental data used in setting of the equation for predicting the hardness of martensite microstructure, while Table A4 lists the experimental data used in setting of the equation for predicting the hardness of bainite microstructure of hypoeutectoid, low-alloy steels.
3. Results and Discussion
The characteristic coefficients aF (Equation (3)), a0P, a1P, a2P (Equation (1)), a0M, a1M (Equation (5)), a0B, a1B and a2B (Equation (8)) are determined by regression analysis (Table 1). The regression analysis was done based on data given in Table A1, Table A2, Table A3 and Table A4. Data for regression analysis (i.e., the characteristic hardnesses and fraction of microstructural constituents) were found out from the experimentally obtained time temperature transformation (TTT) diagrams given in the literature [31].
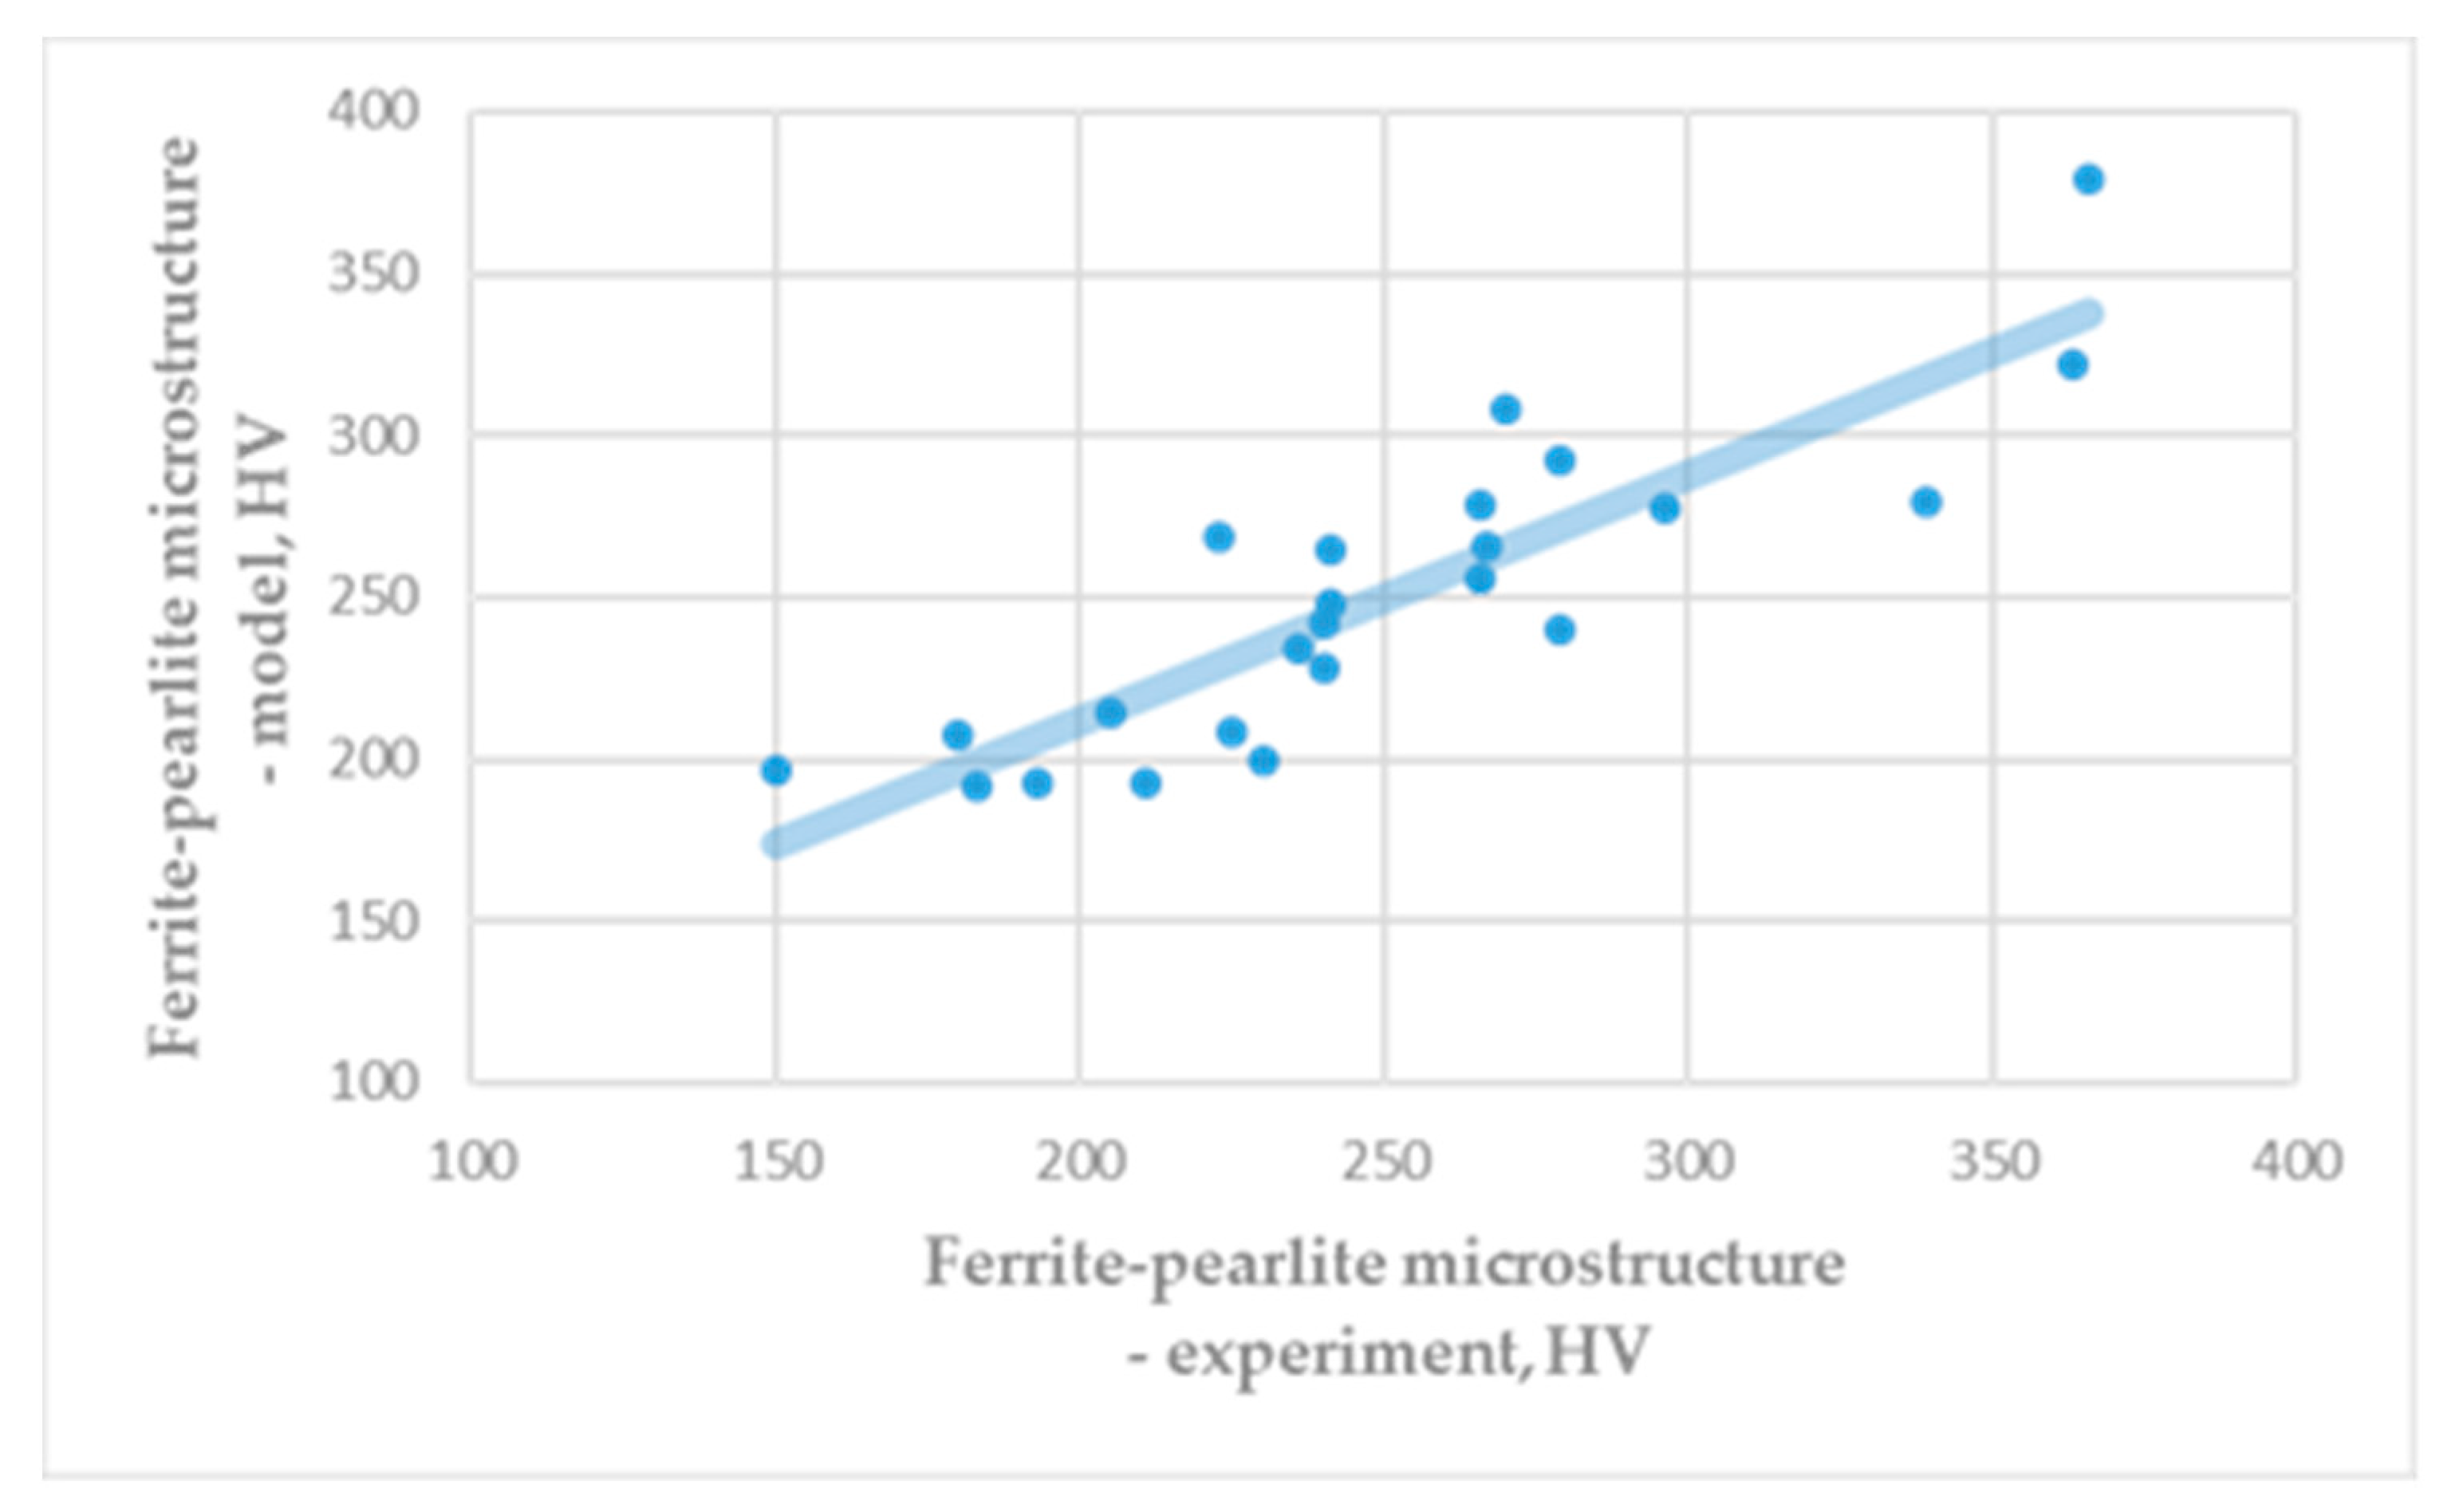
Obtained hardness of ferrite, HVF = 83.50, is similar to the common theoretical and experimental literature data. Figure 2 shows a comparison of the experimental hardness of the ferrite-pearlite microstructure (Table A1) and the hardness obtained based on the rule of mixture (Equation (4)). It is visible that results of numerical modelling give similar results as are experimental results.
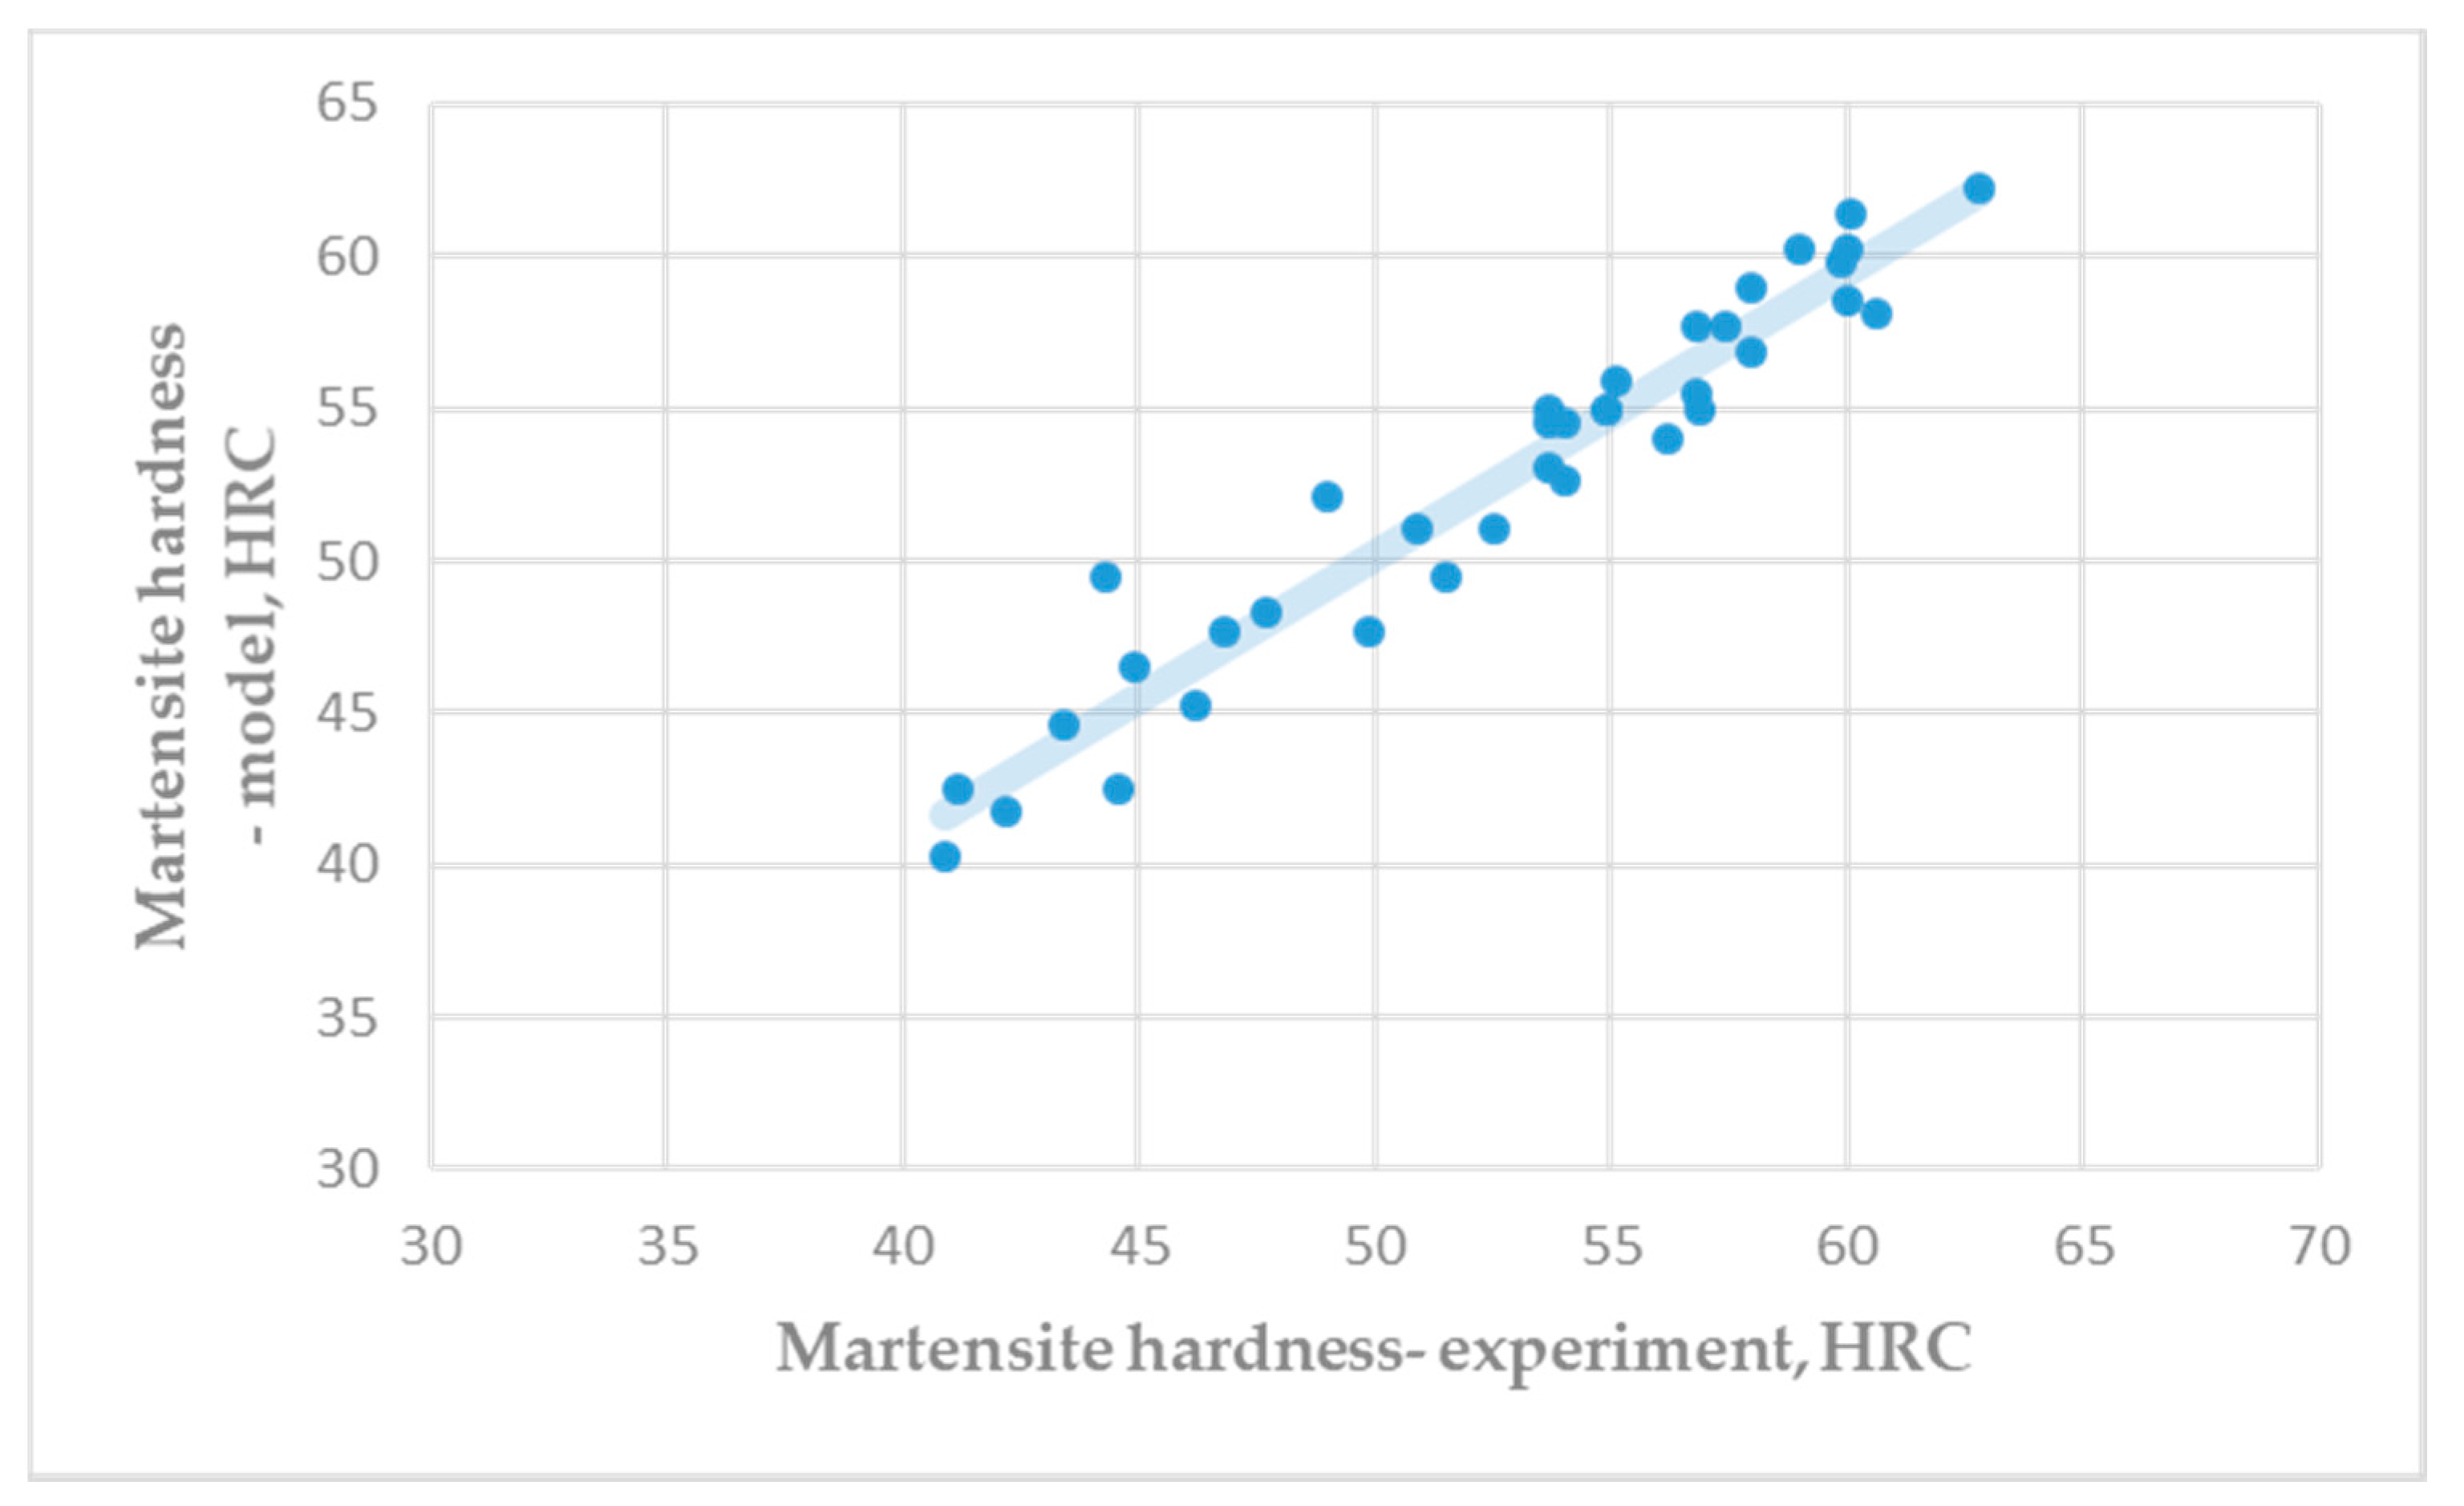
Figure 3 shows a comparison of the experimental hardness of the martensite microstructure (Table A3) and the predicted hardness by Equation (5). Very good correlation between experimental results and predicted results of martensite hardness was achieved.
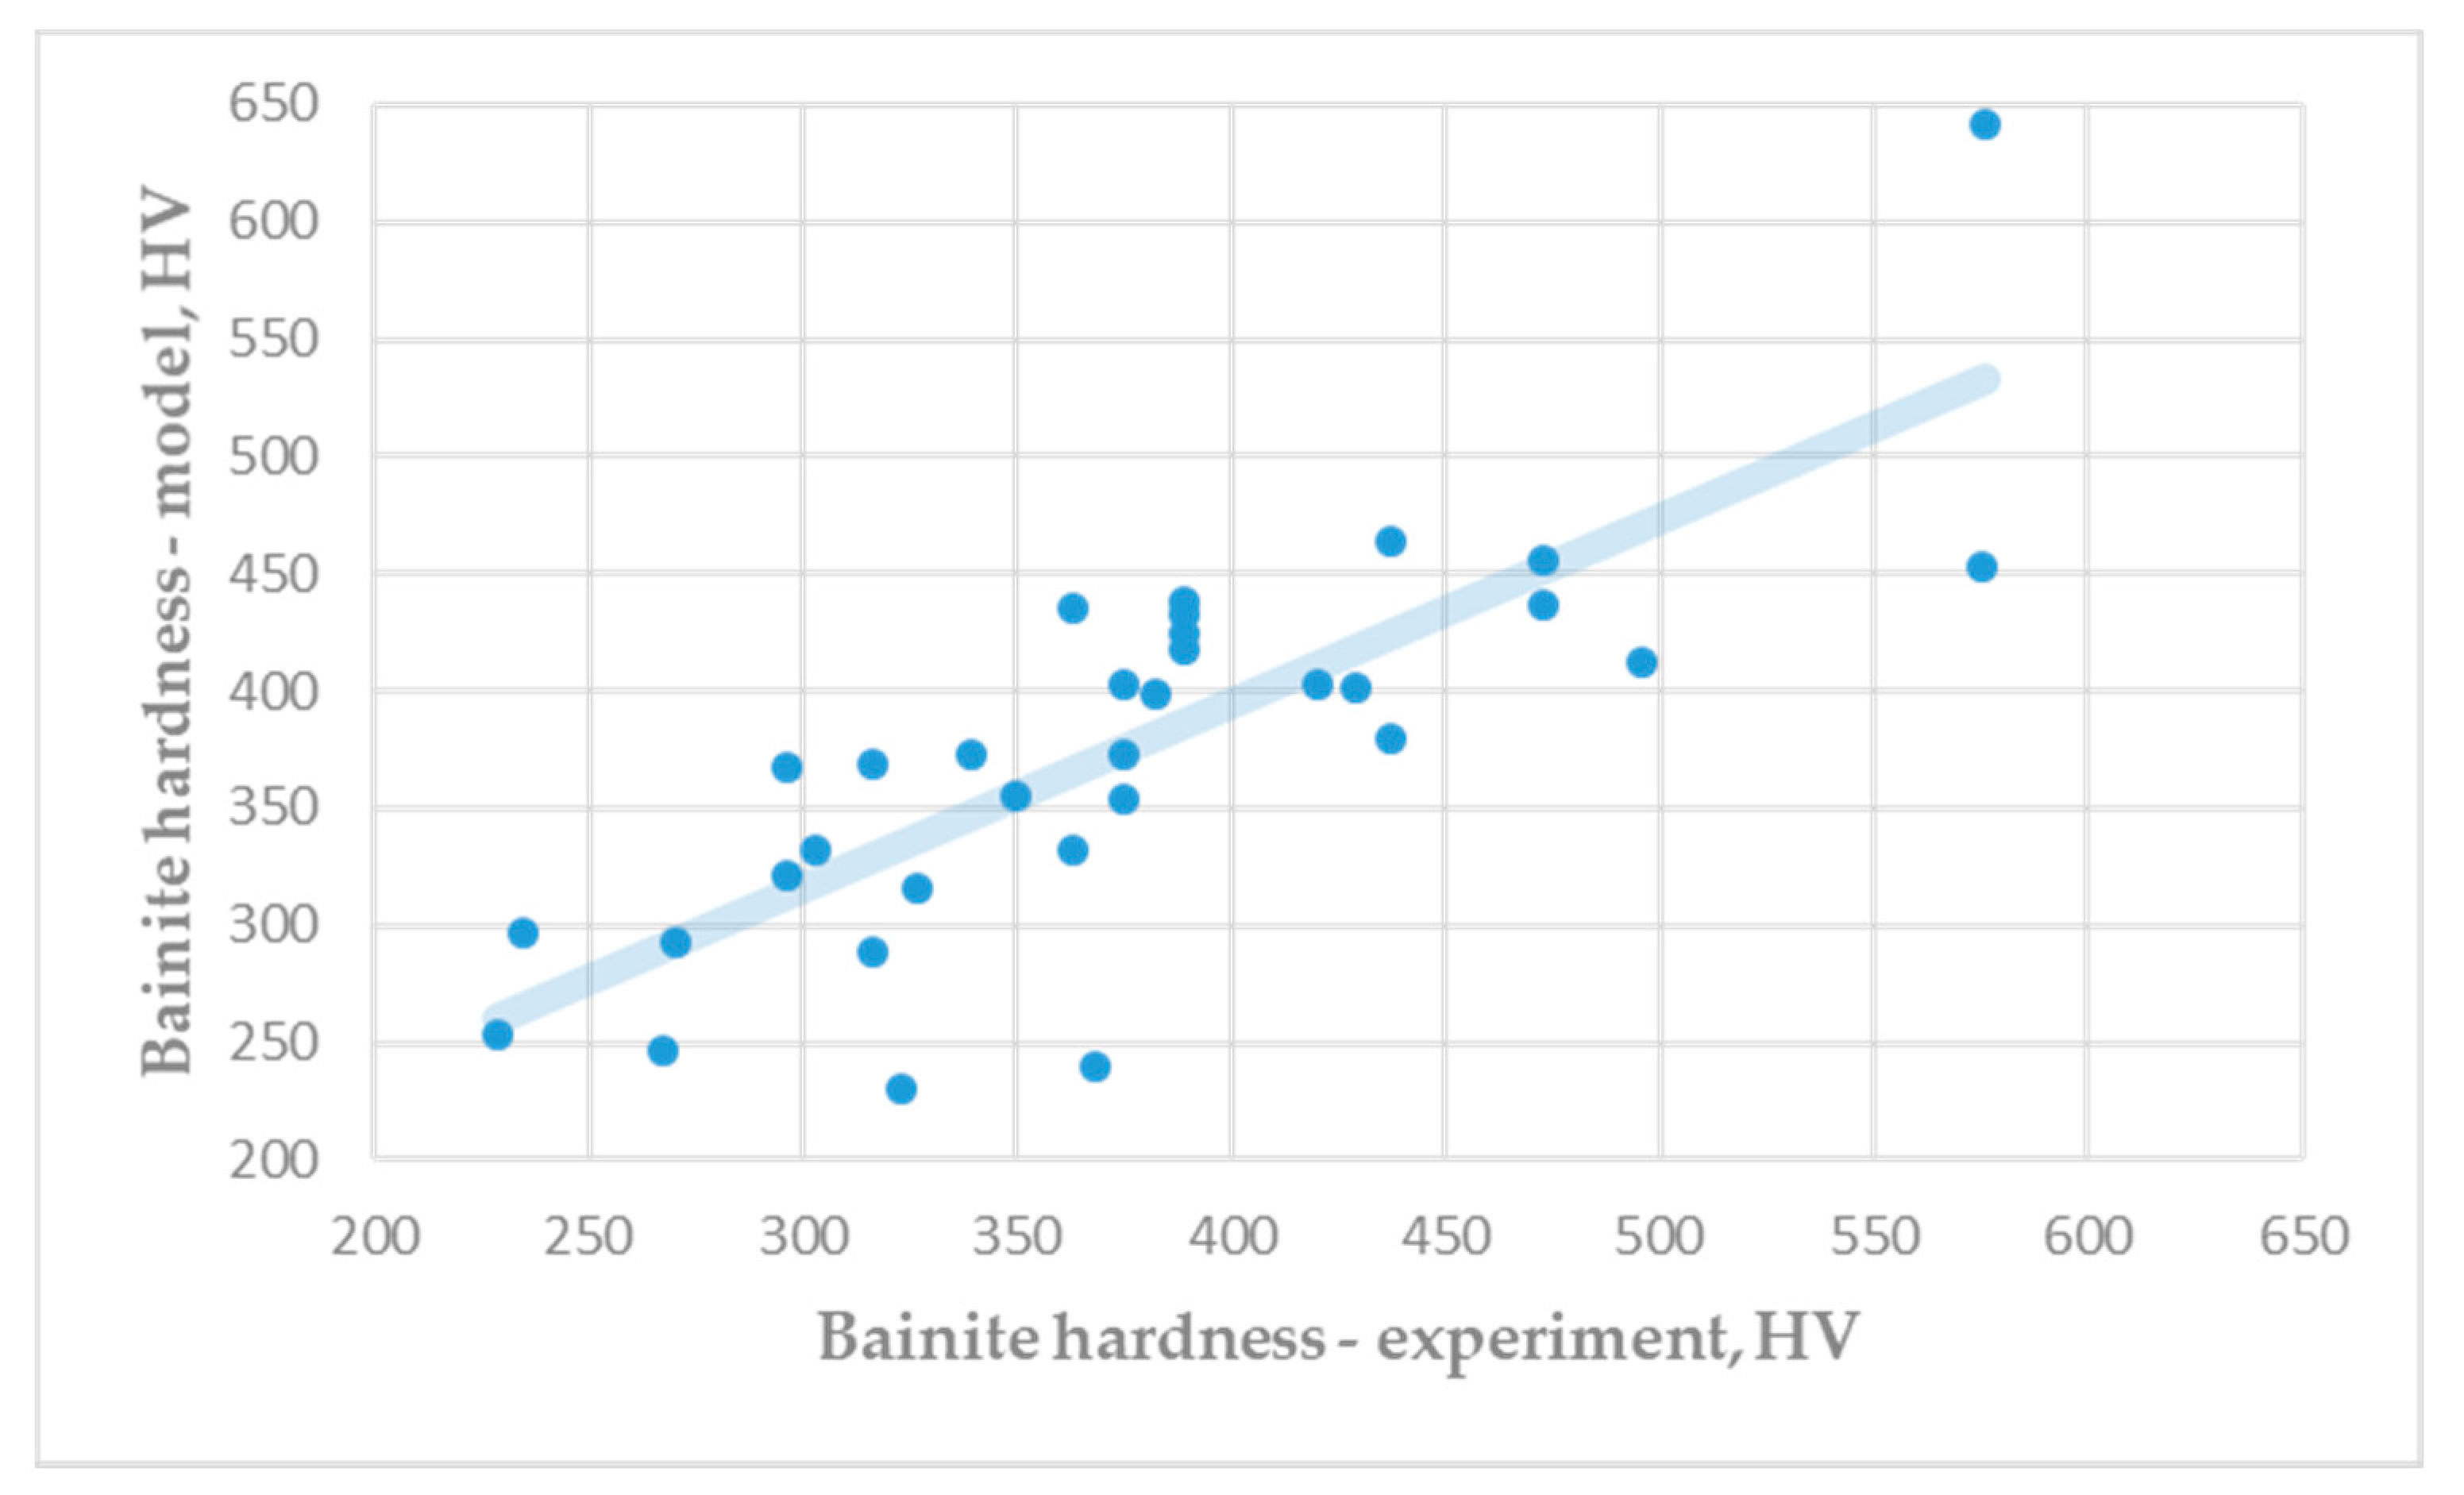
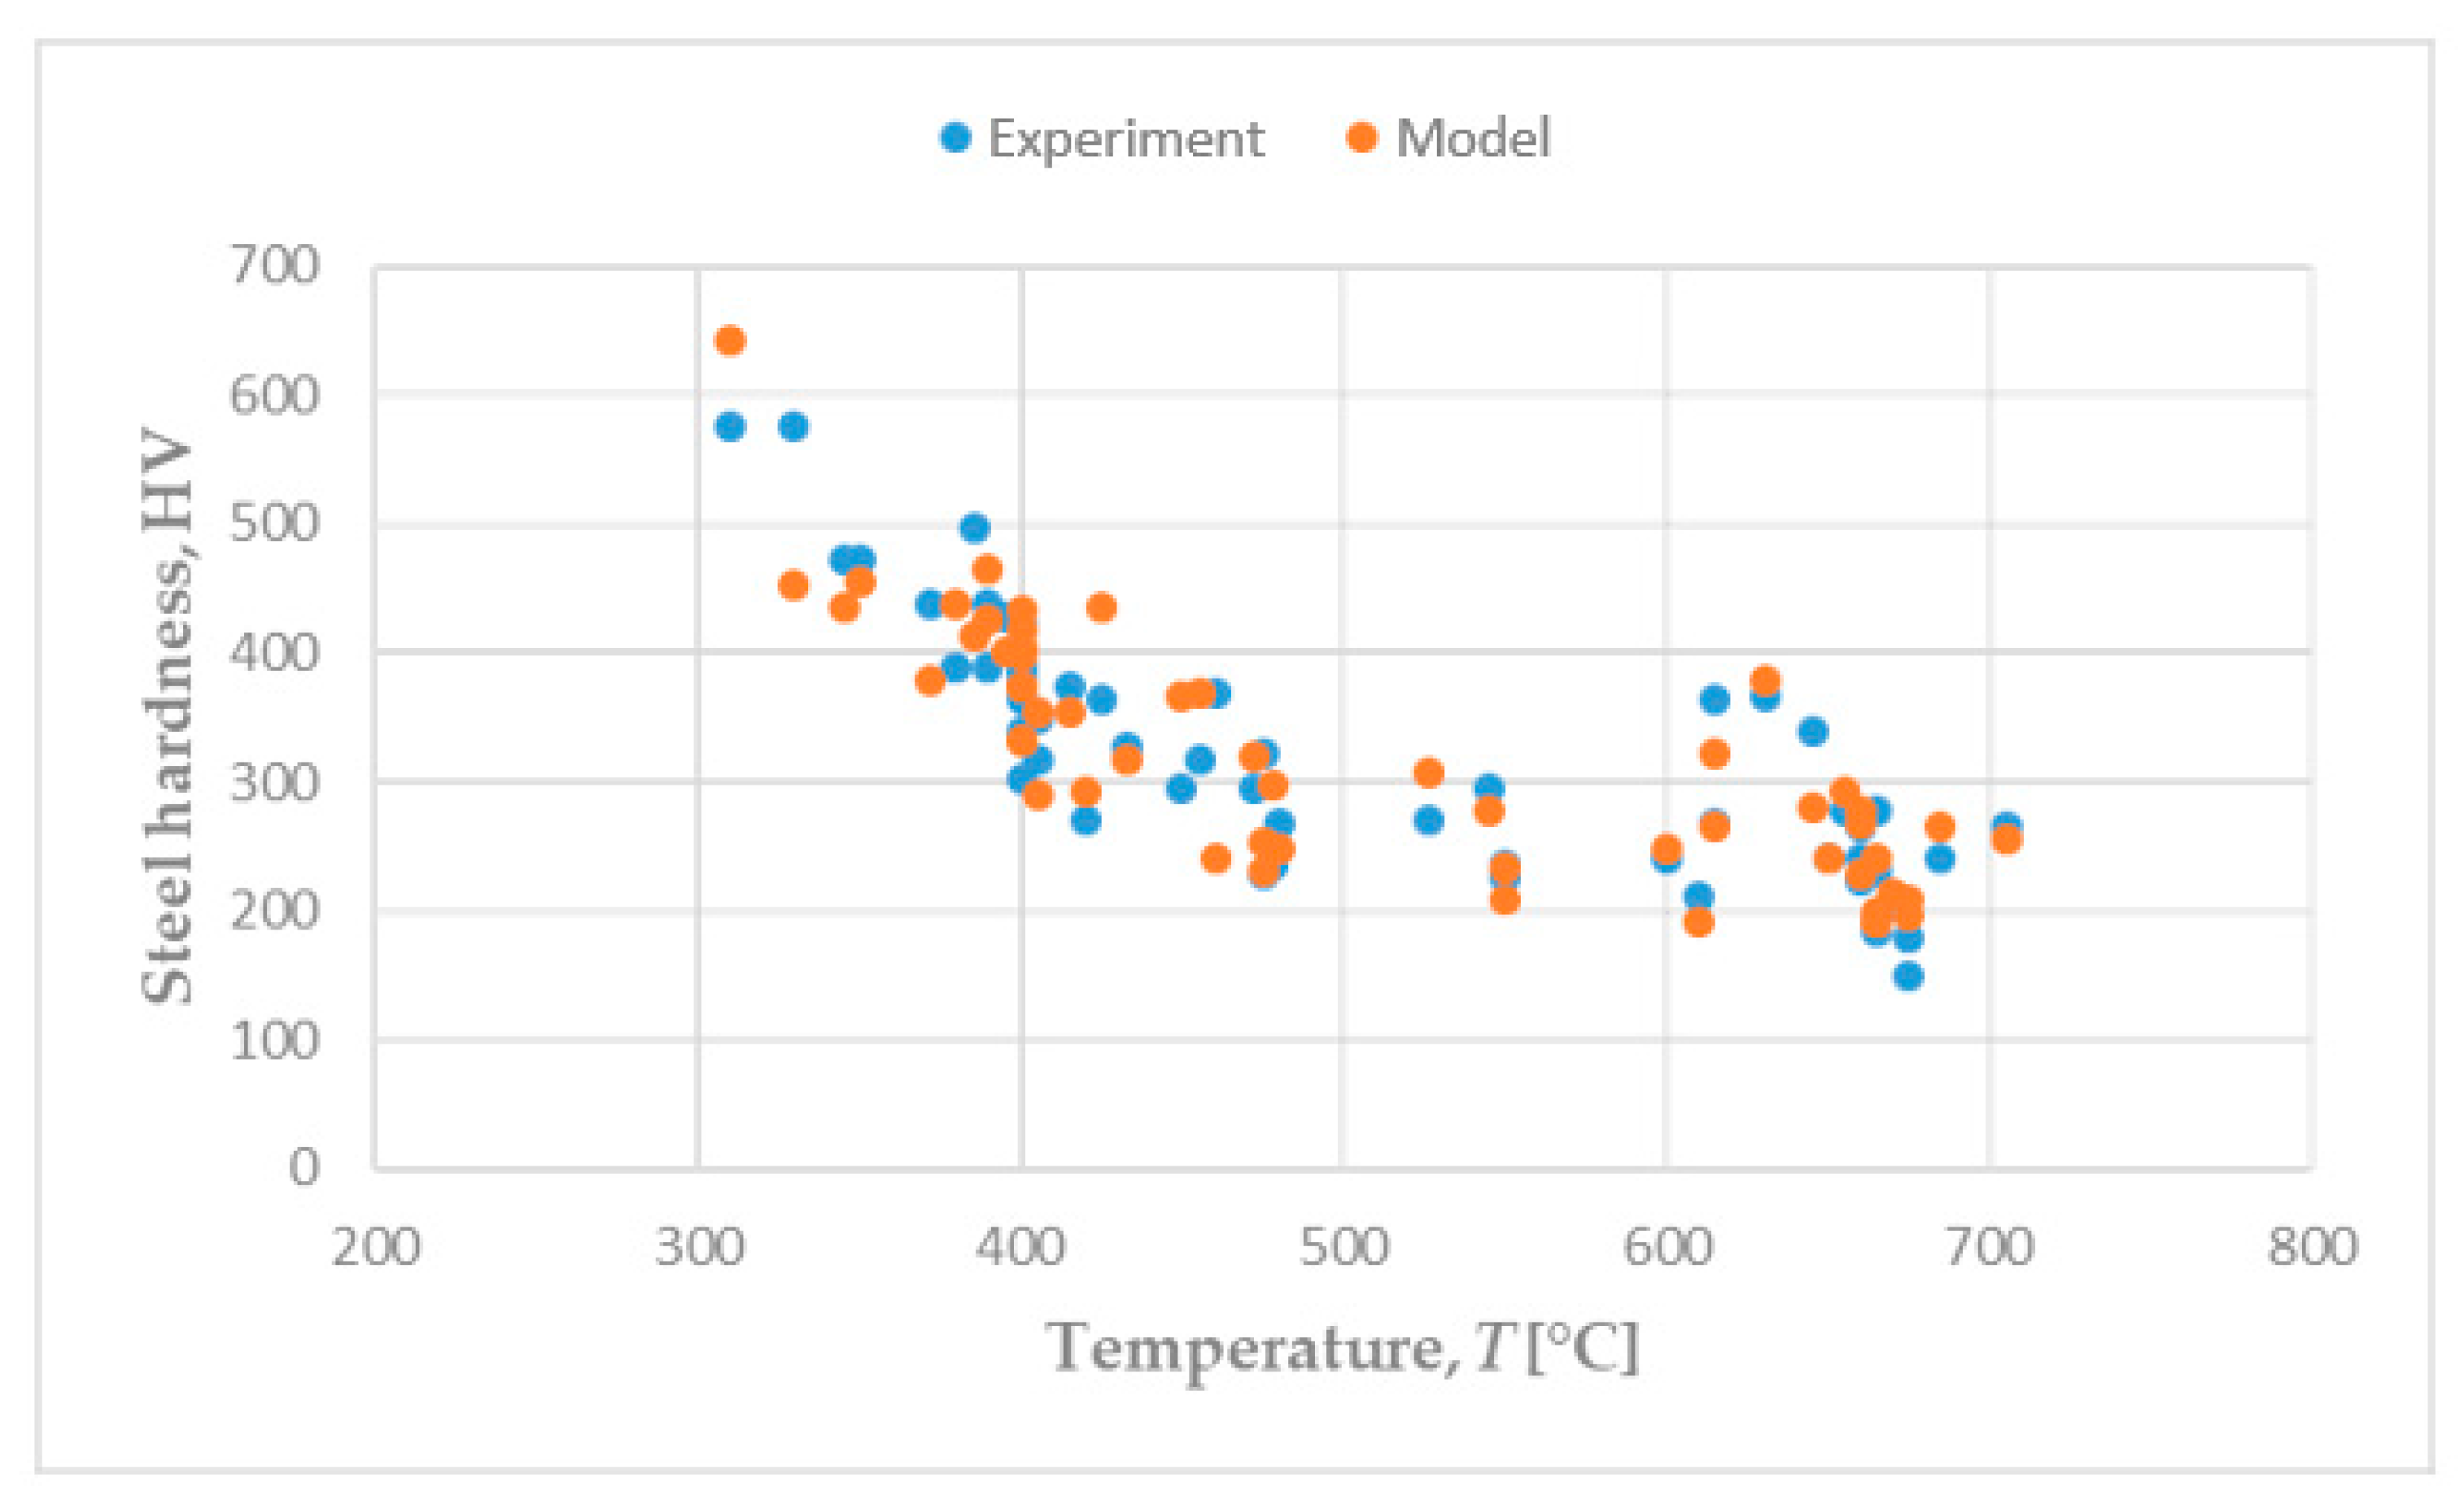
Figure 4 shows a comparison of the experimental hardness of the bainite microstructure (Table A4) and the predicted hardness (Equation (8)). Differences between experimental results and predicted results of bainite hardness are insignificant. Very good correlation between hardness predicted by mathematical modelling and experimental results were achieved for all studied microconstituents.
Figure 5 shows a comparison of the experimental and predicted hardness of hypoeutectoid steels at different temperature of isothermal transformation (Table A1 and Table A3), which were used in setting the equations for estimating the hardness of pearlite and bainite. A good matching of predicted and experimental hardness values can be observed.
Based on theoretical research, useful expressions for predicting the hardness of carbon and low-alloy steels after isothermal decomposition of austenite have been derived. An excellent correlation was achieved between the calculated hardness values by mathematical modelling and experimental results. Good correlation was achieved in the modelling of the hardness of microconstituents (i.e., pearlite, ferrite, bainite and martensite) as well as in the modelling of the total hardness of steel. Developed models can be a very good basis for predicting hardness in continuous steel cooling using Scheil’s additivity rule. Studied methods for prediction of the hardness of ferrite-pearlite, bainite and martensite microstructures is an inversion method. This method is based on mathematical modelling of steel behaviour during heat treatment. Many similar works exist which are based on precise physical mechanism strengthening of individual phases [21]. The modelling of hardenability of steel by application of neural network recently are very useful. Application of the developed numerical approach is not expensive and stable. It is very easy to extend this approach to other types of steel and heat treatment processes.
4. Conclusions
In this paper, the equations for estimation of microstructure constituents’ hardness after the isothermal decomposition of austenite have been proposed for hypoeutectoid carbon and low-alloy steels. Steels were quenched from austenite range to the temperature of isothermal transformation where all austenite decomposes at constant temperature. Special attention has been given to the modelling of bainite transformation.
To develop equations for prediction of microstructure constituents’ hardness after the isothermal decomposition of austenite, the following well-known general facts were accepted.
- The hardness of pearlite microstructure mostly depends on carbon content and interlamellar spacing of the pearlite. Hardness of ferrite and pearlite microstructure is function of volume fraction of pearlite and ferrite. Therefore, pearlite hardness depends on the carbon content in a steel and temperature of undercooling below Ae1 temperature.
- The martensite hardness in hypoeutectoid steel commonly directly depends on the carbon content in a steel.
- Hardness of bainite depends on combination of the solid solution strengthening due to carbon, the effect of the dislocation cell structure, precipitation hardening by cementite, strengthening due to grain size refinement and strengthening due to particle spacing refinement. Hardening mechanism due to carbon, dislocation cell structure and precipitation hardening prevails at lower temperatures of austenite decompositions.
- The total hardness of steel can be estimated using the rule of mixture based on both fraction and hardness of microstructural components of steel.
The developed model was verified by comparison of predicted hardnesses of microstructural constituents by mathematical modelling with that obtained from TTT diagrams. Predicted hardnesses of ferrite, pearlite, bainite and martensite by mathematical modelling correlate very well to results given by TTT diagrams. The differences between achieved results by mathematical modelling and experimental results were insignificant.
By the comparison of predicted hardness by a mathematical model with experimental results, it can be concluded that hardness of considered steels could be successfully predicted by the proposed model.
Author Contributions
Conceptualization, S.S.H. and B.S.; methodology, S.S.H. and B.S.; validation, S.S.H., B.S., L.Š. and K.H.; investigation, S.S.H., B.S., L.Š. and K.H.; writing—original draft preparation, S.S.H. and B.S. All authors have read and agreed to the published version of the manuscript.
Funding
This research was funded in part by the University of Rijeka under the project number uniri-tehnic-18-116.
Data Availability Statement
Data is available in the article.
Acknowledgments
This research has been supported in part by the University of Rijeka under the project number uniri-tehnic-18-116.
Conflicts of Interest
The authors declare no conflict of interest.
Appendix A

Table A1.
The experimental data for prediction of ferrite-pearlite microstructure hardness, HVF+P.
| Data No. | Ferrite-Pearlite Microstructure Hardness | Ferrite Content | Pearlite Content | Carbon Concentration in Steel | Temperature of Isothermal Transformation |
|---|---|---|---|---|---|
| HV | % | % | % | °C | |
| 1. | 266 | 0 | 100 | 0.43 | 705 |
| 2. | 241 | 1 | 99 | 0.44 | 685 |
| 3. | 150 | 60 | 40 | 0.22 | 675 |
| 4. | 180 | 60 | 40 | 0.30 | 675 |
| 5. | 205 | 30 | 70 | 0.30 | 670 |
| 6. | 193 | 80 | 20 | 0.13 | 665 |
| 7. | 183 | 70 | 30 | 0.16 | 665 |
| 8. | 230 | 70 | 30 | 0.24 | 665 |
| 9. | 279 | 5 | 95 | 0.36 | 665 |
| 10. | 240 | 30 | 70 | 0.35 | 660 |
| 11. | 223 | 5 | 95 | 0.44 | 660 |
| 12. | 266 | 5 | 95 | 0.47 | 660 |
| 13. | 279 | 2 | 98 | 0.50 | 655 |
| 14. | 240 | 20 | 80 | 0.38 | 650 |
| 15. | 339 | 7 | 93 | 0.47 | 645 |
| 16. | 366 | 3 | 97 | 0.73 | 630 |
| 17. | 267 | 15 | 85 | 0.43 | 615 |
| 18. | 363 | 0 | 100 | 0.55 | 615 |
| 19. | 211 | 70 | 30 | 0.16 | 610 |
| 20. | 241 | 20 | 80 | 0.38 | 600 |
| 21. | 225 | 75 | 25 | 0.30 | 550 |
| 22. | 236 | 60 | 40 | 0.43 | 550 |
| 23. | 296 | 15 | 85 | 0.44 | 545 |
| 24. | 270 | 2 | 98 | 0.48 | 526 |
Table A2.
Chemical composition of studied steels (balance Fe).
| Data No. | Designation (DIN) | Chemical Composition, wt.% | ||||||||||
|---|---|---|---|---|---|---|---|---|---|---|---|---|
| C | Si | Mn | P | S | Al | Cr | Cu | Mo | Ni | V | ||
| 1. | Ck45 | 0.44 | 0.22 | 0.66 | 0.022 | 0.029 | - | 0.15 | - | - | - | 0.02 |
| 2. | 37MnSi5 | 0.34 | 1.11 | 1.23 | 0.022 | 0.012 | - | 0.19 | 0.17 | 0.04 | 0.18 | 0.03 |
| 3. | 0.38 | 1.05 | 1.14 | 0.035 | 0.019 | - | 0.23 | - | - | - | 0.02 | |
| 4. | 42MnV7 | 0.38 | 0.28 | 1.76 | 0.035 | 0.015 | - | 0.33 | 0.16 | 0.05 | 0.17 | 0.07 |
| 5. | 0.45 | 0.27 | 1.76 | 0.017 | 0.018 | - | 0.18 | 0.19 | <0.01 | 0.06 | 0.07 | |
| 6. | 34Cr4 | 0.30 | 0.21 | 0.57 | 0.015 | 0.018 | - | 0.90 | 0.25 | <0.01 | 0.06 | 0.01 |
| 7. | 0.37 | 0.35 | 0.68 | 0.027 | 0.020 | - | 1.06 | 0.17 | 0.02 | 0.18 | <0.01 | |
| 8. | 36Cr6 | 0.32 | 0.17 | 0.47 | 0.014 | 0.011 | - | 1.53 | 0.16 | 0.04 | 0.18 | <0.01 |
| 9. | 0.36 | 0.25 | 0.49 | 0.021 | 0.020 | - | 1.54 | 0.16 | 0.03 | 0.21 | <0.01 | |
| 10. | 41Cr4 | 0.44 | 0.22 | 0.80 | 0.030 | 0.023 | - | 1.04 | 0.17 | 0.04 | 0.26 | <0.01 |
| 11. | 25CrMo4 | 0.22 | 0.25 | 0.64 | 0.010 | 0.011 | - | 0.97 | 0.16 | 0.23 | 0.33 | <0.01 |
| 12. | 0.25 | 0.32 | 0.78 | 0.016 | 0.005 | - | 1.06 | 0.16 | 0.25 | 0.24 | <0.01 | |
| 13. | 34CrMo4 | 0.30 | 0.22 | 0.64 | 0.011 | 0.012 | - | 1.01 | 0.19 | 0.24 | 0.11 | <0.01 |
| 14. | 0.37 | 0.25 | 0.65 | 0.017 | 0.023 | - | 1.08 | 0.21 | 0.20 | 0.27 | <0.01 | |
| 15. | 50CrMo4 | 0.46 | 0.22 | 0.50 | 0.015 | 0.014 | - | 1.00 | 0.26 | 0.21 | 0.22 | <0.01 |
| 16. | 0.50 | 0.32 | 0.80 | 0.017 | 0.022 | - | 1.04 | 0.17 | 0.24 | 0.11 | <0.01 | |
| 17. | 0.51 | 0.25 | 0.67 | 0.012 | 0.011 | - | 1.05 | 0.17 | 0.25 | 0.39 | <0.01 | |
| 18. | 27MnCrV4 | 0.24 | 0.21 | 1.06 | 0.014 | 0.020 | - | 0.79 | 0.17 | 0.02 | 0.18 | 0.10 |
| 19. | 0.24 | 0.20 | 1.06 | 0.014 | 0.019 | - | 0.68 | 0.17 | 0.02 | 0.18 | 0.07 | |
| 20. | 0.27 | 0.20 | 1.12 | 0.022 | 0.017 | - | 0.90 | 0.20 | 0.01 | 0.13 | 0.06 | |
| 21. | 0.27 | 0.15 | 1.19 | 0.013 | 0.021 | - | 0.85 | 0.21 | 0.03 | 0.15 | 0.11 | |
| 22. | 0.33 | 0.24 | 1.17 | 0.021 | 0.018 | - | 0.85 | 0.22 | 0.02 | 0.07 | 0.08 | |
| 23. | 42CrV6 | 0.42 | 0.26 | 0.60 | 0.020 | 0.005 | - | 1.64 | 0.20 | <0.01 | 0.13 | 0.08 |
| 24. | 50CrV4 | 0.47 | 0.35 | 1.04 | 0.032 | 0.012 | - | 1.20 | 0.16 | 0.05 | 0.05 | 0.12 |
| 25. | 0.49 | 0.23 | 0.82 | 0.018 | 0.018 | - | 1.03 | 0.14 | 0.03 | 0.11 | 0.07 | |
| 26. | 0.53 | 0.27 | 0.93 | 0.029 | 0.013 | - | 0.98 | 0.20 | 0.05 | 0.33 | 0.07 | |
| 27. | 0.55 | 0.22 | 0.98 | 0.017 | 0.013 | - | 1.02 | 0.07 | - | 0.01 | 0.11 | |
| 28. | 0.3%C, 3% Ni | 0.30 | 0.32 | 0.51 | 0.011 | 0.007 | 0.032 | 0.07 | - | - | 3.03 | <0.01 |
| 29. | 16MnCr5 | 0.16 | 0.22 | 1.12 | 0.030 | 0.008 | 0.015 | 0.99 | 0.22 | 0.02 | 0.12 | 0.01 |
| 30. | 0.19 | 0.25 | 1.26 | 0.013 | 0.013 | 0.014 | 0.97 | - | - | <0.01 | - | |
| 31. | 71Si7 | 0.73 | 1.62 | 0.73 | 0.019 | 0.012 | - | 0.10 | 0.19 | - | 0.12 | 0.01 |
| 32. | 0,2%C, 1.2%Mn, 1%Cu, 0.6 Ni | 0.20 | 0.38 | 1.20 | 0.039 | 0.024 | - | 0.06 | 0.91 | - | 0.55 | - |
| 33. | 0.2%C, 1%Mn, 1%Cu, 0.25%Mo, 0.8%Ni | 0.19 | 0.38 | 1.12 | 0.037 | 0.036 | - | 0.28 | 0.98 | 0.27 | 0.79 | - |
| 34. | 0.15%C, 1.2%Cr, 0.25%Ni, 0.3%V | 0.15 | 0.48 | 0.67 | 0.044 | 0.024 | - | 1.20 | 0.18 | - | 0.25 | 0.31 |
| 35. | 0.45%C, 2%Mn | 0.48 | 0.28 | 1.98 | 0.020 | 0.011 | - | - | - | - | - | - |
| 36. | 0.45%C, 3.5%Cr | 0.43 | 0.14 | 0.04 | 0.015 | 0.012 | 0.14 | 3.52 | - | - | - | - |
| 37. | 15CrNi6 | 0.13 | 0.31 | 0.51 | 0.023 | 0.009 | 0.010 | 1.50 | 0.22 | 0.06 | 1.55 | <0.01 |
| 38. | 0.16 | 0.28 | 0.43 | 0.010 | 0.008 | 0.005 | 1.58 | 0.20 | 0.006 | 1.54 | <0.01 | |
| 39. | 18CrNi8 | 0.15 | 0.13 | 0.60 | 0.014 | 0.008 | 0.030 | 1.94 | 0.21 | 0.06 | 2.02 | <0.01 |
| 40. | 0.20 | 0.20 | 0.60 | 0.021 | 0.010 | 0.010 | 2.07 | 0.21 | 0.01 | 1.90 | 0.01 | |
| 41. | 42CrMo4 | 0.38 | 0.18 | 0.62 | 0.033 | 0.023 | - | 1.03 | 0.28 | 0.21 | 0.22 | <0.01 |
| 42. | 0.38 | 0.23 | 0.64 | 0.019 | 0.013 | - | 0.99 | 0.17 | 0.16 | 0.08 | <0.01 | |
| 43. | 0.39 | 0.15 | 0.50 | 0.013 | 0.014 | - | 0.97 | 0.19 | 0.19 | 0.20 | <0.01 | |
| 44. | 0.40 | 0.30 | 0.65 | 0.016 | 0.014 | - | 1.10 | 0.22 | 0.21 | 0.42 | <0.01 | |
| 45. | 0.44 | 0.28 | 0.67 | 0.025 | 0.024 | - | 1.07 | 0.21 | 0.15 | 0.22 | <0.01 | |
Table A3.
The experimental data for prediction of martensite microstructure hardness, HVM.
| Data No. | Designation (DIN) | Carbon Concentration in Steel | Martensite Microstructure Hardness |
|---|---|---|---|
| % | HRC | ||
| 1. | Ck45 | 0.44 | 56.8 |
| 2. | 37MnSi5 | 0.34 | 53.7 |
| 3. | 0.38 | 56.9 | |
| 4. | 42MnV7 | 0.38 | 54.9 |
| 5. | 0.45 | 60.6 | |
| 6. | 34Cr4 | 0.30 | 52.5 |
| 7. | 0.37 | 54.0 | |
| 8. | 36Cr6 | 0.32 | 49.0 |
| 9. | 0.36 | 56.2 | |
| 10. | 25CrMo4 | 0.22 | 44.9 |
| 11. | 0.25 | 47.7 | |
| 12. | 34CrMo4 | 0.30 | 50.9 |
| 13. | 0.37 | 53.7 | |
| 14. | 50CrMo4 | 0.46 | 60.0 |
| 15. | 0.50 | 59.0 | |
| 16. | 0.50 | 60.0 | |
| 17. | 27MnCrV4 | 0.24 | 46.8 |
| 18. | 0.24 | 49.9 | |
| 19. | 0.27 | 44.3 | |
| 20. | 0.27 | 51.5 | |
| 21. | 0.33 | 54.0 | |
| 22. | 42CrV6 | 0.42 | 58.0 |
| 23. | 50CrV4 | 0.47 | 58.0 |
| 24. | 0.49 | 59.9 | |
| 25. | 0.53 | 60.1 | |
| 26. | 0.55 | 62.8 | |
| 27. | 16MnCr5 | 0.16 | 41.2 |
| 28. | 0.19 | 43.4 | |
| 29. | 15CrNi6 | 0.13 | 40.9 |
| 30. | 0.16 | 44.6 | |
| 31. | 18CrNi8 | 0.15 | 42.2 |
| 32. | 0.20 | 46.2 | |
| 33. | 42CrMo4 | 0.38 | 53.7 |
| 34. | 0.38 | 54.9 | |
| 35. | 0.39 | 56.8 | |
| 36. | 0.40 | 55.1 | |
| 37. | 0.44 | 57.4 |
Table A4.
The experimental data for prediction of bainite microstructure hardness, HVB.
| Data No. | Designation (DIN) | Carbon Concentration in Steel | Temperature of Isothermal Transformation | Bainite Microstructure Hardness |
|---|---|---|---|---|
| % | °C | HV | ||
| 1. | Ck45 | 0.44 | 455 | 316 |
| 2. | 400 | 420 | ||
| 3. | 37MnSi5 | 0.38 | 400 | 375 |
| 4. | 42MnV7 | 0.43 | 450 | 296 |
| 5. | 400 | 382 | ||
| 6. | 345 | 473 | ||
| 7. | 34Cr4 | 0.35 | 472 | 296 |
| 8. | 405 | 350 | ||
| 9. | 41Cr4 | 0.44 | 400 | 375 |
| 10. | 36Cr6 | 0.36 | 415 | 375 |
| 11. | 372 | 437 | ||
| 12. | 25CrMo4 | 0.22 | 405 | 316 |
| 13. | 34CrMo4 | 0.30 | 478 | 235 |
| 14. | 433 | 327 | ||
| 15. | 400 | 363 | ||
| 16. | 50CrMo4 | 0.50 | 400 | 389 |
| 17. | 27MnCrV4 | 0.24 | 420 | 270 |
| 18. | 42CrV6 | 0.44 | 386 | 496 |
| 19. | 330 | 575 | ||
| 20. | 50CrV4 | 0.55 | 425 | 363 |
| 21. | 390 | 437 | ||
| 22. | 50CrV4 | 0.47 | 390 | 389 |
| 23. | 50CrV4 | 0.47 | 400 | 389 |
| 24. | 350 | 473 | ||
| 25. | 0.3%C, 3%Ni | 0.30 | 400 | 303 |
| 26. | 16MnCr5 | 0.16 | 460 | 368 |
| 27. | 71Si7 | 0.73 | 310 | 576 |
| 28. | 0.2%C, 1.2%Mn, 1%Cu, 0.6%Ni | 0.20 | 475 | 229 |
| 29. | 0.2%C, 1%Mn, 1%Cu, 0.25%Mo, 0.8%Ni | 0.19 | 480 | 267 |
| 30. | 0.15%C, 1.2%Cr, 0.25%Ni, 0.3%V | 0.15 | 475 | 323 |
| 31. | 0.45%C, 2%Mn | 0.48 | 380 | 389 |
| 32. | 0.45%C, 3.5%Cr | 0.43 | 395 | 429 |
| 33. | 42CrMo4 | 0.38 | 400 | 339 |
References
- Brooks, C.R. Principles of the Heat Treatment of Plain Carbon and Low-Alloy Steels; ASM International: Materials Park, OH, USA, 1996; pp. 87–128. [Google Scholar]
- Şimşir, C.; Gür, C.H. Simulation of Quenching. In Handbook of Thermal Process Modeling of Steels; Gür, C.H., Pan, J., Eds.; CRC Press, Taylor & Francis Group: Boca Raton, FL, USA, 2009; pp. 341–425. [Google Scholar]
- Wang, Q.; Ye, Q.; Wang, Z.; Kan, L.; Wang, H. Thickness Effect on Microstructure, Strength, and Toughness of a Quenched and Tempered 178 mm Thickness Steel Plate. Metals 2020, 10, 572. [Google Scholar] [CrossRef]
- Wu, T.; Wu, R.; Liu, B.; Liang, W.; Ke, D. Enhancing the Mechanical Properties of a Hot Rolled High-Strength Steel Produced by Ultra-Fast Cooling and Q&P Process. Metals 2019, 9, 958. [Google Scholar] [CrossRef] [Green Version]
- Zhang, L.; Gong, D.; Li, Y.; Wang, X.; Ren, X.; Wang, E. Effect of Quenching Conditions on the Microstructure and Mechanical Properties of 51CrV4 Spring Steel. Metals 2018, 8, 1056. [Google Scholar] [CrossRef] [Green Version]
- Hannula, J.; Porter, D.; Kaijalainen, A.; Somani, M.; Kömi, J. Mechanical Properties of Direct-Quenched Ultra-High-Strength Steel Alloyed with Molybdenum and Niobium. Metals 2019, 9, 350. [Google Scholar] [CrossRef] [Green Version]
- Ritchie, R.O.; Knott, J.F. Mechanisms of fatigue crack growth in low alloy steel. Acta Metall. 1973, 21, 639–648. [Google Scholar] [CrossRef]
- Irving, P.E.; Kurzfeld, A. Measurements of intergranular failure produced during fatigue crack growth in quenched and tempered steels. Met. Sci. 1978, 12, 495–502. [Google Scholar] [CrossRef]
- Denis, S.; Archambault, P.; Gautier, E.; Simon, A.; Beck, G. Prediction of residual stress and distortion of ferrous and non-ferrous metals: Current status and future developments. J. Mater. Eng. Perform. 2002, 11, 92–102. [Google Scholar] [CrossRef]
- Hasan, M.F. Analysis of Mechanical Behavior and Microstructural Characteristics Change of ASTM A-36 Steel Applying Various Heat Treatment. J. Mater. Sci. Eng. 2016, 5. [Google Scholar] [CrossRef] [Green Version]
- Smoljan, B.; Iljkić, D.; Totten, G.E. Mathematical Modeling and Simulation of Hardness of Quenched and Tempered Steel. Metall. Mater. Trans. B 2015, 46, 2666–2673. [Google Scholar] [CrossRef]
- Cahoon, J.R.; Broughton, W.H.; Kutzak, A.R. The determination of yield strength from hardness measurements. Metall. Trans. 1971, 2, 1979–1983. [Google Scholar] [CrossRef]
- Bain, E.C. Functions of the Alloying Elements in Steel; American Society for Metals: Cleveland, OH, USA, 1939. [Google Scholar]
- Krauss, G. Steels: Heat Treatment and Processing Principles, 2nd ed.; ASM International: Materials Park, OH, USA, 1990; pp. 1–16. [Google Scholar]
- Sverdlin, A.V.; Ness, A.R. Fundamental Concepts in Steel Heat Treatment. In Steel Heat Treatment: Metallurgy and Technologies, 2nd ed.; Totten, G.E., Ed.; CRC Press, Tylor & Francis Group: Boca Raton, FL, USA, 2007; pp. 121–164. [Google Scholar]
- Colpaert, H. Metallography of Steel–Interpretation of Structure and the Effects of Processing; ASM International: Materials Park, OH, USA, 2018; pp. 193–352. [Google Scholar]
- Kurdjumow, G.; Sachs, G. Über den Mechanismus der Stahlhärtung. Zeitschrift für Physik 1930, 64, 325–343. [Google Scholar] [CrossRef]
- Nishiyama, Z. X-ray Investigation of the Mechanism of the Transformation from Face-Centred Cubic Lattice to Body-Centred Cubic. Sci. Rep. Tohoku Univ. 1934, 23, 637–664. [Google Scholar]
- Olson, G.B.; Cohen, M. A general mechanism of martensitic nucleation: Part II. FCC → BCC and other martensitic transformations. Metall. Trans. A 1976, 7, 1905–1914. [Google Scholar] [CrossRef]
- Christian, J.W. The Theory of Transformation in Metals and Alloys: Part 2, 3rd ed.; Pergamon Press, Elsevier Science: Amsterdam, The Netherlands, 2002. [Google Scholar]
- Bhadeshia, H.K.D.H. Bainite in Steels: Transformations, Microstructure and Properties, 2nd ed.; IOM Communications: London, UK, 2001. [Google Scholar]
- Spies, H.-J. Mechanical Properties of Ferrous and Nonferrous Alloys after Quenching. In Quenching Theory and Technology, 2nd ed.; Liscic, B., Tensi, H.M., Canale, L.C.F., Totten, G.E., Eds.; CRC Press, Taylor & Francis Group: Boca Raton, FL, USA, 2010; pp. 105–127. [Google Scholar]
- Qiu, Y.; Xin, R.; Luo, J.; Ma, Q. The Effects of Homogenizing and Quenching and Tempering Treatments on Crack Healing. Metals 2020, 10, 427. [Google Scholar] [CrossRef] [Green Version]
- De Moor, E.; Lacroix, S.; Clarke, A.J.; Penning, J.; Speer, J.G. Effect of Retained Austenite Stabilized via Quench and Partitioning on the Strain Hardening of Martensitic Steels. Metall. Mater. Trans. A 2008, 39, 2586–2595. [Google Scholar] [CrossRef]
- Abbasi, F.; Fletcher, A.J. Effect of transformation plasticity on generation of thermal stress and strain in quenched steel plates. Mater. Sci. Technol. 1985, 1, 830–837. [Google Scholar] [CrossRef]
- Sjöström, S. Interactions and constitutive models for calculating quench stresses in steel. Mater. Sci. Technol. 1985, 1, 823–829. [Google Scholar] [CrossRef]
- Tomita, Y. Effect of microstructure on plane-strain fracture toughness of AISI 4340 steel. Metall. Trans. A 1988, 19, 2513–2521. [Google Scholar] [CrossRef]
- Dieter, G.E. Mechanical Metallurgy, 2nd ed.; McGraw-Hill Series in Materials Science and Engineering; McGraw-Hill: Tokyo, Japan, 1976; pp. 232–235. [Google Scholar]
- Bowen, R.M. Theory of Mixture. Contin. Phys. 1976, 3, 2–129. [Google Scholar]
- Franceschi, M.; Pezzato, L.; Gennari, C.; Fabrizi, A.; Polyakova, M.; Konstantinov, D.; Brunelli, K.; Dabalà, M. Effect of Intercritical Annealing and Austempering on the Microstructure and Mechanical Properties of a High Silicon Manganese Steel. Metals 2020, 10, 1448. [Google Scholar] [CrossRef]
- Rose, A.; Hougardy, H. Atlas zur Wärmebehandlung der Stähle; Verlag Stahleisen: Düsseldorf, Germany, 1972. [Google Scholar]
Figure 1.
Characteristic phase concentrations during the bainite transformation.

Figure 2.
Hardness of ferrite-pearlite microstructure: Experiment vs. model. (correlation coefficient: R = 0.8694).
Figure 2.
Hardness of ferrite-pearlite microstructure: Experiment vs. model. (correlation coefficient: R = 0.8694).

Figure 3.
Hardness of martensite microstructure: Experiment vs. model (R = 0.9665).

Figure 4.
Hardness of bainite microstructure: Experiment vs. model (R = 0.7222).

Figure 5.
Hardness of hypoeutectoid steels: Experiment vs. model.

Table 1.
Characteristic coefficients for prediction of hardness of microstructure constituents.
| Ferrite, Equation (3) | Pearlite, Equation (1) | Martensite, Equation (5) | Bainite, Equation (8) | |||||
|---|---|---|---|---|---|---|---|---|
| aF | a0P | a1P | a2P | a0M | a1M | a0B | a1B | a2B |
| 83.50 | 116.34 | 279.61 | 8.63 | 19.51 | 57.58 | 26.35 | 1.02 | 0.40 |
Publisher’s Note: MDPI stays neutral with regard to jurisdictional claims in published maps and institutional affiliations. |
© 2021 by the authors. Licensee MDPI, Basel, Switzerland. This article is an open access article distributed under the terms and conditions of the Creative Commons Attribution (CC BY) license (http://creativecommons.org/licenses/by/4.0/).
Share and Cite
MDPI and ACS Style
Smokvina Hanza, S.; Smoljan, B.; Štic, L.; Hajdek, K. Prediction of Microstructure Constituents’ Hardness after the Isothermal Decomposition of Austenite. Metals 2021, 11, 180. https://doi.org/10.3390/met11020180
AMA Style
Smokvina Hanza S, Smoljan B, Štic L, Hajdek K. Prediction of Microstructure Constituents’ Hardness after the Isothermal Decomposition of Austenite. Metals. 2021; 11(2):180. https://doi.org/10.3390/met11020180
Chicago/Turabian StyleSmokvina Hanza, Sunčana, Božo Smoljan, Lovro Štic, and Krunoslav Hajdek. 2021. "Prediction of Microstructure Constituents’ Hardness after the Isothermal Decomposition of Austenite" Metals 11, no. 2: 180. https://doi.org/10.3390/met11020180
Note that from the first issue of 2016, this journal uses article numbers instead of page numbers. See further details here.